 Lianlong Yu1
 Pengkun Song1,2
 Qianrang Zhu1Yuqian Li1Shanshan Jia1
 Shixiu Zhang3
 Zhihong Wang1Jian Zhang1*
- 1National Institute for Nutrition and Health, Chinese Center for Disease Control and Prevention, Beijing, China
- 2NHC Key Laboratory of Trace Element Nutrition, National Institute for Nutrition and Health, Chinese Center for Disease Control and Prevention, Beijing, China
- 3Department of Nutrition and Food Hygiene, School of Public Health, Cheeloo College of Medicine, Shandong University, Jinan, China
Background: The situation is grim for the prevention and control of type 2 diabetes (T2D) and prediabetes in China. Serum and dietary branched-chain amino acids (BCAAs) were risk factors for T2D. However, there is a lack of information on trends in consumption of BCAAs and the risk of T2D associated with BCAAs intake, based on nationally representative data in China. Thus, we aimed to comprehensively describe the dietary BCAAs transition and risk of T2D, at a national level among Chinese adults from 1997 to 2015.
Methods: The data sources were the China Health and Nutrition Survey (CHNS) and China Nutrition and Health Survey (CNHS). Cross-sectional data on intake were obtained from CHNS (1997, n = 9,404), CHNS (2000, n = 10,291), CHNS (2004, n = 9,682), CHNS (2006, n = 9,553), CHNS (2009, n = 9,811), CHNS (2011, n = 12,686) and CNHS (2015, n = 71,695). Prospective cohort data were obtained CHNS (1997–2015, n = 15,508).
Results: From 1997 to 2015, there was a significant decreasing trend in the BCAAs intake of Chinese adults in all subgroups (P < 0.0001) except for Leu in 80 or older, and a decreasing trend in the consumption of BCAAs after 40 years old (P < 0.05). The mean intake of BCAAs in the population of cohort study was 11.83 ± 3.77g/day. The 95% CI was above the HR of 1.0, when the consumptions were higher than 14.01, 3.75, 6.07, 4.21 g/day in BCAAs, Ile, Leu and Val, based on RCS curves. According to the Cox proportional hazards models, Compared with individuals with BCAAs consumption of 10.65–12.37 g/day, the multivariable-adjusted HR for diabetes was 2.26 (95% CI 1.45 to 3.51) for individuals with consumption of BCAAs more than 18.52 g/day. A statistically significant positive association between BCAAs intake and risk of T2D was observed in males or participants aged 45 years and older, but not in females or participants younger than 45 years.
Conclusion: Our results reveal a trend toward decreased BCAAs intake in Chinese from 1997 to 2015. After 40 years of age, consumption of BCAAs declined with increasing age. Higher BCAAs intake was associated with higher risk of T2D. This relationship is more stable among men and middle-aged and elderly people.
Introduction
Branched-chain amino acids (BCAAs), including leucine (Leu), isoleucine (Ile), and valine (Val), are essential amino acids for mammals (1) and are supplied considerably from diet. Previous studies have shown that the main food sources of BCAAs in the US population were meat (37%), milk (12%), and fish (8%), while in the Japanese population the main contributors were cereals, potatoes and starches (23–25%), fish and shellfish (21–23%) and meat (14–15%) (2). BCAAs were critical components of dietary protein. Elevations in branched-chain amino acids (BCAAs) associated with numerous systemic diseases, including cancer, type 2 diabetes (T2D), and heart failure (3). Reports since the 1960's have noted that elevations in circulating BCAAs tightly associate with insulin resistance (4).
The prevalence of diabetes in China has increased dramatically in the past two decades (5, 6). Elevated plasma branched chain amino acids (BCAAs) has been implicated in development of insulin resistance and T2D. However, whether consumption of BCAAs contribute to the disease is controversial. Some studies have shown that high intake of BCAAs is associated with an increased risk of T2D (2, 7, 8) and may have adverse effects on the development of IR (9). On the contrary, a study from a Japanese population reported that high intake of BCAAs may be associated with reduced diabetes risk (10). Research in this area has remained relatively limited. Thus, the association between dietary BCAAs and the risk of T2D in Chinese adults is unclear. Also, the quantity of BCAAs intake causing risk of T2D is not clearly defined. It could have significant clinical and public health implications that finding out exact BCAAs consumption threshold values of developing diabetes.
In the past few decades, dietary structure and food intakes of Chinese have undergone substantial changes (11). However, there is a lack of information on trends in BCAAs consumption and the risk of T2D associated with BCAAs intake, based on nationally representative data. Using data from 1997 to 2015 China Health and Nutrition Survey (CHNS) and China Nutrition and Health Survey (CNHS), the current study was aimed to systematically describe the changes in dietary BCAAs intake in Chinese adults from 1997 to 2015 and the risk of T2D caused by BCAAs intake.
Methods
Study Population
All datasets used in this study were from two independent national project, CHNS and CNHS. CHNS was an international collaborative project cohosted by the Carolina Population Center at the University of North Carolina at Chapel Hill and the National Institute for Nutrition and Health (NINH) at Chinese Center for Disease Control and Prevention (CCDC), which aimed to examine the effects of the healthand nutrition. CNHS was a national survey conducted by the CCDC to survey the national health and nutrition status. The sampling method, dietary survey method, anthropometric measurement method, and quality control method of CNHS are almost identical to those of CHNS in terms of cross-section. The provincial staff for both projects are the same team. The core structure of the two surveys is the same in terms of cross-section. Both projects used stratified, multistage, random cluster sampling method, and further detailed information could be referred elsewhere (12, 13).
In the dietary BCAA transition trend analysis, seven cross-sectional data were obtained from CHNS (1997), CHNS (2000), CHNS (2004), CHNS (2006), CHNS (2009), CHNS (2011) and CNHS (2015). Data were included for analysis if dietary intake records were available and the age of the study object was 18 years or older at the time of survey. And data of 9,404, 10,291, 9,682, 9,553, 9,811, 12,686 and 71,695 participants in 1997, 2000, 2004, 2006, 2009, 2011, and 2015 were used for analysis, respectively.
In the BCAAs risk analysis, prospective cohort data were extracted from CHNS (1997–2015). Participants diagnosed with diabetes at baseline, those aged <18 years, and those without dietary records were excluded for analysis, and 15,508 participants with 9.9 ± 5.6 (mean ± SD) follow-up years were finally included for analysis.
Dietary BCAA Intake Assessment
BCAAs intake were calculated from 24-h dietary recall records and household condiment weighing records for three consecutive days (2 working days and 1 weekend). All field staff are professionally trained nutritionists who work in nutrition in their own county. BCAAs intakes was estimated by multiplying the consumed grams of each food by the amino acid contents of each food (referred from Chinese Food Composition Tables) (14–16) before BCAAs intake for all food items was summed by individual.
In the BCAA risk analysis, dietary exposure to BCAAs were calculated by using the average BCAAs intake values in each record before the onset of diabetes.
Identification of the New-Onset Diabetes
Since 1997, participants have been asked to report their previous diabetes history in the form of questionnaire interviews at each follow-up. Three questions were used to identify the new onset diabetes in the CHNS project: (1) Have the doctor told you that you suffer from type 2 diabetes? (2) How old (age) were you when this happened? (3) Have you used the following treatment methods, such as special diet, weight control, oral medication, insulin injection, Chinese medicine, etc.? The diagnosis of T2D was based on patient-reported physicians' diagnoses and/or the presence of diabetes-specific medication.
Statistical Analysis
We provided the demographic characteristics of each survey year. We also calculated the mean (SD) of dietary BCAAs by sex, age group and urban/rural status. A generalized linear model was used to test trends for consumption of BCAAs from 1997 to 2015, adjusting for sex, age, BMI and region. Heatmaps were generated and clustered using hierarchical clustering. For the comparison between the two groups, t-test was applied in Figure 1K, and generalized linear model was used in Table 4.
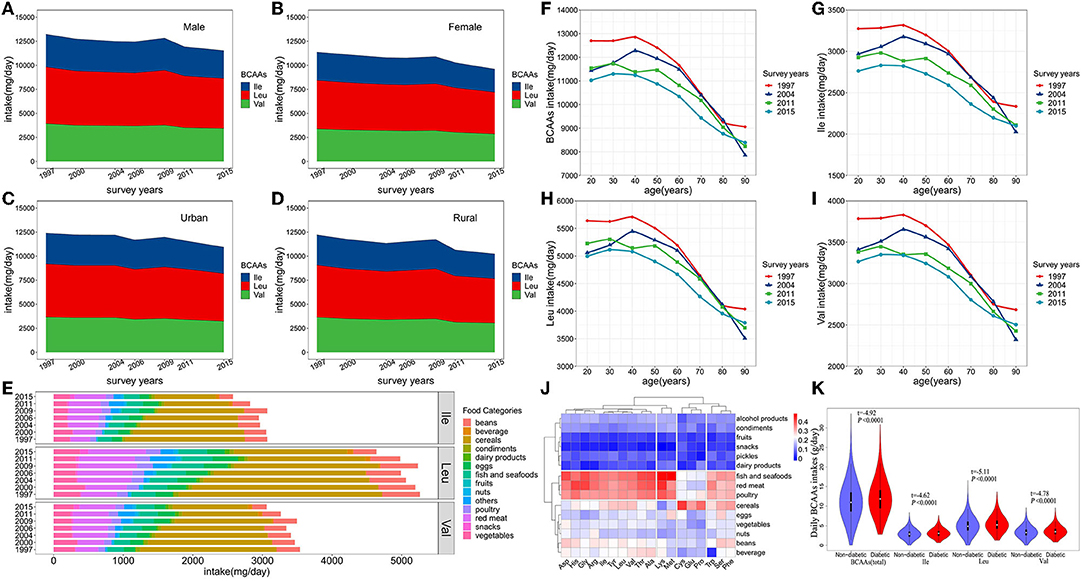
Figure 1. (A–D) Trends in consumption of BCAAs and food sources from 1997 to 2015. P value for the trend, P < 0.0001 (Male, Female, Urban, Rural). (E) Food sources of dietary BCAAs. (F–I) Average daily BCAAs (Ile, Leu and Val) intakes in adults (aged 18–90 years) during 1997-2015. (J) Clustering and correlation heat map between dietary amino acids and food categories. (K) Comparison of BCAAs intakes between the diabetic onset group and non-onset group in the cohort.
Based on the Cox proportional hazard model, a restricted cubic spline (RCS) curve was used to assess the association between dietary BCAAs levels and T2D risk on a continuous scale. In the statistical analyses, we adjusted for age, sex, energy intake, BMI, region, smoking status (previous or present, never), alcohol consumption (yes, no), which were well known risk factors for diabetes. In the Cox proportional hazards models, participants with previously diagnosed diabetes, were excluded when first entry into the survey. To balance best fit and overfitting in the main splines for incident diabetes, the number of knots, between three and six, was chosen as the lowest value for the Akaike information criterion, but if within two of each other for different knots, the lowest number of knots was chosen (17). In the non-linearity test, P < 0.1 was considered statistically significant for data exploration and visualization. Otherwise, two-sided significance tests were used throughout, and a two-sided P < 0.05 was considered statistically significant. All analyses were conducted using SAS software, version 9.4 (SAS Institute, Cary, NC) and R software, version 4.1.2.
Patient and Public Involvement
Participants were not involved in setting the research question or the outcome measures, nor were they involved in the design or implementation of the study. No participants were asked to advise on interpretation or writing of the manuscript.
Results
From 1997 to 2015, the number of participants in the survey increased from 9,404 to 71,695, and the proportion of the elderly and urban residents continued to increase, reflecting increasing trends of aging and urbanization in China (Table 1). From 1997 to 2015, there was a significant decreasing trend in the BCAAs intake of Chinese adults in all subgroups (including the type of BCAAs, age subgroups, sex and urbanization status) (P < 0.0001) except for Leu in 80 or older, and a decreasing trend in the consumption of BCAAs after 40 years old (P < 0.05) (Table 2; Figure 1). From 1997 to 2015, cereals continued to be the first primary source for dietary BCAA intake, but the proportion of its contribute decreased from 55.6% to 34.9%. Similarly, beans decreased from 10.1 to 7.2%. In contrast, the percent contribution of red meat increased from 9.5 to 17.5%. In addition, the contribution of fish and seafoods increased from 6.5 to 8.6%, and eggs increased from 4.7 to 5.4%.
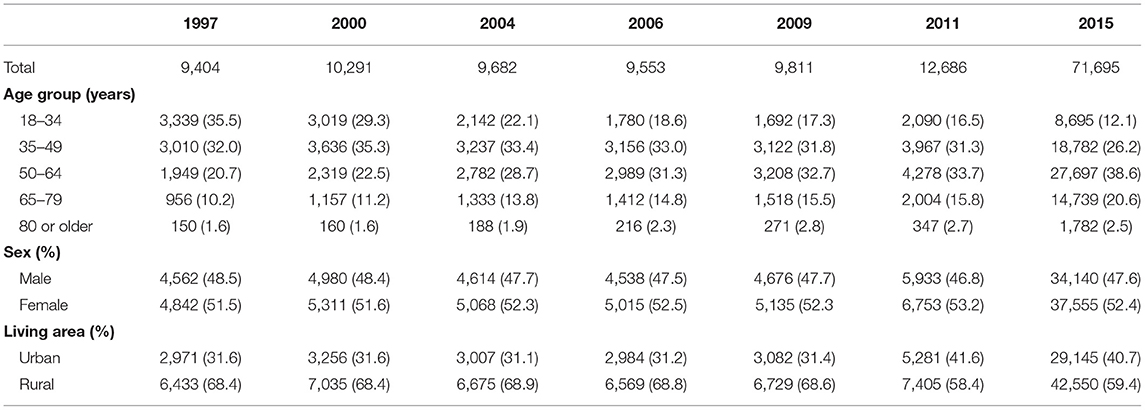
Table 1. Sociodemographic distribution of participants in the 1997962015.
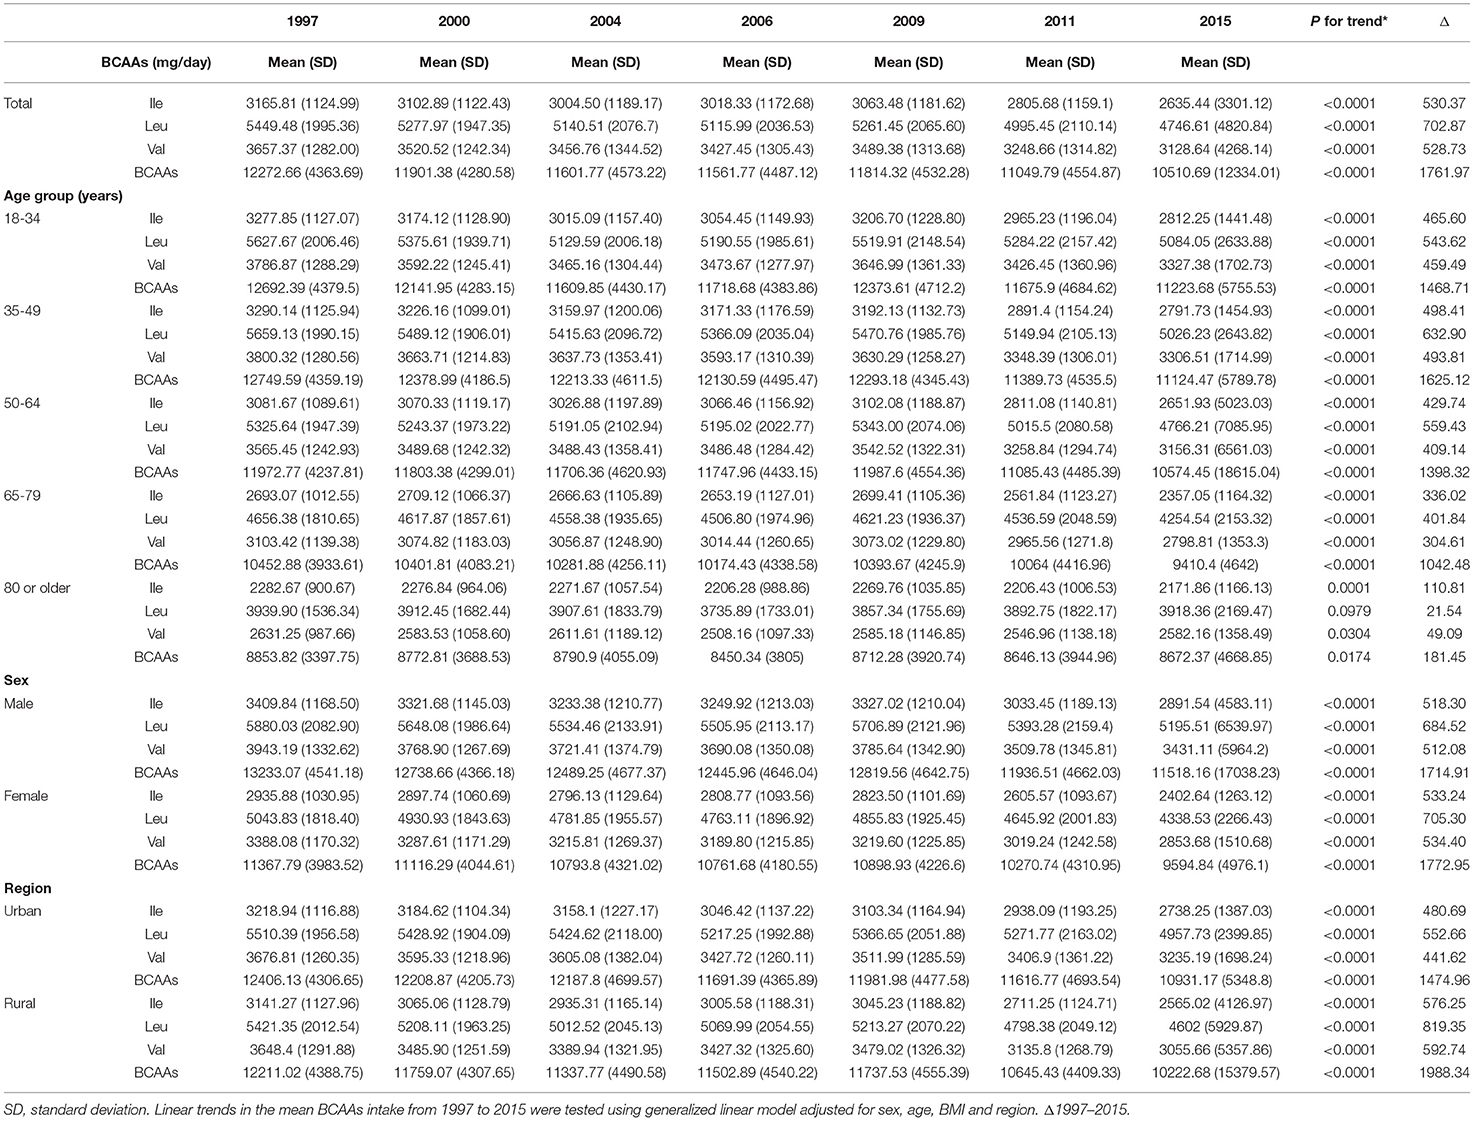
Table 2. Trends in mean BCAAs intake among Chinese adults from 1997962015.
As shown in Figure 1J, the types of food were clustered into three major groups. Fish and seafoods, red meat and poultry were clustered into one category. Cereals, eggs, vegetables, nuts, beans, and beverages were clustered into one category. Additionally, alcohol products, condiments, fruits, snacks, pickles and dairy products were clustered into one category. Dietary BCAAs (Leu, Ile, and Val) were clustered together with aspartate (Asp), histidine (His), glycine (Gly), arginine (Arg), threonine (Thr) and alanine (Ala). Furthermore, the top 4 types of food, exhibiting the strongest correlation with dietary BCAAs, were fish and seafoods, red meat, poultry and cereals.
At the endpoint of observation, mean BCAAs intake was higher in participants with new-onset diabetes onset than in non-diabetic participants (t = −4.92, P < 0.0001) (Figure 1K). The same phenomenon were also observed in Ile (t = −4.62, P < 0.0001), Leu (t = −5.11, P < 0.0001) and Val (t = −4.78, P < 0.0001).
The mean intake of BCAAs in the population of cohort study was 11.83 ± 3.77 g/day (Table 3). The impact of dietary BCAA intake on risk of T2D was shown in Figure 2. The consumption of BCAAs and risk of T2D was U-shape-associated and higher dietary BCAAs (≥ 14.01 g/day) increased the risk of T2D. When upon a closer look, higher intake of each BCAA also increased the risk of T2D (Figure 2). The 95% confidence interval (CI) was above the HR of 1.0, when the consumptions were higher than 14.01, 3.75, 6.07, 4.21 g/day in BCAAs, Ile, Leu and Val. Those with higher dietary BCAAs (Group B ≥ 14.01 vs. Group A < 14.01 g/day) also consumed more food in amounts (1616.96 ± 755.83 vs. 1244.92 ± 524.68 g/day, P < 0.0001) (Table 4). The average food intake of group A was 1244.92 (95% reference value 216.55 to 2273.29) g/day.

Table 3. Baseline characteristics of 15,508 individuals in the CHNS Study.
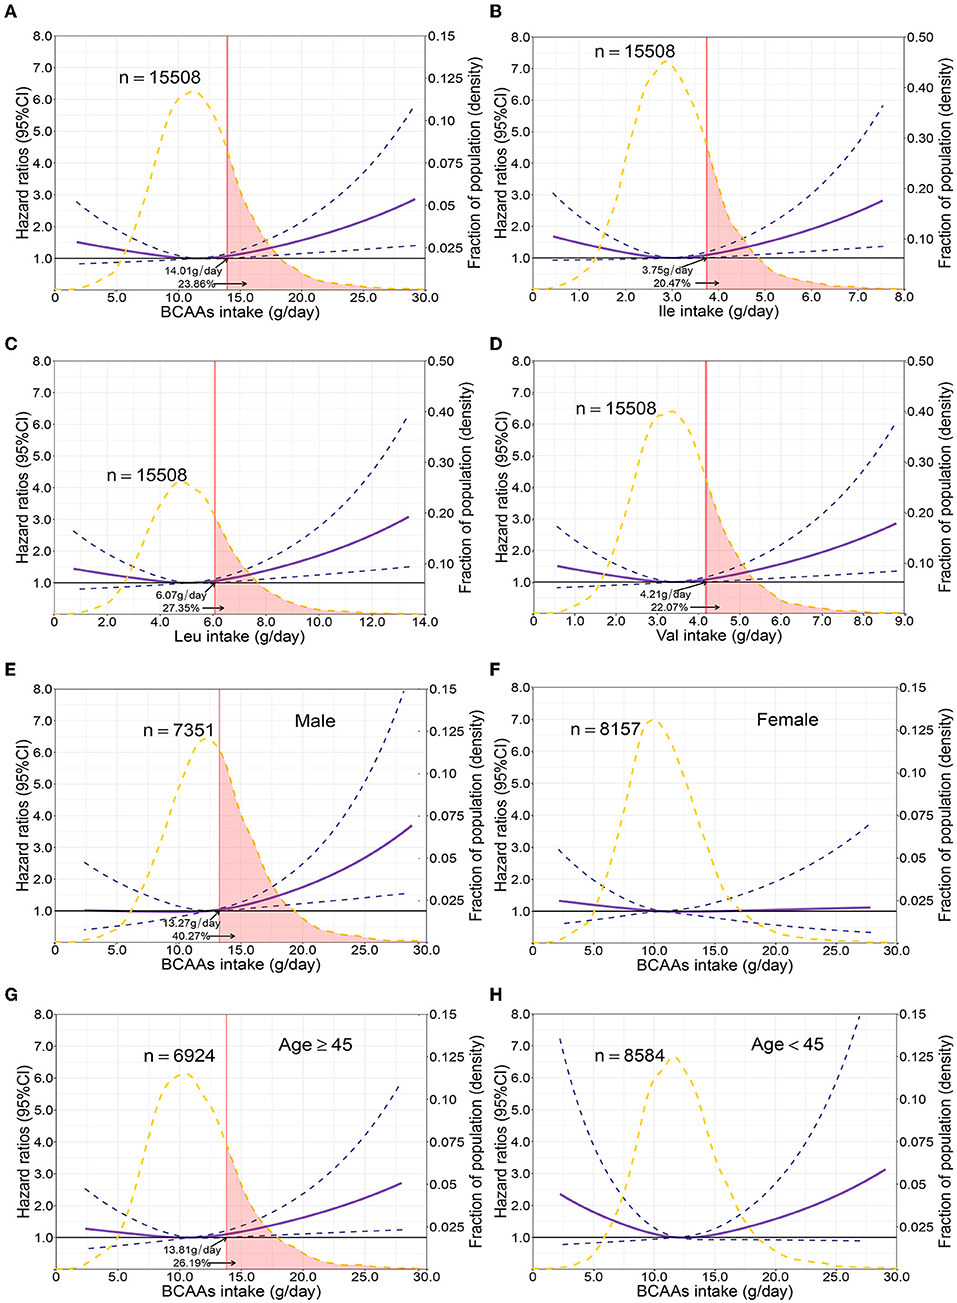
Figure 2. Multivariable adjusted hazard ratios of incident type 2 diabetes according to levels of BCAAs consumption on a continuous scale in the overall population. Solid blue lines are multivariable adjusted hazard ratios, with dashed blues lines showing 95% confidence intervals derived from restricted cubic spline regressions with three knots. Reference lines for no association are indicated by solid bold lines at a hazard ratio of 1.0. Dashed yellow curves show fraction of population with different levels of BCAAs intake. Arrows indicate the lowest consumption of BCAAs and fraction of population with risk of T2D. Analyses were adjusted for age, sex, smoking status, alcohol consumption, BMI, physical activity levels and energy intake at baseline. Based on individuals from the CHNS followed for a mean 9.9 years. (A–D) Representation of restricted cubic spline cox regression models for dietary BCAAs, Ile, Leu, Val and risk of type 2 diabetes. (E–H) Representation of restricted cubic spline cox regression models for dietary BCAAs and risk of type 2 diabetes in different age and gender subgroups.

Table 4. Differences in diet with upper and lower thresholds of BCAAs.
Compared with individuals with BCAAs consumption of 10.65–12.37 g/day, the multivariable-adjusted HR for diabetes was 2.26 (95% CI 1.45 to 3.51) for individuals with consumption of BCAAs more than 18.52 g/day (Table 5). The same trends were found in Ile and Leu, except for Val. The results were unaffected by multivariable adjustments in BCAAs, Ile and Leu.
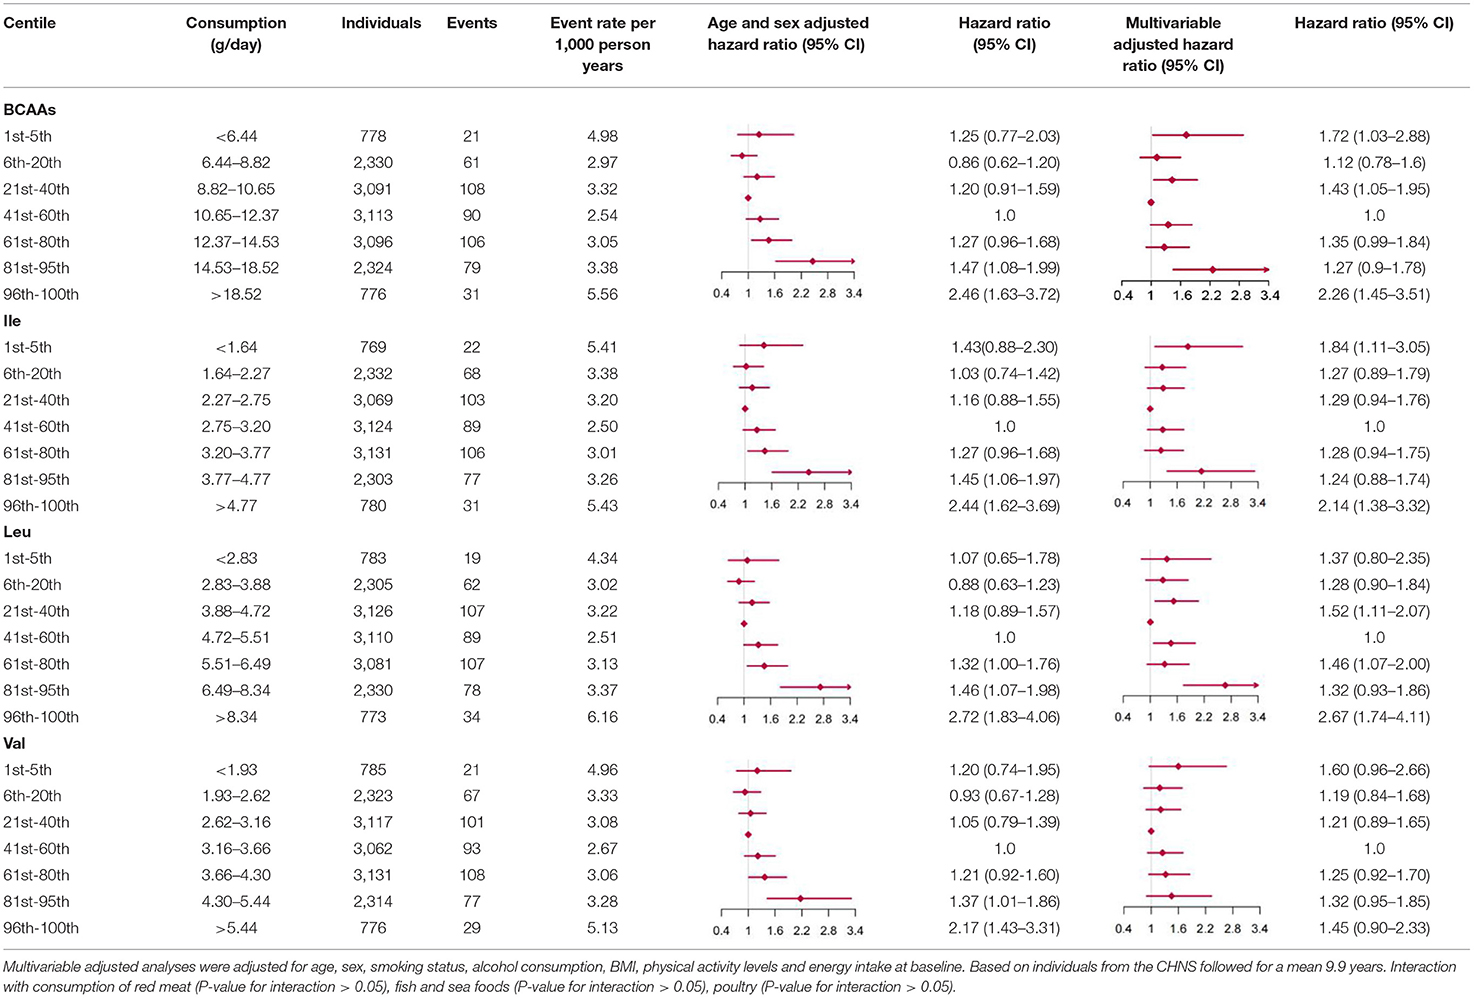
Table 5. Hazard ratios for incident type 2 diabetes according to categories of levels of BCAAs (Ile, Leu, Val) intake, sex and age adjusted, and multivariable adjusted.
Sensitivity Analyses
When fractional polynomials was applied, the U-shaped association between dietary BCAAs intake and T2D risk also exist, and the BCAAs consumption cut-off that increased the T2D risk was 18.52 g/day (Table 5). When further stratified by sex and age, the association between the two was unaltered in men or in participants aged 45 years and older. However, the association between BCAAs intake and risk of T2D diminished in females or in participants younger than 45 years (Figures 2E–H).
Discussion
Using seven large-scale nationally representative survey data, a decreasing trend in dietary BCAAs intake was observed in the study population at all ages from 1997 to 2015. Consumption of BCAAs also declined as age increased for those aged 40 years older. In all food categories, the strongest correlations with BCAAs were with red meat, poultry, fish and seafoods. And the risk analysis showed that increased BCAAs intake was associated with an elevated risk of T2D. This association was more stable among men and among people with middle-age and elder. The people with risk of T2D accounted for about 23.86% of the total population due to BCAAs.
To the best of our knowledge, this is the largest study including the most recent national survey data to first address the dietary BCAA intake trend and its risk on T2D. The reliability of our result could be guaranteed by the strict quality control of the CHNS and CNHS, including standardized protocols, standardized data collection procedures and standardized training of the field working stuff. This study contributes to the discovery of the relationship between dietary BCAAs and chronic diseases in the Chinese population.
The declines in BCAAs intake may well have contributed to the declining T2D morbidity. According to a recent study, the incidence of diabetes decreased from 2007 to 2017 in both men and women in China (18). And, the trend in consumption of BCAAs paralleled with the decreased trend of T2D incidence, which reduced by 14.36% from 1997 to 2015 in the adult population (Table 2). The declined BCAAs intake reflected changes of society and behavioral lifestyle in China. Accompanying with the decreasing BCAAs consumption, it was also observed that energy and protein intake decreased substantially from 1992 to 2012 among Chinese adults (11). One possible reason for these declines could be decreased physical activity. In China, although leisure-time physical activity have generally increased since 2000 (19), total physical activity have dropped sharply from 1991 to 2009 (20), and classical literatures showed a J-shaped relationship between physical activity and energy intake (21, 22). However, physical activity was also inversely related to incident diabetes (23). Still, the age-standardized incidence rates of diabetes subsequently decreased from 2007 to 2017 (18).
In dietary BCAA risk analysis of the cohort, increased dietary BCAAs intake was associated with an elevated risk of T2D. Men and older people were more sensitive to the risk of diabetes caused by BCAAs. The conclusions reached in this study were similar to previous studies in the US and northeastern China (2, 7, 8). In the prospective cohort study of United States, HR of diabetes for the highest quintile of BCAAs intake compared with the lowest quintile were 1.13 (95%CI, 1.07–1.19, P < 0.001) in leucine, 1.13 (95%CI, 1.07–1.19, P < 0.001) in isoleucine and 1.11 (95%CI, 1.05–1.17, P < 0.001) in valine (2). In Harbin, China and the American population, it has been observed that higher dietary BCAA intake will promote the risk of T2D. The Harbin population study showed that the OR and 95% CI across quartiles of total BCAA intakes for T2D within the 4th quartile were 1.0, 1.337 (0.940–1.903); 1.579 (1.065–2.343); 2.412 (1.474–3.947) (8). In a meta-analysis study, higher total intake of BCAAs causes increased T2DM risk with an OR and 95% CI of 1.32 (1.14, 1.53) (24). However, the results may seem in contrast to the study from Japan (10). The Japanese study showed that increased intake of BCAAs may be associated with a reduced risk of diabetes. The HR between the highest tertile and the lowest tertile was 0.70 (95% CI: 0.48–1.02; P for trend = 0.06). In that study, total BCAA, leucine and valine intakes were inversely associated with T2D risk in women, and no associations were found in men. Studies have shown that dietary BCAAs affect human metabolism and the risk of chronic diseases (25). A study of young people in northern China showed that a higher dietary BCAA ratio was negatively correlated with postprandial blood glucose (26). Reducing the intake of dietary BCAAs can improve glucose tolerance and body composition (27, 28). Although studies have shown that dietary BCAAs were closely related to multiple chronic diseases, this paper bridges a gap in large cohort studies of representative populations of Chinese.
Of serum BCAAs levels, 80% were determined by protein or BCAAs from diet or supplements, and the remaining 20% are related to their catabolites (29, 30). Studies have shown that oral BCAAs supplementation can affect the leucine content in blood circulation. The relationship between serum BCAAs levels and the occurrence and development of chronic diseases were well established. Studies have found that elevated levels of serum BCAAs are closely related to weight gain, insulin resistance, and abnormal glucose metabolism in adults (31, 32). Animal experiments have shown that in non-obesity, insulin resistance, and fructose-fed rat models, elevated serum BCAA levels were associated with insulin resistance (33). Previous studies also showed higher plasma levels of BCAAs were associated with an increased risk of T2D (34, 35). Prospective population studies have proved that serum BCAA levels can predict the future risk of diabetes (36). In patients with overweight and metabolic syndrome, there was also a correlation between plasma BCAA levels and red meat or animal protein (37). Therefore, control of serum BCAAs can start from dietary BCAAs intake. Our results link dietary BCAAs with population health, especially the risk of diabetes. In this study, group B (BCAAs ≥ 14.01 g/day) was significantly higher than group A (BCAAs < 14.01 g/day) in total food intake and most food categories (P < 0.0001), (Table 4). From this point of view, high consumption of BCAAs is accompanied by high consumption of food. Our results are in accordance with a recent study. When the quantity of food intake exceeded certain thresholds, the risks of new-onset diabetes increased or reached a plateau (38).
In all food categories, the strongest correlations with BCAAs were with red meat, poultry, fish and seafoods. Our research found that although BCAA intake is decreasing, sources have changed over time. Now animal sources are main sources and previously cereals. Meanwhile, there was also a correlation between plasma BCAA levels and red meat or animal protein (37). A similar phenomenon was also found in the Brazilian population that the main food sources of BCAA were unprocessed red meat, unprocessed poultry, bread and toast, beans and rice (39). Epidemiological studies have shown that high consumption of animal protein, especially red meat with high levels of methionine and BCAAs, have promoted the progression of age-related diseases (40). And, reducing BCAAs consumption in the Western diet improved glucose tolerance and relieved insulin resistance. Previous research has indicated that reducing dietary BCAAs may represent a highly translatable option for the treatment of obesity and insulin resistance in animals (41). According to the results of this study, we propose dietary recommendations for the population's diet to prevent diabetes. The dietary intake should not exceed 2,273 g/day, and the intake of red meat, poultry, fish and seafoods should be controlled at the same time.
Our study also has several limitations. First, these surveys are not carried out annually, which could have allowed more details in trends. Second, dietary consumption data from the CHNS survey 2015 was not available. We used the dietary information from CNHS survey 2015 for make-up. Statistical processing was used to ensure the quality of the results and the comparability between the CNHS and CHNS. Third, our dietary intake estimates are mainly based on 3-day 24-h meal recall, so measurement errors are inevitable. In order to reduce selection biases and measurement errors, we averaged three 24-h dietary recalls for different age groups or urban/rural areas. The average long-term intakes were used to represent the dietary exposure level of the participants. Finally, when the CHNS survey was planned and implemented, the State Statistical Office of China would not share their sample frame with the CHNS team. Furthermore, the data sets for public distribution would not be released if the CHNS team had worked with them. However, the design used extant census data as best as we could for a multi-level random sample.
In conclusion, a trend toward decreased BCAAs intake was observed in Chinese of all subgroups (including age and sex) from 1997 to 2015. After 40 years of age, consumption of BCAAs declined with increasing age. In all food categories, the strongest correlations with BCAAs were with red meat, poultry, fish and seafoods. Higher BCAAs intake was associated with higher risk of T2D. This relationship is more stable among men and middle-aged and elderly people. The people with risk of T2D accounted for about 23.86% of the total population due to BCAAs. Based on the results of this study, in order to prevent diabetes, we recommend that dietary intake should be restricted, while controlling the intake of red meat, poultry, fish and seafood.
Data Availability Statement
The datasets presented in this article are not readily available because the copyright of the dataset is currently owned by the Chinese Center for Disease Control and Prevention and has not been fully disclosed yet. Requests to access the datasets should be directed to https://www.cpc.unc.edu/projects/china.
Ethics Statement
The studies involving human participants were reviewed and approved by National Institute for Nutrition and Health, Chinese Center for Disease Control and Prevention. The patients/participants provided their written informed consent to participate in this study.
Author Contributions
JZ is guarantor, designed the study, principal investigator, and attests that all the listed authors meet the authorship criteria and that no others meeting the criteria have been omitted. LY conducted the data analysis and drafted the manuscript. PS, QZ, YL, SJ, SZ, and ZW critically revised the manuscript for important intellectual content. All authors contributed to the article and approved the final version of the manuscript.
Funding
This study was supported by the National Health Commission of the People's Republic of China Medical Reform Major Program: China National Chronic Diseases and Nutrition Surveillance of Adults (2015–2017) and sponsored by National Institute for Nutrition and Health, China CDC project-Research on Dietary and Nutritional Status of Chinese Elderly (No. 150052). This study was also financed by Investigation on frailty and risk factors of the elderly in the community and discussion on the path of nutrition improvement and by Shandong Medical and Health Science and Technology Development Project (SMHSTDP) 2019WS436.
Conflict of Interest
The authors declare that the research was conducted in the absence of any commercial or financial relationships that could be construed as a potential conflict of interest.
Publisher's Note
All claims expressed in this article are solely those of the authors and do not necessarily represent those of their affiliated organizations, or those of the publisher, the editors and the reviewers. Any product that may be evaluated in this article, or claim that may be made by its manufacturer, is not guaranteed or endorsed by the publisher.
Acknowledgments
This research uses data from China Health and Nutrition Survey (CHNS) and China Nutrition and Health Survey (CNHS). We are grateful to research grant funding from the National Institute for Health (NIH), the Eunice Kennedy Shriver National Institute of Child Health and Human Development (NICHD) for R01 HD30880, National Institute on Aging (NIA) for R01 AG065357, National Institute of Diabetes and Digestive and Kidney Diseases (NIDDK) for R01DK104371 and R01HL108427, the NIH Fogarty grant D43 TW009077 since 1989, and the China-Japan Friendship Hospital, Ministry of Health for support for CHNS 2009, Chinese National Human Genome Center at Shanghai since 2009, Beijing Municipal Center for Disease Prevention and Control since 2011. We thank the National Institute for Nutrition and Health, China Center for Disease Control and Prevention, Beijing Municipal Center for Disease Control and Prevention, and the Chinese National Human Genome Center at Shanghai. JZ is the guarantor of this work and, as such, had full access to all the data in the study and takes responsibility for the integrity of the data and the accuracy of the data analysis.
References
1. Li T, Zhang Z, Kolwicz SJ, Abell L, Roe ND, Kim M, et al. Defective Branched-Chain amino acid catabolism disrupts glucose metabolism and sensitizes the heart to ischemia-reperfusion injury. Cell Metab. (2017) 25:374–85. doi: 10.1016/j.cmet.2016.11.005
2. Zheng Y, Li Y, Qi Q, Hruby A, Manson JE, Willett WC, et al. Cumulative consumption of branched-chain amino acids and incidence of type 2 diabetes. Int J Epidemiol. (2016) 45:1482–92. doi: 10.1093/ije/dyw143
3. Neinast MD, Jang C, Hui S, Murashige DS, Chu Q, Morscher RJ, et al. Quantitative analysis of the whole-body metabolic fate of branched-chain amino acids. Cell Metab. (2019) 29:417–29. doi: 10.1016/j.cmet.2018.10.013
4. Felig P, Marliss E, Cahill GJ. Plasma amino acid levels and insulin secretion in obesity. N Engl J Med. (1969) 281:811–6. doi: 10.1056/NEJM196910092811503
5. Wu Y, Benjamin EJ, MacMahon S. Prevention and control of cardiovascular disease in the rapidly changing economy of china. Circulation. (2016) 133:2545–60. doi: 10.1161/CIRCULATIONAHA.115.008728
6. Lu J, He J, Li M, Tang X, Hu R, Shi L, et al. Predictive value of fasting glucose, postload glucose, and hemoglobin a(1c) on risk of diabetes and complications in chinese adults. Diabetes Care. (2019) 42:1539–48. doi: 10.2337/dc18-1390
7. Isanejad M, LaCroix AZ, Thomson CA, Tinker L, Larson JC, Qi Q, et al. Branched-chain amino acid, meat intake and risk of type 2 diabetes in the women's health initiative. Br J Nutr. (2017) 117:1523–30. doi: 10.1017/S0007114517001568
8. Okekunle AP, Wu X, Duan W, Feng R, Li Y, Sun C. Dietary intakes of Branched-Chained amino acid and risk for type 2 diabetes in adults: the harbin cohort study on diet, nutrition and chronic non-communicable diseases study. Can J Diabetes. (2018) 42:484–92. doi: 10.1016/j.jcjd.2017.12.003
9. Asghari G, Farhadnejad H, Teymoori F, Mirmiran P, Tohidi M, Azizi F. High dietary intake of branched-chain amino acids is associated with an increased risk of insulin resistance in adults. J Diabetes. (2018) 10:357–64. doi: 10.1111/1753-0407.12639
10. Nagata C, Nakamura K, Wada K, Tsuji M, Tamai Y, Kawachi T. Branched-chain amino acid intake and the risk of diabetes in a Japanese community: the takayama study. Am J Epidemiol. (2013) 178:1226–32. doi: 10.1093/aje/kwt112
11. He Y, Li Y, Yang X, Hemler EC, Fang Y, Zhao L, et al. The dietary transition and its association with cardiometabolic mortality among Chinese adults, 1982-2012: A cross-sectional population-based study. Lancet Diabetes Endocrinol. (2019) 7:540–8. doi: 10.1016/S2213-8587(19)30152-4
12. Zhang B, Zhai FY, Du SF, Popkin BM. The China health and nutrition survey, 1989-2011. Obes Rev. (2014) 15 Suppl 1:2–7. doi: 10.1111/obr.12119
13. Yu D, Zhao L, Zhang J, Yang Z, Yang L, Huang J, et al. China nutrition and health surveys (1982–2017). China CDC Wkly. (2021) 3:193–5. doi: 10.46234/ccdcw2021.058
14. Wang G. Institute for nutrition and food hygiene of the chinese academy of preventive medicine. Food Compos Table. (1991).
15. Yuexin Yang GWXP. Institute for nutrition and food safety of the chinese center for disease control and prevention. China Food Compos Table. (2002).
16. Yang Y. Institute for nutrition and food safety of the chinese center forDisease control and prevention. China Food Compos Table 2004. (2005).
17. Johannesen C, Langsted A, Mortensen MB, Nordestgaard BG. Association between low density lipoprotein and all cause and cause specific mortality in Denmark: Prospective cohort study. BMJ. (2020) 371:m4266. doi: 10.1136/bmj.m4266
18. Liu X, Yu C, Wang Y, Bi Y, Liu Y, Zhang ZJ. Trends in the Incidence and Mortality of Diabetes in China from 1990 to 2017: a joinpoint and age-period-cohort analysis. Int J Environ Res Public Health. (2019) 16:158. doi: 10.3390/ijerph16010158
19. Tian Y, Jiang C, Wang M, Cai R, Zhang Y, He Z, et al. BMI, leisure-time physical activity, and physical fitness in adults in China: Results from a series of national surveys, 2000-14. Lancet Diabetes Endocrinol. (2016) 4:487–97. doi: 10.1016/S2213-8587(16)00081-4
20. Attard SM, Howard AG, Herring AH, Zhang B, Du S, Aiello AE, et al. Differential associations of urbanicity and income with physical activity in adults in urbanizing China: findings from the population-based China health and nutrition survey 1991-2009. Int J Behav Nutr Phys Act. (2015) 12:152. doi: 10.1186/s12966-015-0321-2
21. Mayer J, Roy P, Mitra KP. Relation between caloric intake, body weight, and physical work: Studies in an industrial male population in West Bengal. Am J Clin Nutr. (1956) 4:169–75. doi: 10.1093/ajcn/4.2.169
22. Hatamoto Y, Takae R, Goya R, Yoshimura E, Higaki Y, Tanaka H. Effects of different physical activity levels during a single day on energy intake, appetite, and energy balance: a preliminary study. Nutrients. (2019) 11:690. doi: 10.3390/nu11030690
23. Kriska AM, Rockette-Wagner B, Edelstein SL, Bray GA, Delahanty LM, Hoskin MA, et al. The impact of physical activity on the prevention of type 2 diabetes: Evidence and lessons learned from the diabetes prevention program, a Long-Standing clinical trial incorporating subjective and objective activity measures. Diabetes Care. (2021) 44:43–9. doi: 10.2337/figshare.13103333
24. Okekunle AP, Zhang M, Wang Z, Onwuka JU, Wu X, Feng R, et al. Dietary branched-chain amino acids intake exhibited a different relationship with type 2 diabetes and obesity risk: a meta-analysis. Acta Diabetol. (2019) 56:187–95. doi: 10.1007/s00592-018-1243-7
25. Newgard CB, An J, Bain JR, Muehlbauer MJ, Stevens RD, Lien LF, et al. A branched-chain amino acid-related metabolic signature that differentiates obese and lean humans and contributes to insulin resistance. Cell Metab. (2009) 9:311–26. doi: 10.1016/j.cmet.2009.02.002
26. Li YC, Li Y, Liu LY, Chen Y, Zi TQ, Du SS, et al. The ratio of dietary branched-chain amino acids is associated with a lower prevalence of obesity in young northern chinese adults: an internet-based cross-sectional study. Nutrients. (2015) 7:9573–89. doi: 10.3390/nu7115486
27. Halkjær J, Olsen A, Overvad K, Jakobsen MU, Boeing H, Buijsse B, et al. Intake of total, animal and plant protein and subsequent changes in weight or waist circumference in European men and women: the diogenes project. Int J Obes. (2011) 35:1104–13. doi: 10.1038/ijo.2010.254
28. Fontana L, Cummings NE, Arriola AS, Neuman JC, Kasza I, Schmidt BA, et al. Decreased consumption of branched-chain amino acids improves metabolic health. Cell Rep. (2016) 16:520–30. doi: 10.1016/j.celrep.2016.05.092
29. Newgard CB. Interplay between lipids and branched-chain amino acids in development of insulin resistance. Cell Metab. (2012) 15:606–14. doi: 10.1016/j.cmet.2012.01.024
30. Rietman A, Schwarz J, Tomé D, Kok FJ, Mensink M. High dietary protein intake, reducing or eliciting insulin resistance? Eur J Clin Nutr. (2014) 68:973–9. doi: 10.1038/ejcn.2014.123
31. Shah SH, Crosslin DR, Haynes CS, Nelson S, Turer CB, Stevens RD, et al. Branched-chain amino acid levels are associated with improvement in insulin resistance with weight loss. Diabetologia. (2012) 55:321–30. doi: 10.1007/s00125-011-2356-5
32. Barceló A, Morell-Garcia D, Salord N, Esquinas C, Pérez G, Pérez A, et al. A randomized controlled trial: branched-chain amino acid levels and glucose metabolism in patients with obesity and sleep apnea. J Sleep Res. (2017) 26:773–81. doi: 10.1111/jsr.12551
33. David J, Dardevet D, Mosoni L, Savary-Auzeloux I, Polakof S. Impaired skeletal muscle Branched-Chain amino acids catabolism contributes to their increased circulating levels in a non-obese insulin-resistant fructose-fed rat model. Nutrients. (2019) 11:355. doi: 10.3390/nu11020355
34. Zhao J, Zhu Y, Hyun N, Zeng D, Uppal K, Tran VT, et al. Novel metabolic markers for the risk of diabetes development in American Indians. Diabetes Care. (2015) 38:220–7. doi: 10.2337/dc14-2033
35. Ruiz-Canela M, Guasch-Ferré M, Toledo E, Clish CB, Razquin C, Liang L, et al. Plasma branched chain/aromatic amino acids, enriched Mediterranean diet and risk of type 2 diabetes: case-cohort study within the PREDIMED Trial. Diabetologia. (2018) 61:1560–71. doi: 10.1007/s00125-018-4611-5
36. Wang TJ, Larson MG, Vasan RS, Cheng S, Rhee EP, McCabe E, et al. Metabolite profiles and the risk of developing diabetes. Nat Med. (2011) 17:448–53. doi: 10.1038/nm.2307
37. Rousseau M, Guénard F, Garneau V, Allam-Ndoul B, Lemieux S, Pérusse L, et al. Associations between dietary protein sources, plasma BCAA and Short-Chain acylcarnitine levels in adults. Nutrients. (2019) 11:173. doi: 10.3390/nu11010173
38. Liu M, Liu C, Zhang Z, Zhou C, Li Q, He P, et al. Quantity and variety of food groups consumption and the risk of diabetes in adults: a prospective cohort study. Clin Nutr. (2021) 40:5710–7. doi: 10.1016/j.clnu.2021.10.003
39. Pallottini AC, Sales CH, Vieira D, Marchioni DM, Fisberg RM. Dietary BCAA intake is associated with demographic, socioeconomic and lifestyle factors in residents of são paulo, brazil. Nutrients. (2017) 9:449. doi: 10.3390/nu9050449
40. Kitada M, Ogura Y, Monno I, Koya D. The impact of dietary protein intake on longevity and metabolic health. Ebiomedicine. (2019) 43:632–40. doi: 10.1016/j.ebiom.2019.04.005
Keywords: nutritional epidemiology, branched chain amino acids, transition, nutrient effects, type 2 diabetes, risk analysis
Citation: Yu L, Song P, Zhu Q, Li Y, Jia S, Zhang S, Wang Z and Zhang J (2022) The Dietary Branched-Chain Amino Acids Transition and Risk of Type 2 Diabetes Among Chinese Adults From 1997 to 2015: Based on Seven Cross-Sectional Studies and a Prospective Cohort Study. Front. Nutr. 9:881847. doi: 10.3389/fnut.2022.881847
Received: 23 February 2022; Accepted: 25 April 2022;
Published: 23 May 2022.
Edited by:
Rafaela Rosário, University of Minho, PortugalReviewed by:
Cecilie Kyrø, Danish Cancer Society Research Center (DCRC), DenmarkJustina Ucheojor Onwuka, International Agency for Research on Cancer (IARC), France
Copyright © 2022 Yu, Song, Zhu, Li, Jia, Zhang, Wang and Zhang. This is an open-access article distributed under the terms of the Creative Commons Attribution License (CC BY). The use, distribution or reproduction in other forums is permitted, provided the original author(s) and the copyright owner(s) are credited and that the original publication in this journal is cited, in accordance with accepted academic practice. No use, distribution or reproduction is permitted which does not comply with these terms.
*Correspondence: Jian Zhang, emhhbmdqaWFuQG5pbmguY2hpbmFjZGMuY24=