 Franz Ewendt1*
 Julia Kotwan1,2Stefan Ploch1Martina Feger3Frank Hirche1
 Michael Föller3
 Gabriele I. Stangl1,2
- 1Institute of Agricultural and Nutritional Sciences, Martin Luther University Halle-Wittenberg, Halle (Saale), Germany
- 2NutriCARD Competence Cluster for Nutrition and Cardiovascular Health, Halle (Saale), Germany
- 3Department of Physiology, University of Hohenheim, Stuttgart, Germany
Tachysterol2 (T2) is a photoisomer of the previtamin D2 found in UV-B-irradiated foods such as mushrooms or baker’s yeast. Due to its structural similarity to vitamin D, we hypothesized that T2 can affect vitamin D metabolism and in turn, fibroblast growth factor 23 (FGF23), a bone-derived phosphaturic hormone that is transcriptionally regulated by the vitamin D receptor (VDR). Initially, a mouse study was conducted to investigate the bioavailability of T2 and its impact on vitamin D metabolism and Fgf23 expression. UMR106 and IDG-SW3 bone cell lines were used to elucidate the effect of T2 on FGF23 synthesis and the corresponding mechanisms. LC-MS/MS analysis found high concentrations of T2 in tissues and plasma of mice fed 4 vs. 0 mg/kg T2 for 2 weeks, accompanied by a significant decrease in plasma 1,25(OH)2D and increased renal Cyp24a1 mRNA abundance. The Fgf23 mRNA abundance in bones of mice fed T2 was moderately higher than that in control mice. The expression of Fgf23 strongly increased in UMR106 cells treated with T2. After Vdr silencing, the T2 effect on Fgf23 diminished. This effect is presumably mediated by single-hydroxylated T2-derivatives, since siRNA-mediated silencing of Cyp27a1, but not Cyp27b1, resulted in a marked reduction in T2-induced Fgf23 gene expression. To conclude, T2 is a potent regulator of Fgf23 synthesis in bone and activates Vdr. This effect depends, at least in part, on the action of Cyp27a1. The potential of oral T2 to modulate vitamin D metabolism and FGF23 synthesis raises questions about the safety of UV-B-treated foods.
Introduction
Vitamin D insufficiency is highly prevalent worldwide due to seasonal variations in UV-B irradiation, extensive indoor activities that limit endogenous vitamin D synthesis, and a lack of vitamin D-rich foods (1). UV-B exposure of foods or food ingredients is a novel approach to increase the vitamin D concentration in food products and to prevent or combat vitamin D insufficiency (2). Recently, UV-B exposed baker’s yeast for the production of bread, rolls, or pastries (3) and mushrooms (4) have been approved by the European Food Safety Authority (EFSA) as novel foods to improve vitamin D status. Baker’s yeast and mushrooms have high quantities of ergosterol, which is converted to vitamin D2 after treatment with UV-B light (2, 5–8). However, UV-B exposure of ergosterol-rich foods leads to the formation of photoisomers such as tachysterol2 (T2) and lumisterol2 (L2) after the photoinduced ring opening of provitamin D2 (6, 9). The EFSA stated that T2 levels detected in UV-treated baker’s yeast or mushroom powder are low, and therefore are not harmful to health (3, 4). However, the toxicological assessment of the EFSA was not based on studies that investigated the potential biological effects of T2. Notably, recent data showed that orally administered L2 can enter the body of mice, decrease the circulating levels of 25-hydroxyvitamin D3 [25(OH)D3] and calcitriol, and affect genes encoding enzymes that are involved in vitamin D activation and catabolism (10). Thus, we hypothesized that T2 could also affect vitamin D metabolism and processes regulated by active vitamin D.
One hormone that is regulated by active vitamin D is fibroblast growth factor 23 (FGF23). FGF23 is an important regulator of phosphate homeostasis, which is predominantly synthesized in bone and secreted into the bloodstream (11). FGF23 primarily affects the kidney and suppresses renal phosphate reabsorption by internalizing and degrading the Na+-phosphate cotransporter type IIa (12). Additionally, FGF23 downregulates the expression of the 25-hydroxy vitamin D-1α-hydroxylase-encoding gene CYP27B1 (13), the key enzyme for renal 1,25(OH)2D3 (active vitamin D) synthesis, together with its coreceptor α-Klotho (14).
FGF23 gained great clinical importance upon the discovery of its causal role in rare inherited diseases characterized by phosphate wasting and hypophosphataemic rickets (15). Elevated plasma concentrations of FGF23 are also associated with pathologies such as heart failure, cardiac hypertrophy, fibrosis, and dysfunction (16).
Thus, any factors that may modulate FGF23 production and secretion are of potential interest. Among endogenous factors (17), insulin (18), interleukin-6 (19), erythropoietin (20), tumor necrosis factor α (21), AMP-dependent protein kinase (22), myostatin (23), and cellular store-operated Ca2+ entry (24) have already been described as regulators of FGF23 in bone. Little is known about dietary factors that can modulate FGF23 synthesis.
The current study aimed to investigate the FGF23-modulating potential of oral T2 and the corresponding mechanism that may explain FGF23 changes.
Materials and methods
Animals and diets
Mice were cared for and handled according to the guidelines established by the National Research Council (25). The experimental procedures were approved by the committee for animal welfare of Martin Luther University Halle-Wittenberg (approval number: H1-4/T1-20). All mice were kept in pairs in a room controlled for temperature (22 ± 2°C), light (12 h light, 12 h dark cycle), and relative humidity (50–60%) and had free access to food and water.
To investigate, whether oral tachysterol2 (T2) can be absorbed and may influence vitamin D metabolism and FGF23 synthesis, eight 11–12-month-old male and female mice (Charles River, Sulzfeld, Germany) with an initial body weight of 32.7 ± 7.34 g were randomly allocated to two groups of four mice each and were fed basal diet without (control) or with 4 mg/kg T2 (Toronto Research Chemicals Inc., North York, ON, Canada) for 2 weeks. The chosen T2 dose represents the upper level of photoisomers in UVB-exposed food (26, 27). The basal diet consisted of (per kg) 388 g of starch, 200 g of sucrose, 200 g of casein, 100 g of soya oil, 60 g of a vitamin and mineral mixture, 50 g of cellulose, and 2 g of DL-methionine. With the exception of vitamin D, vitamins and minerals were added according to the recommendations of the US National Research Council (28). All mice had free access to their diets and water.
After the 2-week period, mice were deprived of food for 4 h and exsanguinated by decapitation. Plasma, intestinal mucosa, liver, and kidneys were obtained and stored at –80°C until the sterol and Cyp mRNA analysis. The femur and tibia were collected and removed from connective tissues, including both epiphyses and the bone marrow, and stored at –80°C until Fgf23 mRNA analysis.
Cell culture and treatments
UMR106 rat osteoblast-like cells (CRL-1661; ATCC, Manassas, VA, United States) were cultured in Dulbecco’s Modified Eagle Medium (DMEM) with high glucose supplemented with 10% fetal bovine serum (FBS), 100 U/ml penicillin, and 100 μg/ml streptomycin (all reagents from Gibco, Life Technologies, Darmstadt, Germany). For experiments, 2 × 10⁵ cells per 6-well were used. To increase the low basal Fgf23 expression in these cells, UMR106 cells were pretreated with 10 nM 1,25(OH)2D3 (Tocris, Bristol, United Kingdom) for 24 h. Subsequently, the cells were treated with increasing concentrations of T2 (1–25 μM, Toronto Research Chemicals, Canada) for 24 h.
IDG-SW3 mouse osteocytes (CVCL_0P23; Kerafast, Boston, MA, United States) were cultured under proliferative conditions at 33°C and 5% CO2 in α-Minimum Essential Medium (Gibco, Life Technologies) supplemented with 10% FBS, 100 U/ml penicillin, and 100 μg/ml streptomycin, and 50 U/ml interferon-γ (IFN-γ) in rat tail type I collagen-coated cell culture flasks (all reagents from Gibco, Life Technologies). For experiments, cells were seeded on collagen-coated 12-well plates (1.5 × 10⁵ cells per well) and grown under proliferative conditions for 24 h. Differentiation was induced by removing IFN-γ from the medium and culturing the cells in differentiation medium containing 50 μg/ml ascorbic acid (Sigma-Aldrich, Schnelldorf, Germany) and 4 mM β-glycerophosphate (AppliChem, Darmstadt, Germany) at 37°C and 5% CO2. The medium was changed every 2nd to 3rd day. On day 27 of differentiation, cells were treated with 25 μM T2 or vehicle in duplicate for 24 h.
Silencing
For silencing of Vdr, Cyp27a1, or Cyp27b1, 1.5 × 10⁵ UMR106 cells were seeded per well for 24 h in DMEM supplemented with 10% FBS, 100 U/ml penicillin, and 100 μg/ml streptomycin. Next, cells were transfected in antibiotic-free complete medium using 100 nM ON-TARGETplus Rat SMARTpool Vdr siRNA (L-097753-02-0020, Dharmacon, Lafayette, CO, United States), 100 nM ON-TARGETplus Rat SMARTpool Cyp27a1 siRNA (L-093235-02-0005, Dharmacon), 100 nM ON-TARGETplus Rat SMARTpool Cyp27b1 siRNA (L-091842-02-0005, Dharmacon), or 100 nM ON-TARGETplus non-targeting control siRNA (L-001810-10-20, Dharmacon), and DharmaFECT 1 transfection reagent (5 μl for Vdr siRNA transfection; 7.5 μl for Cyp27a1 and Cyp27b1 siRNA transfection; T-2001-02, Dharmacon). After 24 h of Vdr silencing and 72 h of Cyp27a1 or Cyp27b1 silencing, 10 nM 1,25(OH)2D3 was added to each well, and the cells were treated with 25 μM T2 or vehicle alone for another 24 h. In UMR106 cells treated with non-targeting siRNA, the relative Vdr expression was 1.28 ± 0.16 arbitrary units and 0.37 ± 0.04 in cells treated with Vdr-specific siRNA (n = 10; p < 0.01). In cells treated with Cyp27a1-specific siRNA, the relative Cyp27a1 expression was 1.87 × 10⁻⁵ ± 3.37 × 10⁻⁶ arbitrary units and 3.98 × 10⁻⁵ ± 4.83 × 10⁻⁶ in control-treated cells (n = 6; p < 0.05). In cells treated with Cyp27b1-specific siRNA, the relative Cyp27b1 expression was 0.0048 ± 0.0007 arbitrary units and 0.0097 ± 0.001 in cells treated with non-targeting siRNA (n = 6; p < 0.05).
Analysis of D-vitamers in mice and cells
The concentration of T2 in plasma and tissues was analyzed by high-performance liquid chromatography (HPLC; 1260 Infinity Series, Agilent Technologies, Waldbronn, Germany) coupled to an electrospray ionization tandem mass spectrometer (MS/MS, QTRAP 5500, SCIEX, Darmstadt, Germany). Triple-deuterated vitamin D3 (Sigma-Aldrich, Munich, Germany) was added to the samples as an internal standard. Sample preparation and derivatization were done as described elsewhere (29). Tissues were dissolved in n-hexane/isopropanol (99:1 v/v), purified by normal-phase HPLC (1100 Series, Agilent Technologies) (30, 31), and then derivatized with PTAD (29). The derivatized samples were dissolved in methanol, mixed with a 10 mM ammonium formate solution (4:1, v/v, Sigma-Aldrich), and analyzed by LC–MS/MS. To quantify T2, the HPLC system was equipped with a Kinetex C18 column (100 A, 2.6 μm, 100 × 2.1 mm2, Phenomenex, Torrance, United States); the mobile phase consisted of (A) acetonitrile and (B) a mixture of acetonitrile/water (1:1, v/v) with 5 mM ammonium formate and 0.1% formic acid. The column temperature and gradient were as described elsewhere (32). Ionization for mass spectrometric analyses was induced by positive electrospray ionization, and data were recorded in multiple reaction monitoring (MRM) mode with the following transitions (quantifier ions) [M + PTAD + H + ]: T2, 572 > 395; vitamin D3-d3, 563 > 301. Mass transitions of T2 were verified by qualifier ions (T2, 572 > 377). Calibration curves were constructed using external standards of T2 (Toronto Research Chemicals, Canada) spiked with internal standards (as described above). The limit of quantification (LOQ) for plasma samples was 0.4 nM for T2 and 0.4 ng/g for tissue samples.
To determine the purity of the T2 used for the cell culture study, vitamin D2 was quantified by the same LC-MS/MS method described above (quantifier ions: vitamin D2, 572 > 298; qualifier ions: vitamin D2, 572 > 280), using a Poroshel 120 EC-C18 column (2.7 μm, 50 × 4.6 mm2, Agilent Technologies, Germany). Cell pellets and supernatant of UMR106 cells were prepared as plasma samples. Data show only traces of vitamin D2 in the T2 stock solution and T2-treated cells (2.09 ± 0.11 ng/mg). Additionally, the intracellular concentration of 25(OH)D2 in the T2-treated cells was below the LOQ of 0.025 ng/ml, assuming that the traces of vitamin D found in the T2 product were not responsible for the observed T2 effects.
Analysis of minerals in plasma
The plasma concentrations of ionized calcium and inorganic phosphate were determined spectrophotometrically according to the manufacturer’s protocols (Calcium AS FS and Phosphate FS both from DiaSys Diagnostic Systems, Holzheim, Germany).
Qualitative expression analysis
Untreated UMR106 rat osteoblast-like cells were used for total RNA extraction with TriFast reagent (Peqlab, Erlangen, Germany). cDNA synthesis was performed at 25°C for 5 min, 42°C for 1 h, and 70°C for 15 min using 1.2 μg of total RNA, the GoScript™ Reverse Transcription System, and random primers (both Promega, Mannheim, Germany). RT-PCR was conducted in a Rotor-Gene Q Cycler (Qiagen, Hilden, Germany) with 2 μl of cDNA (95°C for 3 min, 40 cycles of 95°C for 10 s, 58°C (Cyp11a1) or 60°C (Cyp2r1; Cyp27a1; Cyp27b1; Cyp24a1) for 30 s, and 72°C for 30 s). The primers used are listed in Table 1. Amplified RT-PCR products were loaded on a 1.5% agarose gel and visualized by Midori Green.
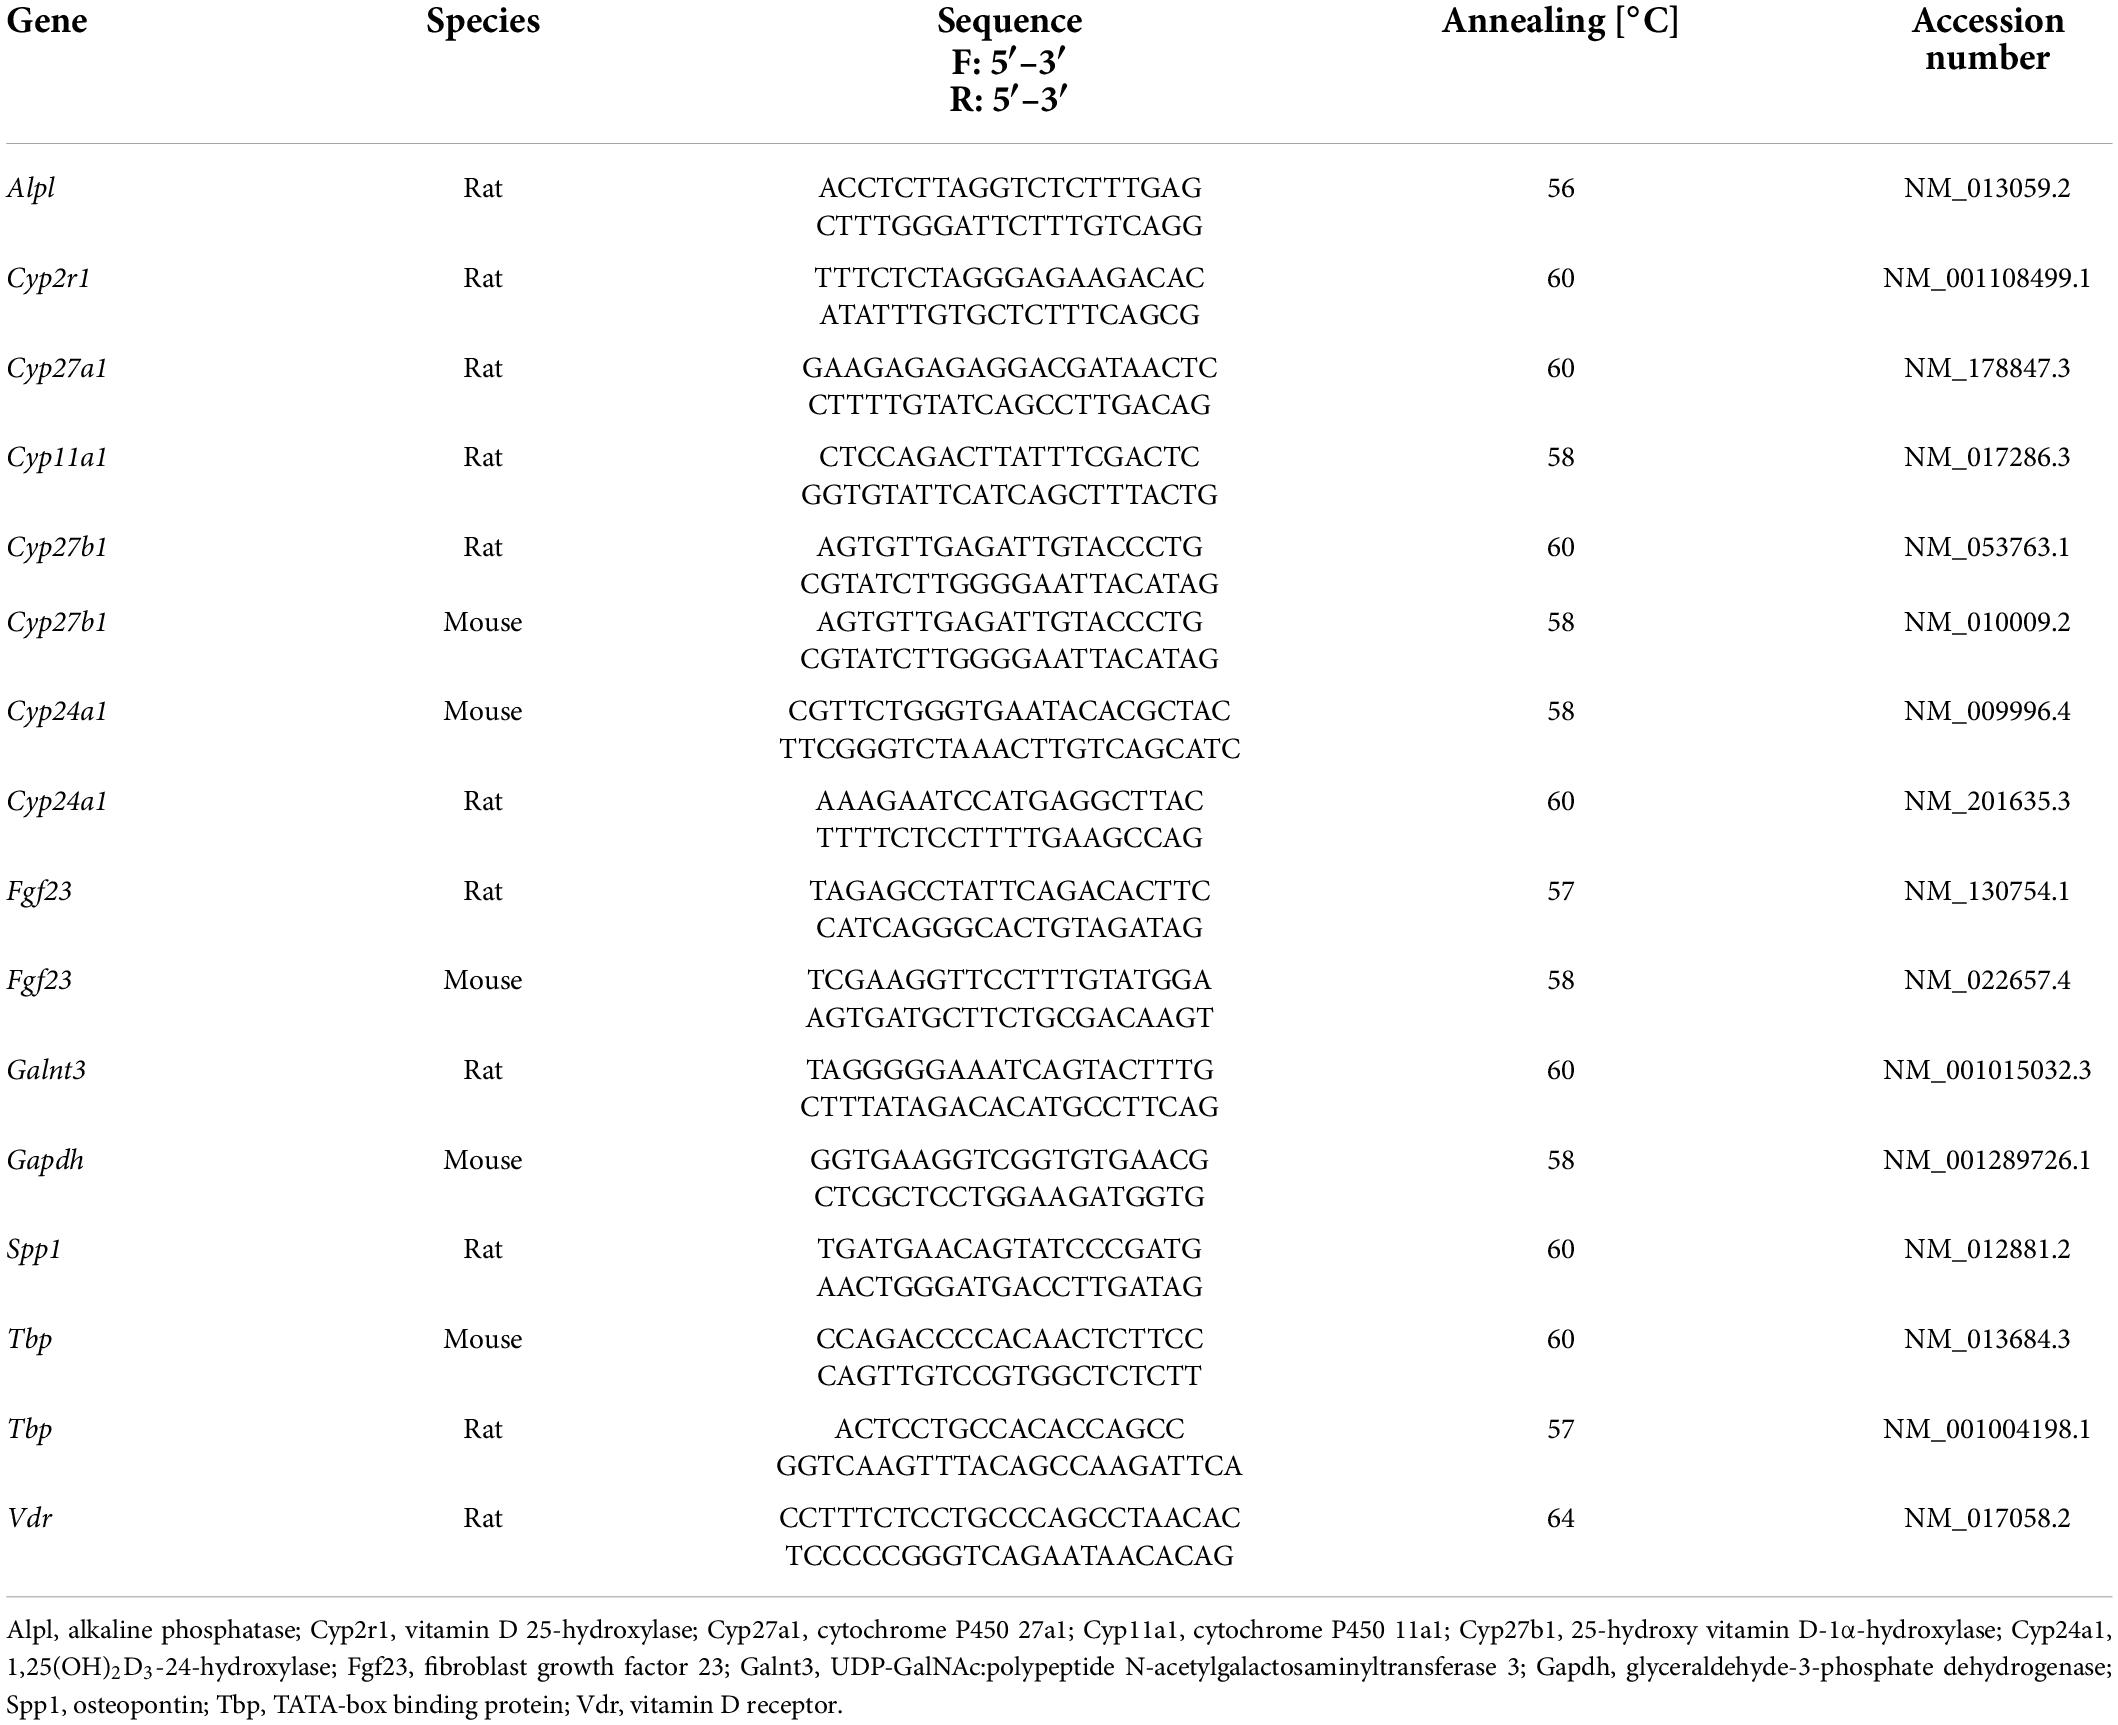
Table 1. Primers used for the analysis of the relative mRNA abundance of genes.
RNA isolation and quantitative real-time PCR
The femurs and tibias used for total RNA extraction were ground in liquid nitrogen, transferred to TriFast reagent (Peqlab, Germany), and homogenized. Total RNA was extracted by adding chloroform and isolated by using the RNeasy Mini Kit (Qiagen, Germany). The RNA concentration was calculated using a NanoDrop Spectrophotometer (Thermo Fisher Scientific, Waltham, MA United States). Total bone RNA (300 ng) was reverse-transcribed (25°C for 5 min, 42°C for 1 h, and 70°C for 15 min) using the GoScript™ Reverse Transcription System (Promega, Germany).
Total kidney RNA was isolated with TriFast reagent (Peqlab, Germany) according to the manufacturer’s protocol, and cDNA was synthesized using M-MLV Reverse Transcriptase (Promega, Germany).
Total RNA was extracted from UMR106 osteoblast-like cells and IDG-SW3 osteocytes using TriFast reagent (Peqlab, Germany), and 1.2 μg was used for first-strand cDNA synthesis (25°C for 5 min, 42°C for 1 h, and 70°C for 15 min) with random primers and the GoScript™ Reverse Transcription System. Quantitative real-time PCR using a Rotor-Gene Q Cycler (Qiagen, Germany) and GoTaq qPCR Master Mix (Promega, Germany) was performed to determine relative Fgf23, Galnt3, Spp1, Alpl, Vdr, Cyp27a1, Cyp27b1, Gapdh, and Tbp expression. The qRT-PCR conditions were as follows: 95°C for 3 min; 40 cycles of 95°C for 10 s, 57°C for 30 s (rat Fgf23 and rat Tbp) or 58°C for 30 s (mouse Fgf23, Cyp27b1, and Gapdh) or 60°C for 30 s (rat Cyp27a1, Cyp27b1, Galnt3, and Spp1 or mouse Tbp) or 64°C for 30 s (rat Vdr) or 56°C for 30 s (rat Alpl), and 72°C for 30 s. The calculated mRNA expression levels of the examined genes were normalized to the expression levels of Tbp or Gapdh. The quantification of gene expression is presented as 2−ΔCT (ΔCT = CT [target gene]—CT [reference gene]) transformed data (33). The primers used are listed in Table 1.
Enzyme-linked immunosorbent assay
UMR106 cells were cultured as described and treated with 25 μM T2 for 24 h. The cell culture supernatant was stored at –80°C. For quantification, cell culture supernatants were first concentrated using Vivaspin 6 centrifugal concentrators (Sartorius, Göttingen, Germany), and C-terminal and intact FGF23 protein were determined using enzyme-linked immunosorbent assay (ELISA) kit’s Mouse/Rat FGF-23 (Intact) and Mouse/Rat FGF-23 (C-Term) (both from Immutopics, San Clemente, CA, United States) according to the manufacturer’s protocol.
The plasma concentration of 1,25(OH)2D was analyzed by a commercial ELISA (Immunodiagnostic Systems, Frankfurt am Main, Germany). Analyses were performed by following the procedures given by the manufacturers with modifications described elsewhere (34).
Western blotting
To determine nuclear VDR translocation, 2.1 × 10⁶ UMR106 cells were seeded in a 75-cm2 cell culture flask in complete medium for 24 h without 1,25(OH)2D3-prestimulation. Subsequently, the cells were treated with 25 μM T2 or vehicle alone for another 24 h, and then processed according to the protocol of the NE-PER kit (Thermo Fisher Scientific, United States). The obtained cell pellet was used for the extraction of cytoplasmic and nuclear proteins according to the manufacturer’s protocol. Next, 20 μg of cytoplasmic and nuclear protein was used for a standard western blot procedure using the following antibodies: VDR (D-6): sc-13133 (Santa Cruz Biotechnology, Dallas, TX, United States), GAPDH (#5174S), histone H3 (#9715S), and the secondary antibody anti-rabbit IgG (#7074) conjugated with HRP (all antibodies from Cell Signaling Technology, Frankfurt, Germany). Protein bands were visualized using ECL detection reagent (GE Healthcare-Amersham, Amersham, United Kingdom) and Syngene G:BOX Chemi XX6 (VWR, Dresden, Germany) documentation system. Protein band intensities of cytoplasmic VDR were normalized to GAPDH, and nuclear VDR band intensities were normalized to histone H3.
Statistics
The data are shown as arithmetic means ± SEM, and n represents the number of independent experiments. Data were tested for normal distribution using the Shapiro-Wilk normality test. Two groups were tested for significant differences using an unpaired Student’s t-test (with Welch correction, if necessary) or a Mann-Whitney U-test (for non-normally distributed data). Data with more than two treatments were compared by one-way ANOVA followed by Tukey’s multiple comparison test (if necessary, Welch’s ANOVA followed by Dunnett’s T3 multiple comparison test) or Kruskal-Wallis followed by Dunn’s multiple comparison test for non-normally distributed data. Differences were considered significant at p < 0.05.
Results
Oral tachysterol2 enters the body and affects vitamin D metabolism
The final body weights (33.5 ± 4.31 g for the control group and 38.48 ± 9.27 g for the T2 group) and feed intake per cage (3.33 ± 0.94 g/d for the control and 3.55 ± 0.72 g/d for the T2 group) did not differ between the two groups. To determine whether dietary T2 can enter the body, mice were fed T2 and analyzed for their concentrations in intestinal mucosa, liver, and plasma. T2 concentrations were found in the intestinal mucosa, liver, and plasma of mice that received 4 mg/kg T2 in their diet for 2 weeks, whereas no detectable T2 was observed in control mice (Figures 1A–C). Interestingly, the T2 group was characterized by a significant reduction in plasma 1,25(OH)2D levels (Figure 1D) and a marked increase in the mRNA abundance of Cyp24a1 in the kidneys compared to the control group (Figure 1E). Additionally, the mRNA abundance of renal Cyp27b1 was moderately but not statistically significantly lower in the T2 group than in the control group (Figure 1F). Interestingly, despite reduced levels of 1,25(OH)2D, the T2 group had significantly higher plasma concentrations of ionized calcium (Figure 1G) and a trend toward higher plasma levels of inorganic phosphate than the control group (Figure 1H).
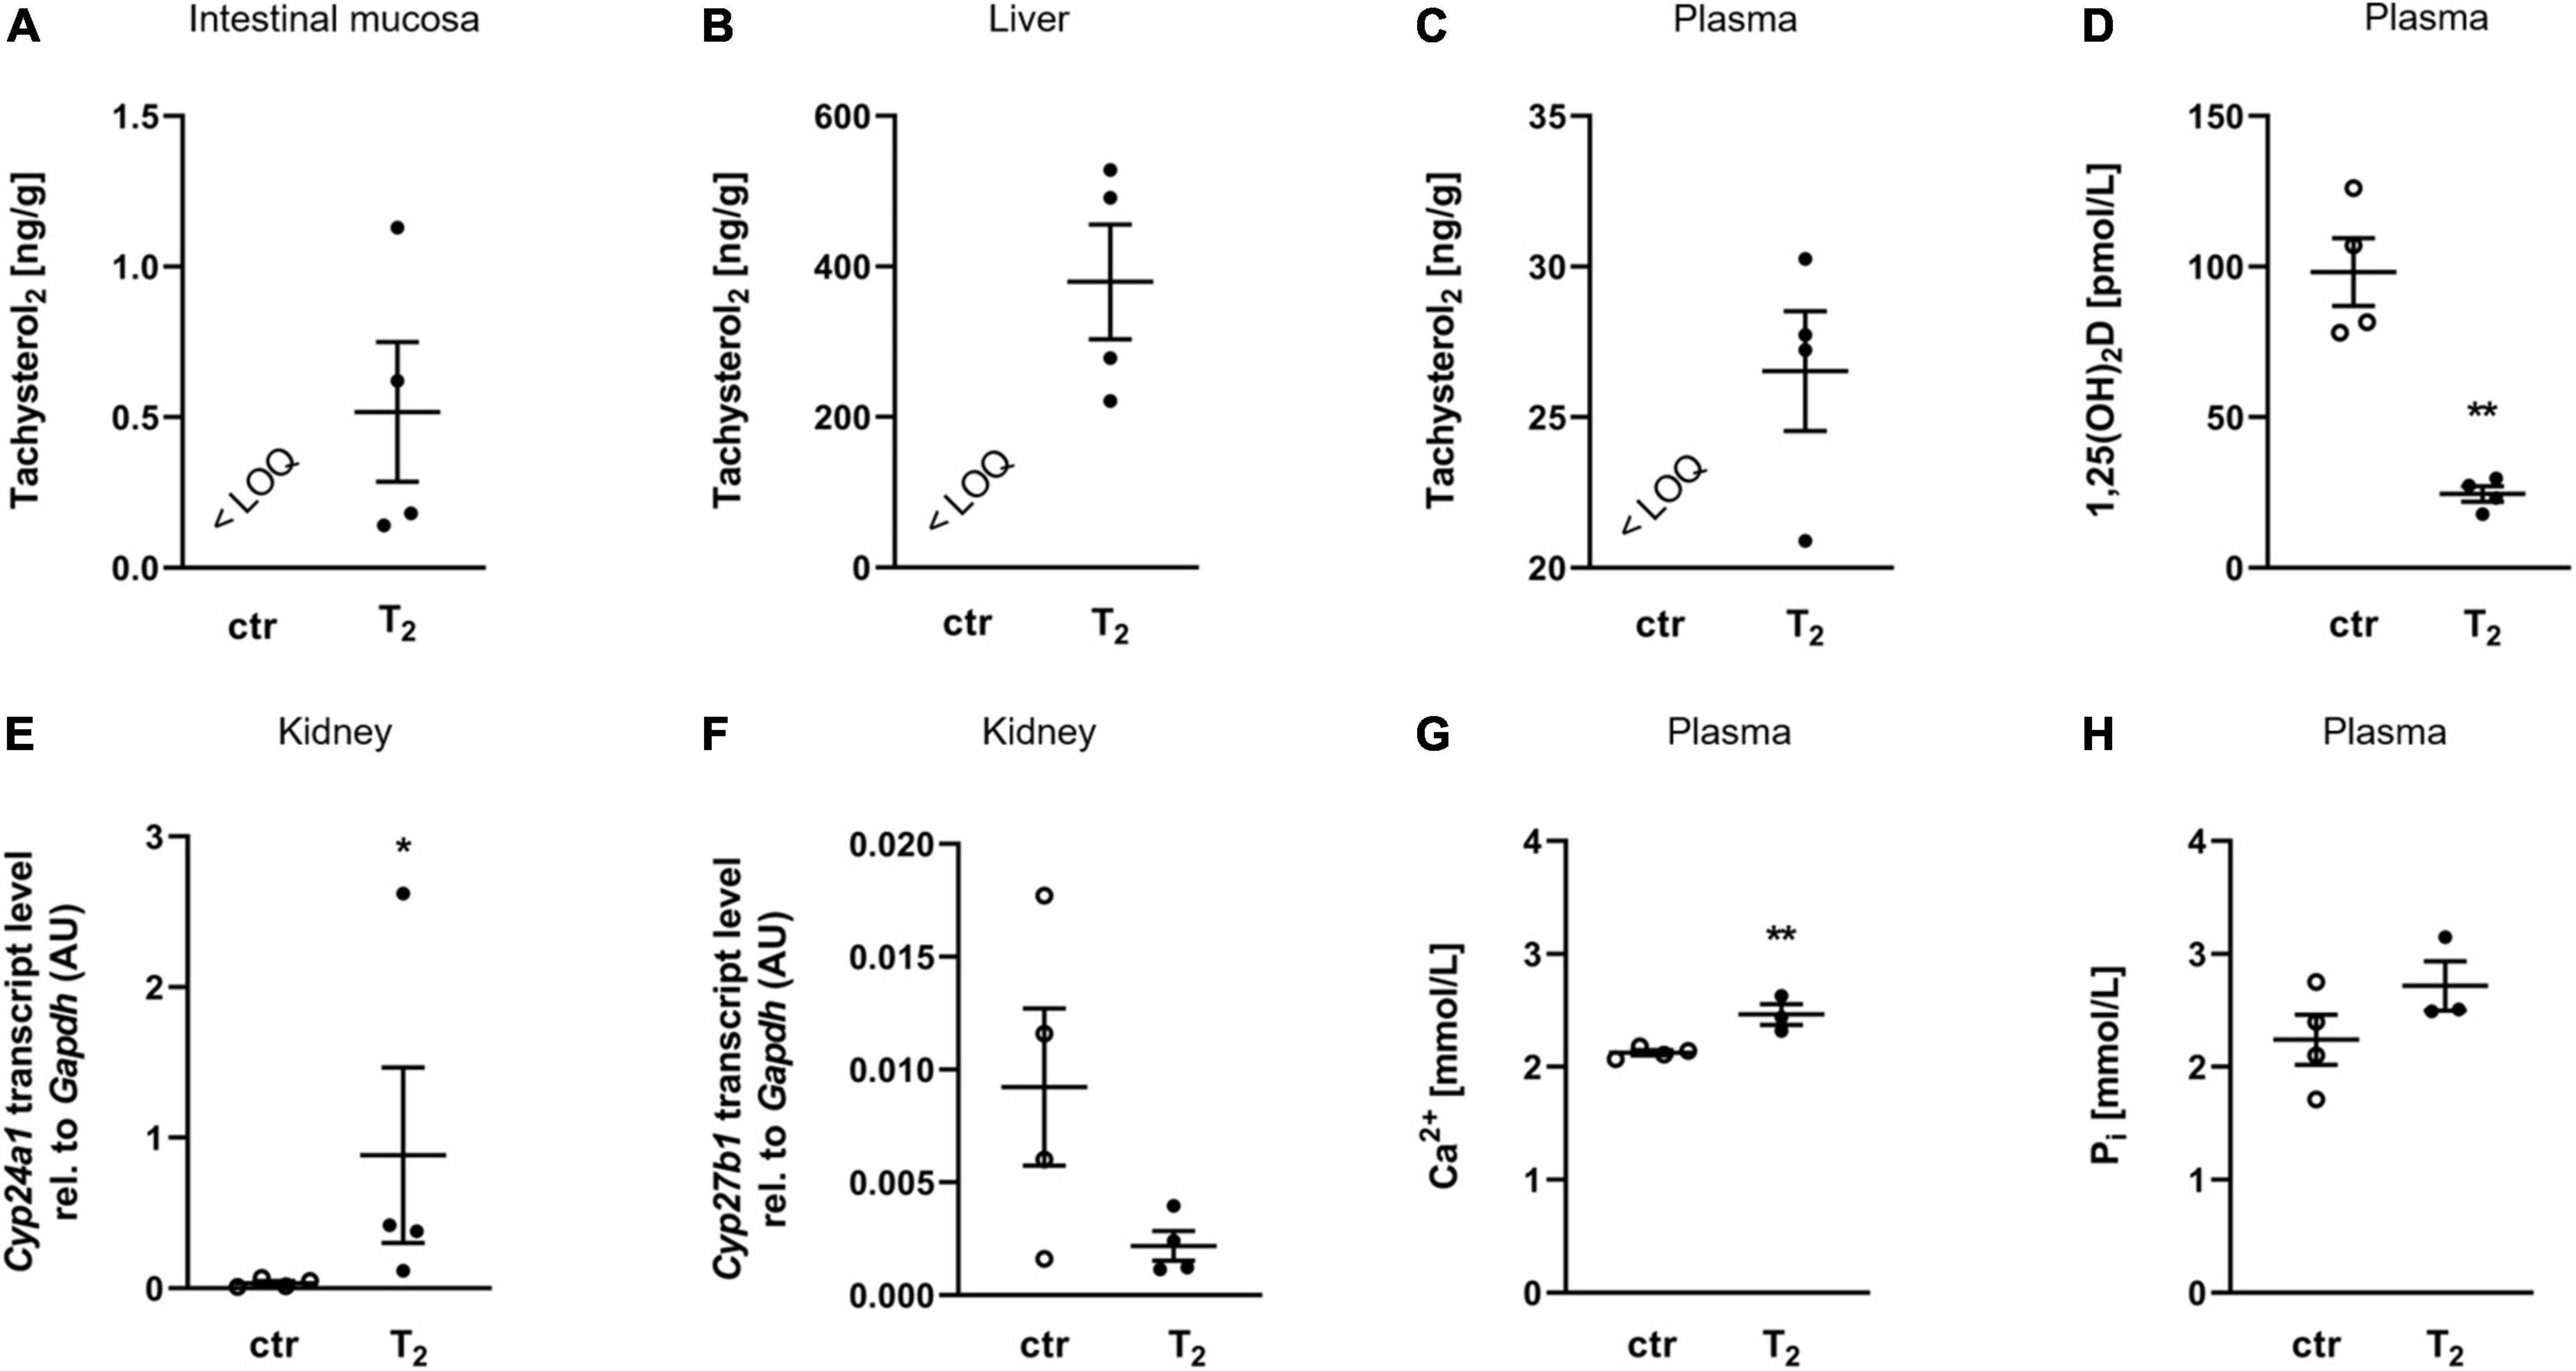
Figure 1. Oral tachysterol2 enters the body and affects vitamin D metabolism. Scatter dot plots and arithmetic means ± SEM of concentrations of tachysterol2 (T2) in the intestinal mucosa (A), liver (B) and plasma (C), plasma concentration of 1,25(OH)2D (D), relative (rel.) renal Cyp24a1 mRNA abundance (normalized to Gapdh) (E), rel. renal Cyp27b1 mRNA abundance (normalized to Gapdh) (F), plasma concentration of ionized calcium (Ca2+) (G), and plasma concentration of inorganic phosphate (Pi) (H) of mice fed diets with 0 (ctr) or 4 mg/kg T2 for 2 weeks (A–F: n = 4). *p < 0.05 and **p < 0.01 indicate significant differences from the control. The limit of quantification (LOQ) for T2 was 0.4 nM in plasma and 0.4 ng/g in tissue samples. 1,25(OH)2D, active vitamin D, calcitriol; AU, arbitrary units; ctr, control [D,F: unpaired Student’s t-test with Welch’s correction; (E) Mann-Whitney U-test; (G,H) unpaired Student’s t-test (n = 3–4)].
Tachysterol2 induces fibroblast growth factor 23 production in bone cells
Since oral T2 was absorbed by mice and affected vitamin D metabolism, the mRNA abundance of Fgf23 was analyzed in the mouse bones, the major site of FGF23 synthesis. Interestingly, the femurs and tibias of mice fed T2 had moderately, but not statistically significantly higher relative transcript levels of Fgf23 than those of the control group (Figure 2A) (p = 0.071). To investigate whether T2 can directly stimulate Fgf23 mRNA expression, rat UMR106 osteoblast-like cells were treated with increasing concentrations of T2 for 24 h. Figure 2B illustrates that T2 increased Fgf23 gene expression in a dose-dependent manner. Additionally, IDG-SW3 osteocytes treated with 25 μM T2 for 24 h showed a significant increase in Fgf23 transcript levels (Figure 2C). The stimulated transcription of Fgf23 in T2-treated UMR106 cells was accompanied by a significant release of C-terminal Fgf23 protein, whose measurement was based on a C-terminal assay for FGF23 which detects both intact FGF23 and biologically inactive C-terminal fragments (Figure 2D). Subsequent analyses showed that the increase in C-terminal Fgf23 was associated with an increase in intact Fgf23 protein in the supernatant of T2-treated UMR106 cells (Figure 2E). Because secretion of intact FGF23 depends on the catalytic action of GALNT3 (35), mRNA abundance of Galnt3 in UMR106 cells was analyzed. Figure 2F demonstrates that the Galnt3 mRNA concentrations of cells treated with 25 μM T2 for 24 h increased more than threefold compared to control cells.
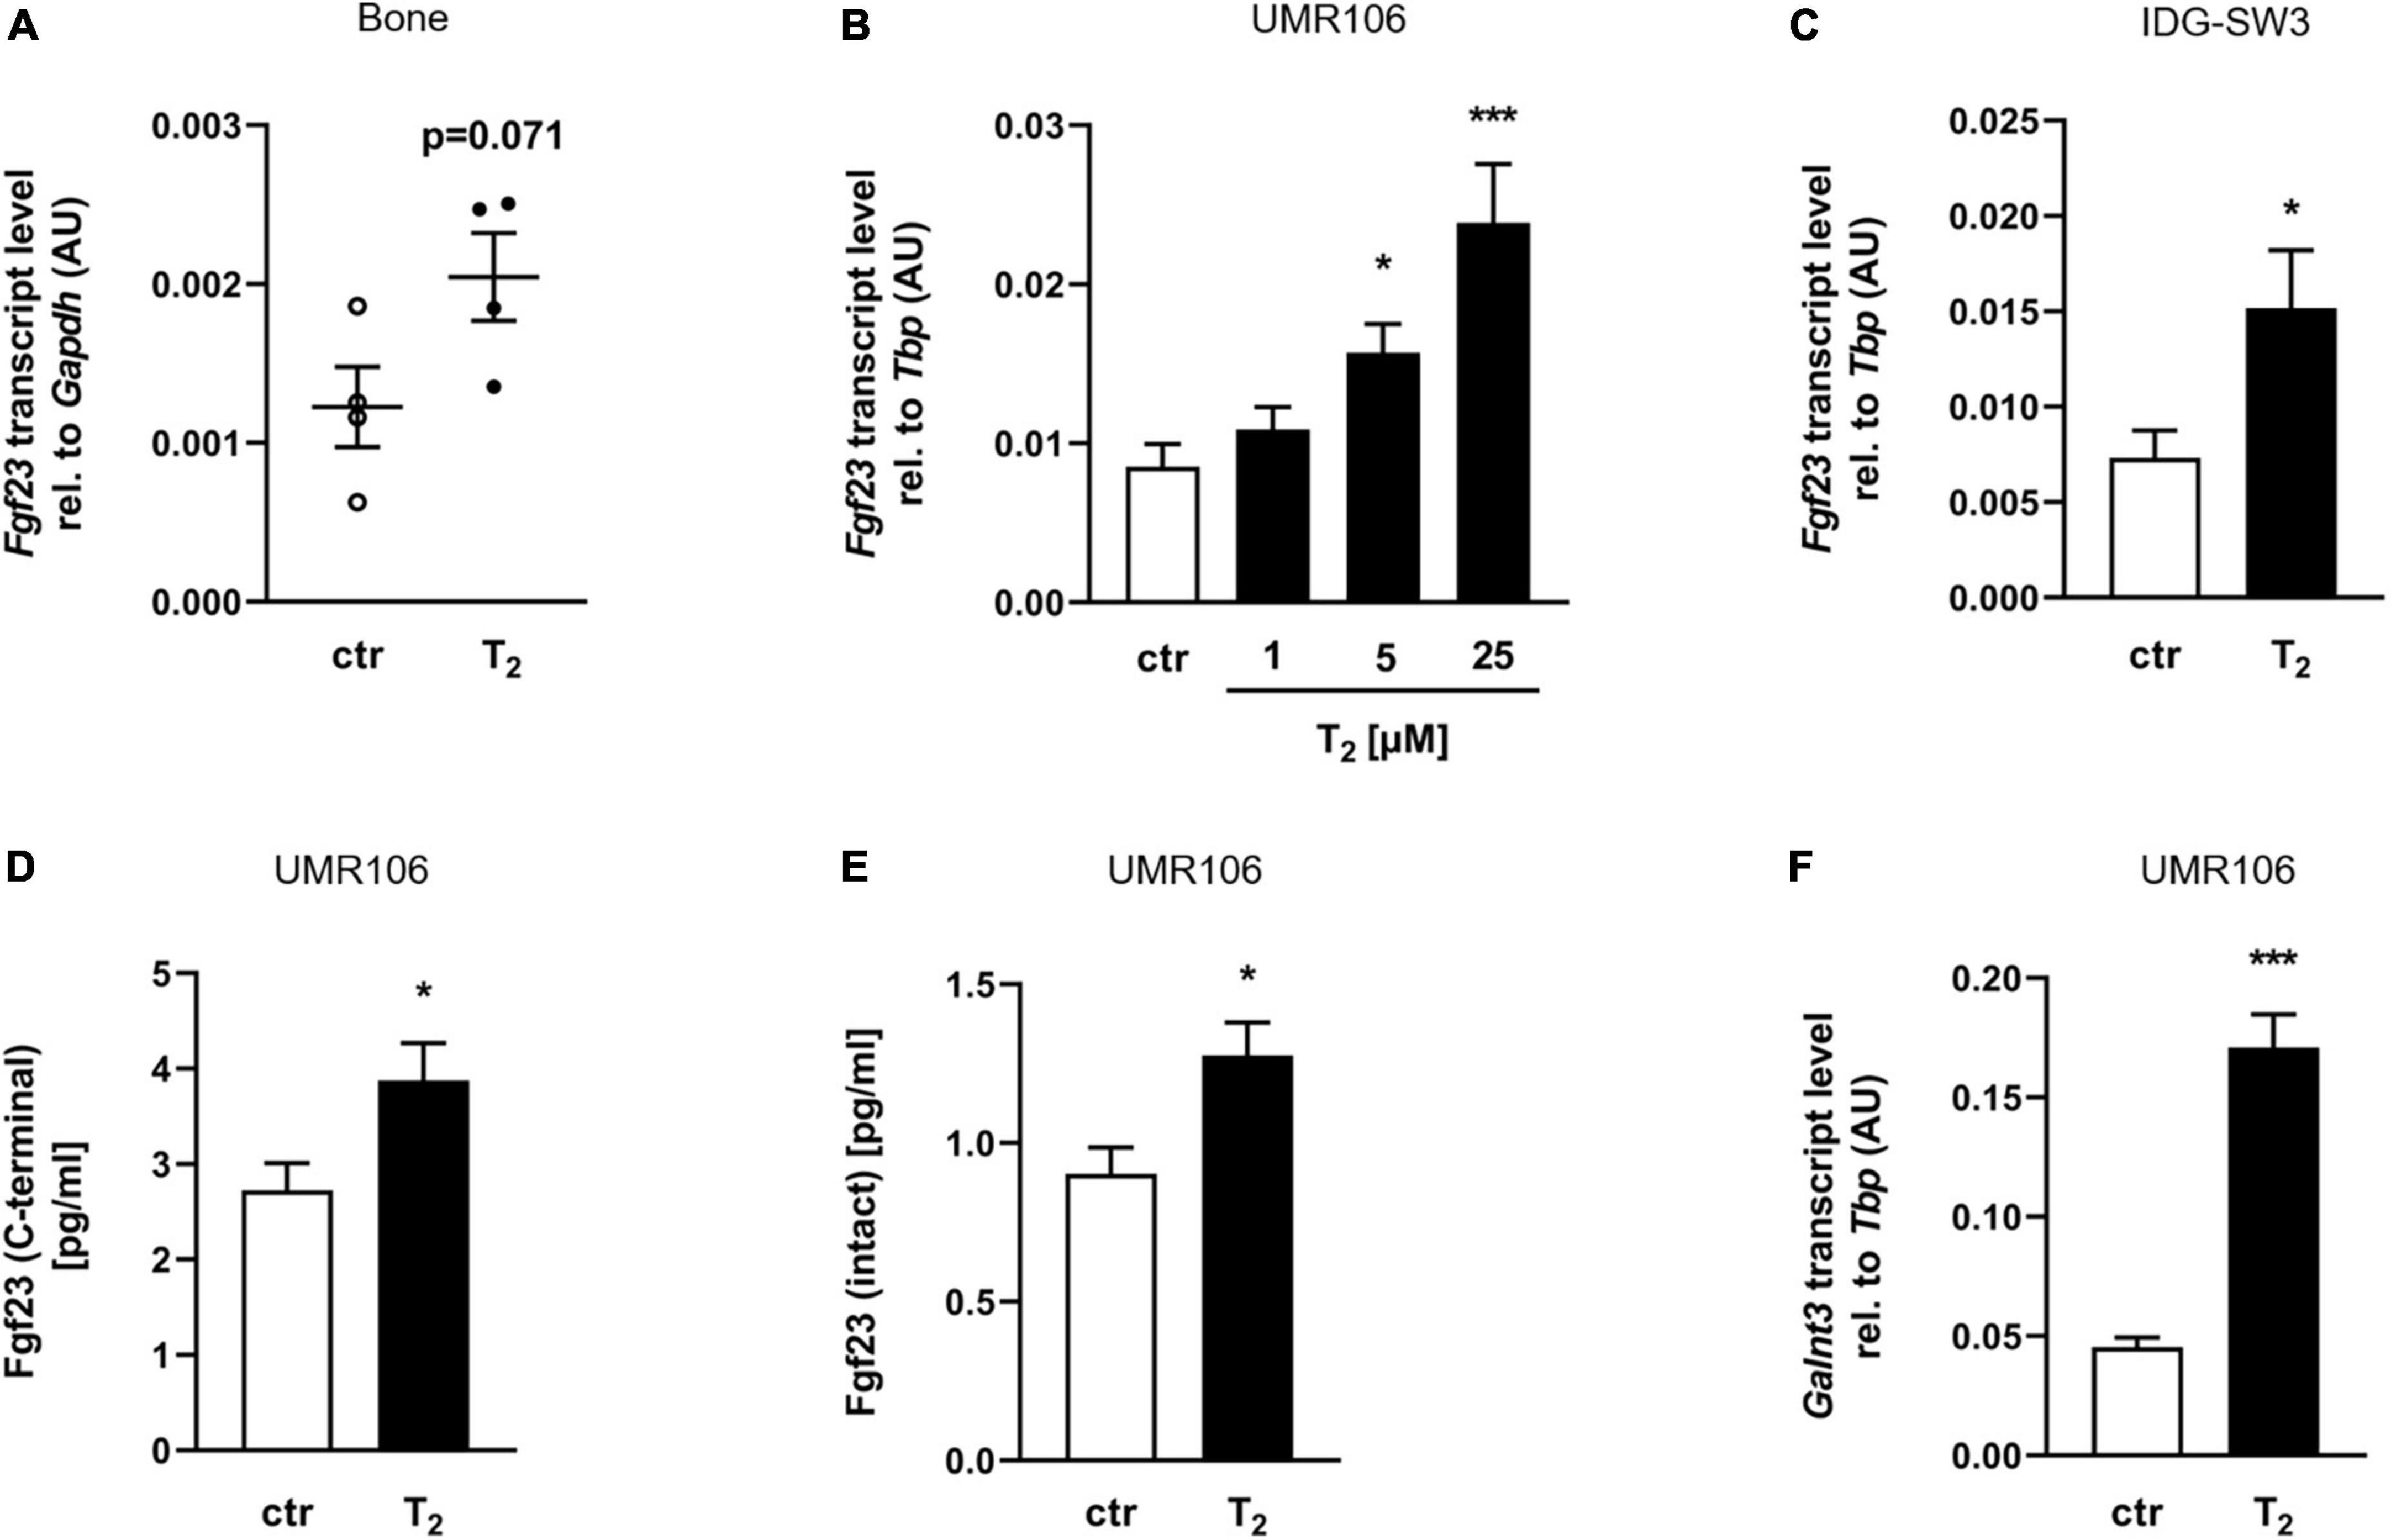
Figure 2. Tachysterol2 induces Fgf23 production in bone cells. (A) Scatter dot plots and arithmetic means ± SEM of relative (rel.) Fgf23 mRNA abundance (normalized to Gapdh) in bone of wild-type mice (n = 4) receiving diets with 0 or 4 mg/kg tachysterol2 (T2) for 2 weeks. Arithmetic means ± SEM of rel. Fgf23 (B n = 8; C n = 11) and Galnt3 (F n = 5) mRNA abundance (normalized to Tbp) or cell culture supernatant concentrations of C-terminal (D n = 10) or intact Fgf23 protein (E n = 11) in UMR106 osteoblast-like cells (B,D,E,F) and IDG-SW3 osteocytes (C) treated with T2 (B indicated concentrations; C–F 25 μM T2) for 24 h. *p < 0.05 and ***p < 0.001 indicate significant differences from the control. AU, arbitrary units; ctr, control (A,D,E unpaired Student’s t-test; B Kruskal-Wallis; C,F unpaired Student’s t-test with Welch’s correction).
The effect of tachysterol2 on fibroblast growth factor 23 expression depends, at least in part, on regulation of the vitamin D receptor
Assuming that T2 may function as a vitamin D receptor (VDR) ligand, downstream targets of 1,25(OH)2D-VDR signaling were analyzed in UMR106 cells treated with 25 μM T2 for 24 h. Interestingly, T2 significantly induced gene expression of both Spp1 (Figure 3A) and Alpl (Figure 3B) compared to the vehicle control, indicating that T2 can activate VDR. To investigate the role of VDR in mediating the T2 effect, Western blot analysis examining the translocation of VDR from the cytoplasm to the nucleus was conducted. As shown in Figure 3C, treatment of UMR106 cells with 25 μM T2 for 24 h resulted in a pronounced translocation of cytosolic Vdr into the nucleus compared to the control. In addition, T2 treatment significantly increased Vdr protein expression in the cytoplasm compared to the vehicle control (Figure 3C). To determine the involvement of VDR in T2-mediated regulation of Fgf23 gene expression, T2 effects on Fgf23 expression in UMR106 cells were elucidated in the presence or absence of Vdr-specific siRNA. Figure 3D demonstrates that Vdr-specific siRNA treatment significantly diminished T2-mediated upregulation of Fgf23 gene expression. This effect suggests that Vdr is, at least in part, needed for T2 to regulate FGF23 production. Nevertheless, T2 was able to significantly increase Fgf23 gene expression even in the presence of Vdr-specific siRNA, suggesting that T2 may also regulate Fgf23 gene expression through other pathways.
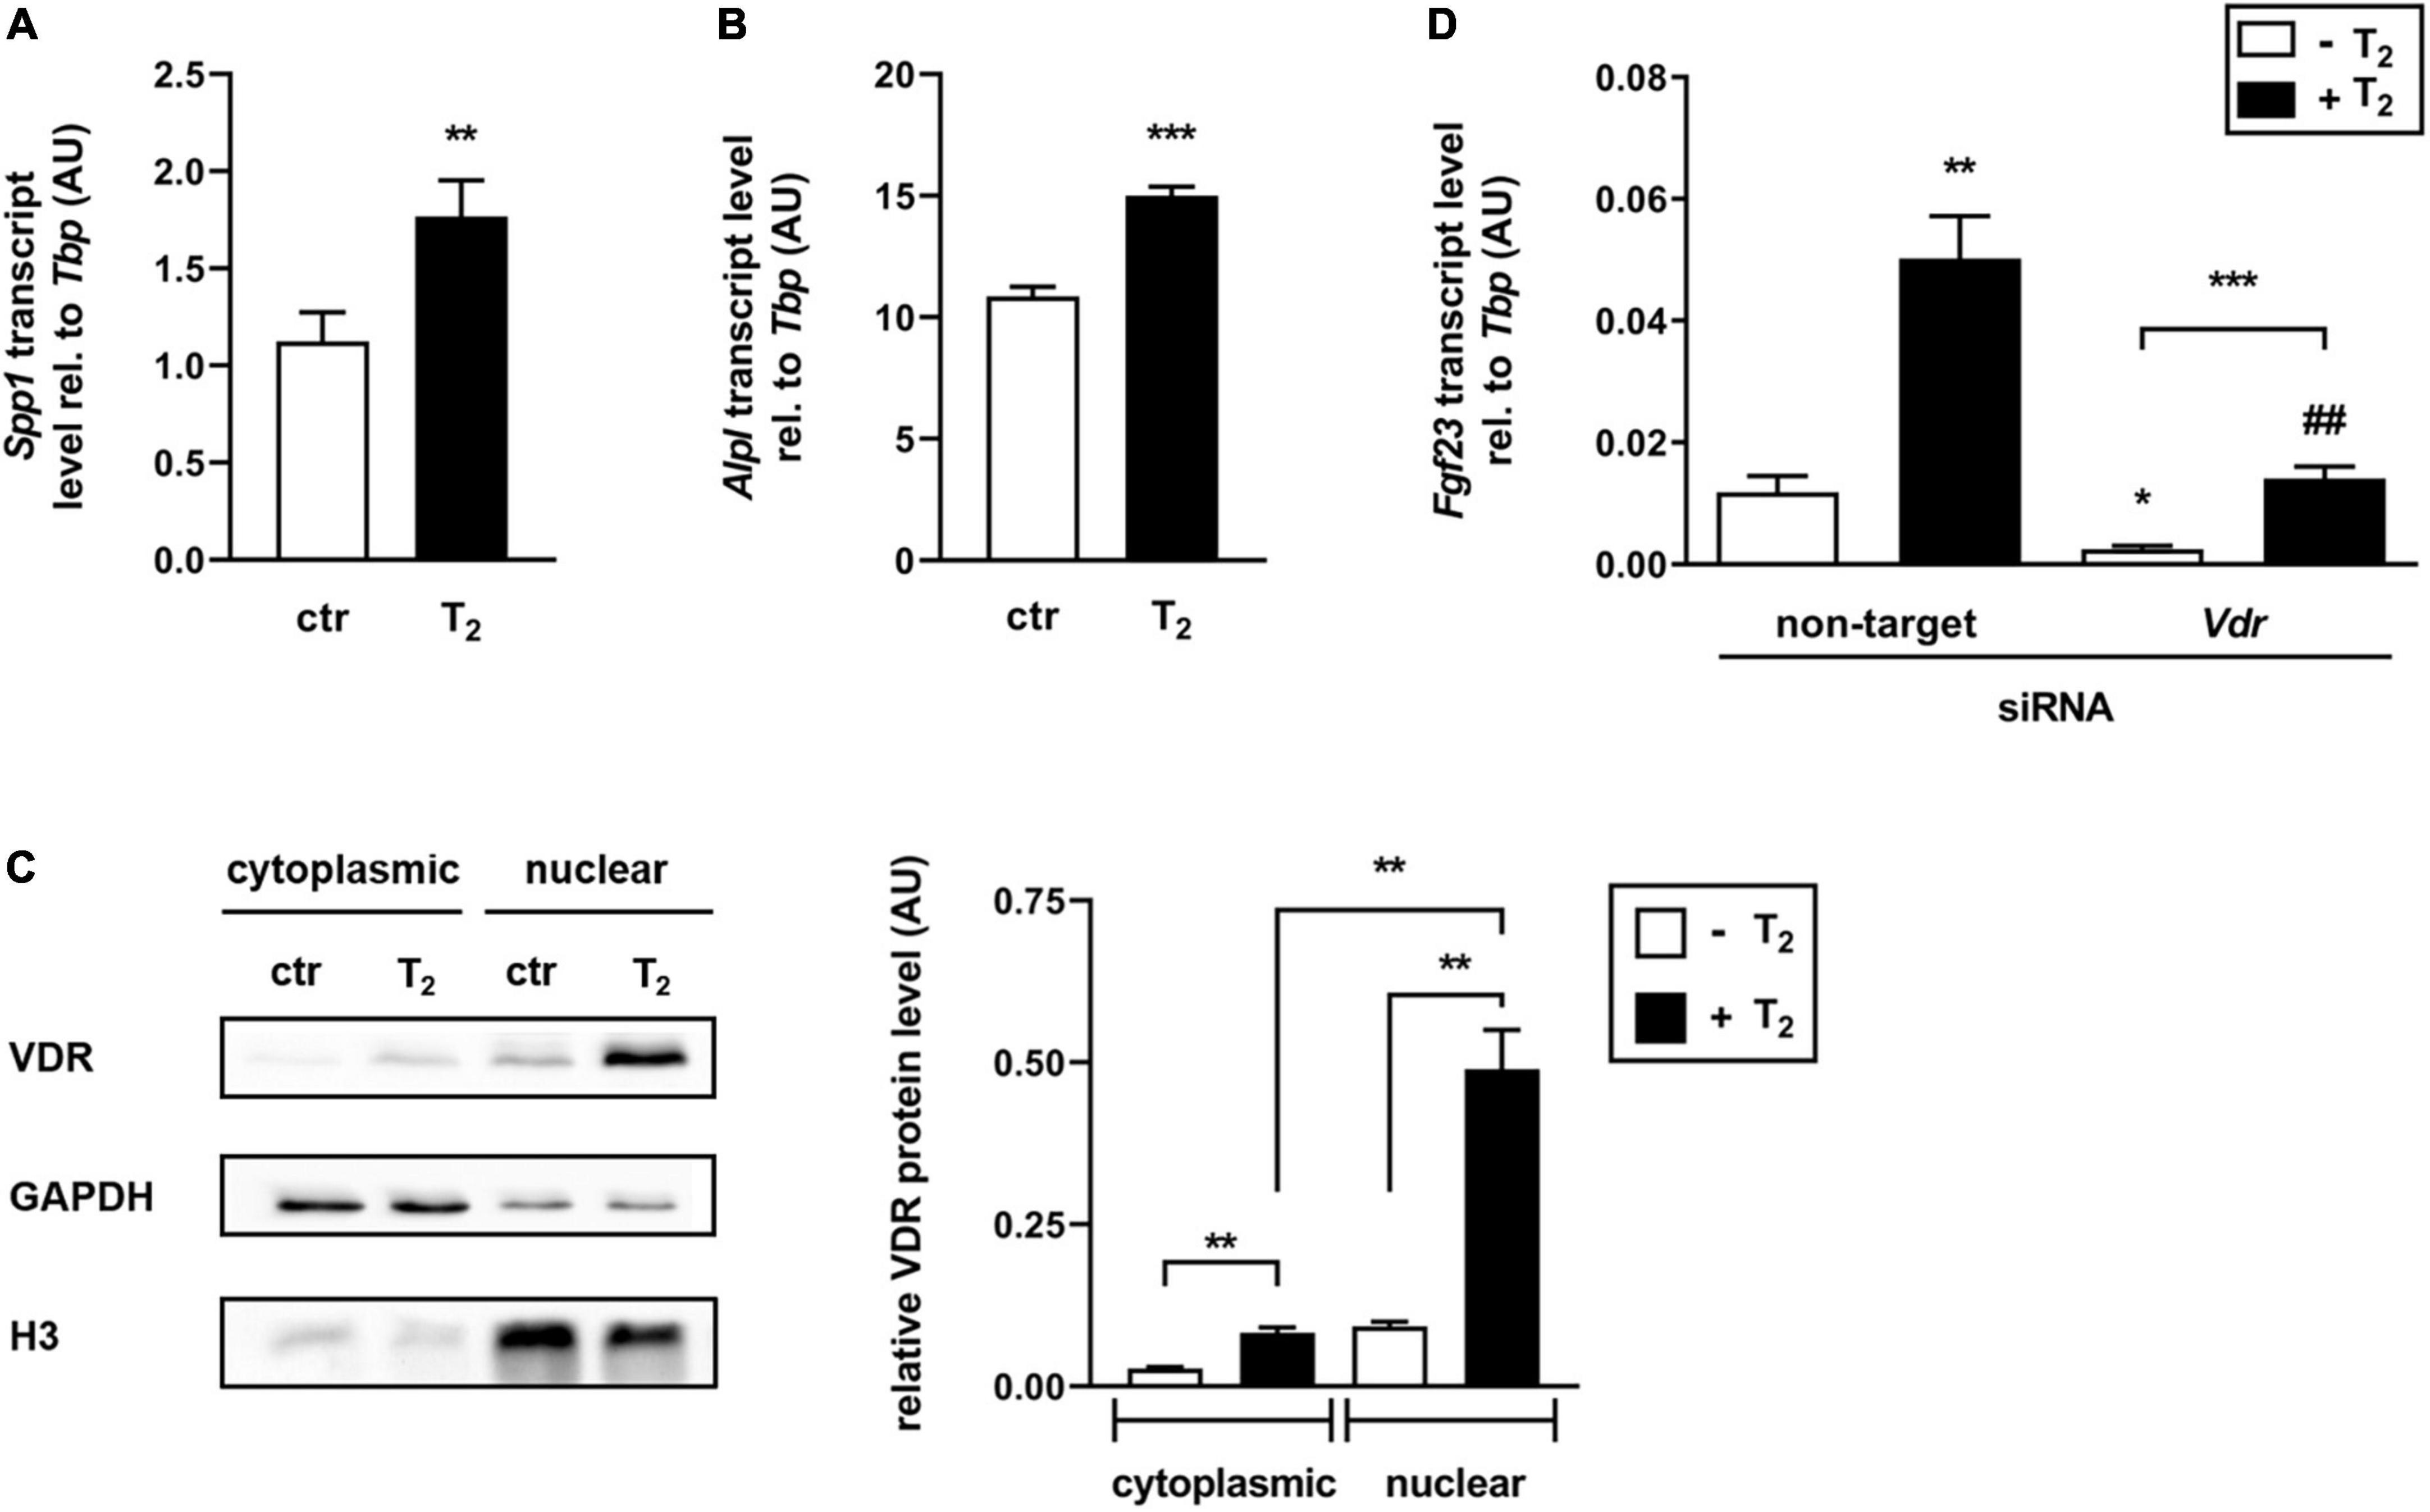
Figure 3. The effect of tachysterol2 on Fgf23 expression depends, at least in part, on regulation of the vitamin D receptor. Arithmetic means ± SEM of relative (rel.) Spp1 (A n = 6) or Alpl (B n = 5) mRNA abundance (normalized to Tbp) in UMR106 cells treated with 25 μM tachysterol2 (T2) for 24 h. (C) Original Western blots (left panel) showing cytoplasmic and nuclear VDR, GAPDH, and histone H3 (H3) protein abundance in UMR106 cells treated without (ctr) or with T2 (25 μM, 24 h). The right panel depicts the densitometric analysis (arithmetic mean ± SEM, n = 6) of cytoplasmic VDR (normalized to loading control GAPDH) and nuclear VDR (normalized to loading control histone H3) abundance in UMR106 cells treated without (white bars) or with (black bars) T2 (25 μM, 24 h). (D) Arithmetic means ± SEM of rel. Fgf23 mRNA abundance (normalized to Tbp) in UMR106 cells incubated without (white bars) or with (black bars) T2 (25 μM, 24 h) in the presence or absence of non-targeting or Vdr-specific siRNA (100 nM, 48 h, n = 10). Treatment with Vdr-specific siRNA resulted in a 71% reduction of relative Vdr mRNA (D) expression compared to non-targeting siRNA as control. *p < 0.05, **p < 0.01, and ***p < 0.001 indicate significant differences from control. ##p < 0.01 indicate a significant difference from the absence of Vdr-specific siRNA (2nd vs. 4th bar). AU, arbitrary units; ctr, control [A Mann-Whitney U-test; B unpaired Student’s t-test; C,D Welch’s ANOVA].
The effect of tachysterol2 on fibroblast growth factor 23 transcription is at least partially dependent on Cyp27a1
The effect of T2 on Fgf23 expression appears to be mediated by Vdr. Since non-hydroxylated vitamin D photoisomers are suggested to have a low binding affinity to Vdr in contrast to hydroxylated compounds (36), we hypothesized that T2 is metabolized by cytochrome P450 (CYP) enzymes to form active T2 derivates, thereby enhancing their effect on the Vdr-mediated regulation of Fgf23 gene expression. Therefore, we first investigated whether bone cells express CYPs, which are involved in the hydroxylation of vitamin D metabolites. Figure 4A shows that Cyp2r1, Cyp27a1, Cyp11a1, Cyp27b1, and Cyp24a1 were expressed in UMR106 cells, suggesting that T2 can be converted to hydroxy-T2 derivates. To elucidate the role of Cyp27a1 and Cyp27b1 in the production of bioactive T2 derivatives, which can stimulate FGF23 expression, we conducted two experiments using Cyp27a1- and Cyp27b1-specific siRNAs. Figure 4B illustrates that T2 significantly stimulated Fgf23 gene expression in the presence of the non-targeting siRNA, whereas the effect of T2 on Fgf23 expression was markedly lower in the presence of Cyp27a1-specific siRNA, indicating that the enzymatic activity of Cyp27a1 is, at least in part, necessary to mediate the T2 effect on Fgf23 gene expression in UMR106 cells. In contrast, Cyp27b1 does not appear to be necessary to mediate the T2 effect on Fgf23 expression, as Fgf23 gene expression did not differ in cells treated with non-targeting or Cyp27b1-specific siRNA after T2 treatment (Figure 4C).
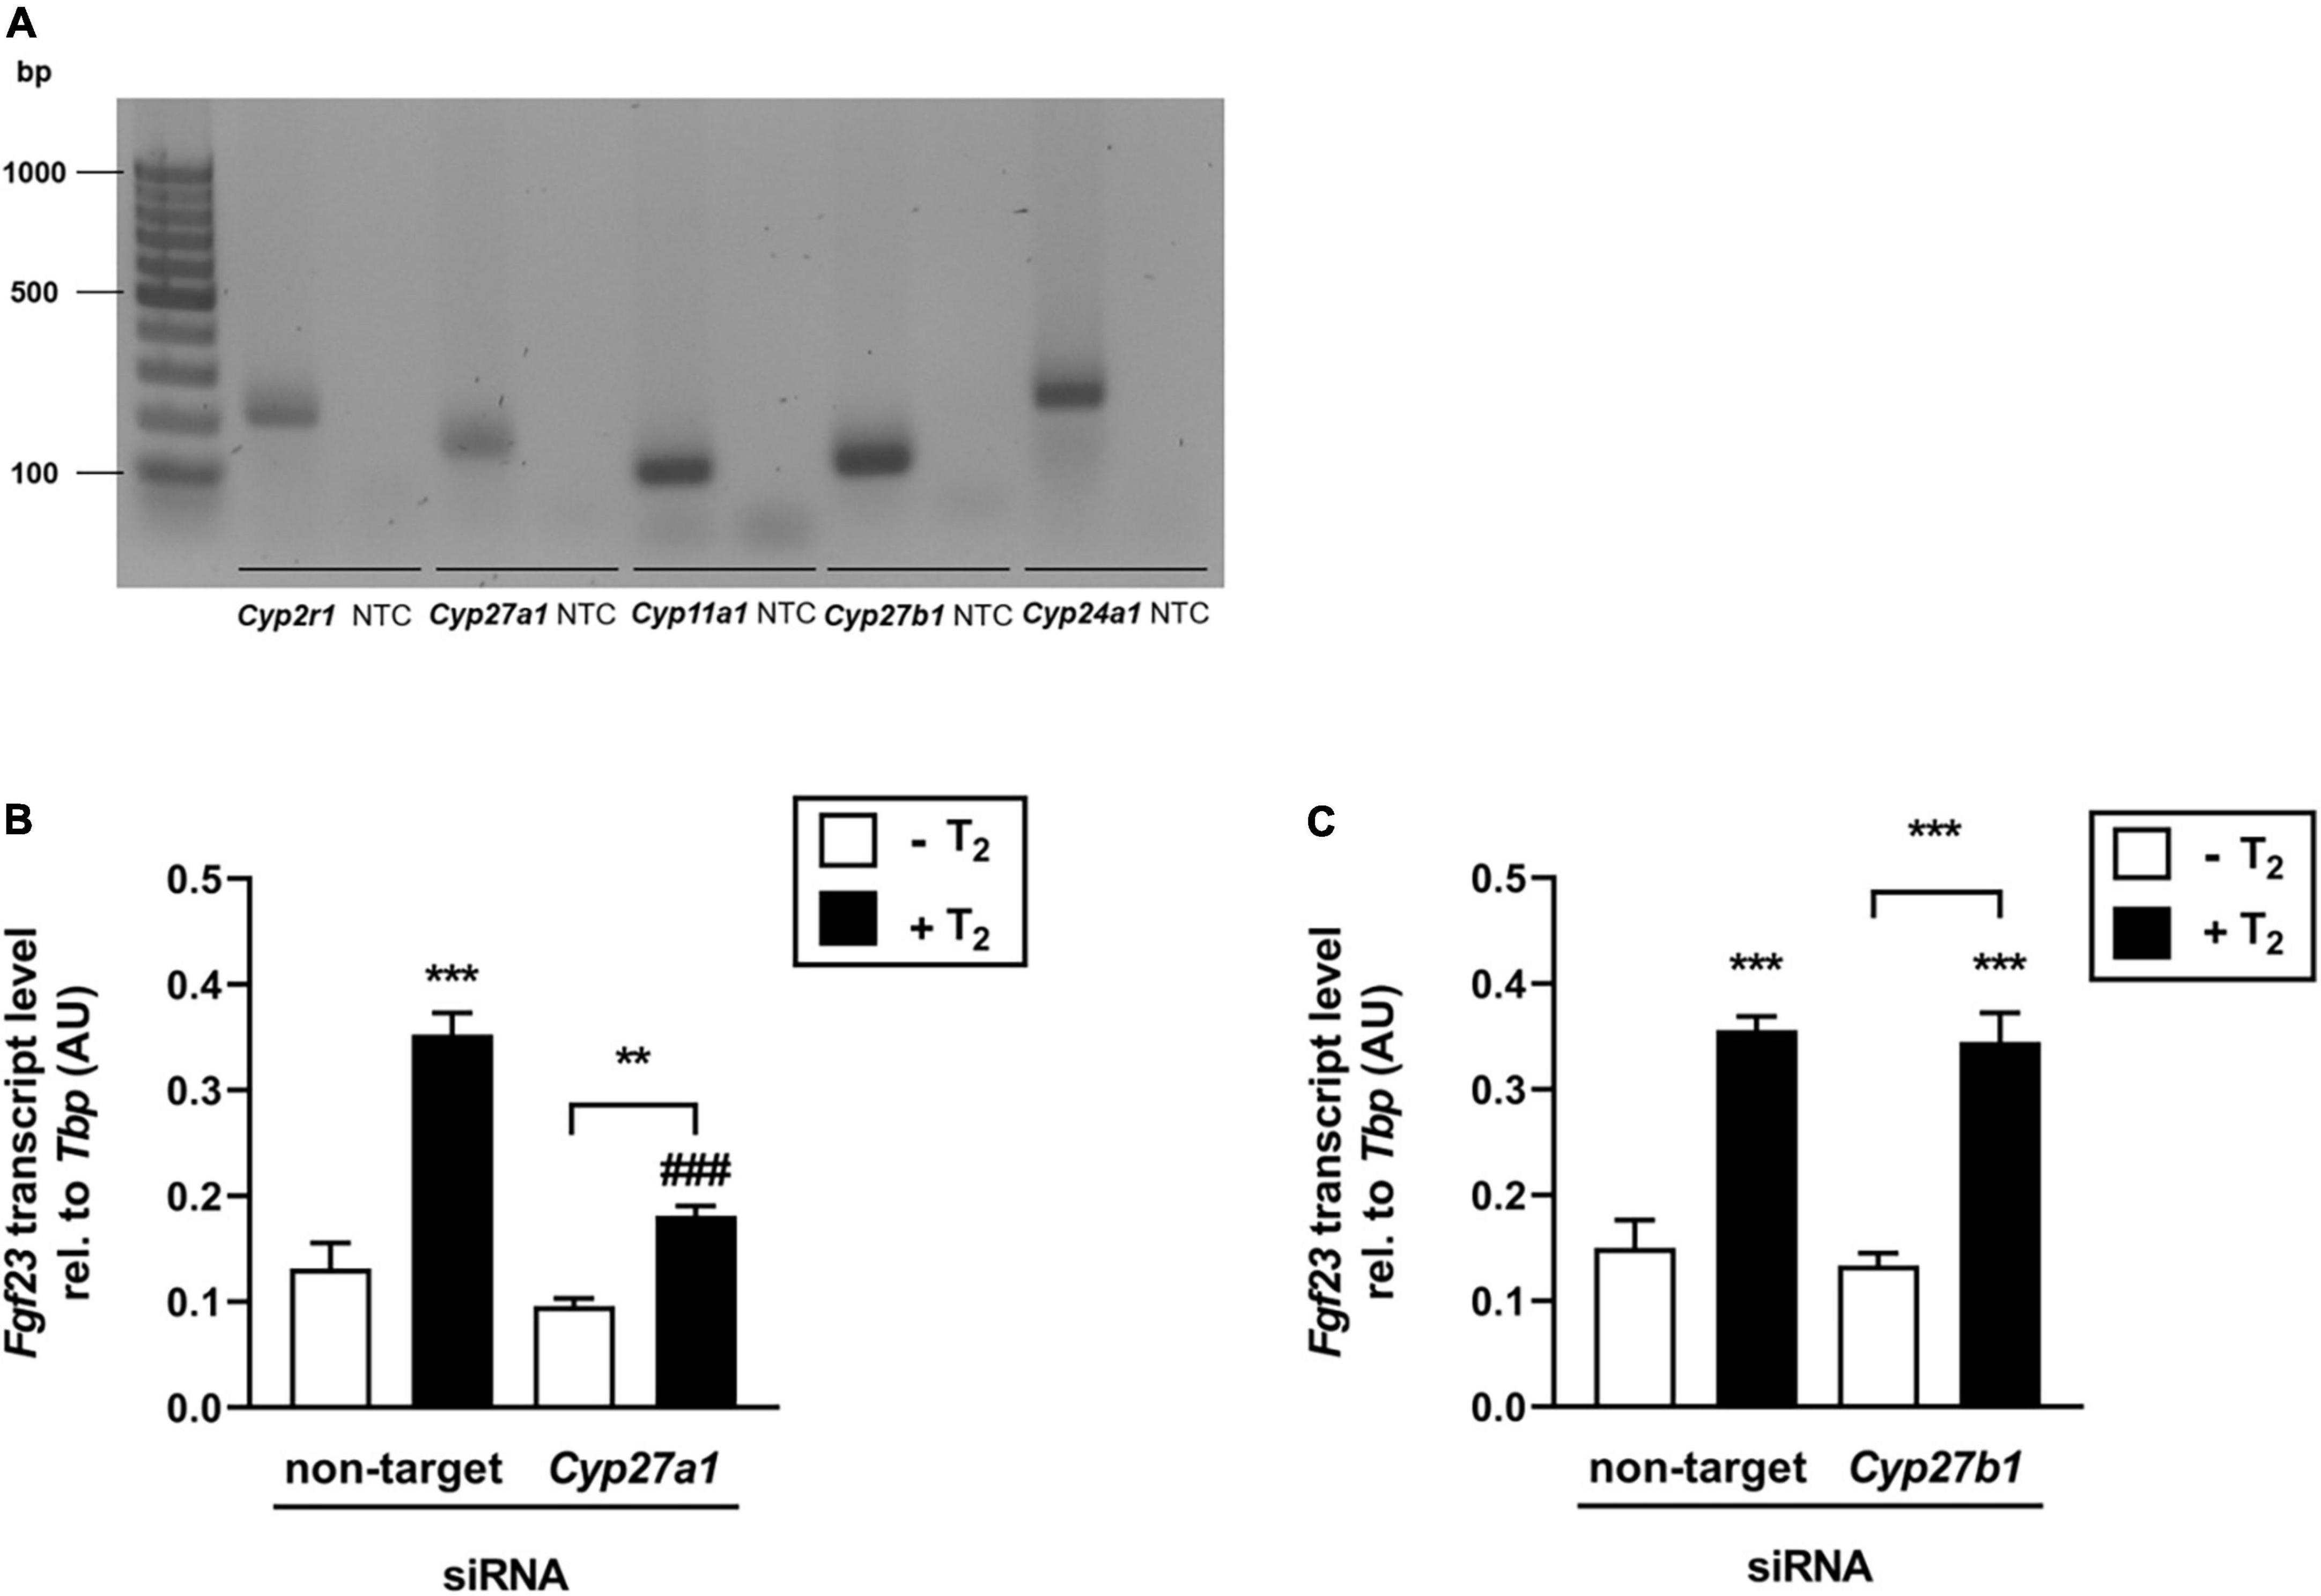
Figure 4. The effect of tachysterol2 on Fgf23 transcription is at least partially dependent on Cyp27a1. (A) Original agarose gel photograph showing amplified Cyp2r1-, Cyp27a1-, Cyp11a1-, Cyp27b1- or Cyp24a1-specific cDNA in untreated UMR106 cells. (B,C) Arithmetic means ± SEM of relative (rel.) Fgf23 mRNA abundance (normalized to Tbp) in UMR106 cells incubated with non-targeting or Cyp27a1-specific (B, 100 nM, 96 h, n = 6) or Cyp27b1-specific (C, 100 nM, 96 h, n = 6) siRNA in the absence (white bars) or presence (black bars) of T2 (25 μM, 24 h). Treatment with Cyp27a1-specific or Cyp27b1-specific siRNA resulted in a 53% reduction of relative Cyp27a1 mRNA (B,C) 50% reduction of relative Cyp27b1 mRNA expression compared to non-targeting siRNA as control. **p < 0.01 and ***p < 0.001 indicate significant differences from control. ###p < 0.001 indicates a significant difference from the absence of Cyp27a1-specific siRNA (2nd vs. 4th bar). bp, base pairs; NTC, non-template control; AU, arbitrary units (B,C one-way ANOVA).
Discussion
UV-B irradiation of baker’s yeast and mushrooms with high ergosterol content is used to enrich vitamin D2 content, making them alternative plant- and fungus-based vitamin D sources (2, 3, 5, 9, 37, 38). However, during UV-B irradiation and vitamin D2 synthesis, the photoproducts T2 and L2 are also generated (9, 27). The photoisomers tachysterol3 (T3) and lumisterol3 (L3) are also formed in human skin during the conversion of 7-dehydrocholesterol to vitamin D3, but their entry into the circulation is considered negligible (39). There are only a few studies addressing the absorption, metabolism or biological activity of photoisomers from food in mammals (6). In the scientific assessment conducted by the EFSA, tachysterol was not included in the product specification and safety due to the low concentrations of tachysterol in the consumable bread product which included UV-B-irradiated baker’s yeast (3).
Notably, this study provides novel evidence that orally administered T2 can be absorbed and affect vitamin D metabolism in mice and potentially stimulates the synthesis of the phosphaturic hormone FGF23 in bone cells.
The apparent intestinal absorption of oral T2, shown by considerable increases in T2 in the circulation and tissues of mice, is consistent with data showing that L2, another photoisomer produced by UV-B exposure of foods (26, 27), can enter the body after oral intake (10). Interestingly, the observed reduction in plasma 1,25(OH)2D levels, the increased mRNA abundance of renal Cyp24a1 and the trend toward lower mRNA abundance of renal Cyp27b1 in mice fed 4 mg/kg T2 demonstrates the potential of T2 to affect vitamin D metabolism in a way similar to the recently found effects of L2 (10). Based on the current data that indicate an up-regulation of Cyp24a1, the key enzyme responsible for the catabolism of active vitamin D, and a down-regulation of Cyp27b1 which hydroxylates 25(OH)D to 1,25(OH)2D (40, 41), it is tempting to speculate that the observed decrease in plasma 1,25(OH)2D levels in T2-fed mice is the result of an accelerated degradation and decreased synthesis of this hormone. In addition, the higher calcium concentration in the plasma of T2-fed mice in comparison to control mice, suggests that T2 has calcitriol-like effects, which can compensate for the reduced 1,25(OH)2D levels.
1,25(OH)2D is a systemic stimulator of FGF23 synthesis mainly in bone (42). Because 1,25(OH)2D was affected by T2, we hypothesized that the mRNA abundance of Fgf23 in the femur and tibia of T2-supplemented mice could have changed. Unexpectedly, mice fed T2 had moderately higher Fgf23 transcript levels (p = 0.071) in their bones than the control group, despite their marked reduction in circulating 1,25(OH)2D. These findings indicate that T2 or T2-metabolites are likely to have direct effects on Fgf23 gene expression in bone, which are independent of the 1,25(OH)2D action. This hypothesis was tested using UMR106 osteoblast-like cells that were treated with increasing concentrations of T2 and IDG-SW3 osteocytes. The data further show very impressively that T2 can stimulate the gene expression of Fgf23, and in turn the subsequent release of intact Fgf23 protein by Galnt3, the catalytic enzyme which is required for secretion of intact FGF23 (35).
Because T3, which is formed in skin via UV-B exposure (39), has been shown to bind to VDR albeit with low affinity (36), it was hypothesized that T2 could have mediated its stimulatory effect on FGF23 by acting as a vitamin D receptor agonist. The increase in the mRNA abundance of downstream targets of 1,25(OH)2D-VDR, namely, the Spp1 and Alpl genes, indicated VDR-mediated action of T2. Moreover, T2 strongly induced Vdr translocation into the nucleus, indicating a potential binding and activation of the transcription factor by T2. T2 also induced increased intracellular Vdr protein levels. This phenomenon is also reported for 1,25(OH)2D which induces not only the translocation of VDR from cytosol to the nucleus but also the expression of VDR, the stabilization of VDR mRNA and the protection of VDR protein from degradation (43). It is therefore likely that T2 had increased the intracellular Vdr levels by similar mechanisms as those described for 1,25(OH)2D. Additionally, the siRNA-mediated knockdown of Vdr in UMR106 cells, weakened the effect of T2 on Fgf23 gene expression. Thus, it can be concluded that T2 stimulates FGF23 synthesis, at least in part, via the activation of VDR. This mechanism is similar to the well-known effect of 1,25(OH)2D, which stimulates Fgf23 expression via the VDR and binding at vitamin D responsive element (VDRE) in the promotor region of FGF23 (44). However, Fgf23 gene expression was higher in cells treated with both Vdr-specific siRNA and T2 than in cells treated with Vdr-specific siRNA alone, suggesting that T2 may also act through other signaling pathways. Considering that protein kinase C (PKC) induces Fgf23 gene expression in UMR106 cells (45) and that 1,25(OH)2D3 has also been shown to stimulate PKC in these cells (46), it is tempting to speculate that T2 or T2-metabolites, similar to 1,25(OH)2D3, may mediate non-genomic (VDRE-independent) activation of PKC that stimulates Fgf23 gene expression in a VDR-independent manner.
Next, we were interested in the bioactive form of T2 and the question of whether non-hydroxylated or hydroxylated T2 derivatives were responsible for the stimulated FGF23 synthesis. We hypothesized that hydroxylated T2 would have a greater potential to stimulate FGF23 than native T2, because published data on T3 found a 1000-fold higher binding affinity of 25-hydroxylated T3 derivatives than of non-hydroxylated compounds (36). Different types of cells, such as enterocytes, hepatocytes, keratinocytes, and kidney cells, express cytochrome P450 (CYP) enzymes, which are necessary for the hydroxylation of D vitamers (40). Here, we found that UMR106 cells can also express these types of enzymes, suggesting that T2 can be converted to hydroxy-T2 derivatives. To elucidate whether enzymes mediating 25-hydroxylation or 1,25-hydroxylation are crucial for the bioactivity of T2, siRNA-mediated knockdown of Cyp27a1 and Cyp27b1 was induced in UMR106 cells. Unexpectedly, we found that Cyp27a1 but not Cyp27b1 was necessary to synthesize T2 derivatives that stimulate Fgf23 expression. Our results suggest that T2 is metabolized in UMR106 cells and that hydroxylation of T2 modulates its biological activity, although 25-hydroxylation of T2 via Cyp27a1 appears to be more important than metabolism via Cyp27b1 for this purpose. This means that CYP27B1, which is usually pivotal to synthesizing the VDR-stimulating vitamin D hormone (40), does not play a crucial role in the generation of bioactive T2. The current findings corroborate data that showed that synthetic dihydrotachysterol3 (DHT3), a synthetic reduction product of T3, is less effective in the bone mobilization of minerals to elevate plasma Ca2+ than synthetic 25-hydroxy-DHT3 [25(OH)DHT3] (47). In addition, 25(OH)DHT3 was shown to be only 2.5 and 25 times less active than 1,25(OH)2DHT3 or 1,25(OH)2D3, respectively, in inducing reporter gene expression in COS-1 cells transfected with a VDRE-GH reporter expression system (48). Notably, Fgf23 gene expression was higher in cells treated with both T2 and Cyp27a1-specific siRNA than in cells treated with Cyp27a1-specific siRNA alone. These findings indicate of the involvement of other 25-hydroxy enzymes, such as CYP2R1 or CYP11A1 (40, 49), which, according to our results, are also expressed in UMR106 cells and thus may also be involved in the metabolization of T2.
In the safety assessment of UV-B irradiated foods such as baker’s yeast or mushrooms, the focus is primarily on the amounts of D2 formed, but the equally detectable, albeit smaller, amounts of tachysterol in these foods have thus far been neglected for this purpose (3, 4). In view of the steady increase in the worldwide consumption of mushrooms (50) and thus the possibly increased consumption of UV-irradiated mushrooms, the novel results of this study give reason to reconsider this assessment. Strikingly, our data show that orally administered photoisomer T2 enters the body, becomes biologically active, and interferes with vitamin D metabolism in mice, which is consistent with results from a previous study of the photoisomer L2 (10). Furthermore, our experiments show the importance of the metabolism and resulting activation of T2 as a substrate of CYP enzymes, which are also central for the hydroxylation of D vitamers. Notably, this study showed that T2 stimulated the synthesis of biologically active Fgf23 in bone cells. There is increasing evidence of pathological effects of dysregulated FGF23 levels, such as induction of left ventricular hypertrophy, cardiac fibrosis, and dysfunction, and FGF23 is therefore discussed as a risk factor and biomarker for cardiovascular disease (16). In view of our findings, the consumption safety of UV-irradiated foods may need to be reconsidered due to the formation during manufacture of photoisomers such as T2 which show absorption and metabolism to potentially active metabolites.
To conclude, oral T2 can enter the body and is a potent regulator of Fgf23 production in bone cells. Based on the current findings, the effect of T2 appears to be mediated largely via Vdr and requires, at least in part, the metabolism of T2 by Cyp27a1. Due to the potential of T2 to induce 1,25(OH)2D degradation, activate VDR, and increase FGF23, which is associated with cardiovascular diseases, the safety of UV-B-treated foods is questionable.
Data availability statement
The raw data supporting the conclusions of this article will be made available by the authors, without undue reservation.
Ethics statement
The animal study was reviewed and approved by the Committee for Animal Welfare of Martin Luther University Halle-Wittenberg (approval number: H1-4/T1-20).
Author contributions
FE: conceptualization, formal analysis, investigation, methodology, visualization, project administration, and writing—original draft, review and editing. JK and FH: formal analysis, methodology, and investigation. SP: investigation. MFe: formal analysis. MFö: supervision, resources, and writing—review and editing. GS: conceptualization, resources, funding acquisition, project administration, supervision, and writing—original draft, review and editing. All authors contributed to the article and approved the submitted version.
Funding
This work was supported by the Federal Ministry of Education and Research (Grant No. 01EA1808C).
Acknowledgments
We thank H. Giese, S. Ross, and F. Reipsch for technical help.
Conflict of interest
The authors declare that the research was conducted in the absence of any commercial or financial relationships that could be construed as a potential conflict of interest.
Publisher’s note
All claims expressed in this article are solely those of the authors and do not necessarily represent those of their affiliated organizations, or those of the publisher, the editors and the reviewers. Any product that may be evaluated in this article, or claim that may be made by its manufacturer, is not guaranteed or endorsed by the publisher.
References
1. Lips P, Cashman KD, Lamberg-Allardt C, Bischoff-Ferrari HA, Obermayer-Pietsch B, Bianchi ML, et al. Current vitamin D status in European and Middle East countries and strategies to prevent vitamin D deficiency: a position statement of the European calcified tissue society. Eur J Endocrinol. (2019) 180:23–54. doi: 10.1530/EJE-18-0736
2. Taofiq O, Fernandes Â, Barros L, Barreiro MF, Ferreira ICFR. UV-irradiated mushrooms as a source of vitamin D 2 a review. Trends Food Sci Technol. (2017) 70:82–94. doi: 10.1016/j.tifs.2017.10.008
3. Efsa Panel on Dietetic Products, Nutrition and Allergies [Nda]. Scientific opinion on the safety of vitamin D-enriched UV-treated baker’s yeast. EFS2. (2014) 12:3520. doi: 10.2903/j.efsa.2014.3520
4. Turck D, Castenmiller J, Henauw SD, Hirsch−Ernst K−I, Kearney J, Maciuk A, et al. Safety of vitamin D2 mushroom powder as a novel food pursuant to regulation (EU) 2015/2283. EFSA J. (2020) 18:5948. doi: 10.2903/j.efsa.2020.5948
5. Cardwell G, Bornman JF, James AP, Black LJA. Review of mushrooms as a potential source of dietary Vitamin D. Nutrients. (2018) 10:1498. doi: 10.3390/nu10101498
6. Schümmer T, Stangl GI, Wätjen W. Safety assessment of Vitamin D and Its photo-isomers in UV-irradiated baker’s yeast. Foods. (2021) 10:3142. doi: 10.3390/foods10123142
7. Jasinghe VJ, Perera CO. Ultraviolet irradiation: the generator of Vitamin D2 in edible mushrooms. Food Chem. (2006) 95:638–43. doi: 10.1016/j.foodchem.2005.01.046
8. Jasinghe VJ, Perera CO, Sablani SS. Kinetics of the conversion of ergosterol in edible mushrooms. J Food Eng. (2007) 79:864–9. doi: 10.1016/j.jfoodeng.2006.01.085
9. Keegan R-JH, Lu Z, Bogusz JM, Williams JE, Holick MF. Photobiology of vitamin D in mushrooms and its bioavailability in humans. Dermatoendocrinology. (2013) 5:165–76. doi: 10.4161/derm.23321
10. Kotwan J, Kühn J, Baur AC, Stangl GI. Oral intake of lumisterol affects the metabolism of Vitamin D. Mol Nutr Food Res. (2021) 65:e2001165. doi: 10.1002/mnfr.202001165
11. Rausch S, Föller M. The regulation of FGF23 under physiological and pathophysiological conditions. Pflugers Arch. (2022) 474:281–92. doi: 10.1007/s00424-022-02668-w
12. Andrukhova O, Zeitz U, Goetz R, Mohammadi M, Lanske B, Erben RG. FGF23 acts directly on renal proximal tubules to induce phosphaturia through activation of the ERK1/2-SGK1 signaling pathway. Bone. (2012) 51:621–8. doi: 10.1016/j.bone.2012.05.015
13. Shimada T, Hasegawa H, Yamazaki Y, Muto T, Hino R, Takeuchi Y, et al. FGF-23 is a potent regulator of vitamin D metabolism and phosphate homeostasis. J Bone Miner Res. (2004) 19:429–35. doi: 10.1359/JBMR.0301264
14. Erben RG, Andrukhova O. FGF23-Klotho signaling axis in the kidney. Bone. (2017) 100:62–8. doi: 10.1016/j.bone.2016.09.010
15. Bacchetta J, Bardet C, Prié D. Physiology of FGF23 and overview of genetic diseases associated with renal phosphate wasting. Metabolism. (2020) 103S:153865. doi: 10.1016/j.metabol.2019.01.006
16. Vázquez-Sánchez S, Poveda J, Navarro-García JA, González-Lafuente L, Rodríguez-Sánchez E, Ruilope LM, et al. An overview of FGF-23 as a novel candidate biomarker of cardiovascular risk. Front Physiol. (2021) 12:632260. doi: 10.3389/fphys.2021.632260
17. Masuyama R, Stockmans I, Torrekens S, van Looveren R, Maes C, Carmeliet P, et al. Vitamin D receptor in chondrocytes promotes osteoclastogenesis and regulates FGF23 production in osteoblasts. J Clin Invest. (2006) 116:3150–9. doi: 10.1172/JCI29463
18. Bär L, Feger M, Fajol A, Klotz L-O, Zeng S, Lang F, et al. Insulin suppresses the production of fibroblast growth factor 23 (FGF23). Proc Natl Acad Sci USA. (2018) 115:5804–9. doi: 10.1073/pnas.1800160115
19. Durlacher-Betzer K, Hassan A, Levi R, Axelrod J, Silver J, Naveh-Many T. Interleukin-6 contributes to the increase in fibroblast growth factor 23 expression in acute and chronic kidney disease. Kidney Int. (2018) 94:315–25. doi: 10.1016/j.kint.2018.02.026
20. Daryadel A, Bettoni C, Haider T, Imenez Silva PH, Schnitzbauer U, Pastor-Arroyo EM, et al. Erythropoietin stimulates fibroblast growth factor 23 (FGF23) in mice and men. Pflugers Arch. (2018) 470:1569–82. doi: 10.1007/s00424-018-2171-7
21. Egli-Spichtig D, Imenez Silva PH, Glaudemans B, Gehring N, Bettoni C, Zhang MY, et al. Tumor necrosis factor stimulates fibroblast growth factor 23 levels in chronic kidney disease and non-renal inflammation. Kidney Int. (2019) 96:890–905. doi: 10.1016/j.kint.2019.04.009
22. Glosse P, Feger M, Mutig K, Chen H, Hirche F, Hasan AA, et al. AMP-activated kinase is a regulator of fibroblast growth factor 23 production. Kidney Int. (2018) 94:491–501. doi: 10.1016/j.kint.2018.03.006
23. Ewendt F, Feger M, Föller M. Myostatin regulates the production of fibroblast growth factor 23 (FGF23) in UMR106 osteoblast-like cells. Pflugers Arch. (2021) 473:969–76. doi: 10.1007/s00424-021-02561-y
24. Ewendt F, Hirche F, Feger M, Föller M. Peroxisome proliferator-activated receptor α (PPARα)-dependent regulation of fibroblast growth factor 23 (FGF23). Pflugers Arch. (2020) 472:503–11. doi: 10.1007/s00424-020-02363-8
25. National Research Council [US], Institute for Laboratory Animal Research [US], National Academies Press [US]. Guide for the Care and use of Laboratory Animals. Washington, DC: National Academies Press (2011). 220 p.
26. Wittig M, Krings U, Berger RG. Single-run analysis of vitamin D photoproducts in oyster mushroom (Pleurotus ostreatus) after UV-B treatment. J Food Compos Anal. (2013) 31:266–74. doi: 10.1016/j.jfca.2013.05.017
27. Kalaras MD, Beelman RB, Holick MF, Elias RJ. Generation of potentially bioactive ergosterol-derived products following pulsed ultraviolet light exposure of mushrooms (Agaricus bisporus). Food Chem. (2012) 135:396–401. doi: 10.1016/j.foodchem.2012.04.132
28. National Academies Press [Us]. Nutrient Requirements of Laboratory Animals. 4th Revised ed. Washington, DC: National Academies Press (1995).
29. Higashi T, Shibayama Y, Fuji M, Shimada K. Liquid chromatography-tandem mass spectrometric method for the determination of salivary 25-hydroxyvitamin D3: a noninvasive tool for the assessment of vitamin D status. Anal Bioanal Chem. (2008) 391:229–38. doi: 10.1007/s00216-007-1780-3
30. Mattila PH, Piironen VI, UusiRauva EJ, Koivistoinen PE. Contents of cholecalciferol, ergocalciferol, and their 25- hydroxylated metabolites in milk products and raw meat and liver as determined by HPLC. J Agric Food Chem. (1995) 43:2394–9.
31. Kühn J, Hirche F, Geissler S, Stangl GI. Oral intake of 7-dehydrocholesterol increases vitamin D3 concentrations in the liver and kidney. J Steroid Biochem Mol Biol. (2016) 164:199–204. doi: 10.1016/j.jsbmb.2015.12.017
32. Kiourtzidis M, Kühn J, Schutkowski A, Baur AC, Hirche F, Stangl GI. Inhibition of niemann-pick C1-like protein 1 by ezetimibe reduces uptake of deuterium-labeled vitamin D in mice. J Steroid Biochem Mol Biol. (2020) 197:105504. doi: 10.1016/j.jsbmb.2019.105504
33. Schmittgen TD, Livak KJ. Analyzing real-time PCR data by the comparative C(T) method. Nat Protoc. (2008) 3:1101–8. doi: 10.1038/nprot.2008.73
34. Baur AC, Kühn J, Brandsch C, Hirche F, Stangl GI. Intake of ergosterol increases the vitamin D concentrations in serum and liver of mice. J Steroid Biochem Mol Biol. (2019) 194:105435. doi: 10.1016/j.jsbmb.2019.105435
35. Kato K, Jeanneau C, Tarp MA, Benet-Pagès A, Lorenz-Depiereux B, Bennett EP, et al. Polypeptide GalNAc-transferase T3 and familial tumoral calcinosis. Secretion of fibroblast growth factor 23 requires O-glycosylation. J Biol Chem. (2006) 281:18370–7. doi: 10.1074/jbc.M602469200
36. Chen TC, Persons KS, Lu Z, Mathieu JS, Holick MF. An evaluation of the biologic activity and vitamin D receptor binding affinity of the photoisomers of vitamin D3 and previtamin D3. J Nutr Biochem. (2000) 11:267–72. doi: 10.1016/S0955-2863(00)00077-2
37. Pinto JM, Merzbach V, Willmott AG, Antonio J, Roberts J. Assessing the impact of a mushroom-derived food ingredient on vitamin D levels in healthy volunteers. J Int Soc Sports Nutr. (2020) 17:54. doi: 10.1186/s12970-020-00387-0
38. Urbain P, Singler F, Ihorst G, Biesalski H-K, Bertz H. Bioavailability of vitamin D2 from UV-B-irradiated button mushrooms in healthy adults deficient in serum 25-hydroxyvitamin D: a randomized controlled trial. Eur J Clin Nutr. (2011) 65:965–71. doi: 10.1038/ejcn.2011.53
39. Holick MF, MacLaughlin JA, Doppelt SH. Regulation of cutaneous previtamin D3 photosynthesis in man: skin pigment is not an essential regulator. Science. (1981) 211:590–3. doi: 10.1126/science.6256855
40. Jones G, Prosser DE, Kaufmann M. Cytochrome P450-mediated metabolism of vitamin D. J Lipid Res. (2014) 55:13–31. doi: 10.1194/jlr.R031534
41. St-Arnaud R, Arabian A, Travers R, Barletta F, Raval-Pandya M, Chapin K, et al. Deficient mineralization of intramembranous bone in vitamin D-24-hydroxylase-ablated mice is due to elevated 1,25-dihydroxyvitamin D and not to the absence of 24,25-dihydroxyvitamin D. Endocrinology. (2000) 141:2658–66. doi: 10.1210/endo.141.7.7579
42. Kolek OI, Hines ER, Jones MD, LeSueur LK, Lipko MA, Kiela PR, et al. 1alpha,25-Dihydroxyvitamin D3 upregulates FGF23 gene expression in bone: the final link in a renal-gastrointestinal-skeletal axis that controls phosphate transport. Am J Physiol Gastrointest Liver Physiol. (2005) 289:G1036–42. doi: 10.1152/ajpgi.00243.2005
43. Kongsbak M, Levring TB, Geisler C, von Essen MR. The vitamin d receptor and T cell function. Front Immunol. (2013) 4:148. doi: 10.3389/fimmu.2013.00148
44. Liu S, Tang W, Zhou J, Stubbs JR, Luo Q, Pi M, et al. Fibroblast growth factor 23 is a counter-regulatory phosphaturic hormone for vitamin D. J Am Soc Nephrol. (2006) 17:1305–15. doi: 10.1681/ASN.2005111185
45. Bär L, Hase P, Föller M. PKC regulates the production of fibroblast growth factor 23 (FGF23). PLoS One. (2019) 14:e0211309. doi: 10.1371/journal.pone.0211309
46. Cheung R, Erclik MS, Mitchell J. 1,25-dihydroxyvitamin D(3) stimulated protein kinase C phosphorylation of type VI adenylyl cyclase inhibits parathyroid hormone signal transduction in rat osteoblastic UMR 106-01 cells. J Cell Biochem. (2005) 94:1017–27. doi: 10.1002/jcb.20366
47. Suda T, Hallick RB, DeLuca HF, Schnoes HK. 25-hydroxydihydrotachysterol. Synthesis and biological activity. Biochemistry. (1970) 9:1651–7. doi: 10.1021/bi00810a001
48. Qaw F, Calverley MJ, Schroeder NJ, Trafford DJ, Makin HL, Jones G. In vivo metabolism of the vitamin D analog, dihydrotachysterol. Evidence for formation of 1 alpha,25- and 1 beta,25-dihydroxy-dihydrotachysterol metabolites and studies of their biological activity. J Biol Chem. (1993) 268:282–92. doi: 10.1016/S0021-9258(18)54147-8
49. Slominski RM, Raman C, Elmets C, Jetten AM, Slominski AT, Tuckey RC. The significance of CYP11A1 expression in skin physiology and pathology. Mol Cell Endocrinol. (2021) 530:111238. doi: 10.1016/j.mce.2021.111238
Keywords: UV-B irradiation, food fortification, photoisomer, vitamin D receptor, calcium, phosphate
Citation: Ewendt F, Kotwan J, Ploch S, Feger M, Hirche F, Föller M and Stangl GI (2022) Tachysterol2 increases the synthesis of fibroblast growth factor 23 in bone cells. Front. Nutr. 9:948264. doi: 10.3389/fnut.2022.948264
Received: 19 May 2022; Accepted: 06 July 2022;
Published: 25 July 2022.
Edited by:
Holger Steinbrenner, Friedrich Schiller University Jena, GermanyReviewed by:
Marc Wein, Massachusetts General Hospital and Harvard Medical School, United StatesBram van der Eerden, Erasmus Medical Center, Netherlands
Copyright © 2022 Ewendt, Kotwan, Ploch, Feger, Hirche, Föller and Stangl. This is an open-access article distributed under the terms of the Creative Commons Attribution License (CC BY). The use, distribution or reproduction in other forums is permitted, provided the original author(s) and the copyright owner(s) are credited and that the original publication in this journal is cited, in accordance with accepted academic practice. No use, distribution or reproduction is permitted which does not comply with these terms.
*Correspondence: Franz Ewendt, ZnJhbnouZXdlbmR0QGxhbmR3LnVuaS1oYWxsZS5kZQ==