 Darya Khosravinia1
 Farideh Shiraseb2Atieh Mirzababaei2*
 Elnaz Daneshzad3Shahin Jamili4
 Cain C. T. Clark5
 Khadijeh Mirzaei2,6*
- 1Department of Nutrition, Science and Research Branch, Islamic Azad University, Tehran, Iran
- 2Department of Community Nutrition, School of Nutritional Sciences and Dietetics, Tehran University of Medical Sciences, Tehran, Iran
- 3Non-Communicable Diseases Research Center, Alborz University of Medical Sciences, Karaj, Iran
- 4Department of Surgery, Shahid Beheshti, Fellowship of Minimally Invasive Surgery, Tehran, Iran
- 5Centre for Intelligent Healthcare, Coventry University, Coventry, United Kingdom
- 6Food Microbiology Research Center, Tehran University of Medical Sciences, Tehran, Iran
Purpose: Diet is one of the most important factors influencing cardiovascular disease (CVD). The negative relationship between carbohydrate intake with lipid profiles and body weight has been previously investigated. However, this is the first study seeking to assess the association of carbohydrate quality index (CQI) with CVD risk factors.
Methods: This cross-sectional study was conducted on 291 Iranian overweight and obese women, with a body mass index (BMI) ranging between 25 and 40 kg/m2, and aged 18–48 years. CQI scores were calculated by using a validated 168-item semi-quantitative food frequency questionnaire (FFQ). Biochemical and anthropometric measures were assessed using standard methods, and bioelectrical impedance was used to measure body composition.
Results: We observed that fruits (P < 0.001), vegetables (P < 0.001), and protein (P = 0.002) intake were higher in participants with a higher score of the CQI. When we adjusted for potential confounders, we observed that the CQI was negatively related to systolic blood pressure (SBP) (β = −6.10; 95% CI = −10.11, −2.10; P = 0.003) and DBP (β = −3.11; 95% CI = −6.15, −0.08; P = 0.04). Also, greater adherence to a high CQI dietary pattern, compared to the reference group, was negatively related to HOMA-IR (β = −0.53; 95% CI = −0.94, −0.12) (P for trend = 0.01), WC (β = −3.18; 95% CI = −6.26, −0.10) (P for trend = 0.04), BMI (β = −1.21; 95% CI = −2.50, 0.07) (P for trend = 0.06), and BF (β = −2.06; 95% CI = −3.82, −0.30) (P for trend = 0.02).
Conclusion: In line with previous studies, the CQI was inversely associated with blood pressure, WC, BMI, and BF. Further prospective and clinical trial studies are suggested to confirm these data.
Introduction
Obesity is one of the most profound medical problems in the world that increases the risk of other chronic diseases, such as cardiovascular disease, cancers, and diabetes (1). According to the World Health Organization (WHO), more than 1.9 billion adults, over 18 years, were overweight in 2016, and more than 650 million of them were obese (2, 3). It is estimated that, by 2030, 2.5 billion people will be overweight or obese (4, 5). Women appear to be more affected by the obesity epidemic than men, where this difference may be related to nutrition, lifestyle, behavior, sexual, and environmental differences (6, 7). Moreover, a higher risk of cardiovascular disease (CVD) in women has been observed, especially in women with obesity or overweight (8–10). Factors influencing the incidence and prevalence of obesity include genetic and environmental factors, such as lifestyle and eating habits (11, 12). Further diet is one of the most important factors influencing chronic inflammatory conditions (13).
Special diets have been suggested for the maintenance of optimal body weight. However, their results are controversial (14). Some studies have investigated the role of macronutrients, especially carbohydrates as the main source of energy by Iranians, in the development of obesity (14). Accordingly, low carbohydrate diets (LCD) were reported as a common weight-loss strategy (15). Interestingly, a systematic review showed no association between high carbohydrate intake with the risk of obesity (16). The results of one trial revealed that the LCD may reduce body mass and fat content (17); however, they did not consider the calorie intake and carbohydrate quality (18). The quality of dietary carbohydrates may be more important than their quantity in reducing the risk of CVD (19, 20). Also, one factor alone is insufficient to predict the association between carbohydrate intake with obesity risk, and so, carbohydrate quality should be determined by considering several important factors simultaneously (18). Thus, Carbohydrate Quality Index (CQI) was defined in which fiber intake, glycaemic index (GI), whole grains/total grains ratio, and solid carbohydrate/total carbohydrate ratio are calculated (21). In a cohort study, a negative relationship between CQI with obesity was shown (22). Another study proposed that CQI components, such as GI, significantly affected abdominal obesity (23). Moreover, a previous study concluded that fiber intake elicited weight-loss and body fat (BF) loss, compared to refined grains (24). Also, a low GI diet may be associated with a decrease in body fat mass (BFM) (25, 26).
The association between obesity with CVD in men was reportedly related to high blood pressure and cholesterol (27, 28). Thus, controlling these two factors can be effective in reducing the risk of CVD. The results of prospective cohort studies have shown that each 5 kg/m2 higher body mass index (BMI) is associated with a 27% higher risk of chronic heart disease (29). A cohort study showed an increment in high-density lipoprotein (HDL), low-density lipoprotein (LDL), triglyceride (TG), and total cholesterol (TC) in obese participants (30). Moreover, a meta-analysis demonstrated LCD can lead to a decrease in body weight, waist circumference (WC), BMI, TG, and blood pressure (31). A positive relationship between CQI with HDL levels was observed in a study (32). In a Mediterranean cohort study, an inverse relationship was observed between better CQI with the incidence of CVD (33). In another study, the CQI had a positive relationship with HDL levels, and a negative relationship with systolic blood pressure (SBP), diastolic blood pressure (DBP), TG, and WC (34).
Several mechanisms have been proposed for these relationships, including the association of high GI foods with hyperinsulinemia, increased fat storage, and reduced blood glucose fluctuations, which leads to increased appetite and food intake (35–37). Fiber intake decreases appetite through slowing stomach emptying and hormone signaling, and decreases postprandial insulin that increases lipid oxidation (38–42), whilst high liquid carbohydrate intake increases appetite and postprandial blood glucose and decreases insulin sensitivity (43, 44), and whole grains can reduce the digestion and absorption of starch and appetite (38, 45).
To our knowledge, there is no previous study investigating the relationship between CQI with CVD risk factors in Iranian women. Therefore, due to the high prevalence of CVD and its importance, we intended to determine the relationship between CQI and CVD risk factors among women with overweight and obesity.
Materials and methods
Study population
This cross-sectional study was conducted on 291 overweight and obese women, aged 18–48 y, who were recruited from health centers in Tehran, Iran. The BMI of women ranged between 25 and 40 kg/m2. Exclusion criteria included: history of any chronic diseases such as diabetes mellitus, hypertension, CVDs, liver or kidney diseases, taking all types of medicine including birth control pills, smoking, intake of alcohol, pregnancy, lactating women, post-menopause, body weight changes in the last year, weight-loss diets or an arbitrary special dietary regimen, and chronic disease that affected their diet. All participants signed a consent form before starting this study. Our study was approved by the local ethics committee of the Tehran University of Medical Sciences. The approval number was IR.TUMS.MEDICINE.REC.1400.182.
Assessment of dietary intake and CQI calculation
A reliable semi-quantitative food frequency questionnaire (FFQ) was used for obtaining the usual dietary intake of participants during the past year. This FFQ included 168 items, where standard portion size, and food frequency categories (daily, weekly, monthly, and yearly) for each food which was converted to grams per day using household measurements (46). This FFQ was collected with a face-to-face interview by a trained interviewer, and Nutritionist-4 software was used to analyze the data.
The area below the glycemic response curve for each participant based on the reference food was shown as a percentage of the average area under the curve, after each food. Food GI for all participants was calculated by mean of these values. White bread was used as a reference food. GI values were multiplied by 0.71 to convert the glucose scale (i.e., GI glucose = 100) (47). Total GI was estimated using the following formula: (GI × available carbohydrates)/total available carbohydrates. To calculate available carbohydrates, fiber was deducted from total carbohydrates, which were derived from the United States Department of Agriculture food composition databases (48).
CQI was computed by summing the following four criteria: dietary fiber intake (g per day), GI, the ratio of whole grains to total grains, and the ratio of solid carbohydrate to total carbohydrate. Total grains include whole grains, refined grains, and their products. For each of these four components, a score of 1–5 was considered. Finally, CQI is obtained and ranges from 4 to 20; participants were subsequently categorized into tertiles (28).
Anthropometric measurements and body composition analysis
Weight was measured on a digital scale, where participants were weighed with minimal clothing and without shoes, to the nearest 100 g. Participants' height was measured, without shoes, to the nearest 0.5 cm. WC and hip circumference (HC) were measured to the nearest 0.5 cm, according to standard procedures. Subsequently, waist-to-hip ratio (WHR) and BMI were calculated according to standard formulae. According to WHO guidelines, overweight and obesity were defined as 25 ≤ BMI ≤ 29.9 kg/m2 and BMI ≥ 30 kg/m2, respectively. Neck circumference (NC) was measured by the use of non-stretchable plastic tape, to the closest 1 mm, just underneath the laryngeal prominence perpendicular to the long axis of the neck with the head placed within the Frankfort horizontal aircraft (49). The body composition of participants was measured by a Body Composition Analyzer BC-418MA- In Body (United Kingdom), according to manufacturer guidelines. Participants were asked not to exercise, not to use any electrical devices, and not to consume excessive fluid or food before measuring the body composition, to prevent any discrepancies in the measured values.
Biochemical assessment
After 10–12 h of fasting at night, a blood sample was drawn and serum was collected into tubes containing 0.1% Ethylenediaminetetraacetic acid (EDTA). Then, they were centrifuged for 10 min at 3,000 rpm, aliquoted into 1 ml tubes, and stored at −70°C until analysis. Sample analysis was performed by using an autoanalyzer (Selectra 2; Vital Scientific, Spankeren, Netherlands). The FBS was measured by using the GOD/PAP (glucose oxidase phenol 4-Aminoantipyrine Peroxidase) method. The serum levels of HDL and LDL were determined by turbidimetry on a Roche Hitachi analyzer (Roche, Germany). The blood levels of TG and TC were determined by using an enzymatic technique and commercially available Pars Azmoon, Iran kits. Also, a high-sensitivity immunoturbidimetric assay (Hitachi 902 analyzer; Hitachi Ltd, Tokyo, Japan) was used to measure serum high-sensitivity C-reactive protein (hs-CRP). Furthermore, the homeostasis model assessment method was used to determine insulin resistance via the HOMA-IR formula as follows: fasting serum insulin (mlU/L) × FBS (mmol/L)/22.5 (50). HOMA-IR cut-off values > 2.63 are considered as the presence of insulin resistance (51).
Blood pressure assessment
The blood pressure of participants was measured by a standard mercury sphygmomanometer (ALPK2 k2-232; Japan), while the participants were sitting for 10–15 min, before performing two consecutive measurements. Two measurements were performed at 1 min intervals and the average was considered.
Physical activity
Participants' physical activity was assessed by the short form of the international physical activity questionnaire (IPAQ), according to the frequency and time of common activities of daily life over the past year. Physical activity levels were expressed as metabolic equivalent minutes per week (MET-minutes/week) (52) and were divided into categories as follows: very low (<600 MET-min/week), low (600–3,000 MET-min/week), moderate, and high (>3,000 MET-min/week) (53).
Assessment of other variables
A demographic questionnaire was used to collect information about age, marital status, education, occupation, economic status, and supplementation.
Statistical analysis
The minimum sample size was 152 people through the following formula and with a design effect of 1.5: n = (([(Z1−α + Z1−β) × √1 – r2]/r)2 + 2), which α = 0.05, β = 0.95, r = 0.3 (54). Quantitative variables were described as mean and standard deviation (SD) and categorical variables were described as numbers and percentages. The Kolmogorov-Smirnov test was used to check the distribution of data (P > 0.05, indication normal distribution). All statistical analyses were performed by SPSS software version 26, and P < 0.05 was considered to be statistically significant, and P = 0.05–0.07 was considered marginally significant. By use of the NOVA score, participants were categorized into tertiles. Individuals in tertile 1 were 103 (35.4%) with a threshold of <10, in tertile 2 were 99 (34%) with a threshold of 10–13, and 89 (30.6%) for tertile 3 with a threshold of >13. To compare the mean difference of quantitative variables and percent of categorical variables across NOVA tertiles, one-way analysis of variance (ANOVA) and chi-square (χ2) tests were performed, respectively. Analysis of covariance (ANCOVA), controlling for potential confounders (age, BMI, energy intake, and physical activity) and considering BMI as a collinear variable for anthropometric measures and body composition variables, was also conducted. Bonferroni post-hoc testing was done to identify the exact location of significant mean differences among tertiles, if necessary. Linear regression was conducted to determine the association between CQI and CVD risk factors. Model 1 was adjusted for age, BMI, energy intake, and physical activity, and Tertile 1 was considered as the exposure reference group. The results were reported as β, with a 95% confidence interval (95% CI).
Results
Study population
This cross-sectional study was conducted on 291 overweight and obese women, of whom, 72.2% were married, 97.9% were employed, 48.8% had a college education, and 23% had a poor economic level. The mean (SD) of age, weight, BMI, and WC of participants was 36.51 (8.51) years, 80.71 (12.22) kg, 31.05 (4.32) kg/m2, and 98.96 (10.04) cm, respectively. Also, the mean (SD) CQI of participants was 11.83 (3.12). Other main demographic quantitative and qualitative variables are shown in Table 1.
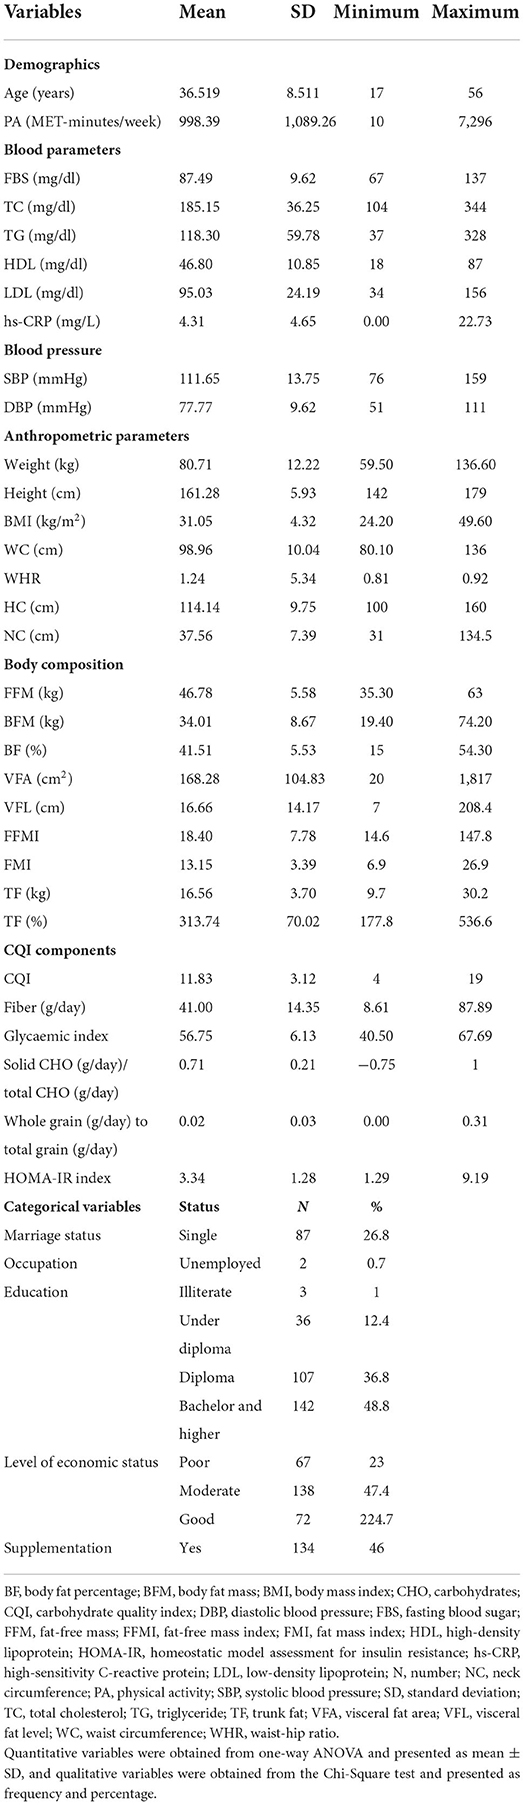
Table 1. General characteristics of the study participants (n = 291).
General characteristics of study participants among tertiles of the CQI
Based on Table 2, the participants with a higher score of CQI were older (P = 0.002). Although the participants with a higher score of CQI had a lower mean weight, there was no significant difference between the anthropometric measures and other general characteristics of participants across tertiles of CQI (P > 0.05).
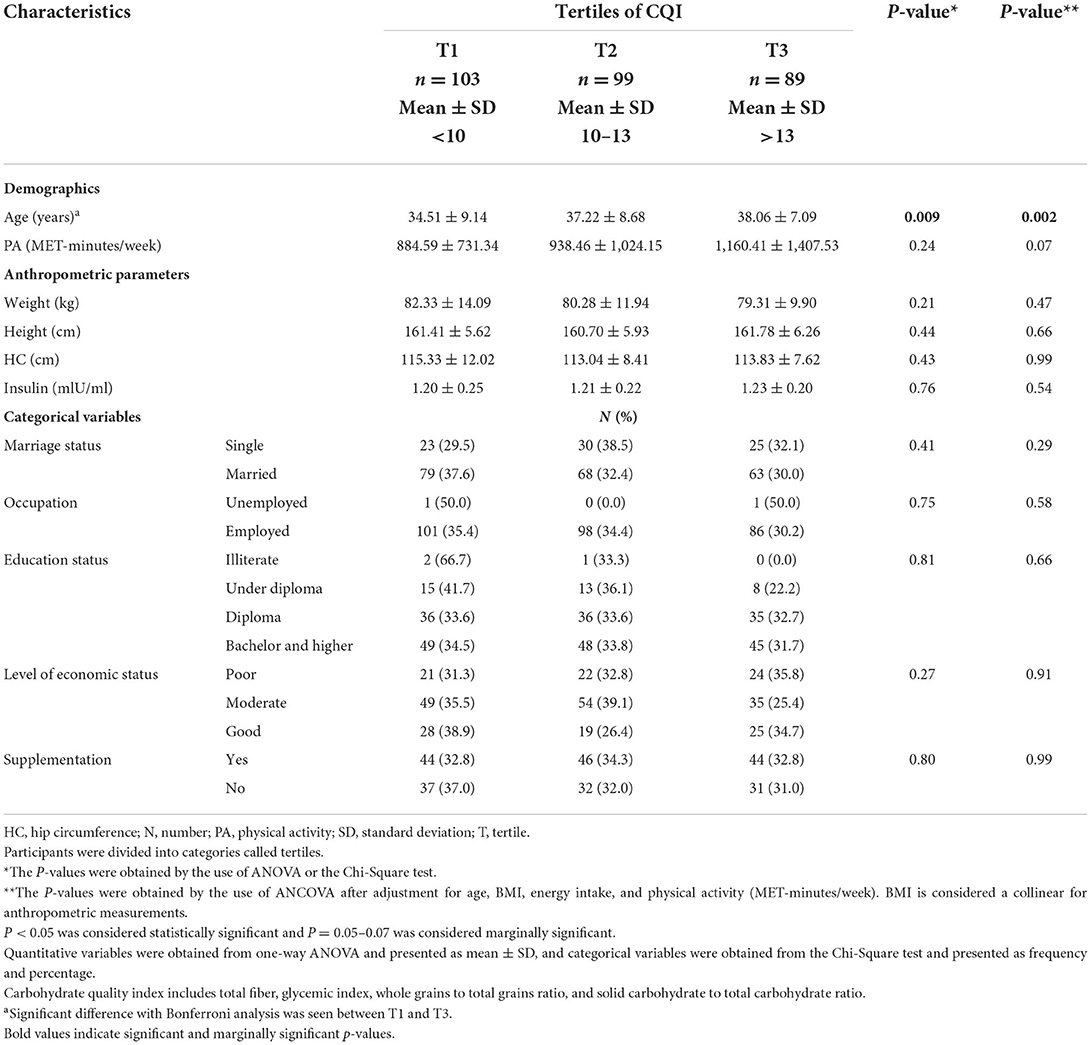
Table 2. General characteristics of study participants among tertiles of the CQI (n = 291).
Dietary intake of study participants among tertiles of the CQI
As shown in Table 3, energy (P = 0.01), protein (P = 0.002), and carbohydrate (P = 0.001) intake were higher in participants with a higher score of the CQI and total fat intake was lower after controlling for potential confounder (energy intake) (P < 0.001). participants with a higher score of CQI had a significantly lower intake of saturated fatty acids (SFA), and a higher intake of vegetables, legumes, whole grains, potassium, calcium, phosphorus, iron, magnesium, copper, vitamin K, vitamin B1, vitamin B2, vitamin B6, vitamin B8, and vitamin B9 consumption after adjusting for energy intake (P < 0.001). In addition, these differences were significant for fruits (P = 0.003), nuts (P = 0.06), total fiber (P = 0.01), zinc (P = 0.007), vitamin A (P = 0.001), vitamin C (P = 0.03), vitamin B3 (P = 0.003), and pantothenic acid (P = 0.01) intake. Monounsaturated fatty acids (MUFA) (P < 0.001), polyunsaturated fatty acids (PUFA) (P = 0.06), and linoleic acid (P = 0.04) intake were lower in participants with a higher score of CQI after energy intake controlling. However, there was no significant mean difference between the other dietary components intake of participants across tertiles of the CQI (P > 0.05).
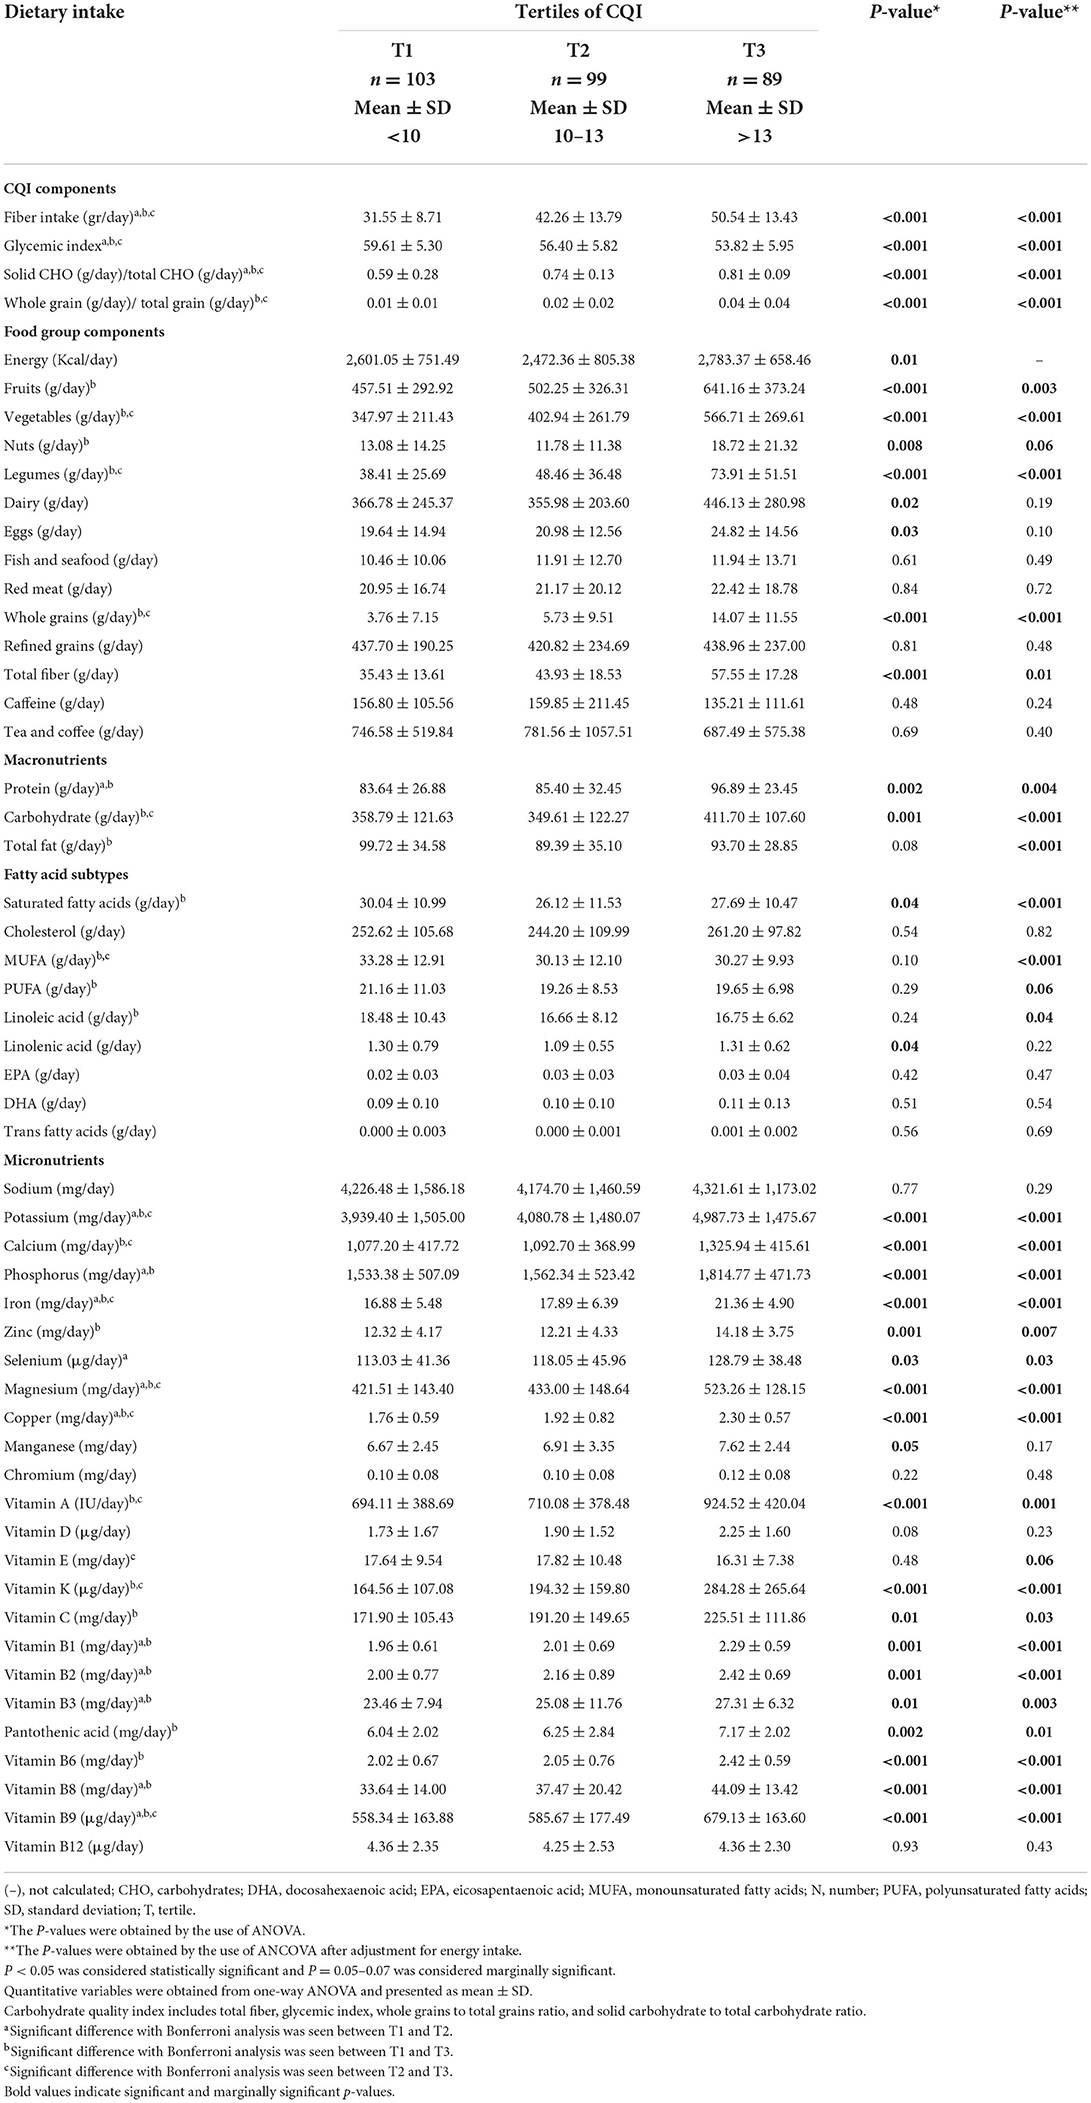
Table 3. Dietary intake of study participants among tertiles of the CQI (n = 291).
CVD risk factors, anthropometric measures, and body composition of study participants among tertiles of the CQI
In the crude model, HOMA-IR (P = 0.003) and BF (P = 0.01) were significantly lower in participants with higher adherence to a high CQI diet, and DBP (P = 0.06) and BFM (P = 0.06) are marginally significantly lower in participants with higher adherence to a diet with high CQI. However, after adjusting for age, BMI, energy intake, and physical activity, HOMA-IR (P = 0.007), WC (P = 0.02), WHR (P = 0.007), BFM (P = 0.02), BF (P = 0.01), fat mass index (FMI) (P = 0.01), trunk fat (TF) (kg) (P = 0.01), and TF (%) (P = 0.009) were significantly lower and BMI (P = 0.06) is marginally significantly lower in participants with consumption of high CQI diet. There was no significant mean difference between the other CVD risk factors of participants across tertiles of the CQI, as shown in Table 4.
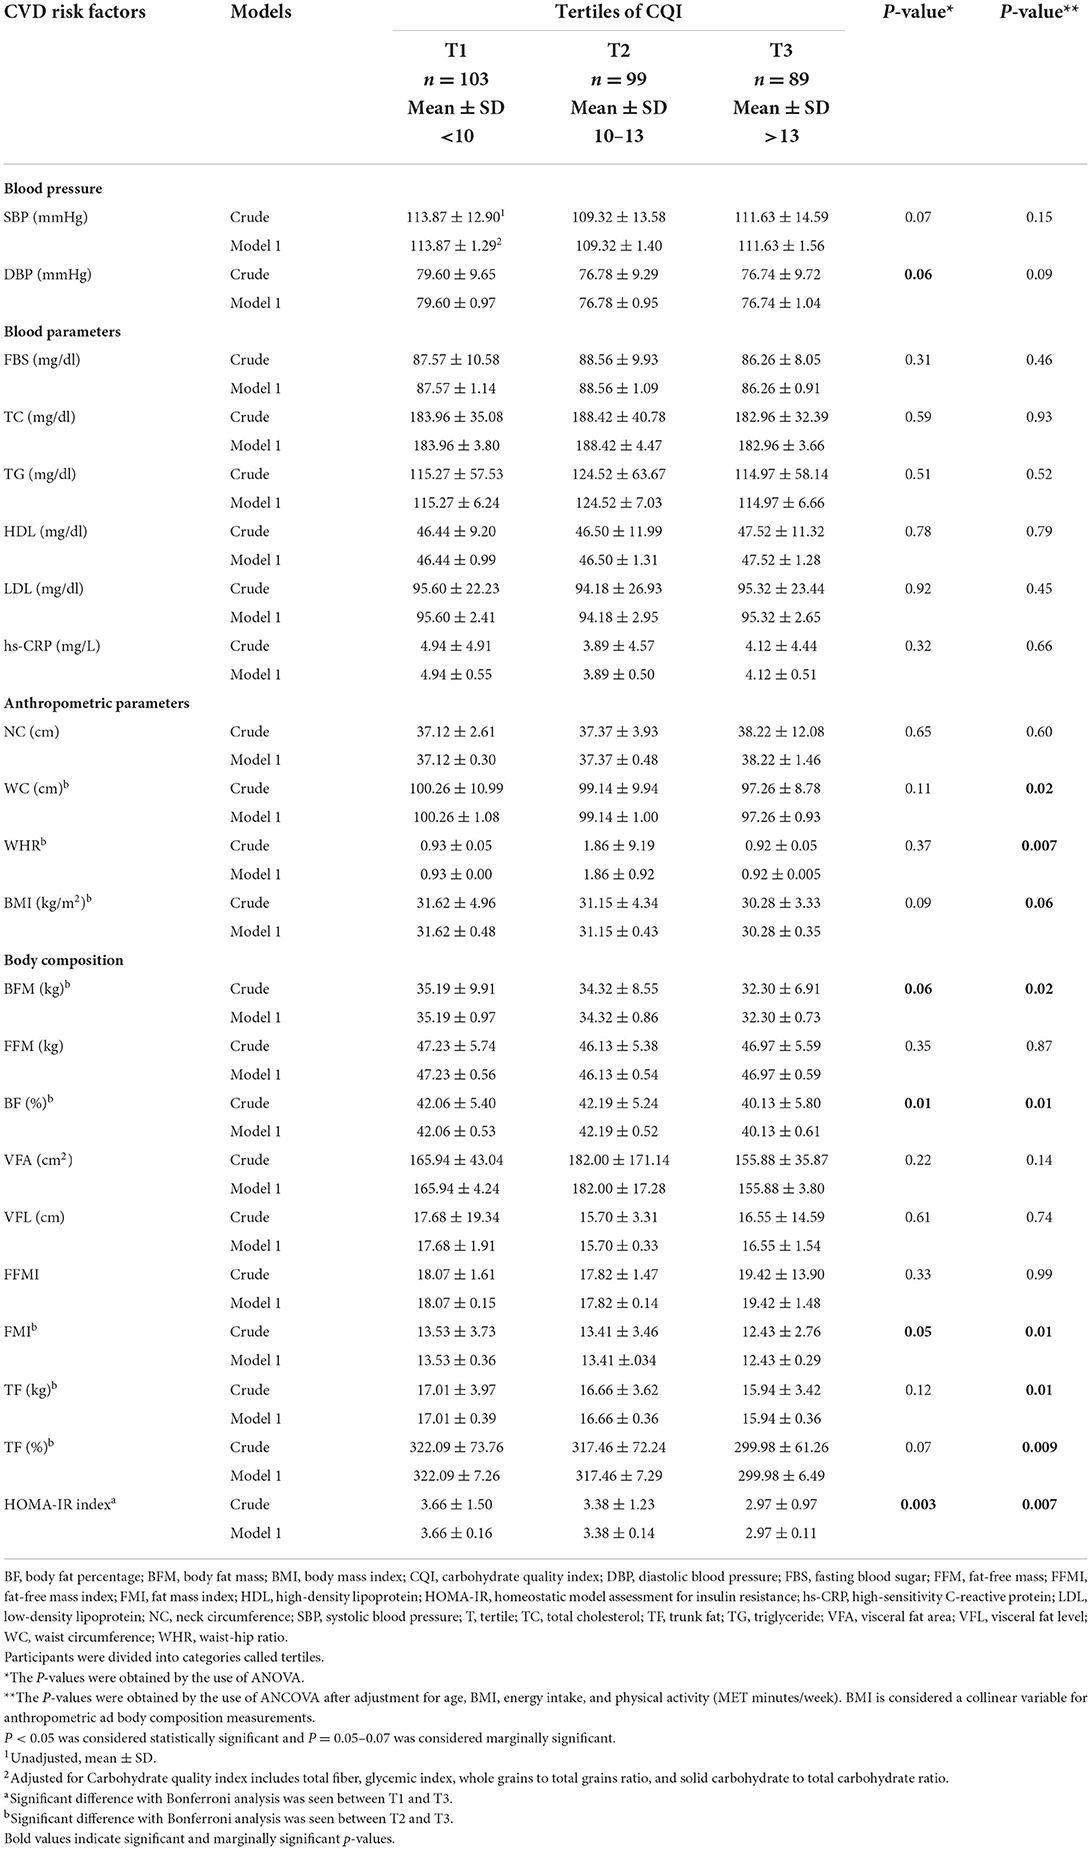
Table 4. CVD risk factors, anthropometric measures, and body composition of study participants among tertiles of the CQI (n = 291).
The association between CQI with CVD risk factors, anthropometric measures, and body composition of study participants
According to Table 5, in the crude model, SBP (P = 0.02) and DBP (P = 0.04) had an inverse significant association with CQI in the second tertile. Furthermore, DBP (P = 0.04), HOMA-IR (P = 0.001), WC (P = 0.03), BMI (P = 0.03), BFM (P = 0.02), BF (P = 0.01), FMI (P = 0.02), TF (kg) (P = 0.04), and TF (%) (P = 0.02) had an inverse significant association with CQI in third tertile. After adjusting for confounding variables, such as age, BMI, energy intake, and physical activity, SBP (β = −6.10; 95% CI = −10.11, −2.10; P = 0.003) and DBP (β = −3.76; 95% CI = −6.63, −0.89; P = 0.01) had an inverse significant association with CQI in the second tertile. Furthermore, DBP (β = −3.11; 95% CI = −6.15, −0.08; P = 0.04), HOMA-IR (β = −0.53; 95% CI = −0.94, −0.12; P = 0.01), WC (β = −3.18; 95% CI = −6.26, −0.10; P = 0.04), WHR (β = −0.01; 95% CI = −0.03, −0.001; P = 0.03), BFM (β = −2.87; 95% CI = −5.48, −0.26; P = 0.03), BF (β = −2.06; 95% CI = −3.82, −0.30; P = 0.02), FMI (β = −1.07; 95% CI = −2.09, −0.04; P = 0.04), TF (kg) (β = −1.14; 95% CI = −2.28, −0.003; P = 0.04), and TF (%) (β = −22.98; 95% CI = −44.38, −1.57; P = 0.03) had an inverse significant association and BMI (β = −1.21; 95% CI = −2.50, 0.07; P = 0.06) had an inverse marginally significant association with CQI in the third tertile compare to T1. Based on this table, in crude model, more adherence to a higher CQI diet compare to lower adherence, was negatively significantly associated DBP (P for trend = 0.03), HOMA-IR (P for trend = 0.001), WC (P for trend = 0.03), BMI (P for trend = 0.03), BFM (P for trend = 0.02), BF (P for trend = 0.01), FMI (P for trend = 0.02), TF (kg) (P for trend = 0.04), and TF (%) (P for trend = 0.03). After adjusting for confounders, in model 1, greater adherence to a diet with high CQI was positively and significantly associated with a DBP (P for trend = 0.04), and negatively with HOMA-IR (P for trend = 0.01), WC (P for trend = 0.04), WHR (P for trend = 0.03), BFM (P for trend = 0.03), BF (P for trend = 0.02), FMI (P for trend = 0.04), and TF (%) (P for trend = 0.03), compare to reference group. Also, after adjusting for confounders, greater adherence to a higher CQI diet was positively and marginally significantly associated with SBP (P for trend = 0.05), and negatively with BMI (P for trend = 0.06) and TF (kg) (P for trend = 0.05).
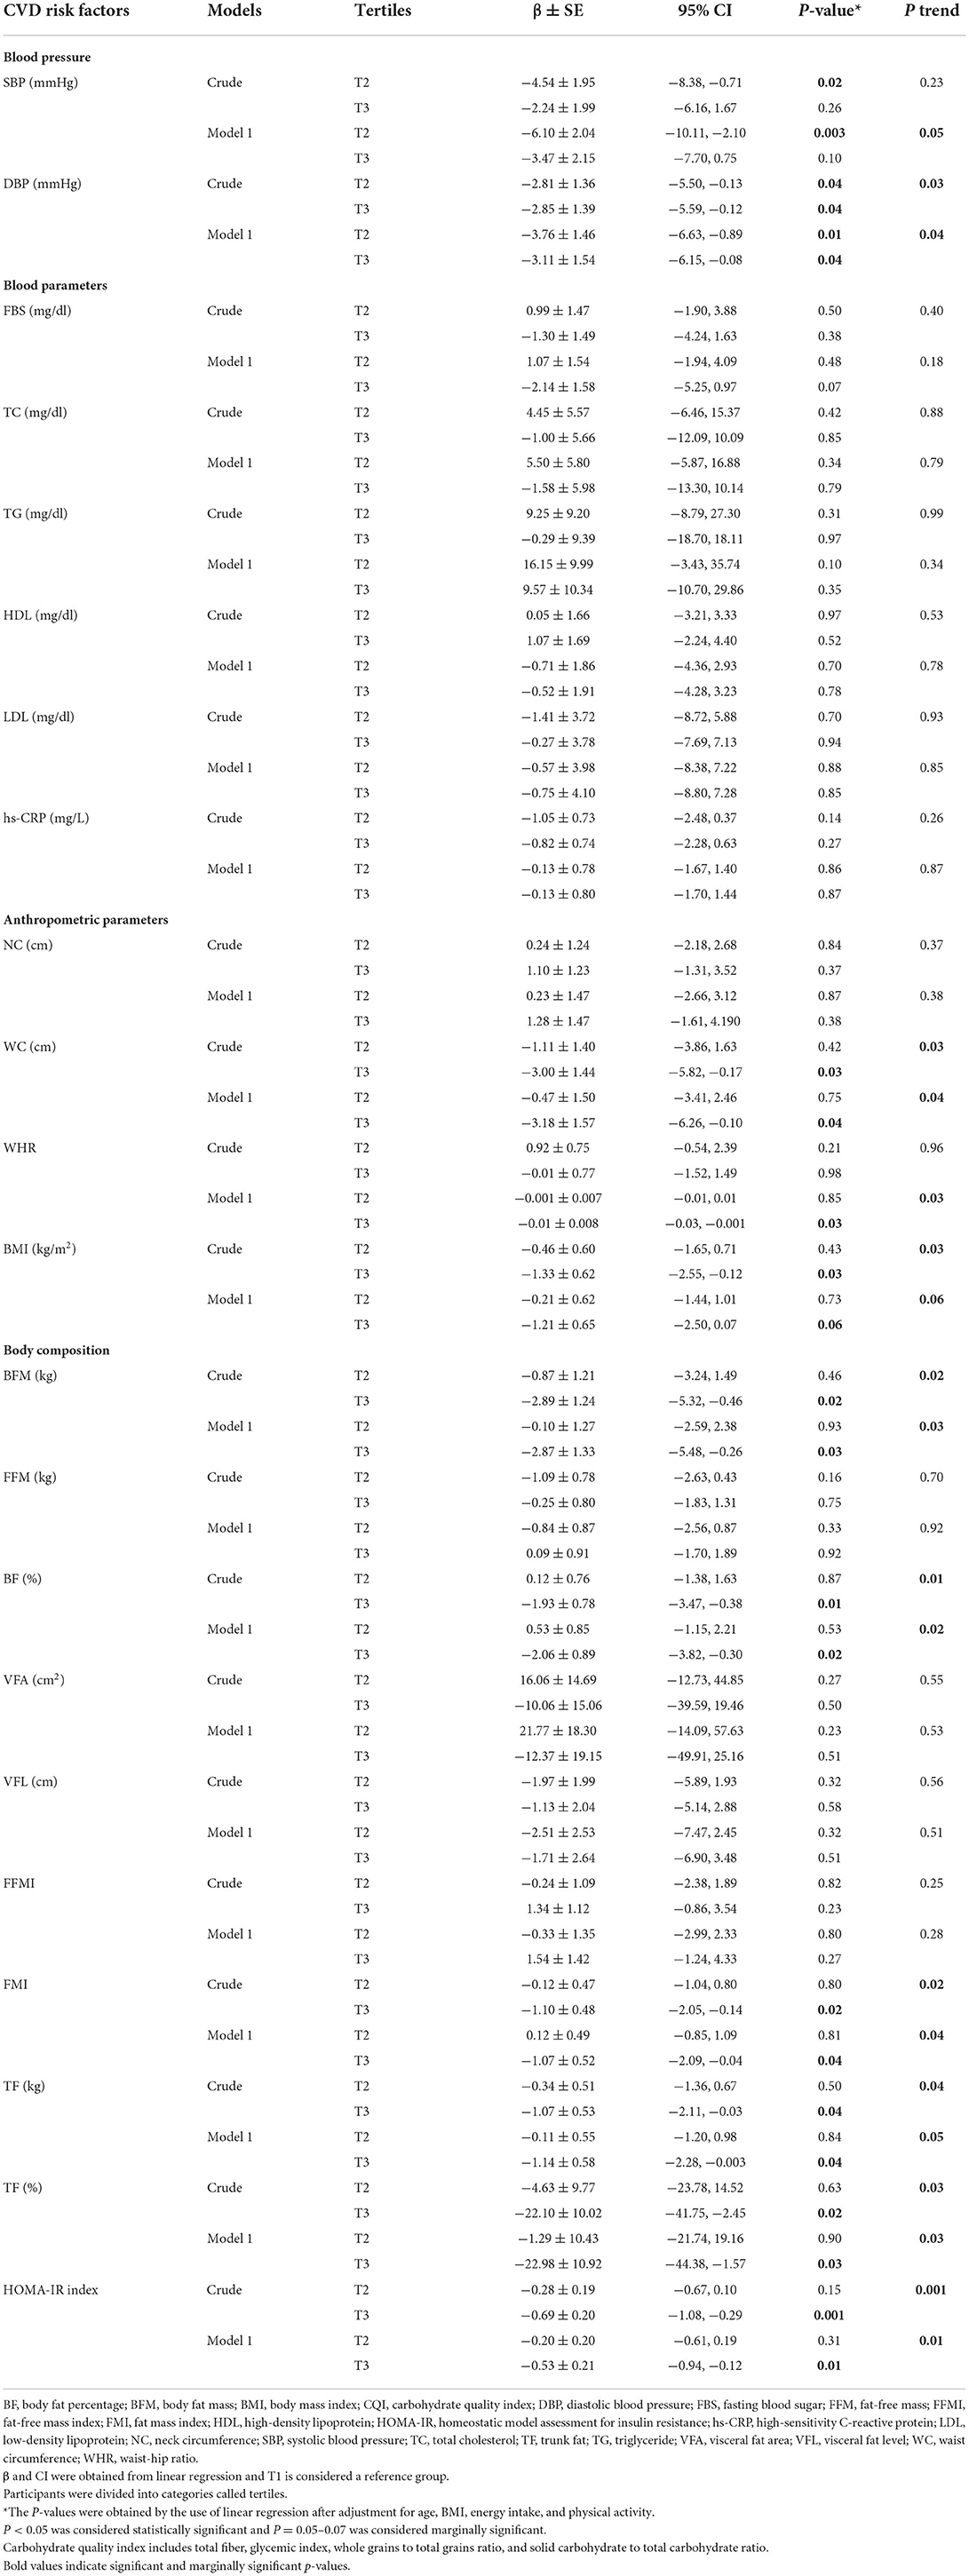
Table 5. The association between CQI with CVD risk factors, anthropometric measures, and body composition of study participants (n = 291).
Discussion
To the best of our knowledge, the current study is the first study to investigate the association between CQI with CVD risk factors in Iranian women with obesity and overweight. The present study revealed after adjusting for age, BMI, energy intake, and physical activity, the consumption of a diet with high CQI was inversely related to blood pressure, insulin resistance, anthropometric measures, including WC, WHR, and BMI, and body composition, such as BF.
The results of a previous study showed a consistently inverse relationship between the CQI with the incidence of CVD. Indeed, these results emphasized that, in terms of the association between each of the CQI components with CVD, there was only a significant relationship between the whole grains/total grains ratio with CVD (33). Another study revealed an inverse association between CQI and CVD risk factors including HbA1c, FBS, TG, SBP, DBP, TC, and HDL (55). Fiber intake, as one of the CQI components, affects hypertension, metabolic syndrome components, insulin resistance, and LDL (54, 56–59). It also affects inflammatory markers such as hs-CRP (54, 56). GI, another CQI component, was shown to increase postprandial glucose, insulin responses, TG, and non-HDL cholesterol, and decrease HDL cholesterol (60, 61). Whole grains are one of the CQI components that in previous studies was shown to have significant effects on HDL, LDL, TC, HbA1c, and CRP (62). In the present study, an inverse significant association between SBP, DBP, and HOMA-IR with consumption of a high CQI diet was seen. Also, concordant with previous studies, an inverse relationship was seen between consumption of a diet with high CQI with LDL and hs-CRP, although their relationships were not significant (P > 0.05), which may be due to the small sample size. Even though the reduction in TC and FBS was observed with greater increases in CQI in previous studies (55), there was no association was seen between CQI with TC and FBS in our study. The small sample size may have contributed to this, therefore more studies with larger samples are needed.
In terms of anthropometric measures, some evidence has indicated a relationship between CQI with body weight and WC (55). A population-based study suggested an inverse association between CQI with abdominal obesity in men (23). Indeed, in previous studies, fiber intake was associated with obesity, WHR, WC, body weight, and BMI (54, 56, 63–65). Also, an association was seen between GI with body weight and obesity (66). In previous studies, an inverse association was seen between whole grains with central obesity and WC (67, 68). In addition, the results of a cohort study suggested a positive association between liquid carbohydrates with body weight (69). Concordant with these results, we concluded that there is a relationship between CQI with WHR, WC, and BMI. However, our results showed no significant association between CQI with body weight and abdominal or general obesity.
It has been revealed that an association exists between dietary fiber intake with skeletal muscle mass, BFM, and muscle-to-fat ratio (MFR) among women with type 2 diabetes (70), although one study showed no association (71). It has been asserted that diets rich in fiber can elicit weight-loss and BF loss compared to a diet high in refined grains (24). Also, low GI diet has been reported to cause BFM loss (26). In this study, we observed a strong relationship between consumption of a high CQI diet with body composition including BFM, BF, FMI, and TF.
Some possible mechanisms have been suggested pertaining to the association between CQI with CVD risk factors. Foods reach in fiber take more time to chew and so affect hunger reduction, increasing satiety, glucose control, improving insulin sensitivity, lipid absorption, lipid and carbohydrate oxidation regulation, and slowing down intestinal transit, that can cause body weight regulation (38, 39, 72, 73). Furthermore, fiber can fermentate in the colon by microflora and produce short-chain fatty acids (SCFAs), which contribute to improving health (74). Although the role of soluble and insoluble fiber is different, both are involved in reducing CVD risk factors and healthy body composition. Indeed, soluble fiber, due to its higher viscosity, induces satiety and controls hypercholesterolemia, and insoluble fiber, through inducing more satiety, and decreasing weight and WC, plays an important role (75–77). The mechanism by which dietary fiber lowers blood pressure levels remains unclear (78). Fermentation of dietary fiber in the intestine produces SCFAs. It has been seen that these SCFAs can lower blood pressure. The important mechanism through which SCFAs affect blood pressure is that SCFAs activate G protein-coupled receptors 43 and olfactory receptor 78 expressed in the kidney. This process inhibits the release of renin, which contributes to the regulation of blood pressure (79–81). Moreover, a high GI diet leads to insulin resistance, oxidative stress, and inflammation that aggravates dyslipidemia (82, 83). A high GI diet reduces fat oxidation and increases carbohydrate oxidation causing high-fat storage (84). On the other hand, a low GI diet leads to greater satiety and decreased desire for food intake, affecting energy intake and body composition balance (37). A high GI diet through increased postprandial insulin, causes activation of the sympathetic nervous system, sodium retention, and increased blood volume, resulting in increased blood pressure (85). Whole grains, as compared to refined grains, cause slower digestion and absorption of starch, and thus reduce insulin response and blood glucose. Also, whole grains induce greater satiety and reduce appetite leading to lower energy consumption and obesity prevention or improvement (38, 45). In addition, whole grains have been suggested to dilate blood vessels through the activity of endothelial nitric oxide, increase nitric oxide bioavailability, decrease inflammation, have antioxidant effects, increase arterial baroreceptor reflex function, and gut microbiota changes (86–89). So thus, decreasing blood pressure. Liquid carbohydrates, due to higher GI, increasing the risk of obesity (90); in addition, they can induce appetite, increase postprandial glucose and decrease insulin sensitivity compared to solid carbohydrates (43, 91).
The present study has several strengths. Based on our knowledge, this is the first study investigating the relationship between CQI with CVD risk factors. Also, we conducted this study on obese and overweight Iranian women, allowing detailed insight into this population. Despite these strengths, the study was not without some limitations. First, the sample size was relatively small and was performed only on women. Second, due to the cross-sectional design of the study, the findings do not establish causality between CQI with CVD risk factors. Third, we used the FFQ for obtaining the usual dietary intake which is based on participants' memory, thus may have resulted in recall bias. Forth, some measurement errors may have occurred while measuring.
Conclusion
Consistent with previous studies, we found that consumption of a high CQI diet was negatively associated with blood pressure, insulin resistance (HOMA-IR), anthropometric measures, including WC, WHR, BMI, and body composition, such as BF. Clearly, further studies are warranted to confirm the veracity of these results.
Data availability statement
The original contributions presented in the study are included in the article/supplementary material, further inquiries can be directed to the corresponding authors.
Ethics statement
The studies involving human participants were reviewed and approved by the Local Ethics Committee of the Tehran University of Medical Sciences. The patients/participants provided their written informed consent to participate in this study.
Author contributions
This project was designed and implemented by DK, AM, and KM. Data were analyzed and interpreted by FS. The manuscript was created by DK, CC, and AM. KM and AM supervised the overall project. This manuscript was revised by CC and ED. All authors have read and approved the final manuscript.
Funding
This study was funded by the Tehran University of Health Sciences (Grant ID: 1400-2-212-55002).
Acknowledgments
We would like to thank the School of Nutritional and Dietetics at Tehran University of Medical Sciences and the participants in this study.
Conflict of interest
The authors declare that the research was conducted in the absence of any commercial or financial relationships that could be construed as a potential conflict of interest.
Publisher's note
All claims expressed in this article are solely those of the authors and do not necessarily represent those of their affiliated organizations, or those of the publisher, the editors and the reviewers. Any product that may be evaluated in this article, or claim that may be made by its manufacturer, is not guaranteed or endorsed by the publisher.
Abbreviations
ANCOVA, Analysis of Covariance; ANOVA, Analysis of Variance; BF, body fat percentage; BFM, body fat mass; BMI, body mass index; CIs, confidence intervals; CHO, carbohydrates; CVDs, cardiovascular diseases; CQI, carbohydrate quality index; DBP, diastolic blood pressure; DHA, docosahexaenoic acid; EPA, eicosapentaenoic acid; FBS, fasting blood sugar; FFM, fat-free mass; FFMI, fat free mass index; FFQ, food frequency questionnaires; FMI, fat mass index; HC, hip circumference; HDL, high-density lipoprotein; HOMA-IR, homeostatic model assessment for insulin resistance; hs-CRP, high-sensitivity C-reactive protein; IPAQ, International Physical Activity Questionnaire; LCD, low carbohydrate diet; LDL, low-density lipoprotein; MUFA, monounsaturated fatty acids; N, number; NC, neck circumference; PA, physical activity; PUFA, polyunsaturated fatty acids; SBP, systolic blood pressure; SD, standard deviation; T, tertile; TC, total cholesterol; TG, triglyceride; TF, trunk fat; TUMS, Tehran University of Medical Sciences; VFA, visceral fat area; VFL, visceral fat level; WC, waist circumference; WHO, world health organization; WHR, waist-hip ratio.
References
1. Alhaj A, Swed S, Banjah B, Ayoub K. Gastrogastric herniation: an unusual complication following greater curve plication for the treatment of morbid obesity: case report. Ann Med Surg. (2021) 71:102900. doi: 10.1016/j.amsu.2021.102900
2. Nuertey BD, Alhassan AI, Nuertey AD, Mensah IA, Adongo V, Kabutey C, et al. Prevalence of obesity and overweight and its associated factors among registered pensioners in Ghana; a cross sectional studies. BMC Obesity. (2017) 4:1–12. doi: 10.1186/s40608-017-0162-4
3. Rillamas-Sun E, LaCroix AZ, Waring ME, Kroenke CH, LaMonte MJ, Vitolins MZ, et al. Obesity and late-age survival without major disease or disability in older women. JAMA Intern Med. (2014) 174:98–106. doi: 10.1001/jamainternmed.2013.12051
4. Kelly T, Yang W, Chen CS, Reynolds K, He J. Global burden of obesity in 2005 and projections to 2030. Int J Obes. (2008) 32:1431–7. doi: 10.1038/ijo.2008.102
5. Stevens G, Singh G, Lu Y, Danaei G, Lin J, Finucane M, et al. Global burden of metabolic risk factors of chronic diseases collaborating, national, regional, and global trends in adult overweight and obesity prevalences. Popul Health Metr. (2012) 10:22. doi: 10.1186/1478-7954-10-22
6. Collaboration N, Collaboration NRF. Trends in adult body-mass index in 200 countries from 1975 to 2014: a pooled analysis of 1698 population-based measurement studies with 19· 2 million participants. Lancet. (2016) 387:1377–96. doi: 10.1016/S0140-6736(16)30054-X
7. Jones-Smith JC, Gordon-Larsen P, Siddiqi A, Popkin BM. Cross-national comparisons of time trends in overweight inequality by socioeconomic status among women using repeated cross-sectional surveys from 37 developing countries, 1989–2007. Am J Epidemiol. (2011) 173:667–75. doi: 10.1093/aje/kwq428
8. Ballotari P, Venturelli F, Greci M, Giorgi Rossi P, Manicardi V. Sex differences in the effect of type 2 diabetes on major cardiovascular diseases: results from a population-based study in Italy. Int J Endocrinol. (2017) 2017:6039356. doi: 10.1155/2017/6039356
9. Peters SA, Huxley RR, Sattar N, Woodward M. Sex differences in the excess risk of cardiovascular diseases associated with type 2 diabetes: potential explanations and clinical implications. Curr Cardiovasc Risk Rep. (2015) 9:1–7. doi: 10.1007/s12170-015-0462-5
10. Peters SA, Huxley RR, Woodward M. Diabetes as a risk factor for stroke in women compared with men: a systematic review and meta-analysis of 64 cohorts, including 775 385 individuals and 12 539 strokes. Lancet. (2014) 383:1973–80. doi: 10.1016/S0140-6736(14)60040-4
11. Bennett WL, Wilson RF, Zhang A, Tseng E, Knapp EA, Kharrazi H, et al. Methods for evaluating natural experiments in obesity: a systematic review. Ann Intern Med. (2018) 168:791–800. doi: 10.7326/M18-0309
12. Pigeyre M, Yazdi FT, Kaur Y, Meyre D. Recent progress in genetics, epigenetics and metagenomics unveils the pathophysiology of human obesity. Clin Sci. (2016) 130:943–86. doi: 10.1042/CS20160136
13. Casas R, Castro-Barquero S, Estruch R, Sacanella E. Nutrition and cardiovascular health. Int J Mol Sci. (2018) 19:3988. doi: 10.3390/ijms19123988
14. Hutfless S, Gudzune KA, Maruthur N, Wilson RF, Bleich SN, Lau BD, et al. Strategies to prevent weight gain in adults: a systematic review. Am J Prev Med. (2013) 45:e41–51. doi: 10.1016/j.amepre.2013.07.013
15. Hite AH, Berkowitz VG, Berkowitz K. Low-carbohydrate diet review: shifting the paradigm. Nutr Clin Pract. (2011) 26:300–8. doi: 10.1177/0884533611405791
16. Sartorius K, Sartorius B, Madiba TE, Stefan C. Does high-carbohydrate intake lead to increased risk of obesity? A systematic review and meta-analysis. BMJ Open. (2018) 8:e018449. doi: 10.1136/bmjopen-2017-018449
17. Michalczyk M, Zajac A, Mikolajec K, Zydek G, Langfort J. No modification in blood lipoprotein concentration but changes in body composition after 4 weeks of low carbohydrate diet (LCD) followed by 7 days of carbohydrate loading in basketball players. J Hum Kinetics. (2018) 65:125. doi: 10.2478/hukin-2018-0102
18. Suara SB, Siassi F, Saaka M, Foroshani AR, Sotoudeh G. Association between Carbohydrate Quality Index and general and abdominal obesity in women: a cross-sectional study from Ghana. BMJ Open. (2019) 9:e033038. doi: 10.1136/bmjopen-2019-033038
19. Buyken AE, Goletzke J, Joslowski G, Felbick A, Cheng G, Herder C, et al. Association between carbohydrate quality and inflammatory markers: systematic review of observational and interventional studies. Am J Clin Nutr. (2014) 99:813–33. doi: 10.3945/ajcn.113.074252
20. AlEssa HB, Cohen R, Malik VS, Adebamowo SN, Rimm EB, Manson JE, et al. Carbohydrate quality and quantity and risk of coronary heart disease among US women and men. Am J Clin Nutr. (2018) 107:257–67. doi: 10.1093/ajcn/nqx060
21. Zazpe I, Sanchez-Tainta A, Santiago S, de la Fuente-Arrillaga C, Bes-Rastrollo M, Martínez JA, et al. Association between dietary carbohydrate intake quality and micronutrient intake adequacy in a Mediterranean cohort: the SUN (Seguimiento Universidad de Navarra) Project. Br J Nutr. (2014) 111:2000–9. doi: 10.1017/S0007114513004364
22. Santiago S, Zazpe I, Bes-Rastrollo M, Sánchez-Tainta A, Sayón-Orea C, de la Fuente-Arrillaga C, et al. Carbohydrate quality, weight change and incident obesity in a Mediterranean cohort: the SUN Project. Eur J Clin Nutr. (2015) 69:297–302. doi: 10.1038/ejcn.2014.187
23. Janbozorgi N, Djafarian K, Mohammadpour S, Abyane MZ, Zameni M, Badeli M, et al. Association between carbohydrate quality index and general and central obesity in adults: a population-based study in Iran. J Cardiovasc Thoracic Res. (2021) 13:298. doi: 10.34172/jcvtr.2021.47
24. Iversen KN, Carlsson F, Andersson A, Michaëlsson K, Langton M, Risérus U, et al. A hypocaloric diet rich in high fiber rye foods causes greater reduction in body weight and body fat than a diet rich in refined wheat: a parallel randomized controlled trial in adults with overweight and obesity (the RyeWeight study). Clin Nutr ESPEN. (2021) 45:155–69. doi: 10.1016/j.clnesp.2021.07.007
25. Gomes JMG, Fabrini SP, Alfenas RdCG. Low glycemic index diet reduces body fat and attenuates inflammatory and metabolic responses in patients with type 2 diabetes. Arch Endocrinol Metab. (2016) 61:137–44. doi: 10.1590/2359-3997000000206
26. Alfenas RdCG. Effect of the glycemic index on lipid oxidation and body composition. Nutrición Hospitalaria. (2011) 26:48–55. doi: 10.3305/nh.2011.26.1.5008
27. Nayor M, Vasan RS. Recent update to the US cholesterol treatment guidelines: a comparison with international guidelines. Circulation. (2016) 133:1795–806. doi: 10.1161/CIRCULATIONAHA.116.021407
28. Nerenberg KA, Zarnke KB, Leung AA, Dasgupta K, Butalia S, McBrien K, et al. Hypertension Canada's 2018 guidelines for diagnosis, risk assessment, prevention, and treatment of hypertension in adults and children. Can J Cardiol. (2018) 34:506–25. doi: 10.1016/j.cjca.2018.02.022
29. Lu TY, Wahab HA, Lan TM. In silico interaction of Mitragynine and its analogues with human Ether-a-Go-Go-Related Gene (hERG) channel. Asian Pac J Trop Dis. (2014) 4:233. doi: 10.1016/S2222-1808(14)60531-4
30. Ghazizadeh H, Mirinezhad SMR, Asadi Z, Parizadeh SM, Zare-Feyzabadi R, Shabani N, et al. Association between obesity categories with cardiovascular disease and its related risk factors in the MASHAD cohort study population. J Clin Lab Anal. (2020) 34:e23160. doi: 10.1002/jcla.23160
31. Dinsa GD, Goryakin Y, Fumagalli E, Suhrcke M. Obesity and socioeconomic status in developing countries: a systematic review. Obes Rev. (2012) 13:1067–79. doi: 10.1111/j.1467-789X.2012.01017.x
32. Majdi M, Imani H, Bazshahi E, Hosseini F, Djafarian K, Lesani A, et al. Habitual-and meal-specific carbohydrate quality index and their relation to metabolic syndrome in a sample of Iranian adults. Front Nutr. (2022) 9:763345. doi: 10.3389/fnut.2022.763345
33. Zazpe I, Santiago S, Gea A, Ruiz-Canela M, Carlos S, Bes-Rastrollo M, et al. Association between a dietary carbohydrate index and cardiovascular disease in the SUN (Seguimiento Universidad de Navarra) Project. Nutr Metab Cardiovasc Dis. (2016) 26:1048–56. doi: 10.1016/j.numecd.2016.07.002
34. Suara SB, Siassi F, Saaka M, Rahimiforoushani A, Sotoudeh G. Relationship between dietary carbohydrate quality index and metabolic syndrome among type 2 diabetes mellitus subjects: a case-control study from Ghana. BMC Public Health. (2021) 21:1–12. doi: 10.1186/s12889-021-10593-3
35. Esfahani A, Wong JM, Mirrahimi A, Srichaikul K, Jenkins DJ, Kendall CW. The glycemic index: physiological significance. J Am College Nutr. (2009) 28:439S−45S. doi: 10.1080/07315724.2009.10718109
36. Burton-Freeman B, Keim N. Glycemic index, cholecystokinin, satiety and disinhibition: is there an unappreciated paradox for overweight women? Int J Obes. (2008) 32:1647–54. doi: 10.1038/ijo.2008.159
37. Goss AM, Goree LL, Ellis AC, Chandler-Laney PC, Casazza K, Lockhart ME, et al. Effects of diet macronutrient composition on body composition and fat distribution during weight maintenance and weight loss. Obesity. (2013) 21:1139–42. doi: 10.1002/oby.20191
38. Cho SS, Qi L, Fahey Jr GC, Klurfeld DM. Consumption of cereal fiber, mixtures of whole grains and bran, and whole grains and risk reduction in type 2 diabetes, obesity, and cardiovascular disease. Am J Clin Nutr. (2013) 98:594–619. doi: 10.3945/ajcn.113.067629
39. Kasubuchi M, Hasegawa S, Hiramatsu T, Ichimura A, Kimura I. Dietary gut microbial metabolites, short-chain fatty acids, and host metabolic regulation. Nutrients. (2015) 7:2839–49. doi: 10.3390/nu7042839
40. Boll EVJ, Ekström LM, Courtin CM, Delcour JA, Nilsson AC, Björck IM, et al. Effects of wheat bran extract rich in arabinoxylan oligosaccharides and resistant starch on overnight glucose tolerance and markers of gut fermentation in healthy young adults. Eur J Nutr. (2016) 55:1661–70. doi: 10.1007/s00394-015-0985-z
41. Warrilow A, Mellor D, McKune A, Pumpa K. Dietary fat, fibre, satiation, and satiety—a systematic review of acute studies. Eur J Clin Nutr. (2019) 73:333–44. doi: 10.1038/s41430-018-0295-7
42. Paul HA, Bomhof MR, Vogel HJ, Reimer RA. Diet-induced changes in maternal gut microbiota and metabolomic profiles influence programming of offspring obesity risk in rats. Sci Rep. (2016) 6:1–14. doi: 10.1038/srep20683
43. Harrington S. The role of sugar-sweetened beverage consumption in adolescent obesity: a review of the literature. J School Nursing. (2008) 24:3–12. doi: 10.1177/10598405080240010201
44. Pan A, Hu FB. Effects of carbohydrates on satiety: differences between liquid and solid food. Curr Opin Clin Nutr Metab Care. (2011) 14:385–90. doi: 10.1097/MCO.0b013e328346df36
45. Wanders AJ, van den Borne JJ, de Graaf C, Hulshof T, Jonathan MC, Kristensen M, et al. Effects of dietary fibre on subjective appetite, energy intake and body weight: a systematic review of randomized controlled trials. Obes Rev. (2011) 12:724–39. doi: 10.1111/j.1467-789X.2011.00895.x
46. Mirmiran P, Esfahani FH, Mehrabi Y, Hedayati M, Azizi F. Reliability and relative validity of an FFQ for nutrients in the Tehran lipid and glucose study. Public Health Nutr. (2010) 13:654–62. doi: 10.1017/S1368980009991698
47. Wolever TM, Brand-Miller JC, Abernethy J, Astrup A, Atkinson F, Axelsen M, et al. Measuring the glycemic index of foods: interlaboratory study. Am J Clin Nutr. (2008) 87:247S−57S. doi: 10.1093/ajcn/87.1.247S
48. Wolever TM, Yang M, Zeng XY, Atkinson F, Brand-Miller JC. Food glycemic index, as given in glycemic index tables, is a significant determinant of glycemic responses elicited by composite breakfast meals. Am J Clin Nutr. (2006) 83:1306–12. doi: 10.1093/ajcn/83.6.1306
49. Han J-S, Kim Y-H. Neck circumference and incidence of cerebrovascular disease over 12 years among Korean adults. Osong Public Health Res Perspect. (2022) 13:71–79. doi: 10.24171/j.phrp.2021.0277
50. Fuglsang-Nielsen R, Rakvaag E, Langdahl B, Knudsen KEB, Hartmann B, Holst JJ, et al. Effects of whey protein and dietary fiber intake on insulin sensitivity, body composition, energy expenditure, blood pressure, and appetite in subjects with abdominal obesity. Eur J Clin Nutr. (2021) 75:611–9. doi: 10.1038/s41430-020-00759-4
51. Zadeh-Vakili A, Tehrani FR, Hosseinpanah F. Waist circumference and insulin resistance: a community based cross sectional study on reproductive aged Iranian women. Diabetol Metab Syndr. (2011) 3:1–6. doi: 10.1186/1758-5996-3-18
52. Naderyan S, Sahaf R, Akbari Kamrani AA, Abolfathi Momtaz Y, Ghasemzadeh H, Papi S. Physical activity among Iranian former sportsmen and athletes as possible evidence for continuity theory of aging. Iran Rehabil J. (2019) 17:141–8. doi: 10.32598/irj.17.2.141
53. Wareham NJ, Jakes RW, Rennie KL, Schuit J, Mitchell J, Hennings S, et al. Validity and repeatability of a simple index derived from the short physical activity questionnaire used in the European Prospective Investigation into Cancer and Nutrition (EPIC) study. Public Health Nutr. (2003) 6:407–13. doi: 10.1079/PHN2002439
54. Moreira MLP, Sztajnbok F, Giannini DT. Relationship between fiber intake and cardiovascular risk factors in adolescents with systemic lupus erythematosus. Revista Paulista de Pediatria. (2020) 39:e2019316. doi: 10.1590/1984-0462/2021/39/2019316
55. Martínez-González MA, Fernandez-Lazaro CI, Toledo E, Díaz-López A, Corella D, Goday A, et al. Carbohydrate quality changes and concurrent changes in cardiovascular risk factors: a longitudinal analysis in the PREDIMED-Plus randomized trial. Am J Clin Nutr. (2020) 111:291–306. doi: 10.1093/ajcn/nqz298
56. Fujii H, Iwase M, Ohkuma T, Ogata-Kaizu S, Ide H, Kikuchi Y, et al. Impact of dietary fiber intake on glycemic control, cardiovascular risk factors and chronic kidney disease in Japanese patients with type 2 diabetes mellitus: the Fukuoka Diabetes Registry. Nutr J. (2013) 12:1–8. doi: 10.1186/1475-2891-12-159
57. Kumar V, Sinha AK, Makkar HP, De Boeck G, Becker K. Dietary roles of non-starch polysachharides in human nutrition: a review. Crit Rev Food Sci Nutr. (2012) 52:899–935. doi: 10.1080/10408398.2010.512671
58. Sun B, Shi X, Wang T, Zhang D. Exploration of the association between dietary fiber intake and hypertension among US adults using 2017 American College of Cardiology/American Heart Association Blood Pressure Guidelines: NHANES 2007–2014. Nutrients. (2018) 10:1091. doi: 10.3390/nu10081091
59. Sekgala MD, Mchiza ZJ, Parker W-a, Monyeki KD. Dietary fiber intake and metabolic syndrome risk factors among young South African adults. Nutrients. (2018) 10:504. doi: 10.3390/nu10040504
60. Bergia RE, Giacco R, Hjorth T, Biskup I, Zhu W, Costabile G, et al. Differential glycemic effects of low-versus high-glycemic index mediterranean-style eating patterns in adults at risk for type 2 diabetes: the MEDGI-carb randomized controlled trial. Nutrients. (2022) 14:706. doi: 10.3390/nu14030706
61. Sieri S, Agnoli C, Grioni S, Weiderpass E, Mattiello A, Sluijs I, et al. Glycemic index, glycemic load, and risk of coronary heart disease: a pan-European cohort study. Am J Clin Nutr. (2020) 112:631–43. doi: 10.1093/ajcn/nqaa157
62. Marshall S, Petocz P, Duve E, Abbott K, Cassettari T, Blumfield M, et al. The effect of replacing refined grains with whole grains on cardiovascular risk factors: a systematic review and meta-analysis of randomized controlled trials with GRADE clinical recommendation. J Acad Nutr Diet. (2020) 120:1859–83.e31. doi: 10.1016/j.jand.2020.06.021
63. Lin Y, Huybrechts I, Vandevijvere S, Bolca S, De Keyzer W, De Vriese S, et al. Fibre intake among the Belgian population by sex–age and sex–education groups and its association with BMI and waist circumference. Br J Nutr. (2011) 105:1692–703. doi: 10.1017/S0007114510005088
64. Thompson SV, Hannon BA, An R, Holscher HD. Effects of isolated soluble fiber supplementation on body weight, glycemia, and insulinemia in adults with overweight and obesity: a systematic review and meta-analysis of randomized controlled trials. Am J Clin Nutr. (2017) 106:1514–28. doi: 10.3945/ajcn.117.163246
65. Tang Q, Ma B, Zhao Y, Zhao L, Zhang Z, Gao H, et al. Soluble dietary fiber significance against obesity in a western china population. J Healthc Eng. (2021) 2021:5754160. doi: 10.1155/2021/5754160
66. Gaesser GA, Miller Jones J, Angadi SS. Perspective: does glycemic index matter for weight loss and obesity prevention? Examination of the evidence on “fast” compared with “slow” carbs. Adv Nutr. (2021) 12:2076–84. doi: 10.1093/advances/nmab093
67. Mostad IL, Langaas M, Grill V. Central obesity is associated with lower intake of whole-grain bread and less frequent breakfast and lunch: results from the HUNT study, an adult all-population survey. Appl Physiol Nutr Metab. (2014) 39:819–28. doi: 10.1139/apnm-2013-0356
68. Romaguera D, Ängquist L, Du H, Jakobsen MU, Forouhi NG, Halkjær J, et al. Food composition of the diet in relation to changes in waist circumference adjusted for body mass index. PLoS ONE. (2011) 6:e23384. doi: 10.1371/journal.pone.0023384
69. Mozaffarian D, Hao T, Rimm EB, Willett WC, Hu FB. Changes in diet and lifestyle and long-term weight gain in women and men. New Engl J Med. (2011) 364:2392–404. doi: 10.1056/NEJMoa1014296
70. Takahashi F, Hashimoto Y, Kaji A, Sakai R, Kawate Y, Okamura T, et al. Dietary fiber intake is related to skeletal muscle mass, body fat mass, and muscle-to-fat ratio among people with type 2 diabetes: a cross-sectional study. Front Nutr. (2022) 2022:1157. doi: 10.3389/fnut.2022.881877
71. Karl JP, Roberts SB, Schaefer EJ, Gleason JA, Fuss P, Rasmussen H, et al. Effects of carbohydrate quantity and glycemic index on resting metabolic rate and body composition during weight loss. Obesity. (2015) 23:2190–8. doi: 10.1002/oby.21268
72. Giacco R, Della Pepa G, Luongo D, Riccardi G. Whole grain intake in relation to body weight: from epidemiological evidence to clinical trials. Nutr Metab Cardiovasc Dis. (2011) 21:901–8. doi: 10.1016/j.numecd.2011.07.003
73. Ibrügger S, Kristensen M, Mikkelsen MS, Astrup A. Flaxseed dietary fiber supplements for suppression of appetite and food intake. Appetite. (2012) 58:490–5. doi: 10.1016/j.appet.2011.12.024
74. Chawla R, Patil G. Soluble dietary fiber. Comprehensive Rev Food Sci Food Safety. (2010) 9:178–96. doi: 10.1111/j.1541-4337.2009.00099.x
75. Minami Y, Hirabayashi Y, Nagata C, Ishii T, Harigae H, Sasaki T. Intakes of vitamin B6 and dietary fiber and clinical course of systemic lupus erythematosus: a prospective study of Japanese female patients. J Epidemiol. (2011) 21:246–54. doi: 10.2188/jea.JE20100157
76. Slavin J, Green H. Dietary fibre and satiety. Nutr Bull. (2007) 32:32–42. doi: 10.1111/j.1467-3010.2007.00603.x
77. Kristensen M, Jensen MG. Dietary fibres in the regulation of appetite and food intake. Importance of viscosity. Appetite. (2011) 56:65–70. doi: 10.1016/j.appet.2010.11.147
78. Aleixandre A, Miguel M. Dietary fiber and blood pressure control. Food Funct. (2016) 7:1864–71. doi: 10.1039/C5FO00950B
79. Miyamoto J, Kasubuchi M, Nakajima A, Irie J, Itoh H, Kimura I. The role of short-chain fatty acid on blood pressure regulation. Curr Opin Nephrol Hypertens. (2016) 25:379–83. doi: 10.1097/MNH.0000000000000246
80. Pluznick J. A novel SCFA receptor, the microbiota, and blood pressure regulation. Gut Microbes. (2014) 5:202–7. doi: 10.4161/gmic.27492
81. Natarajan N, Hori D, Flavahan S, Steppan J, Flavahan NA, Berkowitz DE, et al. Microbial short chain fatty acid metabolites lower blood pressure via endothelial G protein-coupled receptor 41. Physiol Genomics. (2016) 48:826–34. doi: 10.1152/physiolgenomics.00089.2016
82. Pawlak DB, Kushner JA, Ludwig DS. Effects of dietary glycaemic index on adiposity, glucose homoeostasis, and plasma lipids in animals. Lancet. (2004) 364:778–85. doi: 10.1016/S0140-6736(04)16937-7
83. Blaak E, Antoine JM, Benton D, Björck I, Bozzetto L, Brouns F, et al. Impact of postprandial glycaemia on health and prevention of disease. Obesity Rev. (2012) 13:923–84. doi: 10.1111/j.1467-789X.2012.01011.x
84. Brand-Miller JC, Holt SH, Pawlak DB, McMillan J. Glycemic index and obesity. Am J Clin Nutr. (2002) 76:281S−5S. doi: 10.1093/ajcn/76.1.281S
85. Gopinath B, Flood VM, Rochtchina E, Baur LA, Smith W, Mitchell P. Influence of high glycemic index and glycemic load diets on blood pressure during adolescence. Hypertension. (2012) 59:1272–7. doi: 10.1161/HYPERTENSIONAHA.112.190991
86. Shobako N, Ishikado A, Ogawa Y, Sono Y, Kusakari T, Suwa M, et al. Vasorelaxant and antihypertensive effects that are dependent on the endothelial NO system exhibited by rice bran-derived tripeptide. J Agric Food Chem. (2019) 67:1437–42. doi: 10.1021/acs.jafc.8b06341
87. Jan-On Jan-On G, Sangartit W, Pakdeechote P, Kukongviriyapan V, Sattayasai J, Senaphan K, et al. Virgin rice bran oil alleviates hypertension through the upregulation of eNOS and reduction of oxidative stress and inflammation in L-NAME–induced hypertensive rats. Nutrition. (2020) 69:110575. doi: 10.1016/j.nut.2019.110575
88. Ma P, Li T, Ji F, Wang H, Pang J. Effect of GABA on blood pressure and blood dynamics of anesthetic rats. Int J Clin Exp Med. (2015) 8:14296.
89. Marques FZ, Nelson E, Chu P-Y, Horlock D, Fiedler A, Ziemann M, et al. High-fiber diet and acetate supplementation change the gut microbiota and prevent the development of hypertension and heart failure in hypertensive mice. Circulation. (2017) 135:964–77. doi: 10.1161/CIRCULATIONAHA.116.024545
Keywords: cardiovascular disease risk factors, anthropometric measures, body composition, obesity, carbohydrate quality index
Citation: Khosravinia D, Shiraseb F, Mirzababaei A, Daneshzad E, Jamili S, Clark CCT and Mirzaei K (2022) The association of Carbohydrate Quality Index with cardiovascular disease risk factors among women with overweight and obesity: A cross-sectional study. Front. Nutr. 9:987190. doi: 10.3389/fnut.2022.987190
Received: 05 July 2022; Accepted: 22 August 2022;
Published: 08 September 2022.
Edited by:
Eloisa Colin-Ramirez, Universidad Anáhuac México Norte, MexicoReviewed by:
Lubia Velázquez López, Instituto Mexicano del Seguro Social, MexicoMartha Guevara-Cruz, Instituto Nacional de Ciencias Médicas y Nutrición Salvador Zubirán (INCMNSZ), Mexico
Copyright © 2022 Khosravinia, Shiraseb, Mirzababaei, Daneshzad, Jamili, Clark and Mirzaei. This is an open-access article distributed under the terms of the Creative Commons Attribution License (CC BY). The use, distribution or reproduction in other forums is permitted, provided the original author(s) and the copyright owner(s) are credited and that the original publication in this journal is cited, in accordance with accepted academic practice. No use, distribution or reproduction is permitted which does not comply with these terms.
*Correspondence: Khadijeh Mirzaei, bWlyemFlaV9raEBzaW5hLnR1bXMuYWMuaXI=; Atieh Mirzababaei, YXRpX2JhYmFlZUB5YWhvby5jb20=