 Pradeep Kumar Patel1
 Shahida Anusha Siddiqui2,3
 Kamil Kuča4,5*
 Santanu Sabhapondit6
 Rupak Sarma1Boby Gogoi1Shobhit Kumar Singh1Ranjeet Kumar Bordoloi1Jayanta Kumar Saikia1Romen Chandra Gogoi7
 Kanchan Bhardwaj8
 Jie Yang9
 Yang Tao10
 Sivakumar Manickam11*Buddhadeb Das12*
- 1Department of Plant Physiology and Breeding, Tocklai Tea Research Institute, Tea Research Association, Jorhat, India
- 2Campus Straubing for Biotechnology and Sustainability, Technical University of Munich, Straubing, Germany
- 3German Institute of Food Technologies (DIL eV), Quakenbrück, Germany
- 4Department of Chemistry, Faculty of Science, University of Hradec Kralove, Hradec Kralove, Czechia
- 5Biomedical Research Center, University Hospital Hradec Kralove, Hradec Kralove, Czechia
- 6Department of Biochemistry, Tocklai Tea Research Institute, Tea Research Association, Jorhat, India
- 7Tea Testing Laboratory, Tocklai Tea Research Institute, Tea Research Association, Jorhat, India
- 8School of Biological and Environmental Sciences, Shoolini University of Biotechnology and Management Sciences, Solan, India
- 9Jiangsu Key Laboratory of Marine Bioresources and Environment/Jiangsu Key Laboratory of Marine Biotechnology, Jiangsu Ocean University, Lianyungang, China
- 10College of Food Science and Technology, Nanjing Agricultural University, Nanjing, China
- 11Petroleum and Chemical Engineering Department, Faculty of Engineering, Universiti Teknologi Brunei, Bandar Seri Begawan, Brunei
- 12North Bengal Regional R&D Centre, Tea Research Association, Nagrakata, India
Finding promising purple tea germplasm that would target new tea products for diversification and value addition boost the tea industry’s economic growth. Accordingly, 10 tea germplasm viz. TRA St. 817, TRA St. 293, TRA St. 400, TRA 177/3, TRA 376/2, TRA 376/3, TRA 427/7, TRA P7, TRA P8, and TV1 were evaluated in terms of gas exchange parameters, multiplication performance, and biochemical markers such as chlorophyll, carotenoids, and anthocyanin content, which are related to the purple tea quality. The investigated gas exchange and biochemical parameters revealed significant differences. Germplasm TRA St.817 was physiologically more efficient (24.7 μmol m–2 s–1), followed by TRA St. 293, exhibiting the highest net photosynthesis, water use efficiency (19.02 μmol mmol–1), carboxylation efficiency (0.73), chlorophyll fluorescence or photochemical efficiency of PSII (0.754) and mesophyll efficiency (ci/gs ratio: 2.54). Net photosynthesis was positively correlated with water use efficiency, carboxylation efficiency, mesophyll efficiency, and photochemical efficiency of PSII (r = 0.965**, 0.937**, 0.857**, 0.867**; P = 0.05), respectively, but negatively correlated with the transpiration ratio (r = −0.878**; P = 0.05) based on Pearson correlation analysis. The total anthocyanin content (4764.19 μg.g–1 fresh leaf weight) and carotenoid content (3.825 mg.g–1 fresh leaf weight) were highest in the TRA St.817 germplasm, followed by germplasm TRA St. 293 (2926.18 μg.g–1 FW). In contrast, total chlorophyll content was significantly low (1.779 mg.g–1 fresh weight), which is very suitable for manufacturing purple tea. The highest carotenoid concentration in TRA St. 817 was 3.825 mg.g–1 FW, followed by TRA P8 (3.475 mg.g–1 FW), favoring the formation of more volatile flavor constituents. The promising germplasm, TRA St 817, has a multiplication success rate of 91.4% through cleft grafting. The outcome reveals that TRA St.817 is a promising germplasm that can be used to make speciality teas, i.e., purple tea.
Introduction
Tea (Camellia sinensis L. O. Kuntze) is the world’s oldest beverage, second to water (1–3). Purple tea is now becoming widely attractive in domestic and global markets regarding health benefits. Robert Bruce began producing tea in the Indian state of Assam in 1823. The National Active Germplasm Site (NAGS) of TTRI is the world’s largest tea germplasm collection center (4). It has released 35 TV clones, 153 TRA/garden series clones, and 16 bi-clonal hybrid seed stocks and made genetic resources available to other tea-producing countries (5).
Anthocyanins pigments are found in red grapes (6, 7), berries (8), eggplant (9–11), and sweet potatoes (12). They demonstrate pH-dependent colors (13), contributing to the appealing colors of fruits, vegetables, and flowers (6, 14, 15) and accumulate in the vacuoles (16, 17). They have gained popularity due to their potential health benefits (6, 18), including antioxidant (19), anti-carcinogenic (20), anti-angiogenic (21, 22), antimicrobial (23–26), atherosclerosis (24), anti-apoptotic (27), and pro-apoptotic (12, 28) properties. Plants are susceptible to UV-B irradiation due to their sedentary nature, causing oxidative stress. When plants are exposed to UV-B irradiation, their biosynthesis is up-regulated (29, 30) and protected by anthocyanins. Besides protecting against pests and herbivores, leaf temperature during winter (31, 32) and the production of red wine (7, 33, 34) are controlled.
The newly discovered tea germplasm was not studied in terms of physiological, biochemical, quality evaluation, and multiplication efficiency, even though it has a higher amount of anthocyanins. The impact of anthocyanins in this novel germplasm on catechin levels was also determined as they are products of the shikimate and phenylpropanoid pathways. In addition to catechins, anthocyanins are expected to contribute to developing new and unique tea products. This study aims to understand the 10 selected germplasm’s physiological, biochemical, and quality variations. In this direction, the key objectives of the present investigation are (i) Identification of high anthocyanin pigmentation tea germplasm from existing tea plantation areas, (ii) Physiological, biochemical, and qualitative evaluation of identified purple tea germplasm to produce a speciality tea, i.e., anthocyanin-rich tea (purple tea), and (iii) To meet the demand for purple tea production on a commercial scale, as well as an investigation into the multiplication efficiency of the promising purple tea germplasm. Also, in terms of importance and scope, this study identifies the promising purple tea germplasm for the first time that could be utilized to diversify and enhance new tea products, consequently boosting tea productivity and promoting the economic growth of the tea industry.
Materials and methods
A total of 10 tea germplasms [Camellia sinensis (L.) O. Kuntze] was used for the study. Out of 10, nine pigmented purple tea germplasms, viz. TRA St. 817, TRA St. 293, TRA St. 400, TRA 177/3, TRA 376/2, TRA 376/3, TRA 427/7, TRA P7, TRA P8, and one non-pigmented tea germplasm TV1 were selected from the core collection available at TTRI germplasm bank (Photo plate I). The experimental soil was sandy, with a pH of 4.5–5.0. Photosynthesis, chlorophyll fluorescence (fv/fm), chlorophyll and carotenoids were observed on the maintenance leaves (physiologically more active leaves) at the plucking table between 9:30 and 11:30 a.m. For multiplication through cleft grafting, TV18 rootstocks were used.
Gas exchange parameters
Gas exchange parameters were measured by Portable Photosynthetic System (CIRAS-II, PP System, Amesbury, MA, United States).
Chlorophyll fluorescence
Chlorophyll fluorescence parameters were measured by a pulse amplitude modulation chlorophyll fluorometer JUNIOR-PAM (Walz, Effeltrich, Germany).
Extraction, identification and quantification of anthocyanins
Extraction
5 g of grounded leaf sample were weighed into a 250 ml conical flask covered with a foil and mixed with 50 ml CH3OH/HCl (99:1 v/v) and magnetically stirred at 900 rpm for 4 h at room temperature. The resultant solution was filtered and evaporated to dryness at room temperature (<35°C). The extract was dissolved in 10 ml distilled water, passed through a 0.45 μm membrane filter, and kept in an ice bath for analysis (35).
The extracts were passed through a reverse phase (RP) C18 solid phase extraction (SUPELCO, SPE, Sigma-Aldrich, United States) cartridges previously activated with 10% CH3OH/HCl (HPLC grade, Sisco Research Laboratories Pvt. Ltd., Mumbai, India). Anthocyanins were adsorbed in the cartridge while sugars, acids and other water-soluble compounds were washed out using 0.01% HCl. Anthocyanins were then recovered using acidified methanol (10% Formic acid v/v). The cartridges were washed with ethyl acetate (Thermo Fischer Scientific, United Kingdom) to remove phenolic compounds retained in the cartridge. The purified extracts were stored at 10°C until further analysis.
Identification and quantification of anthocyanins
The anthocyanin extracts from the samples were analyzed for anthocyanins profile using HPLC (Agilent 1260 LC System, 5301 Stevens Creek Blvd Santa Clara, CA 95051, United States). A Gemini C18 ODS column was used for HPLC analysis, and the detector was set at 520 nm (36). An injection volume of 20 μl with a 1 ml/min flow rate and the oven temperature of 35°C were used. The eluents were mobile phase A (water/acetonitrile/formic acid, 87/3/10 v/v/v, FINAR Ltd./Sisco Research Laboratories Pvt. Ltd., Mumbai, India) and mobile phase B (100% HPLC grade Acetonitrile, Sisco Research Laboratories Pvt. Ltd.). The chromatographic conditions were: 3% B in A at the time of injection at 45 min; 25% B in A at 46 min; 30% B in A at 47 min; 3% B in A (initial conditions). The anthocyanin standards Cyanidin-3-O-glucoside, Cyanidin-3-O-galactoside, Cyanidin chloride, Peonidin chloride, Pelargonidin chloride, and Malvidin chloride were obtained from Sigma Aldrich, United Kingdom, to identify and quantify anthocyanin fractions.
Determination of caffeine and catechins
Caffeine and individual catechin content in tea samples were quantified following ISO 14502-2 (37). Fresh leaves were enzyme denatured, oven dried, and finely powdered. 0.2 g of the powdered material was accurately weighed and extracted with 5 ml of 70% aqueous methanol and refluxed in a water bath at 70°C for 10 min. After cooling, the extracts were centrifuged at 3,000 rpm for 10 min. The supernatant was transferred into a 10 ml volumetric flask. The process was repeated with another 5 ml extraction solvent. 1 ml of the extract was diluted with a freshly prepared stabilizing agent five times. The stabilizing agent was prepared from10% (volume fraction) acetonitrile with 500 μg/ml of EDTA and ascorbic acid (Sisco Research Laboratories Pvt. Ltd., Mumbai, India). This diluted extract was filtered through 0.45 μm syringe filters before quantitative estimation using High-Performance Liquid Chromatography. The estimation was carried out using UPLC (Dionex, Ultimate 3000) with Luna 5 μm phenylhexyl Phenomenex column (4.5 mm × 250 mm; Torrance, CA, United States) and UV-Vis detector set at 278 nm. The column temperature was set at 25 ± 0.5°C. Mobile phase A consisted of 2% (v/v) acetic acid (Sisco Research Laboratories Pvt. Ltd., Mumbai, India), 9% (v/v) acetonitrile and ultrapure water. Mobile phase B consisted of 80% (v/v) acetonitrile and ultrapure water. The injection volume was 10 μl, and the flow rate was 1 ml/min. The gradient elution was set as 100% mobile phase A for 10 min, then a linear gradient to 68% mobile phase A, 32% mobile phase B over 15 min and held at this composition for 10 min. Catechin and caffeine peaks were identified by comparing retention times from sample chromatograms with those obtained from the standard solutions of catechins under the same chromatographic conditions. Estimating individual catechins and caffeine was done using Relative Response Factors of catechins concerning caffeine, as described in ISO 14502-2 (37).
Methodology of preparation of tea infusion and liquor for organoleptic evaluation
Tea infusion
The methodology for preparing tea infusion was as per (38) E. Soluble substances from a dried tea leaf were extracted in porcelain using fresh boiling water, and the liquor was poured into white porcelain. The organoleptic qualities of the infused leaf and the liquid without milk were evaluated. For liquor preparation, 2.8 ± 0.2 g of tea was transferred to the pot and weighed. The teapot was filled with fresh boiling water within 4–6 mm of the brim and covered with a lid. To brew tea, 4–5 min was allowed. The liquor was poured into the bowl through the serration, using the cover to keep the infused leaf in the pot. The lid was removed and then inverted. To inspect the infused leaf, it was placed on the inverted lid.
Liquor
To make a cup of tea, 2.8 ± 0.2 g of tea was weighed into a 150 ml cup, added with freshly boiled water, steeped for 5 min, and filtered. The infused leaves were pressed into the sampling pot’s lid. A randomized technique was followed for the tasting by the tea taster, where the sample details were hidden following ISO 3163 (39). A tea taster slurps the drink into his or her mouth noisily while using a large spoon once it has cooled sufficiently. This ensures that the tea and plenty of oxygen pass through the tongue’s taste receptors for a consistent taste profile (40). Before the next sample, the liquid was spat into a spittoon. FAO (41) describes the tea quality parameters (liquor color, strength, briskness, and brightness), manufacturing flaw parameters, and field-related agro-practices. The tea quality was rated out of 10 once the taster considered these observations (42).
Statistical analysis
All the determinations were carried out in triplicate, and values were expressed as the mean ± SEm. Statistical significance was examined through a one-way analysis of variance and Duncan’s test at p ≤ 0.05 using the Statistical Package WASP 2.0.
Results and discussion
Gas exchange parameters
PAR varied from 1,062 to 1,281 μmol m–2 s–1 (Figure 1A). Net photosynthesis and other growth determining factors of selected germplasm, viz. TRA St. 817, TRA St. 293, TRA St. 400, TRA 177/3, TRA 376/2, TRA 376/3, TRA 427/7, TRA P7, and TRA P8 and TV1 depend upon the efficient use of light for assimilating CO2. In Northeast India, Pn reduction begins when light intensity exceeds 1,200 μmol m–2 s–1 (43, 44). Pn varies significantly among the germplasm, and the highest Pn was recorded in TRA St. 817 (24.7 μmol m–2 s–1), followed by TRA St. 293 (21.3 μmol m–2 s–1). In contrast, the lowest Pn was noticed in TRA St. 400 (10.4 μmol m–2 s–1) (Figure 1B). Barman et al. (44) correlated Pn with PAR (maximum Pn of 13.95 μmol m–2 s–1 at the PAR of 1,200 μmol m–2 s–1), whereas Hajara and Kumar (45, 46) recorded the maximum Pn at 11.9 μmol m–2 s–1 at the highest PAR (1,370 μmol m–2 s–1). Leaf temperature plays a crucial role in the tea leaf photosynthesis process. Leaf temperatures also showed significant variations among germplasm. TRA P8 exhibited a maximum leaf temperature of 33.3°C. Its corresponding Pn was 13.0 μmol m–2 s–1, whereas, at 29°C, maximum Pn was observed in TRA St. 817 (24.7 μmol m–2 s–1) (Figure 1C). The maximum Pn tea leaf temperature required is usually in the range of 25–30°C (47), which declines above 35°C resulting in no Pn above 39°C (48).
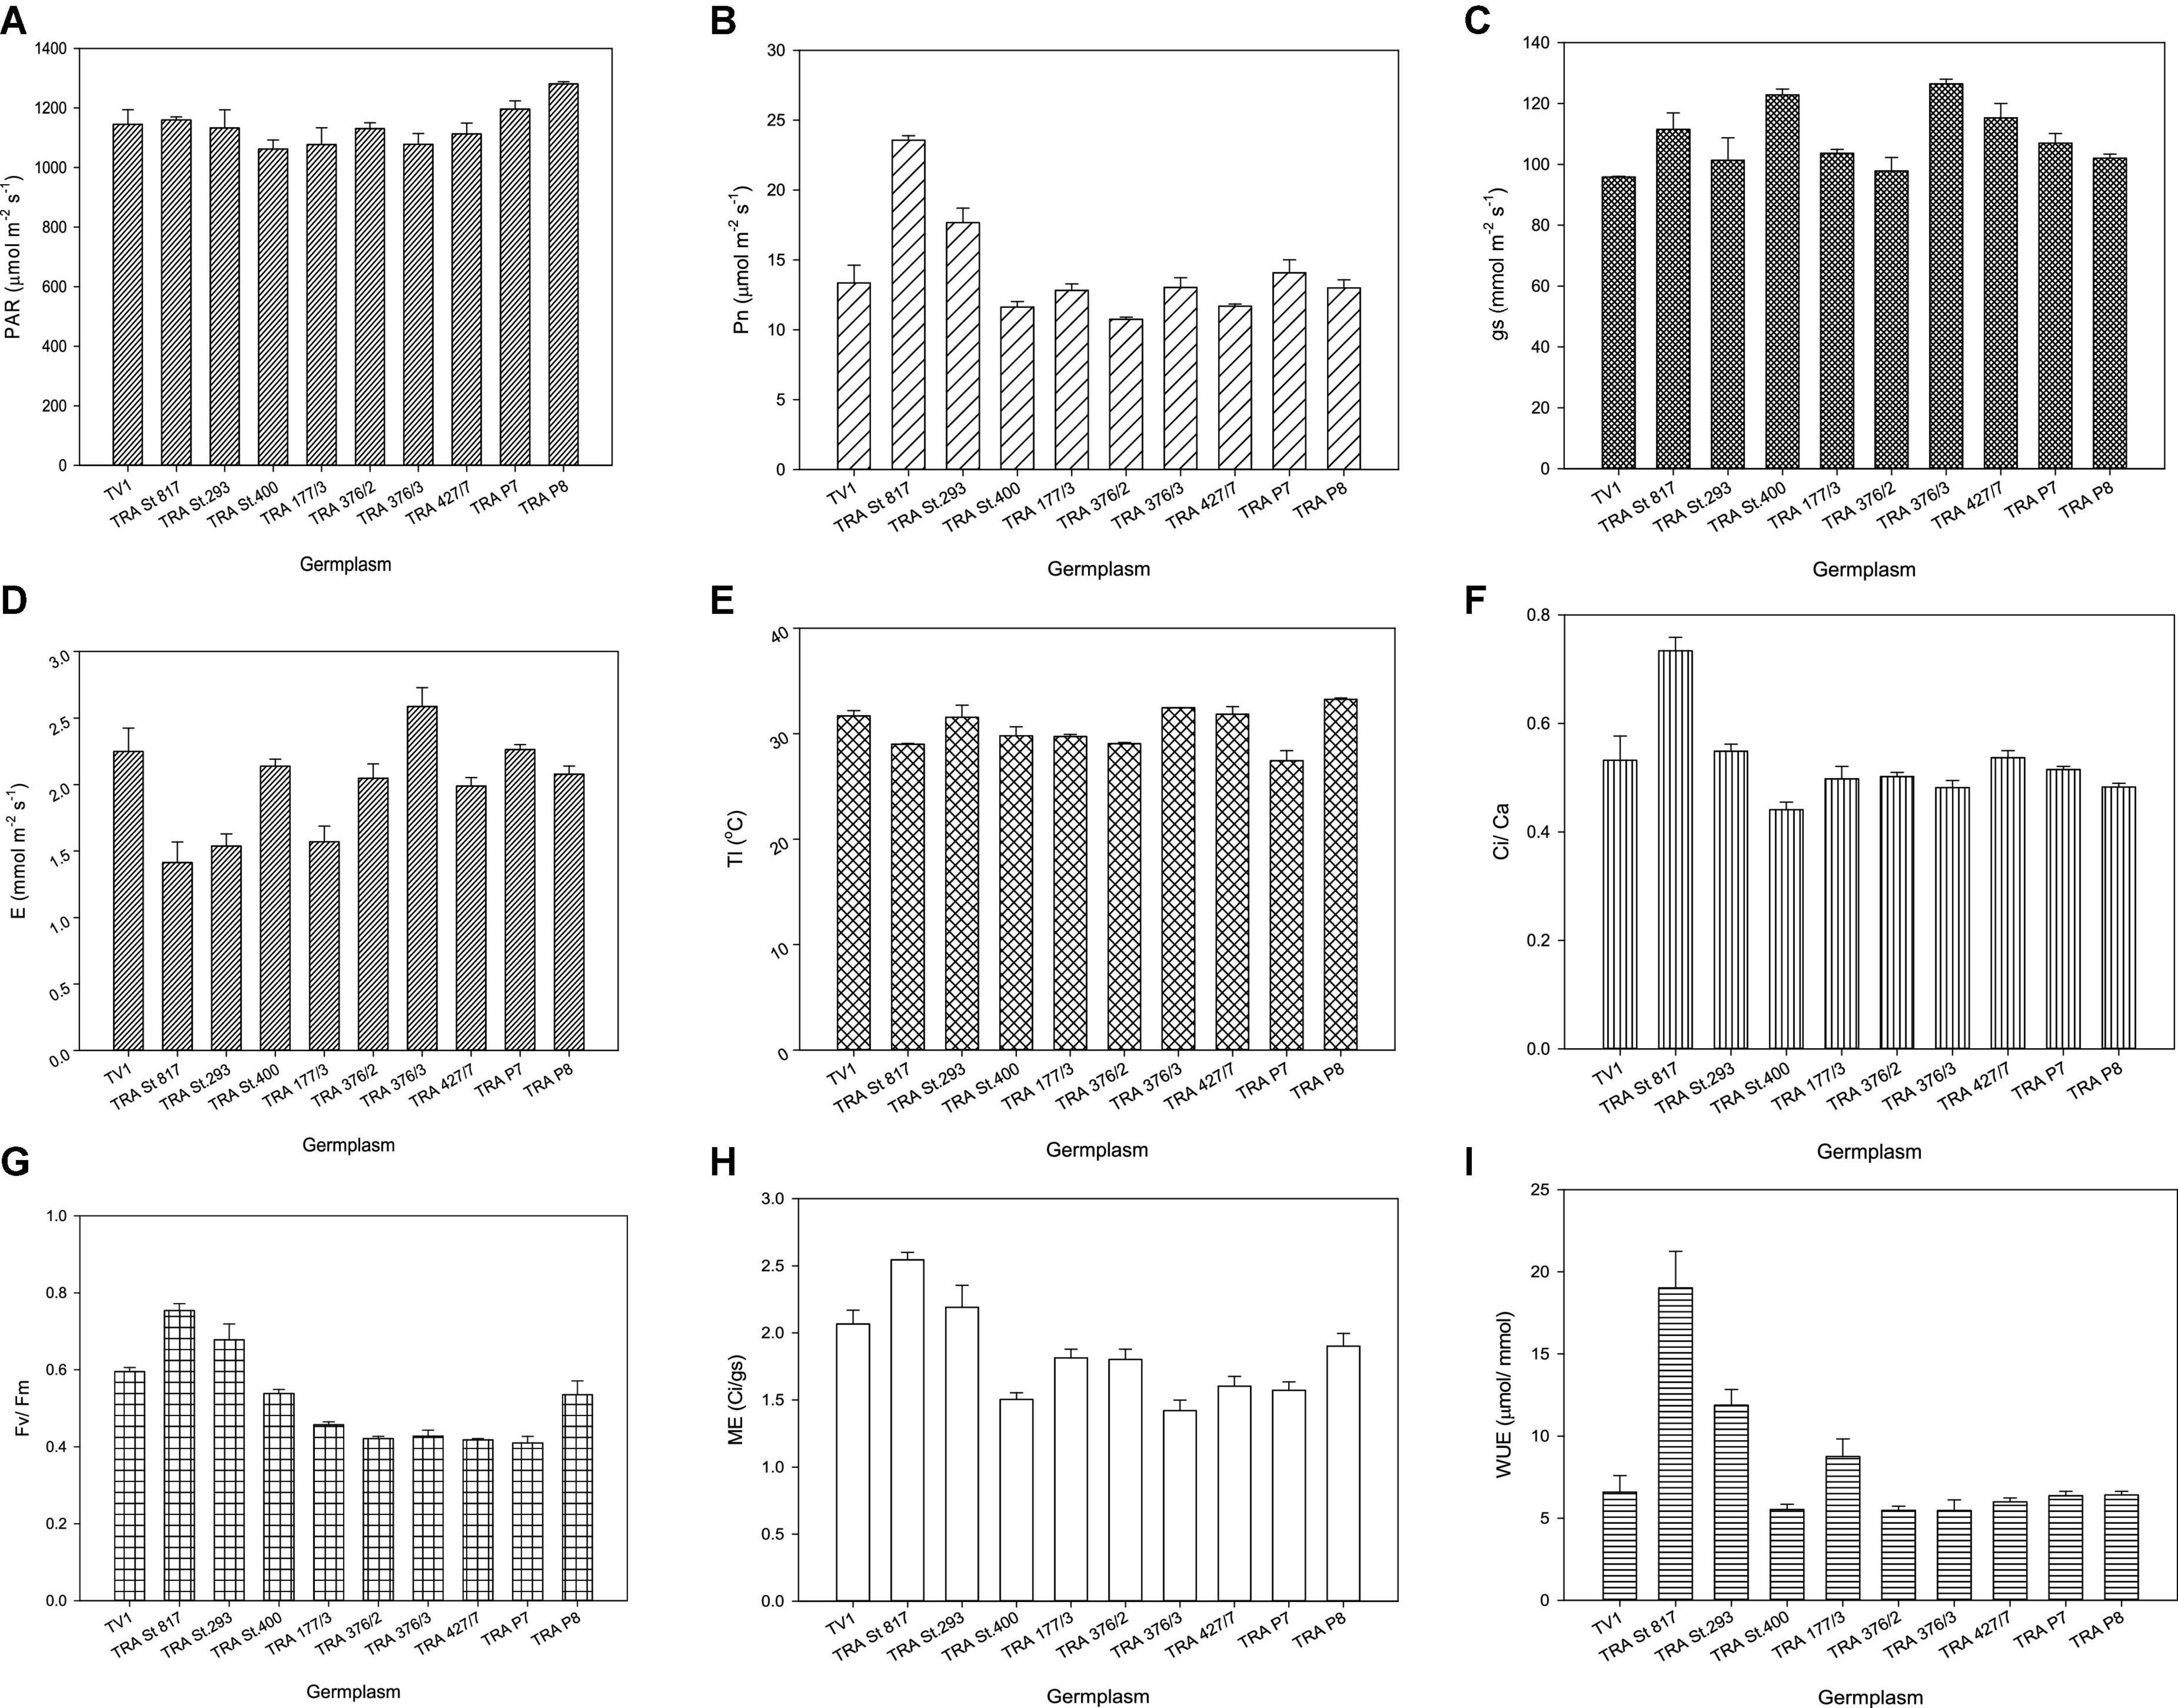
Figure 1. Physiological responses of tea germplasm with respect to (A) light (PAR), (B) net photosynthesis (Pn), (C) stomatal conductance (Gs), (D) evaporation (E), (E) leaf temperature (Lt), (F) carboxylation efficiency (ci/ca), (G) chlorophyll fluorescence (fv/fm), (H) mesophyll efficiency (ME), (I) water-use efficiency (WUE). Vertical bars indicate the standard error of means.
Whitehead et al. (49) noticed that PAR influences stomatal conductance, and Lt. E substantially limits the Gs (50, 51). The highest Gs was 122.8 mmol m–2 s–1, and the corresponding E was 2.14 mmol m–2 s–1, whereas the lowest Gs was 95.8 mmol m–2 s–1, and its corresponding E was 2.24 mmol m–2 s–1. Among the germplasm, TRA St. 400 presented the highest Gs (122.8 mmol m–2 s–1). In contrast, the TV1 showed the lowest Gs (95.8 mmol m–2 s–1), and the corresponding E was 2.14 and 2.24 mmol m–2 s–1, respectively (Figures 1D,E), indicating a positive correlation between gs and E.
The highest WUE was observed in TRA St. 817 (19.02 μmol mmol–1), followed by TRA St. 293 (11.87 μmol mmol–1) (Figure 1I). Ci/Ca was found within 0.44–0.73, similar to other C3 plants (52–54). Higher WUE is associated with a higher Pn/E ratio (55, 56). Maximum Ci/Ca was observed in TRA St. 817 (0.73) (Figure 1F), whereas the minimum Ci/Ca was noticed in the non-anthocyanin pigmented clone TV1 (0.44). Pn is linked to Gs and is substrate limited. The present study suggests that the mesophyll factor also plays an important role in Pn regulation through its effect on determining the CO2 concentration gradient. Higher Ci/Ca ascertains a better mesophyll factor, i.e., ME. Germplasm TRA St. 817 (2.54) showed maximum ME followed by TRA St. 293 (2.19) (Figure 1H).
Chlorophyll fluorescence (fv/fm) reflects the maximal efficiency of excitation energy captured by “open” PSII reaction centers. fv/fm showed significant variations among the germplasm. The highest fv/fm was observed in TRA St. 817 (0.754), followed by TRA St. 293 (0.678) (Figure 1G), whereas the lowest was noticed in TRA P7 germplasm. A decreased fv/fm indicates a down-regulation of photosynthesis or photoinhibition (57–59). Germplasm TRA St. 817 is more physiologically efficient than other pigmented and non-pigmented germplasm.
Correlation of physiological parameters in the selected germplasm
The Pearson correlation coefficient among the major group of anthocyanin pigments for the 10 genotypes was calculated and presented in Figure 2. Net photosynthesis showed a high positive correlation with WUE (r = 0.96), Ci/Ca (r = 0.90), PSII or fv/fm (r = 0.83), and ME (r = 0.81) in the selected anthocyanin pigmented tea germplasm for the studied purple tea (Figure 2).
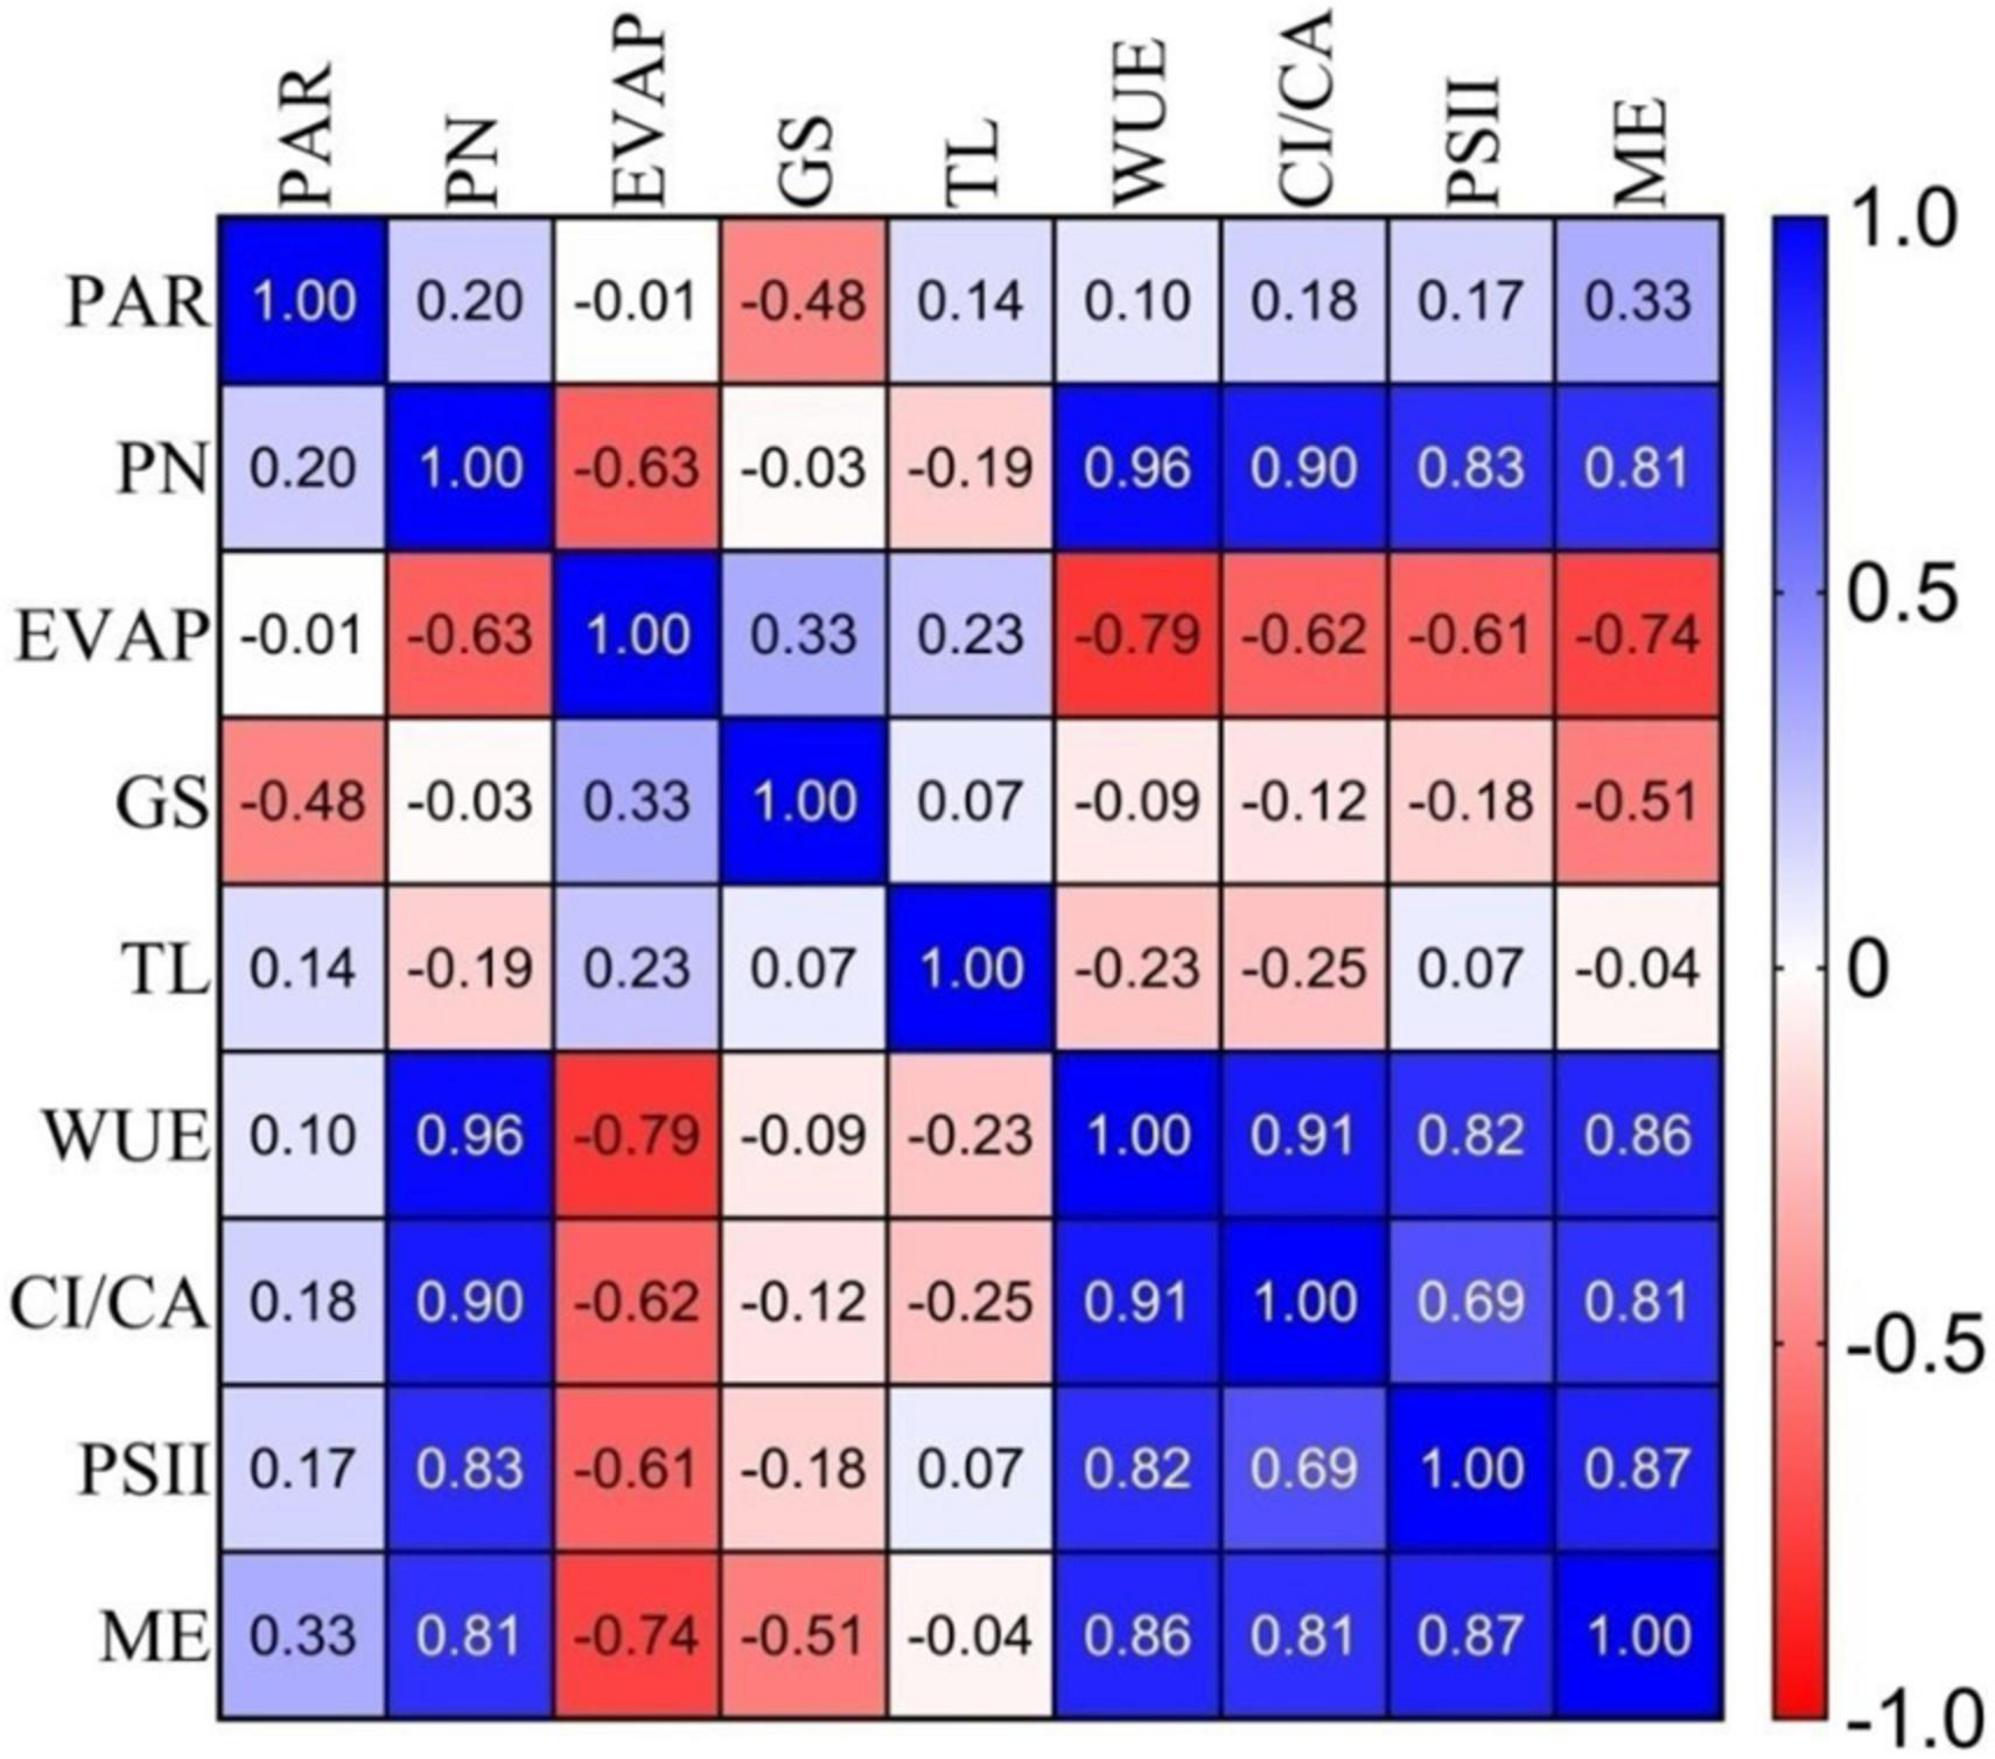
Figure 2. Correlation coefficients (r) among gas exchange, photochemical efficiency of PSII and mesophyll efficiency parameters of selected germplasm. Where: PAR, Photosynthetic Active Radiation; PN, Net Photosynthesis; EVAP, Transpiration; GS, Stomatal Conductance; TL, leaf temperature; WUE, Water Use Efficiency; CI/CA, Carboxylation efficiency; PSII, Photochemical efficiency of PSII; and ME, Mesophyll efficiency.
Pigment profiles
The anthocyanidins fractions were identified and quantified by HPLC from the purple-colored tea clones using pure anthocyanin standards. The anthocyanins content of the selected germplasm was from 988.62 to 4764.19 μg g–1 FW (Table 1). The germplasm TRA St. 817 exhibited the highest total anthocyanin content (4764.19 μg g–1 FW), followed by germplasm TRA St. 293 (2926.18 μg g–1 FW). Malvidin is the most predominant form of the purple-colored tea clones, similar to Bilberry (Vaccinium myrtillus) with malvidin-3-glucoside (60, 61); blueberry with malvidin-3-arabinoside, malvidin-3-glucoside and malvidin-3-galactoside (62); red grapes with malvidin-3-glucoside (63, 64). All edible berries contain malvidin-3-glucoside, malvidin-3-glucoside acetate, and malvidin-3-glucoside coumarate (65). Products like young red wine (7, 66), Italian red wine (34, 64), and grape juice (65) also contain malvidin as the predominant anthocyanin. It is a positive step toward the diversification of tea products and uses of tea.
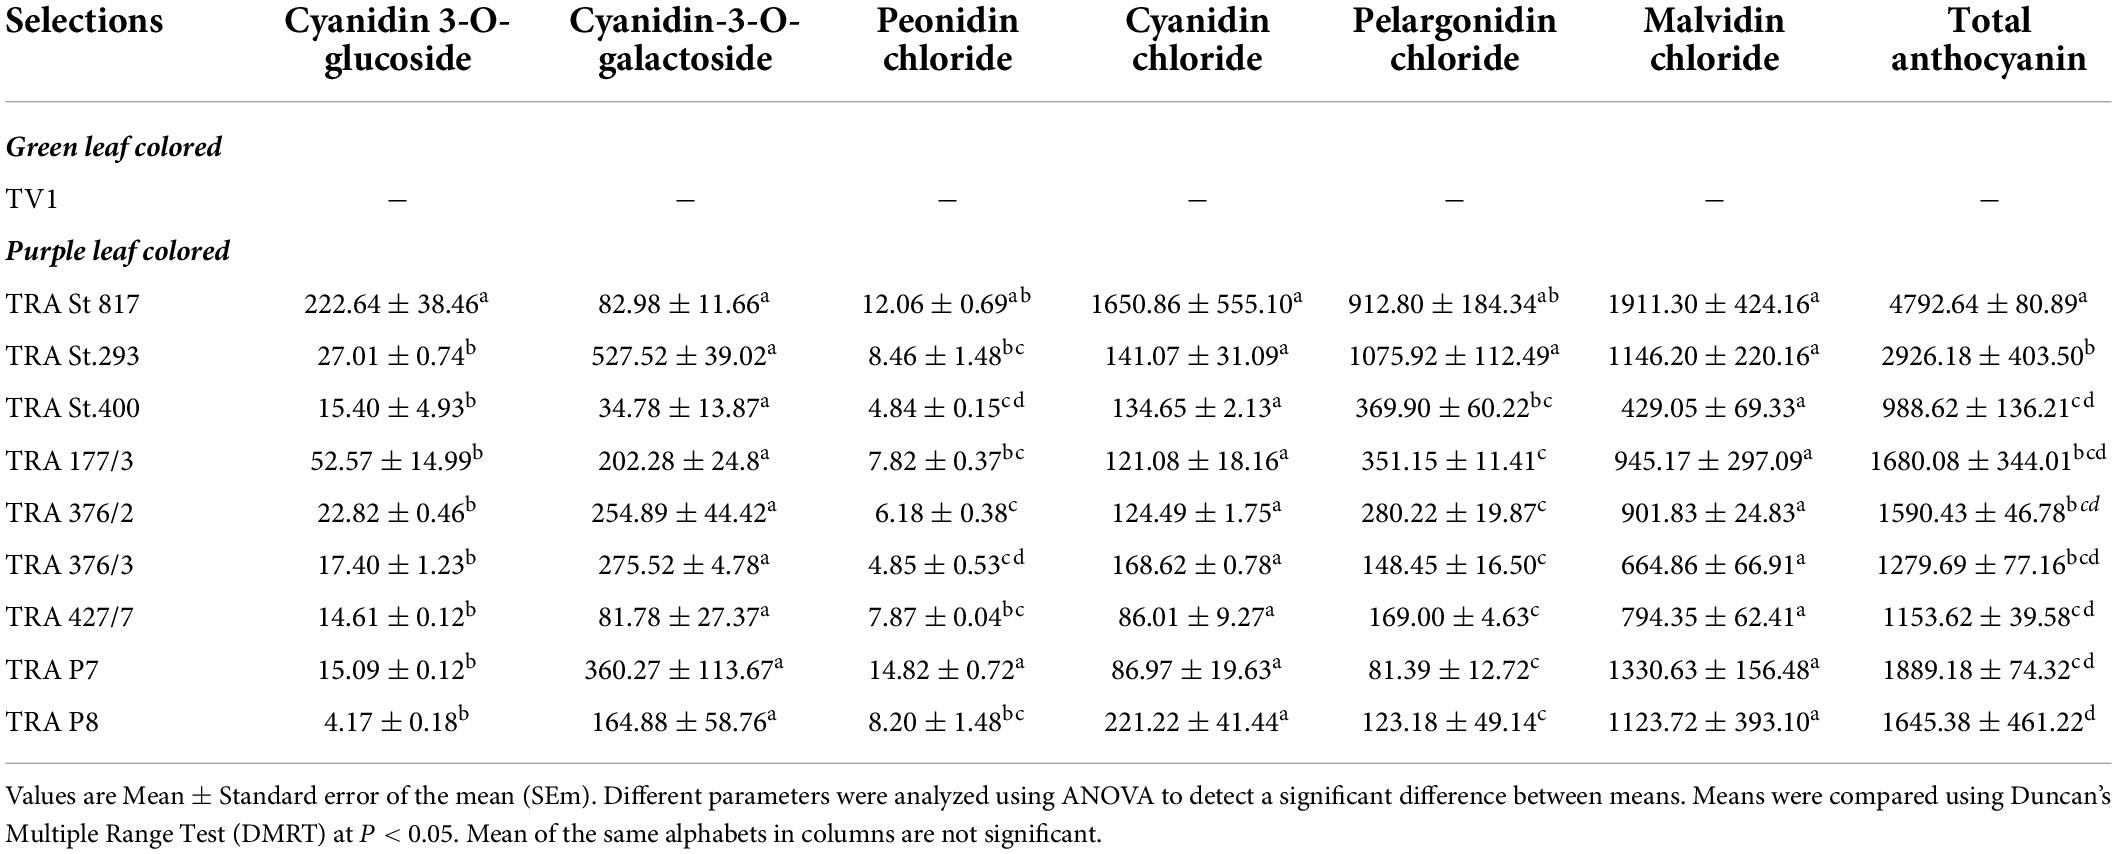
Table 1. Anthocyanidin concentrations (μgg–1 fresh weight) in green leaf and purple leaf colored clones.
Correlation of major group of anthocyanin pigments in the selected germplasm
The Pearson correlation coefficient among the major group of anthocyanin pigments for the 10 genotypes was calculated and presented in Figure 3. Total anthocyanin content showed a high positive correlation with cyanidin 3-o-glucoside (r = 0.83), peonidin chloride (r = 0.64), cyanidin chloride (r = 0.83) pelargonidin chloride (r = 0.68), and malvidin chloride (r = 0.84), in the selected anthocyanin pigmented tea germplasm for the studied purple tea (Figure 3).
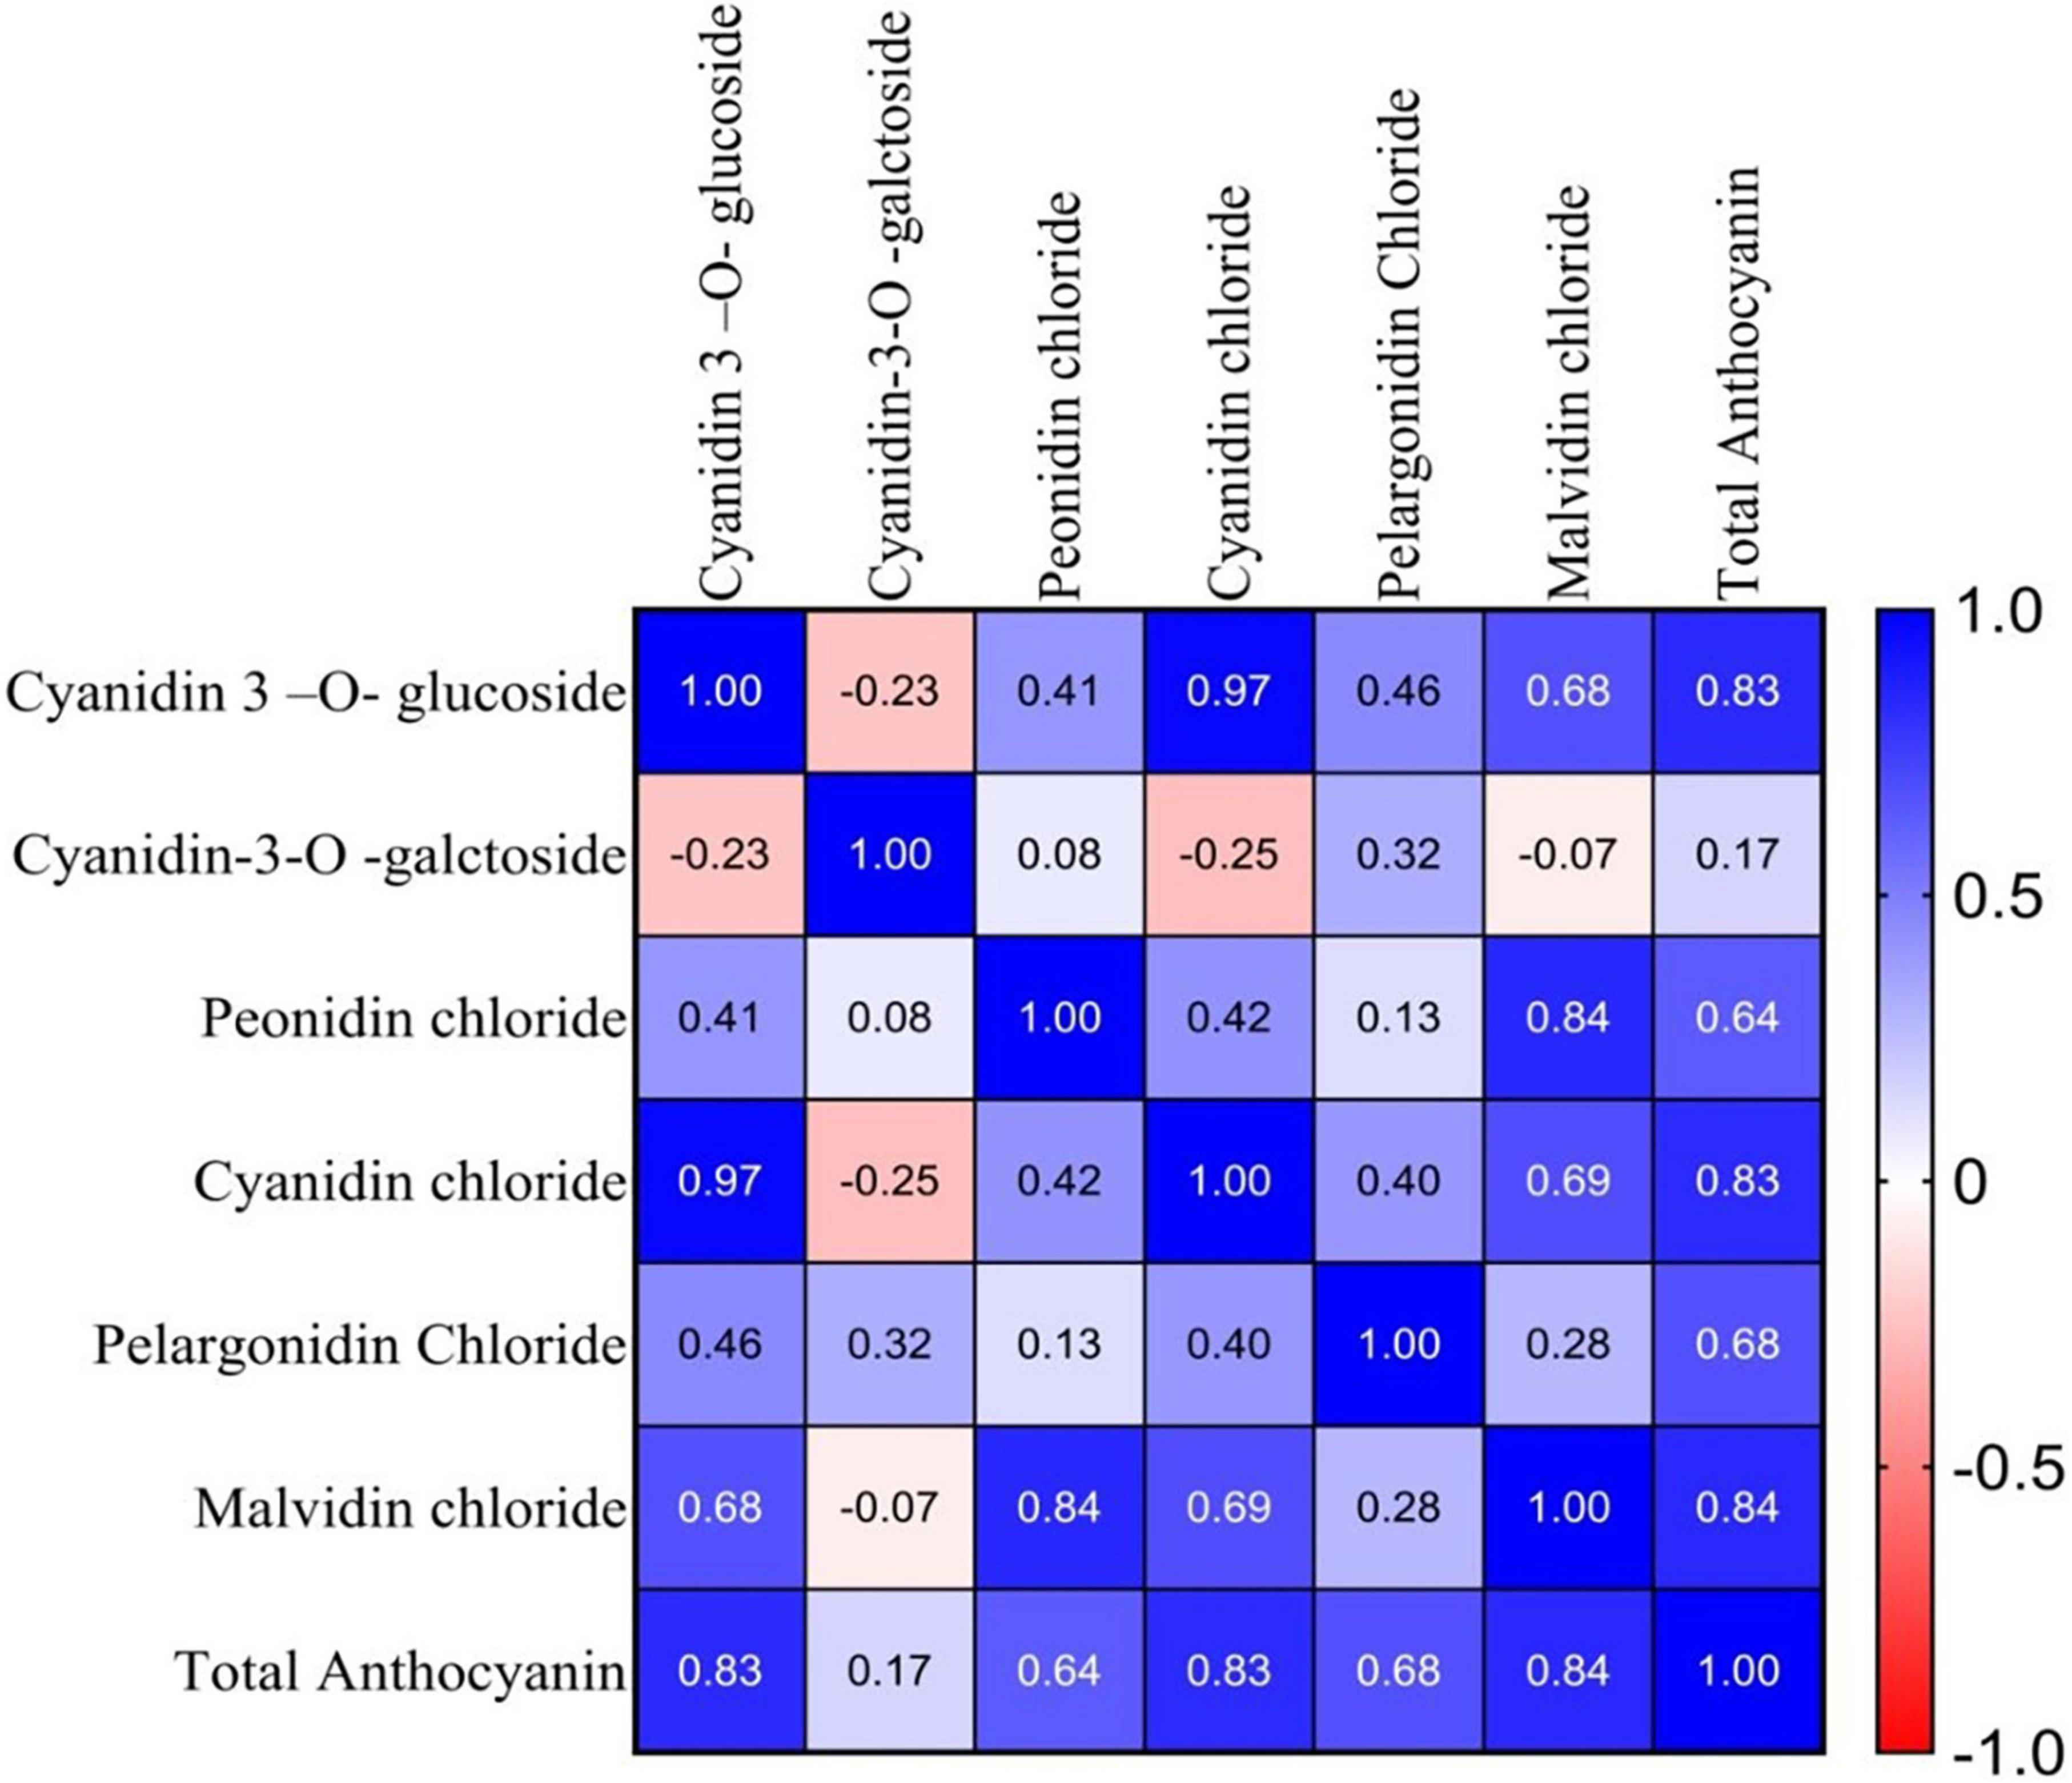
Figure 3. Correlation coefficients (r) between major groups of anthocyanin pigments of selected germplasm.
Catechins and caffeine
Besides anthocyanin, a comparison of catechins and caffeine content of the selected germplasm was attempted. The catechin and caffeine contents of the standard non-pigmented (green-colored) quality cultivar (TV1) and purple-colored tea germplasm were determined by HPLC using pure catechin standards. Catechins and caffeine normally present in the green-leaf colored tea plants were also present in the purple-colored tea cultivars, namely, EGC, + C, EC, EGCG, and EGC (Table 2). The highest total catechin content was recorded in TRA P8 (17.38%) and TRA P7 (16.34%), followed by TRA 376/2 (14.07%), whereas the caffeine content was noted in TRA P8 (1.46%), TRA P7 (0.59%), and TRA St. 817 (2.17%). A representative HPLC chromatogram is shown in Supplementary Figure 1.
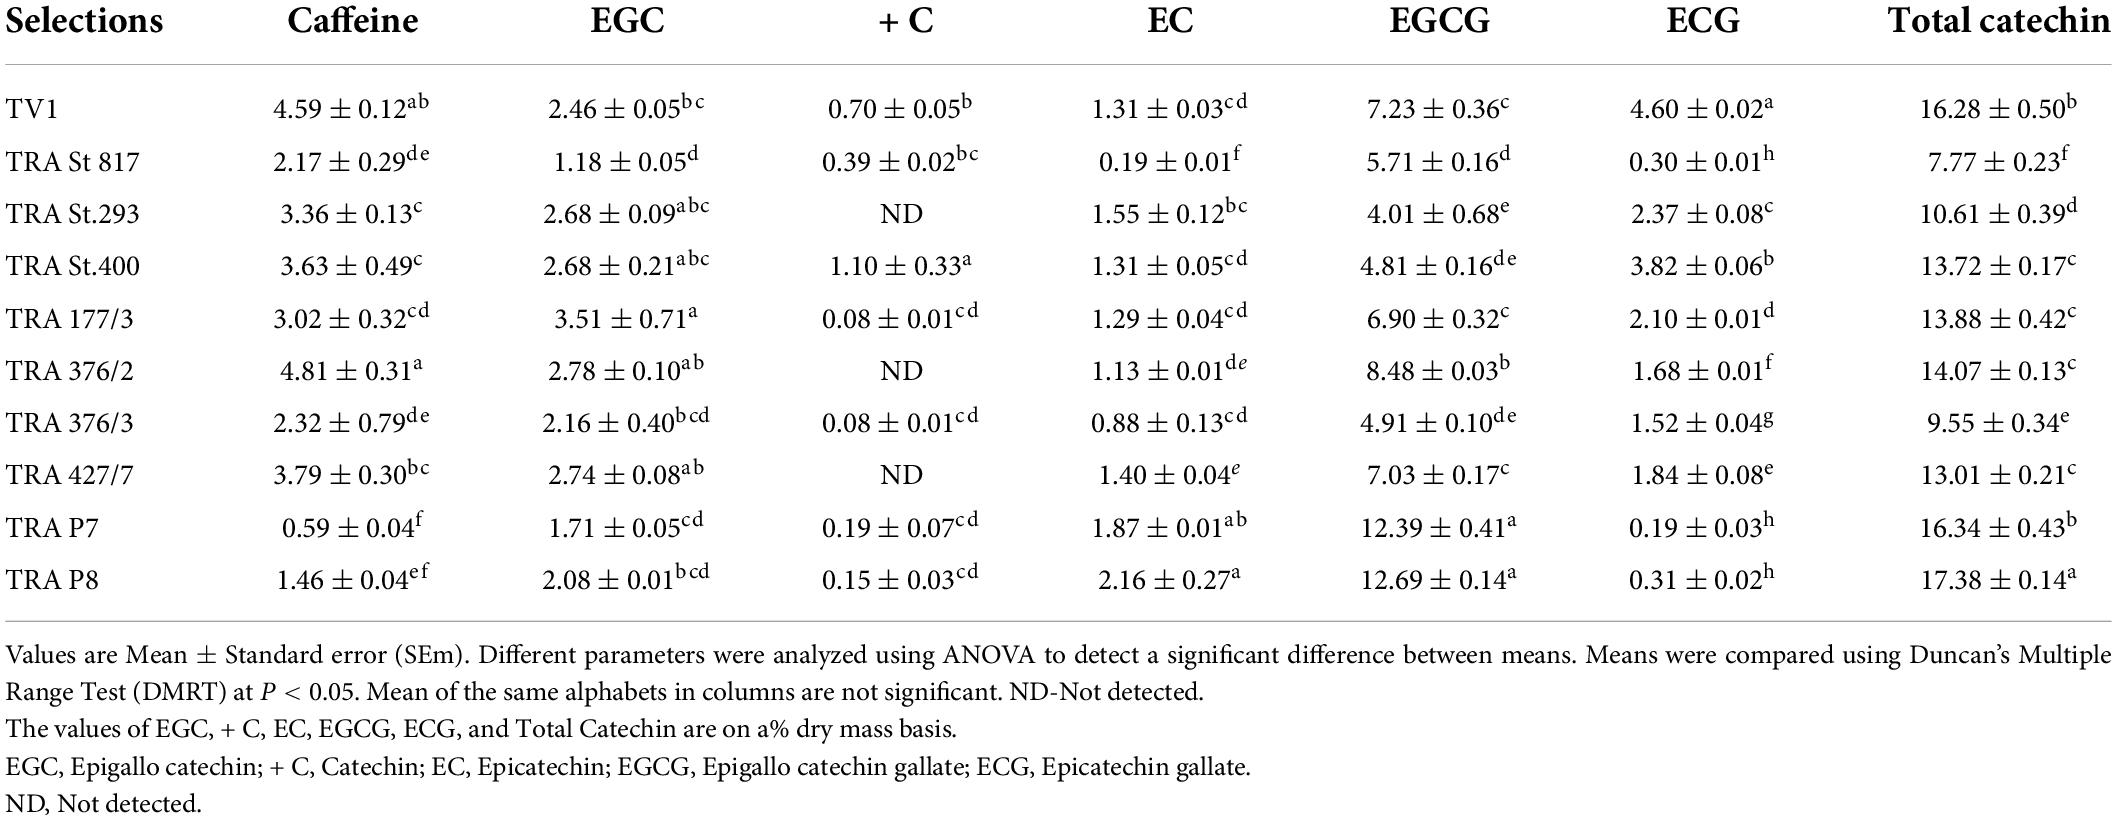
Table 2. Catechin and caffeine content (%) in green and purple colored leaves of tea germplasm.
Chlorophyll and carotenoids
Wide variations in chl “a,” chl “b,” car and total chl content were observed (Table 3). The differences between the selected germplasm with the chl parameters were statistically significant in most cases. A highly positive significant correlation (Figure 4) was observed between chl “a” and chl “b” (r = 0.82), total chl to chl a (r = 0.98) and total chl to car ratio (r = 0.81), indicating that chlorophyll and carotenoids are the structural and functional components of the chloroplast, and are correlated to each other as noted earlier (67).
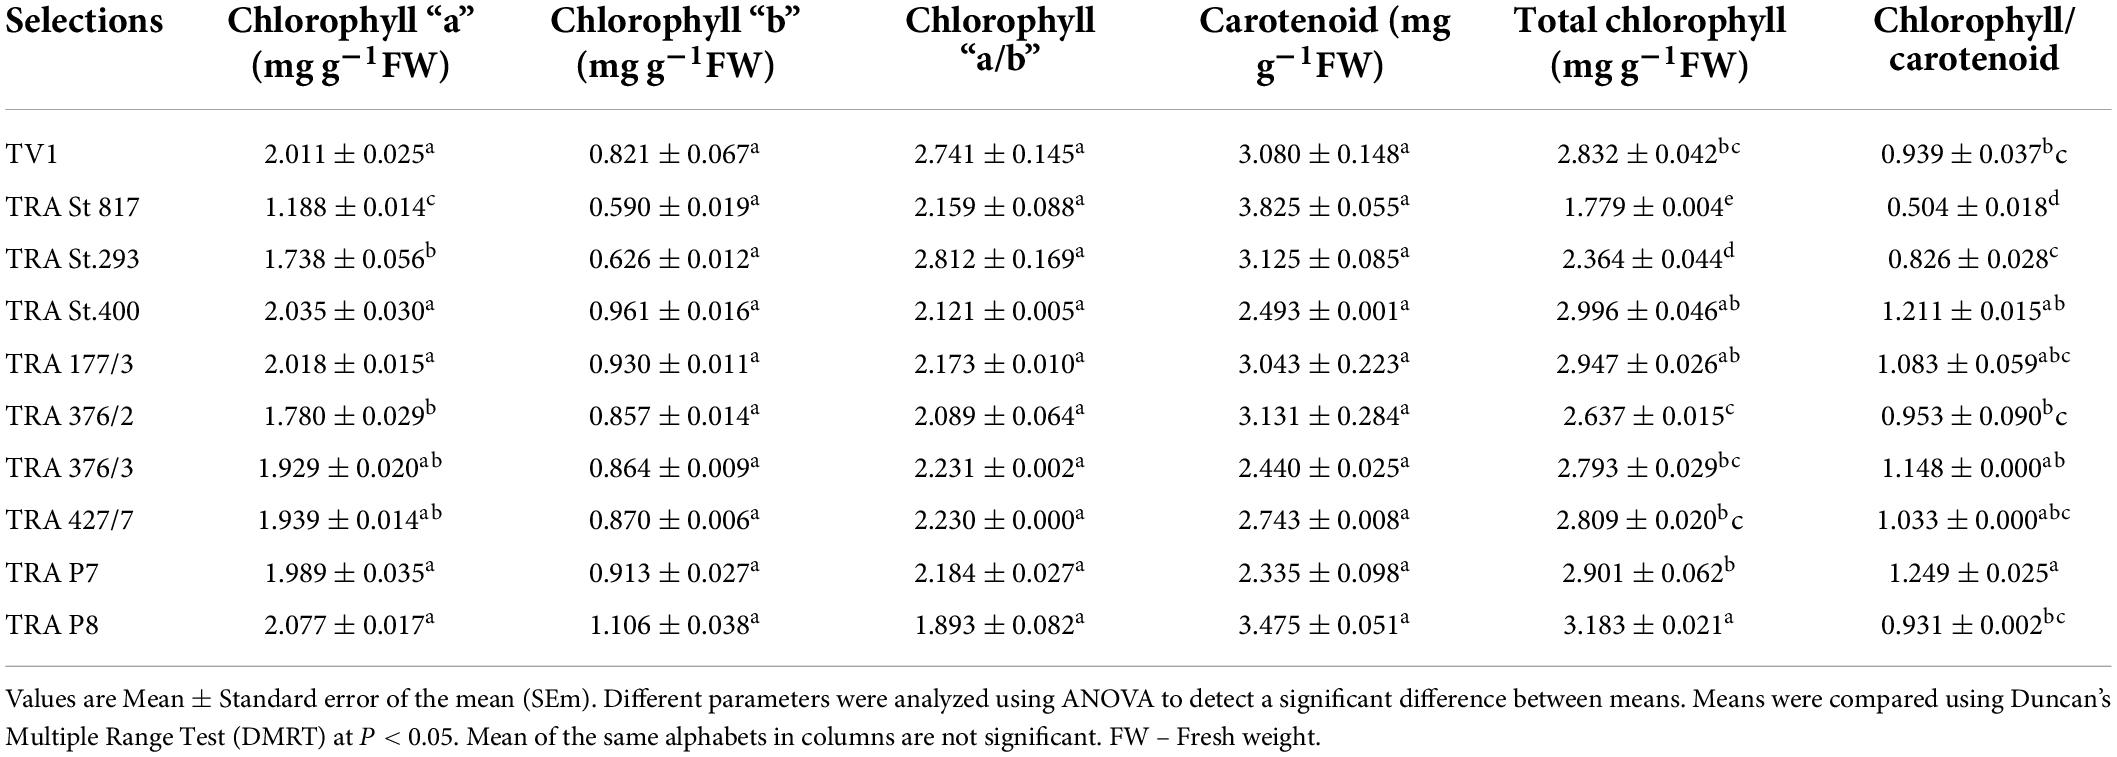
Table 3. Chlorophyll a, chlorophyll b, chlorophyll a/b ratio, total chlorophyll, carotenoids and chlorophyll/carotenoids ratio in the selected tea germplasm.
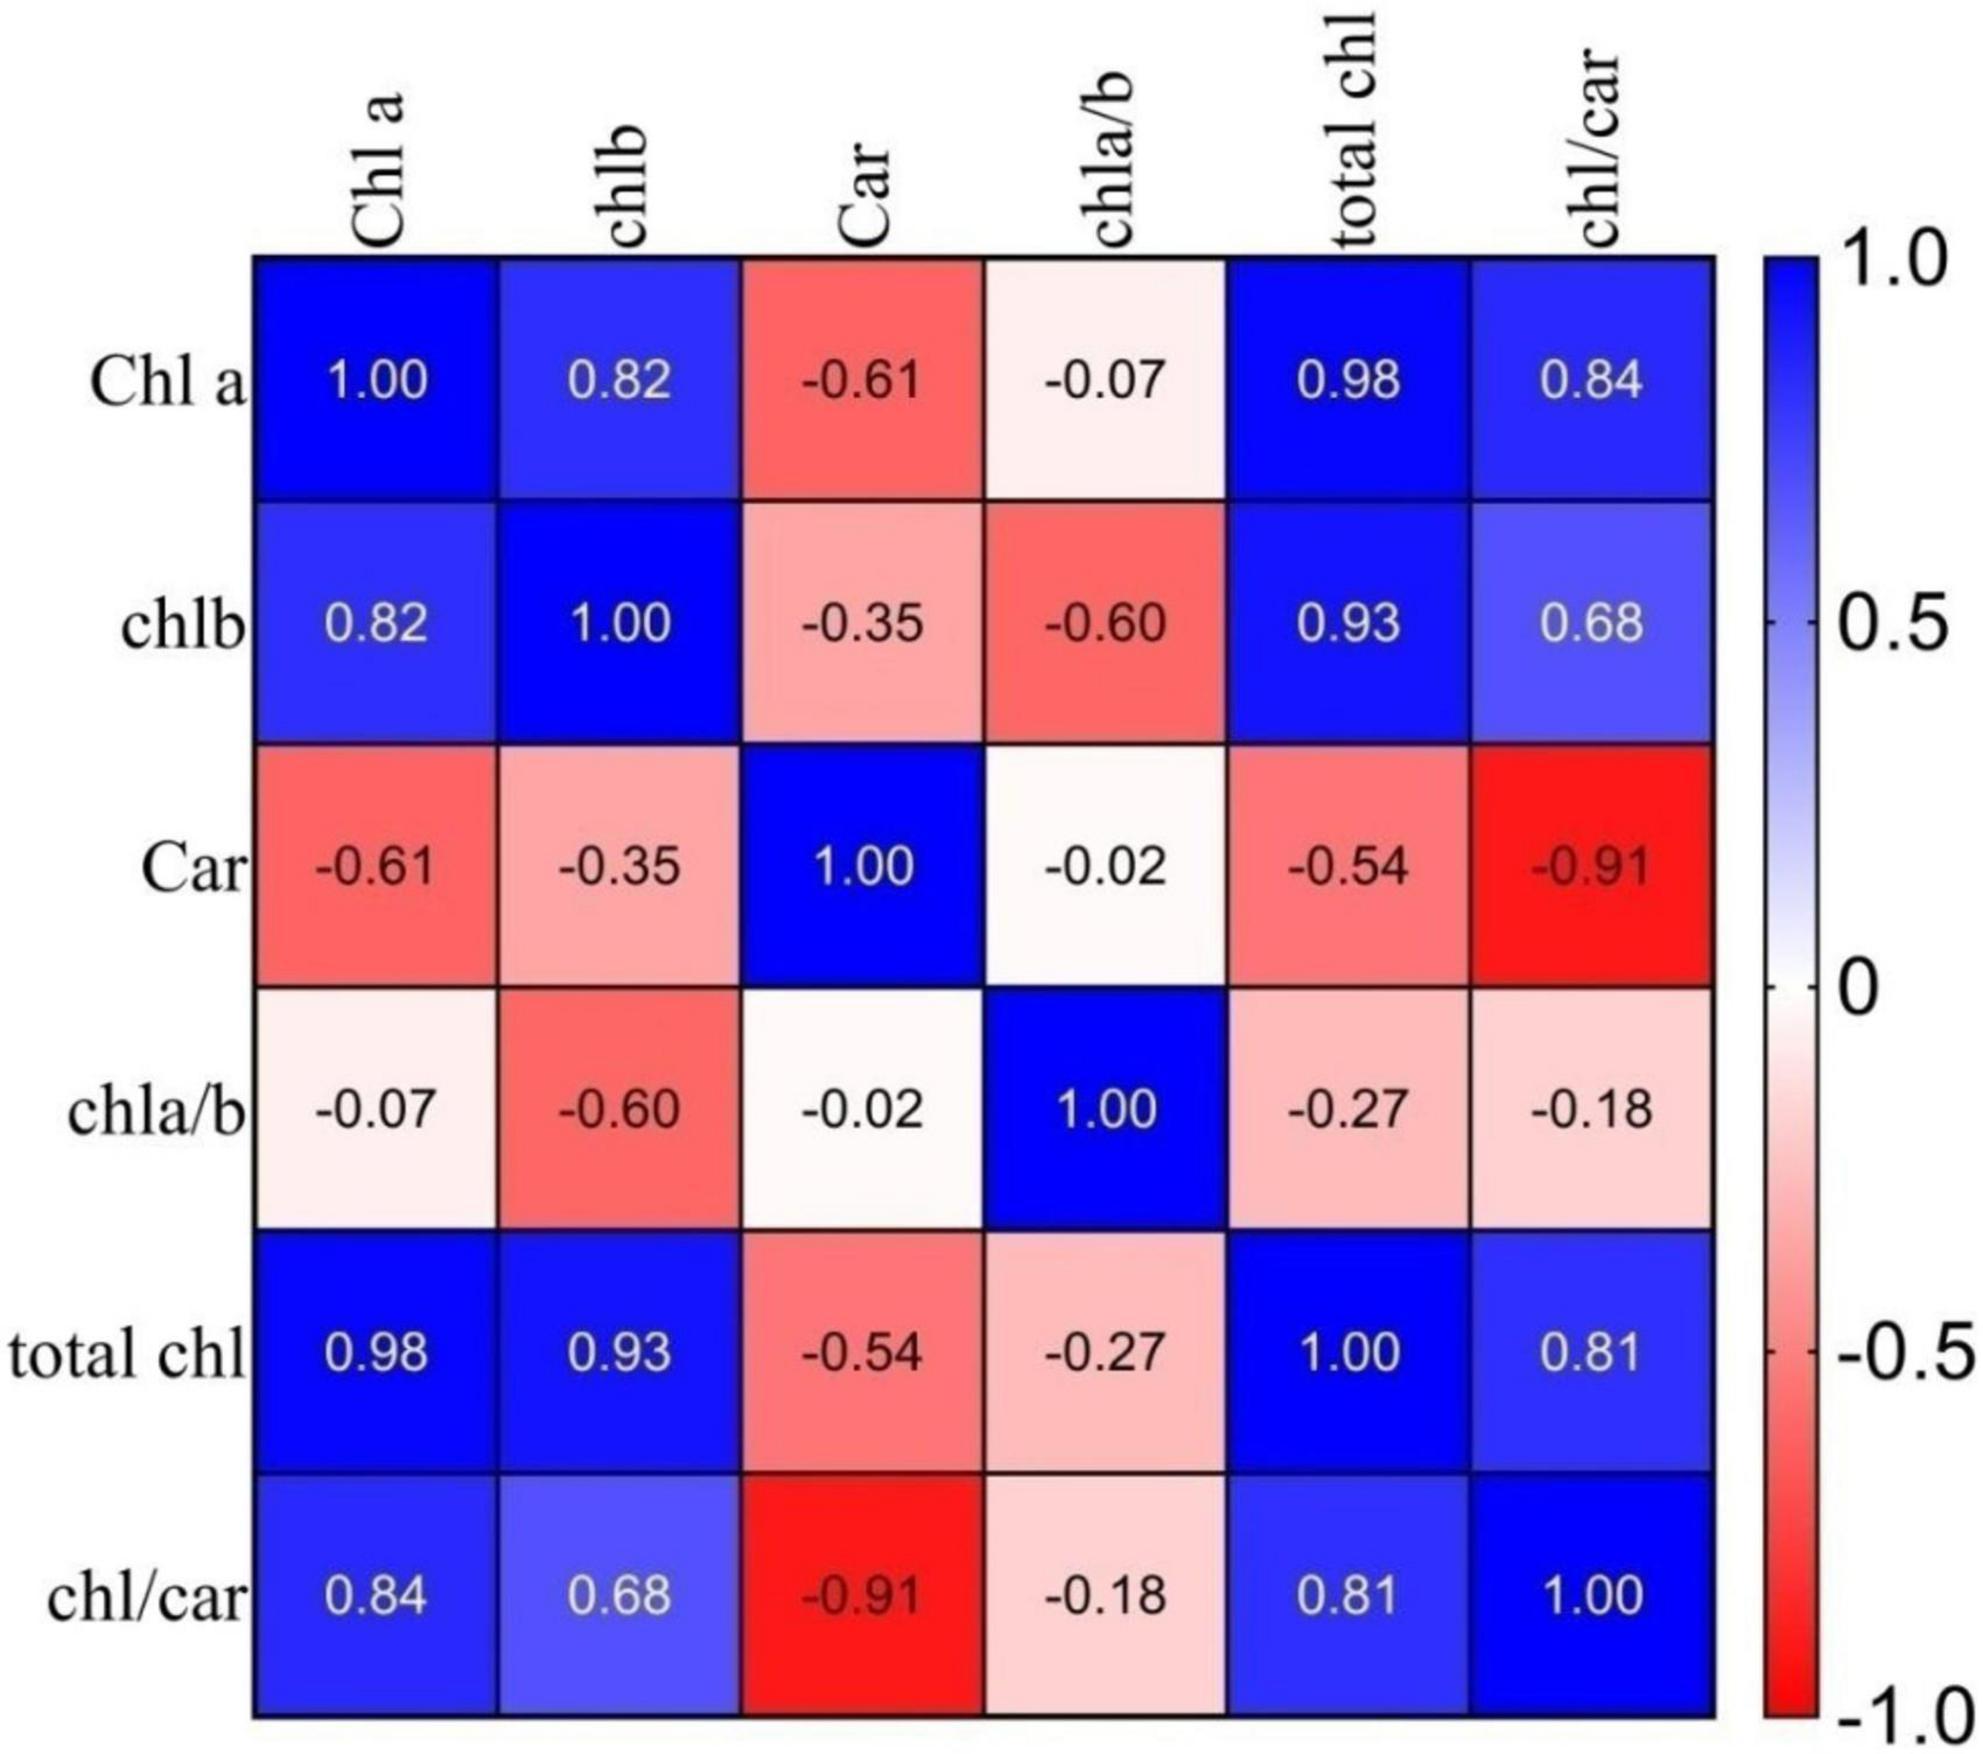
Figure 4. Correlation coefficients (r) between chlorophyll and carotenoid pigments of selected germplasm. Where: Chl a, chlorophyll a; Chl b, chlorophyll b; Car, carotenoid, chl a/b, chlorophyll a/chlorophyll b ratio; total chl, total chlorophyll; chl/car, chlorophyll/carotenoids ratio.
Chlorophyll is the most important plant pigment since it controls the photosynthetic reaction and determines the plant’s productivity (68). The total chlorophyll content of TRA St. 817 (1.779 mg g–1 FW) was found at the minimum, which is very suitable for manufacturing purple tea (Table 4). Chlorophyll contributes to the “blackness of tea,” which is one of the important criteria considered in the commercial evaluation of tea (69–71). Carotenoids are important for the aroma of tea (72–76). The highest concentration of carotenoids in TRA St. 817 was 3.825 mg g–1 FW, followed by TRA P8 (3.475 mg g–1 FW), favoring the formation of more volatile flavor constituents than TV1 and other selections.
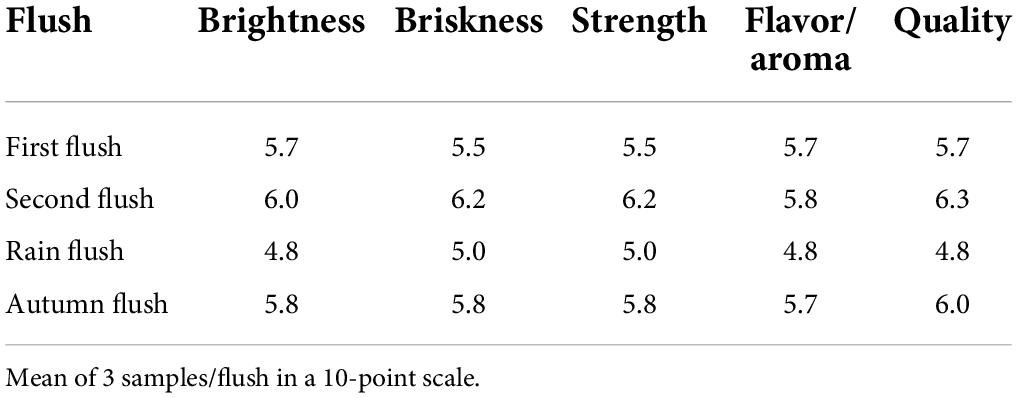
Table 4. Taster’s evaluation of promising purple tea germplasm TRA St.817.
Correlation of chlorophyll and carotenoid pigments in the selected germplasm
The Pearson correlation coefficient between the chlorophyll and carotenoid pigments for the 10 genotypes was calculated and presented in Figure 4. Total chl content exhibited a high positive correlation with chl “a” (r = 0.98), chl “b” (r = 0.93), and chl to car ratio (r = 0.81), with a significant negative correlation with the car (r = −0.54). Similarly, the chl a/b ratio showed a significant negative correlation with total chl (r = −0.27) in purple tea’s selected high anthocyanin pigmented germplasm.
Organoleptic evaluation
The rain flush showed a lighter purple color in the organoleptic examination of the prepared tea samples from TRA St. 817. The second and autumn flushes illustrate a purple color, and mellow flavor, with a brothy, mild undertone and a pleasant mouth feel (Photo plate II, Table 4). This genotype of tea has the potential to provide anthocyanin-rich special tea.
Multiplication of TRA St. 817 germplasm
Cleft grafting was started on the first flush (March–April 2017) to the autumn flush (October–December 2017) at the Tocklai experimental plot. The study was arranged in an RBD consisting of a flushing period with three replications. A total of 15 bushes were used for cleft grafting in each flush. Each bush had a maximum of 10–12 graft unions. A total of 150–180 graft unions were established in each flush. The results show that the interaction between rootstock and scion determines graft union’s success. There is no statistically significant difference between the grafting success rates per cent in response to the flushes. This is the uniqueness of the prospective germplasm that produces a precise grafting performance among four flushes. Since the scion bud is in an ideal physiological state or dormant phase, the autumn flush had the highest success rate (91.4%). In contrast, the rain flush had the lowest success rate (82.8%) among the four flushes (Figure 5). The grafting method is illustrated in Photo plate III, and the micro-plot was established through cleft grafting (Photo plates III and IV).
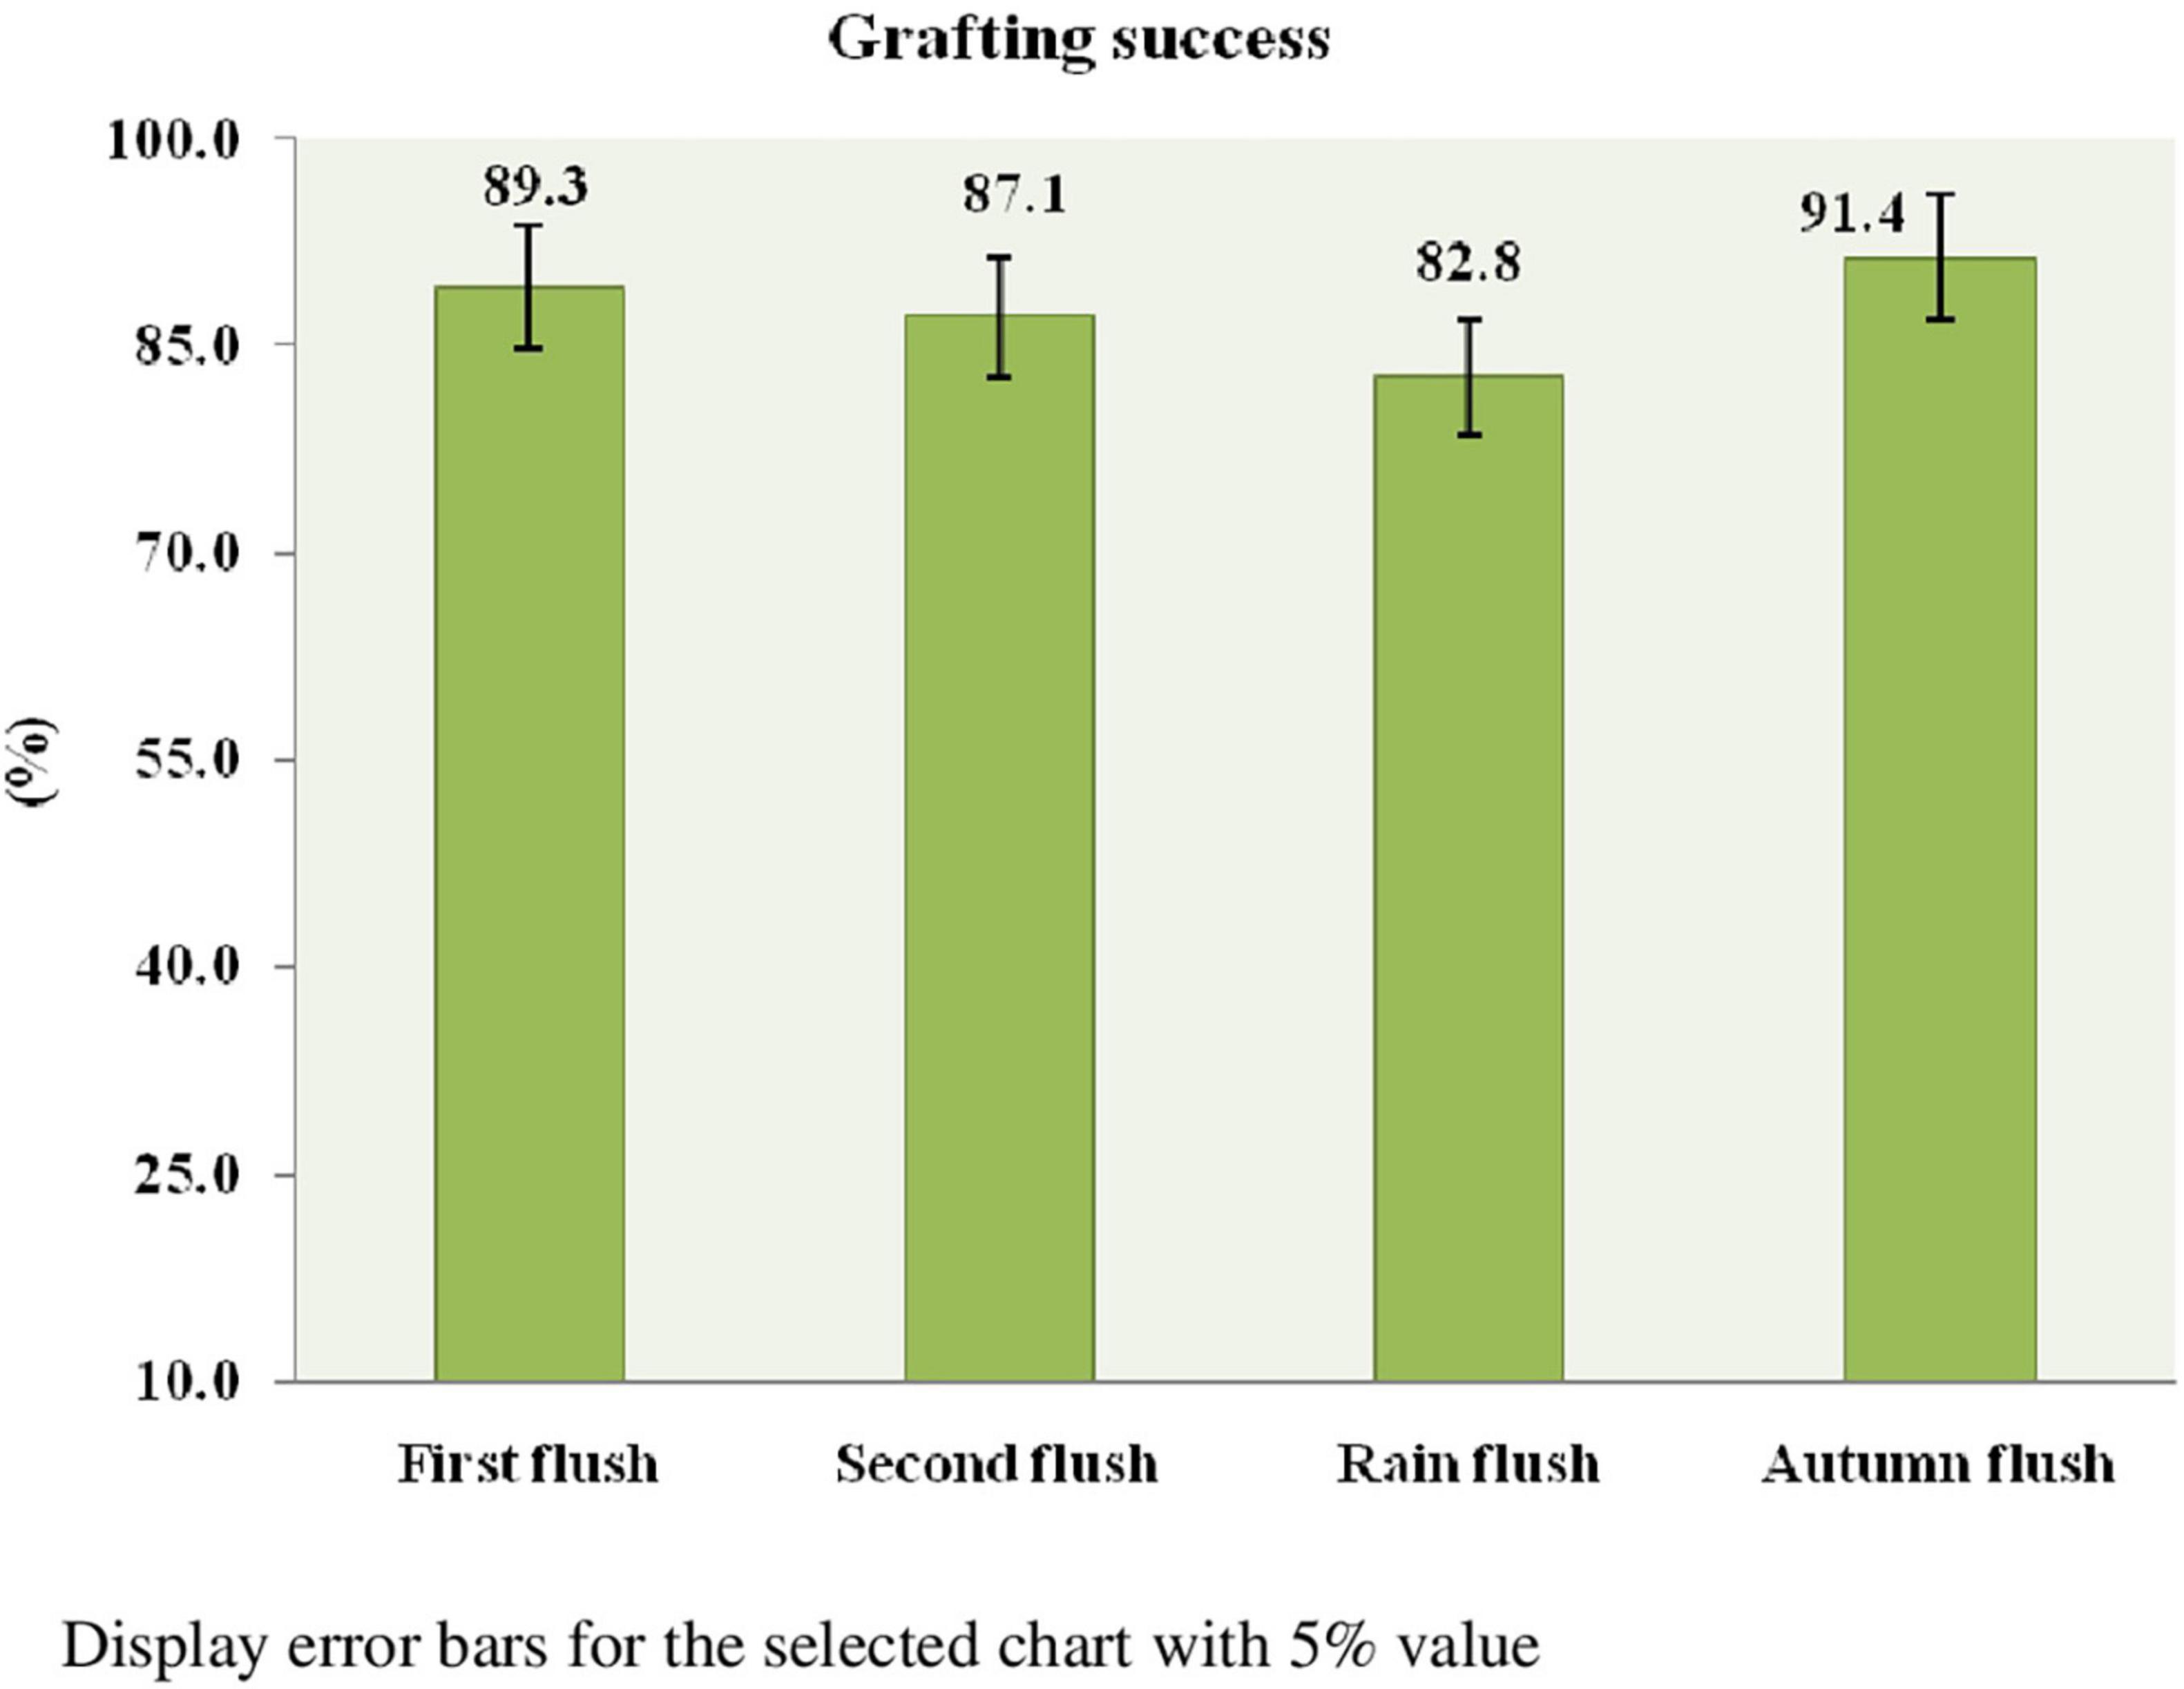
Figure 5. Effect of flushing on the success of grafting.
Conclusion
This study reveals that TRA St.817 is physiologically more efficient among the tea germplasm, having the highest net photosynthesis (24.7 μmol m–2s–1), water use efficiency (19.02 μmol mmol–1), mesophyll efficiency (ci/gs ratio: 2.54) and the highest photochemical efficiency of PSII (fv/fm: 0.754). Moreover, it is simple to multiply for mass production, with a 91.4% grafting success rate to meet future industrial demand. Regarding quality, the TRA St.817 germplasm exhibits the highest total anthocyanin pigment (4764.19 μg g–1 fresh leaf weight), carotenoid content (3.825 mg g–1 fresh leaf weight), mild caffeine (2.17%), purple colored tea liquor, mellow flavor, with a brothy, mild undertone and a pleasant mouth feel, making it a unique tea. In contrast, total chlorophyll content is significantly low (1.779 mg g–1 fresh weight), which is very suitable for manufacturing purple tea. For the carotenoids, the highest concentration of carotenoids in TRA St. 817 is 3.825 mg g–1 FW, followed by TRA P8 (3.475 mg g–1 FW), favoring the formation of more volatile flavor constituents. It suits for making purple tea based on physiological, biochemical, organoleptic, and multiplication performance among the nine pigmented germplasm. It has the potential to be introduced to the tea industry for the first time as novel purple tea germplasm. The outcome opens up many opportunities for commercial tea growth and diversification for growers in Northeast India in making purple tea.
Data availability statement
The original contributions presented in this study are included in the article/Supplementary material, further inquiries can be directed to the corresponding author/s.
Author contributions
PKP: experimental design, original draft preparation, data curation, simulation, tables, figures, and photo plates. SAS and KK: data management and interpreting. SS and RS: methodology development and HPLC analysis. BG and SKS: experimental supervision and field data generation. RKB: field trial establishment and grafting. JKS: data generation and HPLC analysis. RCG: quality analysis of made tea. KB, JY, YT, and SM: reviewing, editing, and manuscript revision. BD: micro-plot establishment and availability of resources. All authors listed have made a substantial, direct, and intellectual contribution to the work, and approved it for publication.
Funding
This work was supported by the National Tea Research Foundation (NTRF) of India (Sanction No. NTRF:204/2018).
Conflict of interest
The authors declare that the research was conducted in the absence of any commercial or financial relationships that could be construed as a potential conflict of interest.
Publisher’s note
All claims expressed in this article are solely those of the authors and do not necessarily represent those of their affiliated organizations, or those of the publisher, the editors and the reviewers. Any product that may be evaluated in this article, or claim that may be made by its manufacturer, is not guaranteed or endorsed by the publisher.
Supplementary material
The Supplementary Material for this article can be found online at: https://www.frontiersin.org/articles/10.3389/fnut.2022.990529/full#supplementary-material
Abbreviations
Pn, Net Photosynthesis; PAR, Photosynthetic Active Radiation; Tl, Leaf Temperature; Gs or gs, Stomatal Conductance; E, Transpiration; WUE, Water Use Efficiency (Pn/E); CI or ci, Intercellular CO2 concentration; CA or ca, Atmospheric CO2 concentration; CI/CA, Carboxylation Efficiency; ME, Mesophyll Efficiency (ci/gs); Fv/fm, Chlorophyll Fluorescence/Photochemical Efficiency of PSII; PSII, Photosystem II; TV, Tocklai Vegetative; Chl –, Chlorophyll; Car, Carotenoid; RBD, Randomized Block Design; HPLC, High-Performance Liquid Chromatography; TRA, Tea Research Association; TTRI, Tea Research Institute; EGC, epigallocatechin + C-catechin; EC, epicatechin; EGCG, epigallocatechin gallate; EGC, epicatechin gallate.
References
1. FAO. Commodity in focus, International Tea Market: Market Situation, Prospects and Emerging Issues. Rome: FAO (2022).
3. Ho C, Lin J, Shahidi F. Tea and tea Products: Chemistry and Health-promoting Properties. Boca Raton FL: CRC Press (2009).
4. Konwar B. Biodiversity of tea in North East India and their conservation at Tocklai. Two Bud. (1999) 46:7–12.
5. Singh ID. Indian tea germplasm and its contribution to the world tea industry. Two Bud. (1979) 26:23–6.
6. Khoo HE, Azlan A, Tang ST, Lim SM. Anthocyanidins and anthocyanins: colored pigments as food, pharmaceutical ingredients, and the potential health benefits. Food Nutr Res. (2017) 61:1361779. doi: 10.1080/16546628.2017.1361779
7. Rivero-Pérez MD, Muñiz P, González-Sanjosé ML. Contribution of anthocyanin fraction to the antioxidant properties of wine. Food Chem Toxicol. (2008) 46:2815–22. doi: 10.1016/j.fct.2008.05.014
8. Nicoué EÉ, Savard S, Belkacemi K. Anthocyanins in wild blueberries of quebec: extraction and identification. J Agric Food Chem. (2007) 55:5626–35. doi: 10.1021/jf0703304
9. Condurache Lazăr NN, Croitoru C, Enachi E, Bahrim G-E, Stănciuc N, Râpeanu G. Eggplant peels as a valuable source of anthocyanins: extraction, thermal stability and biological activities. Plants (2021) 10:577. doi: 10.3390/plants10030577
10. Sadilova E, Stintzing FC, Carle R. Anthocyanins, colour and antioxidant properties of eggplant (Solanum melongena L.) and violet pepper (Capsicum annuum L.) peel extracts. Z Fur Naturforsch C J Biosci. (2006) 61:527–35. doi: 10.1515/znc-2006-7-810
11. Azuma K, Ohyama A, Ippoushi K, Ichiyanagi T, Takeuchi A, Saito T, et al. Structures and antioxidant activity of anthocyanins in many accessions of eggplant and its related species. J Agric Food Chem. (2008) 56:10154–9. doi: 10.1021/jf801322m
12. Lo C-W, Huang H-P, Lin H-M, Chien C-T, Wang C-J. Effect of Hibiscus anthocyanins-rich extract induces apoptosis of proliferating smooth muscle cell via activation of P38 MAPK and p53 pathway. Mol Nutr Food Res. (2007) 51:1452–60. doi: 10.1002/mnfr.200700151
13. Mazza G, Miniati E. Anthocyanin in Fruits, Vegetables and Grains. Boca Raton, FL: CRC Press (1993).
14. Feild TS, Lee DW, Holbrook NM. Why leaves turn red in autumn. the role of anthocyanins in senescing leaves of red-osier dogwood. Plant Physiol. (2001) 127:566–74. doi: 10.1104/pp.010063
15. Jackman Rl, Yada Ry, Tung Ma, Speers Ra. Anthocyanins as food colorants? A review. J Food Biochem. (1987) 11:201–47. doi: 10.1111/j.1745-4514.1987.tb00123.x
16. Chanoca A, Kovinich N, Burkel B, Stecha S, Bohorquez-Restrepo A, Ueda T, et al. Anthocyanin vacuolar inclusions form by a microautophagy mechanism. Plant Cell. (2015) 27:2545–59. doi: 10.1105/tpc.15.00589
17. Steyn WJ, Wand SJE, Holcroft DM, Jacobs G. Anthocyanins in vegetative tissues: a proposed unified function in photoprotection. New Phytol. (2002) 155:349–61. doi: 10.1046/j.1469-8137.2002.00482.x
18. Kong J-M, Chia L-S, Goh N-K, Chia T-F, Brouillard R. Analysis and biological activities of anthocyanins. Phytochemistry. (2003) 64:923–33. doi: 10.1016/s0031-9422(03)00438-2
19. Bae S-H, Suh H-J. Antioxidant activities of five different mulberry cultivars in Korea. LWT Food Sci Technol. (2007) 40:955–62. doi: 10.1016/j.lwt.2006.06.007
20. Shi N, Chen X, Chen T. Anthocyanins in colorectal cancer prevention review. Antioxidants. (2021) 10:1600. doi: 10.3390/antiox10101600
21. Hair R, Sakaki JR, Chun OK. Anthocyanins, microbiome and health benefits in aging. Molecules. (2021) 26:537. doi: 10.3390/molecules26030537
22. Bagchi D, Roy S, Patel V, He G, Khanna S, Ojha N, et al. Safety and whole-body antioxidant potential of a novel anthocyanin-rich formulation of edible berries. Mol Cell Biochem. (2006) 281:197–209. doi: 10.1007/s11010-006-1030-6
23. Cisowska A, Wojnicz D, Hendrich AB. Anthocyanins as antimicrobial agents of natural plant origin. Nat Prod Commun. (2011) 6:149–56. doi: 10.1177/1934578x1100600136
24. Garcia C, Blesso CN. Antioxidant properties of anthocyanins and their mechanism of action in atherosclerosis. Free Radic Biol Med. (2021) 172:152–66. doi: 10.1016/j.freeradbiomed.2021.05.040
25. Salamon I, Şimşek Sezer EN, Kryvtsova M, Labun P. Antiproliferative and antimicrobial activity of anthocyanins from berry fruits after their isolation and freeze-drying. Appl Sci. (2021) 11:2096. doi: 10.3390/app11052096
26. Viskelis P, Rubinskienė M, Jasutienė I, Šarkinas A, Daubaras R, Česonienė L. Anthocyanins, antioxidative, and antimicrobial properties of american cranberry (Vaccinium macrocarpon Ait.) and their Press Cakes. J Food Sci. (2009) 74:C157–61. doi: 10.1111/j.1750-3841.2009.01066.x
27. Elisia I, Kitts DD. Anthocyanins inhibit peroxyl radical-induced apoptosis in Caco-2 cells. Mol Cell Biochem. (2008) 312:139–45. doi: 10.1007/s11010-008-9729-1
28. Salehi B, Sharifi-Rad J, Cappellini F, Reiner Ž, Zorzan D, Imran M, et al. The therapeutic potential of anthocyanins: current approaches based on their molecular mechanism of action. Front Pharmacol. (2020) 11:1300. doi: 10.3389/fphar.2020.01300
29. Li W, Tan L, Zou Y, Tan X, Huang J, Chen W, et al. The Effects of Ultraviolet A/B treatments on anthocyanin accumulation and gene expression in dark-purple tea cultivar “Ziyan” (Camellia sinensis). Molecules. (2020) 25:354. doi: 10.3390/molecules25020354
30. Merzlyak MN, Chivkunova OB, Solovchenko AE, Naqvi KR. Light absorption by anthocyanins in juvenile, stressed, and senescing leaves. J Exp Bot. (2008) 59:3903–11. doi: 10.1093/jxb/ern230
31. Zhang Q, Zhai J, Shao L, Lin W, Peng C. Accumulation of anthocyanins: an adaptation strategy of mikania micrantha to low temperature in winter. Front Plant Sci. (2019) 10:1049. doi: 10.3389/fpls.2019.01049
32. Hughes NM, Neufeld HS, Burkey KO. Functional role of anthocyanins in high-light winter leaves of the evergreen herb Galax urceolata. New Phytol. (2005) 168:575–87. doi: 10.1111/j.1469-8137.2005.01546.x
33. Ju Y, Yang L, Yue X, Li Y, He R, Deng S, et al. Anthocyanin profiles and color properties of red wines made from Vitis davidii and Vitis vinifera grapes. Food Sci Hum Wellness. (2021) 10:335–44. doi: 10.1016/j.fshw.2021.02.025
34. Rigo A, Vianello F, Clementi G, Rossetto M, Scarpa M, Vrhovšek U, et al. Contribution of proanthocyanidins to the peroxy radical scavenging capacity of some italian red wines. J Agric Food Chem. (2000) 48:1996–2002. doi: 10.1021/jf991203d
35. Giusti M, Wrolstad R. Unit F1.2: anthocyanins. Characterization and measurement with UV- spectroscopy. In: RE Wrolstad editor. Current Protocol in Food Analytical Chemistry. New York, NY: John Wiley and Sons (2001).
36. Kerio LC, Wachira FN, Wanyoko JK, Rotich MK. Characterization of anthocyanins in kenyan teas: extraction and identification. Food Chem. (2012) 131:31–8. doi: 10.1016/j.foodchem.2011.08.005
37. ISO 14502-2.Determination of Substances Characteristic of Green and Black tea - part 2: Content of Catechins in Green tea - Method Using high-performance Liquid Chromatography. Geneva: ISO (2005).
39. ISO 3163.Method for Preparation of Infusion for Sensory Evaluation” and “Examples of Pots and Bowls for Preparation of Tea Liquor”. Geneva: ISO (1990).
40. Joshi VK. “Method of sensory analysis and evaluation taste and overall quality,” In Sensory Science, Principles and Application in Food Evaluation. Udaipur: Geeta Somani Agrotech Publishing Academy (2006).
42. Gogoi RC, Sanyal S. Tea Tasting Manual. First Edition© ed. Jorhat: Tea Research Association (2016).
43. Patel PK, Zhang D, Borthakur D, Hazarika M, Boruah P, Barooah R, et al. Quality Green Tea (Camellia sinensis L.) Clones Marked through Novel Traits. Beverages. (2019) 5:63. doi: 10.3390/beverages5040063
44. Barman TS, Baruah U, Saikia JK. Irradiance influences tea leaf (Camellia sinensis L.) photosynthesis and transpiration. Photosynthetica. (2008) 46:618–21. doi: 10.1007/s11099-008-0104-y
45. Hajra NG, Kumar R. Seasonal variation in photosynthesis and productivity of young tea. Exp Agric. (1999) 35:71–85.
46. Hajara N, Kumar R. Diurnal and seasonal variation in gas exchange property of tea leaves. J Plant Biol. (2002) 29:169–73.
47. Barua D. Photosynthesis and respiration. In: D Baruwa editor. Jorhat, India: Science and Practice in Tea Culture. Jorhat: Tocklai Experimental Station (1989).
48. Hadfield W. Leaf temperature, leaf pose and productivity of the tea bush. Nature. (1968) 219:282–4. doi: 10.1038/219282a0
49. Whitehead D, Okali DUU, Fasehun FE. Stomatal response to environmental variables in two tropical forest species during the dry season in Nigeria. J Appl Ecol. (1981) 18:571. doi: 10.2307/2402418
50. De Costa WAJM, Mohotti AJ, Wijeratne MA. Ecophysiology of tea. Braz J Plant Physiol. (2007) 19:299–332. doi: 10.1590/s1677-04202007000400005
51. Cowan IR. Stomatal behaviour and environment. Adv Bot Res. (1978) 4:117–228. doi: 10.1016/s0065-2296(08)60370-5
52. Wang F, Gao J, Yong JWH, Wang Q, Ma J, He X. Higher Atmospheric CO2 Levels Favor C3 Plants Over C4 Plants in Utilizing Ammonium as a Nitrogen Source. Front Plant Sci. (2020) 11:537443. doi: 10.3389/fpls.2020.537443
53. Oakley JC, Sultmanis S, Stinson CR, Sage TL, Sage RF. Comparative studies of C3 and C4Atriplex hybrids in the genomics era: physiological assessments. J. Exp Bot. (2014) 65:3637–47. doi: 10.1093/jxb/eru106
54. Weber JA, Jurik TW, Tenhunen JD, Gates DM. Analysis of gas exchange in seedlings of Acer saccharum: integration of field and laboratory studies. Oecologia. (1985) 65:338–47. doi: 10.1007/bf00378907
55. Yan J, Zhu C, Liu W, Luo F, Mi J, Ren Y, et al. High photosynthetic rate and water use efficiency of Miscanthus lutarioriparius characterize an energy crop in the semiarid temperate region. GCB Bioenergy. (2014) 7:207–18. doi: 10.1111/gcbb.12118
56. Frank AB, Barker RE, Berdahl JD. Water-Use efficiency of grasses grown under controlled and field conditions. Agronomy J. (1987) 79:541–4. doi: 10.2134/agronj1987.00021962007900030028x
57. Kono M, Matsuzawa S, Noguchi T, Miyata K, Oguchi R, Terashima I. A new method for separate evaluation of PSII with inactive oxygen evolving complex and active D1 by the pulse-amplitude modulated chlorophyll fluorometry. Funct Plant Biol. (2021) 49:542–53. doi: 10.1071/fp21073
58. Jägerbrand A, Kudo G. Short-Term Responses in Maximum Quantum Yield of PSII (Fv/Fm) to ex situ temperature treatment of populations of bryophytes originating from different sites in Hokkaido. Northern Japan. Plants. (2016) 5:22. doi: 10.3390/plants5020022
59. Oquist G, Anderson JM, McCaffery S, Chow WS. Mechanistic differences in photoinhibition of sun and shade plants. Planta. (1992) 188:422–31. doi: 10.1007/bf00192810
60. Xu Y, Ke H, Li Y, Xie L, Su H, Xie J, et al. Malvidin-3-O-Glucoside from blueberry ameliorates nonalcoholic fatty liver disease by regulating transcription factor eb-mediated lysosomal function and activating the nrf2/are signaling pathway. J Agric Food Chem. (2021) 69:4663–73. doi: 10.1021/acs.jafc.0c06695
61. Du Q, Jerz G, Winterhalter P. Isolation of two anthocyanin sambubiosides from bilberry (Vaccinium myrtillus) by high-speed counter-current chromatography. J Chromatogra A. (2004) 1045:59–63. doi: 10.1016/j.chroma.2004.06.017
62. Lohachoompol V, Mulholland M, Srzednicki G, Craske J. Determination of anthocyanins in various cultivars of high bush and rabbiteye blueberries. Food Chem. (2008) 111:249–54. doi: 10.1016/j.foodchem.2008.03.067
63. Decendit A, Mamani-Matsuda M, Aumont V, Waffo-Teguo P, Moynet D, Boniface K, et al. Malvidin-3-O-β glucoside, major grape anthocyanin, inhibits human macrophage-derived inflammatory mediators and decreases clinical scores in arthritic rats. Biochem Pharmacol. (2013) 86:1461–7. doi: 10.1016/j.bcp.2013.06.010
64. Ghiselli A, Nardini M, Baldi A, Scaccini C. Antioxidant activity of different phenolic fractions separated from an italian red wine. J Agric Food Chem. (1998) 46:361–7. doi: 10.1021/jf970486b
65. Oh YS, Lee JH, Yoon SH, Oh CH, Choi D-S, Choe E, et al. Characterization and quantification of anthocyanins in grape juices obtained from the grapes cultivated in Korea by HPLC/DAD. HPLC/MS, and HPLC/MS/MS. J Food Sci. (2008) 73:C378–89. doi: 10.1111/j.1750-3841.2008.00756.x
66. Forino M, Gambuti A, Luciano P, Moio L. Malvidin-3-O-glucoside chemical behavior in the wine pH Range. J Agric Food Chem. (2019) 67:1222–9. doi: 10.1021/acs.jafc.8b05895
67. Hazarika M, Mahanta PK. Compositional changes in chlorophylls and carotenoids during the four flushes of tea in North East India. J Sci Food Agric. (1984) 35:298–303. doi: 10.1002/jsfa.2740350309
68. Mandal R, Dutta G. From photosynthesis to biosensing: Chlorophyll proves to be a versatile molecule. Sens Int. (2020) 1:100058. doi: 10.1016/j.sintl.2020.100058
69. Ošt’ádalová M, Tremlová B, Pokorná J, Král M. Chlorophyll as an indicator of green tea quality. Acta Veterinaria Brno. (2014) 83:S103–9. doi: 10.2754/avb201483s10s103
70. Chen J, Wu S, Dong F, Li J, Zeng L, Tang J, et al. Mechanism underlying the shading-induced chlorophyll accumulation in tea leaves. Front Plant Sci. (2021) 12:779819. doi: 10.3389/fpls.2021.779819
71. Liyanage A, Punyasiri P. High Performance Liquid Chromatography (HPLC) of chlorophylls in tea (Camellia sinensis). SL Jr Tea Sci. (1993) 62:32–7.
72. Ravichandran R. Carotenoid composition, distribution and degradation to flavour volatiles during black tea manufacture and the effect of carotenoid supplementation on tea quality and aroma. Food Chem. (2002) 78:23–8. doi: 10.1016/s0308-8146(01)00303-x
73. Vu DC, Alvarez S. Phenolic, Carotenoid and Saccharide Compositions of Vietnamese Camellia sinensis Teas and Herbal Teas. Molecules. (2021) 26:6496. doi: 10.3390/molecules26216496
74. Tirimana A, Wickremasinghe R. Studies on the quality and flavour of tea. II. The carotenoids. Tea Qtr. (1965) 36:115–21.
75. Sanderson Gw, Co H, Gonzalez Jg. Biochemistry of tea fermentation: the role of carotenes in black tea aroma formation. J Food Sci. (1971) 36:231–6. doi: 10.1111/j.1365-2621.1971.tb04031.x
Keywords: purple tea, anthocyanin, carotenoids, cleft grafting, germplasm, diversification, net photosynthesis
Citation: Patel PK, Siddiqui SA, Kuča K, Sabhapondit S, Sarma R, Gogoi B, Singh SK, Bordoloi RK, Saikia JK, Gogoi RC, Bhardwaj K, Yang J, Tao Y, Manickam S and Das B (2022) Physiological and biochemical evaluation of high anthocyanin pigmented tea (Camellia sinensis L. O. Kuntze) germplasm for purple tea production. Front. Nutr. 9:990529. doi: 10.3389/fnut.2022.990529
Received: 11 July 2022; Accepted: 08 August 2022;
Published: 31 August 2022.
Edited by:
Rana Muhammad Aadil, University of Agriculture, PakistanReviewed by:
Asad Nawaz, Yangzhou University, ChinaSajid Maqsood, United Arab Emirates University, United Arab Emirates
Copyright © 2022 Patel, Siddiqui, Kuča, Sabhapondit, Sarma, Gogoi, Singh, Bordoloi, Saikia, Gogoi, Bhardwaj, Yang, Tao, Manickam and Das. This is an open-access article distributed under the terms of the Creative Commons Attribution License (CC BY). The use, distribution or reproduction in other forums is permitted, provided the original author(s) and the copyright owner(s) are credited and that the original publication in this journal is cited, in accordance with accepted academic practice. No use, distribution or reproduction is permitted which does not comply with these terms.
*Correspondence: Kamil Kuča, a2FtaWwua3VjYUB1aGsuY3o=; Sivakumar Manickam, bWFuaWNrYW0uc2l2YWt1bWFyQHV0Yi5lZHUuYm4=; Buddhadeb Das, YnVkZGhhZGViZGFzQHlhaG9vLmNvbQ==