 Farideh Shiraseb1
 Sara Ebrahimi2
 Sahar Noori3
 Reza Bagheri4
 Stacey Alvarez-Alvarado5
 Alexei Wong6Khadijeh Mirzaei1,7*
- 1Department of Community Nutrition, School of Nutritional Sciences and Dietetics, Tehran University of Medical Sciences (TUMS), Tehran, Iran
- 2The Ritchie Centre, Hudson Institute of Medical Research, Clayton, VIC, Australia
- 3Department of Nutrition, Science and Research Branch, Islamic Azad University, Tehran, Iran
- 4Department of Exercise Physiology, University of Isfahan, Isfahan, Iran
- 5Department of Neurology, College of Medicine- Jacksonville, University of Florida, Jacksonville, FL, United States
- 6Department of Health and Human Performance, Marymount University, Arlington, VA, United States
- 7Food Microbiology Research Center, Tehran University of Medical Sciences, Tehran, Iran
Objectives: The present study was conducted to evaluate whether there is a link between the diet quality index (DQI) and markers of systemic inflammation in Iranian overweight and obese women.
Methods: This cross-sectional study included 200 Iranian overweight and obese women aged 18–48 years. The DQI-international (DQI-I) comprises four main components: variety, adequacy, moderation, and overall balance. Blood samples were collected in a fasted state to measure inflammatory markers.
Results: After adjusting for age, body mass index (BMI), physical activity, total energy intake, economic status, education, supplement intake, age of starting obesity, and history of body mass loss, a marginally significant negative association was observed between the homeostasis model assessment of insulin resistance (HOMA–IR) and the DQI–I (β: −0.015, 95% CI: −0.03, 0.000; p = 0.061). The results after adjustment showed that DQI–I has a negative association with high-sensitivity C-reactive protein (hs–CRP) concentrations (β: −0.031, 95% CI: −0.104, −0.031; p = 0.023). Furthermore, negative associations were observed between the adequacy component and levels of HOMA–IR (β: −0.025, 95% CI: −0.100, 0.047, p = 0.050) and hs-CRP (β: −0.615, 95% CI: −1.191, −0.020; p = 0.045). In addition, negative associations were found between transforming growth factor-β (TGF-β) and balance score (β: −6.270, 95% CI: −39.211, −3.661, p = 0.020), as well as HOMA–IR (β: −0.080, 95% CI: −0.202, −0.000, p = 0.041) and chemoattractant protein−1 (MCP−1) (β: −0.562, 95% CI: −11.414, −0.282, p = 0.021), with the various component. A marginally significant negative association between galectin 3 (Gal-3) and moderation score (β: −0.451, 95% CI: −1.171, 0.060, p = 0.060) was found. In addition, a marginally significant inverse association was also established between hs–CRP and variety score (β: −0.311, 95% CI: −0.970, 0.001, p = 0.052). The Receiver Operating characteristic (ROC) curve analysis demonstrated that DQI–I might better predict HOMA–IR with a cut point of 3.13 (AUC = 0.698, 0.511–0.699, p = 0.050).
Conclusion: These findings showed that a higher adherence to diet quality and its components could probably be related to lowering the inflammatory markers considerably in overweight and obese women.
Introduction
Recent evidence shows that more than 22% of Iranian adults were overweight and obese in 2018 (1). The prevalence of obesity in Iranian women is almost 57% higher than that in men (2). Obesity causes mild inflammation and can hasten the development of chronic diseases and their complications by secreting pro-inflammatory cytokines such as interleukin-6 (IL-6), tumor necrosis factor (TNF), and C-reactive protein (CRP) (3, 4). According to the literature, a low-grade inflammation arising from adiposity (5) also elevates some inflammatory factors, which are described below. White adipose tissue (WAT) secretes chemoattractant protein-1 (MCP-1) (6–8), which is a primary ligand for the chemokine receptor-2 (CCR2) (9), and high-sensitivity C-reactive protein (hs-CRP), which is a strong predictor of cardiovascular incidence (9, 10). CRP is an acute inflammatory protein that increases during inflammation and is used as an indicator of infection (11–13). Transforming growth factor-β (TGF-β) is one of the main adipokines involved in regulating inflammatory processes (14). The homeostasis model assessment of insulin resistance (HOMA-IR) indicates insulin resistance (IR), which increases in obese individuals (15, 16). TNF is an important mediator of insulin resistance in obesity and diabetes, through its capacity to diminish the tyrosine kinase activity of the insulin receptor, resulting in higher levels of inflammation (17–19). The plasminogen activator inhibitor-1 (PAI-1) is an inhibitor of tissue-type plasminogen activator (t-PA), synthesized by human adipose tissue and could play a role in inflammation and associated with IR parameters, including body mass index (BMI) and visceral fat (20–24). Pro-inflammatory cytokine interleukin-1 (IL-1) is a prototypical inflammatory cytokine that increases in response to higher cytotoxic IL-1β (25). Galectin-3 (Gal-3), in particular, plays both pro-inflammatory and anti-inflammatory roles, depending on the inflammatory status and the target cell or tissue (26, 27).
Diet plays a vital role in immune response control (28). Indeed, well-established evidence shows that malnutrition causes immunosuppression and inflammation (29). Some studies showed associations between diet quality and specific inflammatory markers such as hs-CRP (30, 31). Fung et al. examined associations between diet quality indices and plasma concentrations of hs-CRP, IL-6, E-selectin, soluble intercellular cell adhesion molecule 1, and soluble vascular cell adhesion molecule. The results revealed that the healthy eating index (HEI) and dietary quality index revised (DQI-R) scores were not significantly associated with any of the measured markers, while the Alternative Healthy Eating Index (AHEI) and alternative Mediterranean Diet (aMED) scores were significantly associated with lower concentrations of most of the measured markers (32). In addition, Kuczmarski et al. showed a 10% increase in the mean adequacy ratio (MAR) was significantly associated with lower hs-CRP (31). However, these diet quality indices have limitations, including a lack of components such as variety, adequacy, moderation, and overall balance. Therefore, evaluating other diet quality indices may be of importance to establish the relationship between diet quality and inflammatory markers in obesity (33–35).
The diet quality index-international (DQI-I) was developed according to international dietary recommendations to compare diet quality between different populations (36–38). The DQI-I evaluates the adequacy, moderation, variety, and balance aspects of a diet. It is useful to evaluate the undernutrition and overnutrition status in Iran, a country experiencing a nutritional transition over the past three decades (39, 40). The applicability of DQI-I in the Iranian population has been demonstrated in a previous study (41). However, no study has examined the associations between DQI-I and inflammatory markers in the Iranian population.
Given obesity is more prevalent among Iranian women and no evidence is available on the possible relationships between the DQI-I and inflammatory markers, this study aimed to examine associations between the DQI-I and inflammatory markers, including MCP-1, hs-CRP, IL-1β, Gal-3, HOMA-IR, TGF-β, and PAI-1, in Iranian overweight and obese women. The hypothesis is that DQI-I would be associated with inflammatory markers.
Methods
Study population
Two hundred pre-menopausal healthy women with overweight and obesity from Tehran, Iran, were included in this study. The inclusion criteria were as follows: (1) BMI in the range of 25–40 kg.m−2, (2) age range between 18 and 48 years, and (3) no history of chronic diseases (other than obesity). The exclusion criteria were medication usage, pregnancy, lactation, menopause, history of chronic disease or eating disorders, smoking, significant body mass fluctuations over the past year, and following any dietary regimen. Furthermore, individuals who did not answer more than 70 questions of the food frequency questionnaire (FFQ) and those with an energy intake under 800 and over 4,200 kcal/d were excluded (41). All participants signed an informed consent form prior to participation. This study was approved by the Ethics Committee of Tehran University of Medical Sciences (TUMS) (IR.TUMS.VCR.REC.1396.2615).
Study design
The study had a cross-sectional design. Participant screening and data collection were completed between September 2018 and December 2018. A random cluster sampling method was used to recruit participants from health centers affiliated with TUMS. Data collection was completed in the Nutrition and Biochemistry Laboratory of the School of Nutrition and Dietetics at TUMS. All data were collected in one visit.
Body composition and anthropometric measurements
The multi-frequency bioelectrical impedance analyzer (BIA), InBody 770 scanner, was used to measure body composition, including body mass, BMI, fat mass (FM), fat-free mass (FFM), fat mass index (FMI), and fat-free mass index (FFMI) (Inbody Co., Seoul, Korea). Participants were asked to urinate 30 min before the test. In addition, they fasted for 12 h and avoided any strenuous physical activity 48 h before the test. Height was measured using a digital Seca scale (Hamburg, Germany), with a precision of 0.5 cm. Waist circumference (WC), hip circumference (HC), and neck circumference (NC) were measured by a trained dietitian based on standard procedures (42). Waist-to-hip ratio (WHR) was calculated using the BIA, and waist-to-height ratio (WHtR) was calculated by dividing WC by (cm) height (cm).
Biochemical parameters
Venous blood samples were obtained by a trained phlebotomist in the morning (8–10 a.m.), after 10–12 h of fasting. The serum was extracted and frozen at −80°C after separation for further analyses. A colorimetric approach based on the glucose oxidase-phenol amino phenazone (GOD-PAP) method was used to determine fasting blood glucose (FBG) levels. Triglyceride (TG) was evaluated using glycerine phosphate oxidase peroxidase (GPO-PAP). Low-density lipoprotein (LDL) was measured using the direct method. High-density lipoprotein cholesterol (HDL) and total cholesterol levels were calculated using an immune inhibition assay. The Pars Azmoon package (Pars Azmoon Inc. Tehran, Iran) was used for these analyses. An enzyme-linked immunosorbent assay (ELISA) approach was used to evaluate serum insulin levels (Human insulin ELISA kit, Monobind Inc., Lake Forest, United States). Insulin resistance was assessed by HOMA-IR, and the index was calculated using the following formula: HOMA-IR= (fasting plasma glucose (mmol/l) × fasting plasma insulin mIU/l)/22.5 (43). The concentrations of inflammatory markers such as hs-CRP and IL-1β were measured using the ELISA method. The active form of Gal-3 was also measured using the ELISA-Quantikine kits (R&D Systems, Minneapolis, MN). The ELISA approach was further used to test serum MCP-1 levels using a suitable kit (Zell Bio GmbH, ULM, Germany, assay range: 5 ng/L−1,500 ng/L, sensitivity: 2.4 ng/L). In triplicate, TGF-β (HUMAN TGF-BETA 1 Quantikine ELIZA kit R&D System-United States) and PAI-1 (Human PAI-1*96 T ELIZA kit Crystal Company) were assessed. The inter-assay and intra-assay variability for all biochemical tests were < 12% and 10%, respectively.
Blood pressure
A physician used a mercury sphygmomanometer to measure systolic and diastolic blood pressure (SBP, DBP), following 15 min of rest (seated). Three measurements at 1-min interval were recorded, and the average of measurements was calculated.
Dietary assessment
A dietary assessment was performed by a trained dietitian, using a semi-quantitative FFQ with 147 food items. The validity and reliability of instruments have been confirmed in previous studies (44, 45). Participants reported the frequency of consumption for a given serving of each food item during the last year on a daily, weekly, monthly, or yearly basis. Portion size for the consumed food was converted to grams using household measurements (46) and dietary data were analyzed using the Nutritionist IV software (version 7.0; N-Squared Computing, Salem, OR) (47).
DQI-I calculation
The DQI-I comprises four main components, such as variety, adequacy, moderation, and balance. The score range of variety is between 0 and 20, which includes food group variety and protein source variety. The adequacy component consists of fruits, vegetables, and grains with a score range between 0 and 40. Total fat, saturated fat, cholesterol, sodium, and empty calorie foods make the moderation components with a score range between 0 and 30. The balance component includes macronutrient ratio and fatty acid ratio with a score range between 0 and 10. The total score range is between 0 and 100, and higher DQI-I scores indicate higher diet quality (48). Participants were classified into two groups, according to DQI-I scores median (49), lower diet quality ( ≤ 64), and higher diet quality (>64).
Assessment of other variables
The characteristics of participants including age, marital status, and economic status were collected by a trained interviewer through a demographic questionnaire. To determine physical activity standards, the validated International Physical Activity Questionnaire (IPAQ) was calculated as minutes per week, according to metabolic equivalents (MET-min/week) (50, 51).
Statistical analyses
All analyses were performed using a Statistical Package for Social Science (version 26.0; SPSS Inc., Chicago IL, United States). P- < 0.05 was considered statistically significant, and P-value of 0.06 was considered marginally significant. Mean and standard deviation (SD) were reported for continuous variables while the number and percentage were reported for categorical variables. Quantitative independent normality was tested using Kolmogorov–Smirnov's test (p > 0.05). In the crude model, the independent one-way analysis of variance (ANOVA) and chi-square (χ2) test were used to analyze continuous and categorical variables, respectively. Analysis of covariance (ANCOVA) was applied to control confounders, including age, physical activity, BMI, and total energy intake. Linear regression analysis was used to examine the association between DQI-I and inflammatory markers, including MCP-1, hs-CRP, PAI-1, Gal-3, IL-1β, TGF-β, and HOMA-IR. All assumptions of linear regression tests such as normality, normality of residual error, linearity, homoscedasticity, and collinearity were assessed. The analysis was adjusted for age, physical activity, BMI, and total energy intake. ROC curves were plotted with sensitivity (true–positive fraction) on the y-axis and 1-specificity (false–positive fraction) on the x-axis. The ROC curve was plotted for DQI-I value to inflammatory markers.
Results
Study population characteristics
A total of 200 Iranian overweight and obese women were included in the analysis. The majority of participants were married (75.3%), had a low level of education (52.7%), and had low and moderate socioeconomic status (74.2%). The mean age and BMI were 35.0 years (8.79) and 30.5 (4.12) kg.m−2, respectively. The mean of WHtR, FFM, and FM of individuals was 0.601 (0.000), 46.2 (4.26) kg, and 33.25 (5.27) kg, respectively. The mean DQI-I score was 64.5 (3.25).
General characteristics of participants over DQI-I categories
The median of DQI-I indices was used to allocate participants into low and high DQI-I categories. Sociodemographic characteristics, anthropometrics indices, biochemical assessment, and blood pressure of participants before and after adjustment for cofounders are presented in Table 1. After adjustment for age, physical activity, and total energy intake, a marginally significant mean difference in BMI was found between medians of DQI-I (p = 0.061). No statistically significant difference was observed in the mean of biochemical parameters, body composition, anthropometric, and categorical variables between DQI-I medians in the crude and adjusted model (p>0.05).
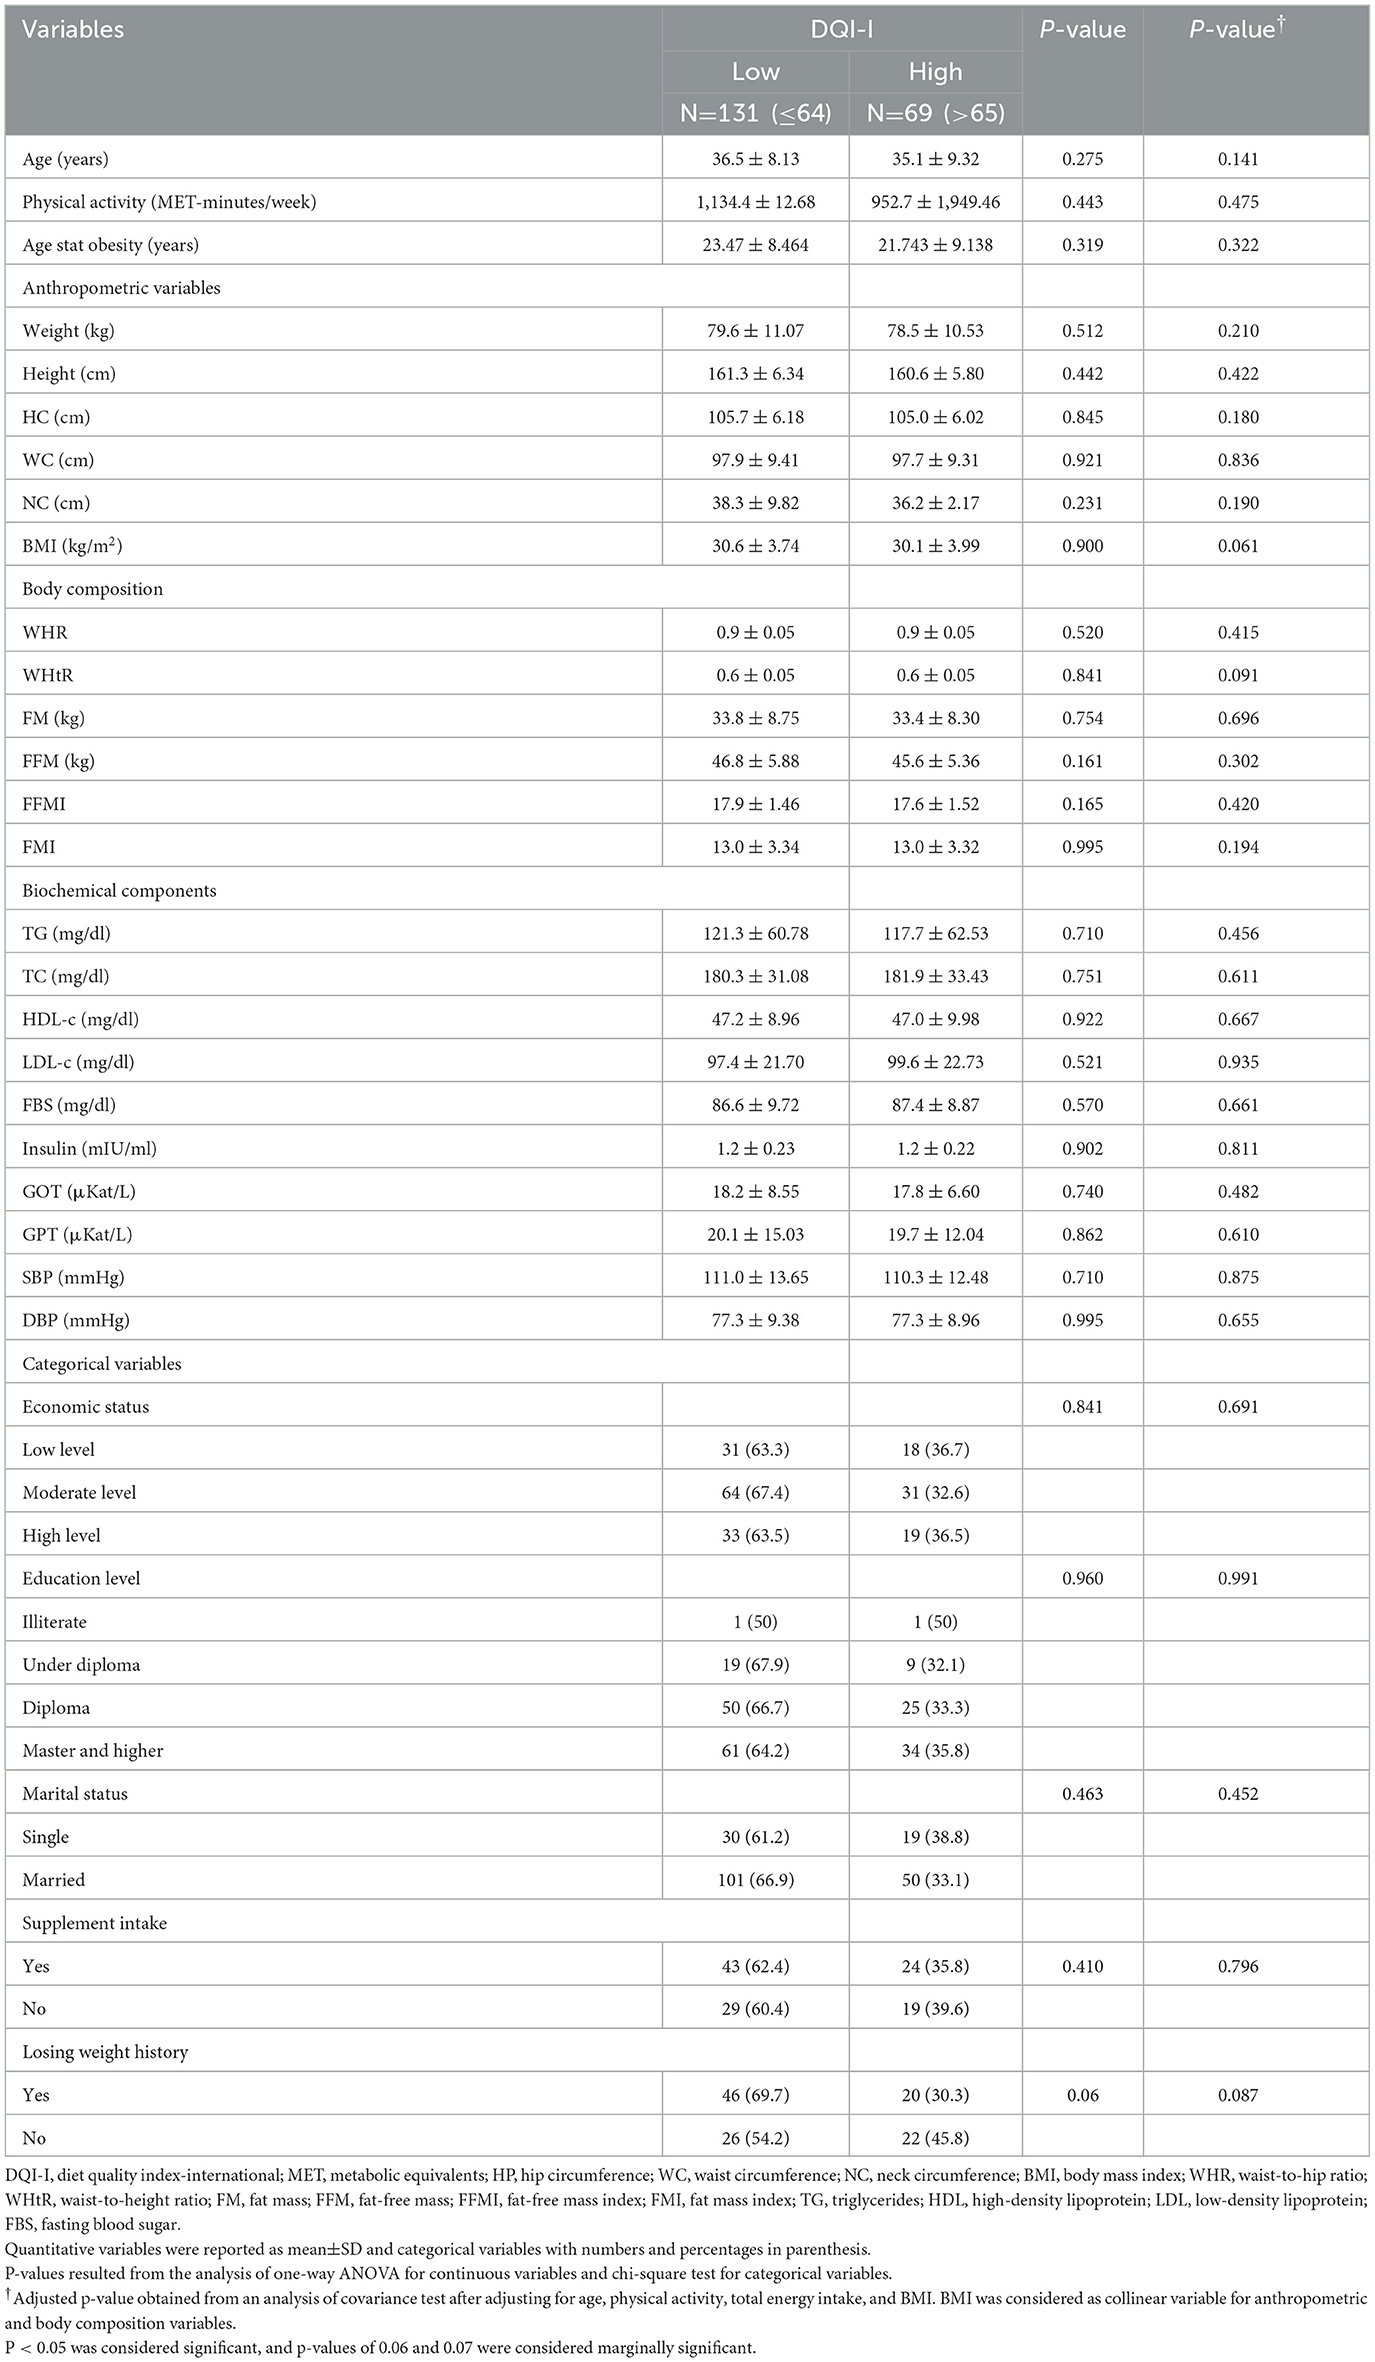
Table 1. Characteristics of participants over medians of DQI-I (n = 200).
Dietary intake of study population over DQI-I categories
Dietary intake according to the DQI-I median (low and high DQI-I categories) is presented in Table 2. No statistically significant difference was observed in the mean of energy intake between low and high DQI-I categories [2,517 [738] and 2,649 [676], respectively] (p =0.150). All variables adjusted for confounding variables including age, BMI, physical activity, and total energy intake. The intake of fruits, vegetables, legumes, and low-fat dairy products was higher in participants with a higher DQI-I score (p ≤ 0.05). The intake of high-fat dairy products, red meat, and fast foods was significantly lower in participants with higher DQI-I scores (p ≤ 0.05), after adjustment for confounding variables. The intake of carbohydrates, total dietary fiber, iron, selenium, copper, calcium, magnesium, potassium, manganese, vitamin C, vitamin K, B6, B9, thiamin, and biotin was significantly higher in participants with higher DQI-I compared to participants with lower DQI-I (p ≤ 0.05). Furthermore, the intake of fat, MUFA, PUFA, SFA, linolenic acid, linoleic acid, vitamin E, and vitamin B12 was significantly lower in participants with higher DQI-I (p < 0.05).
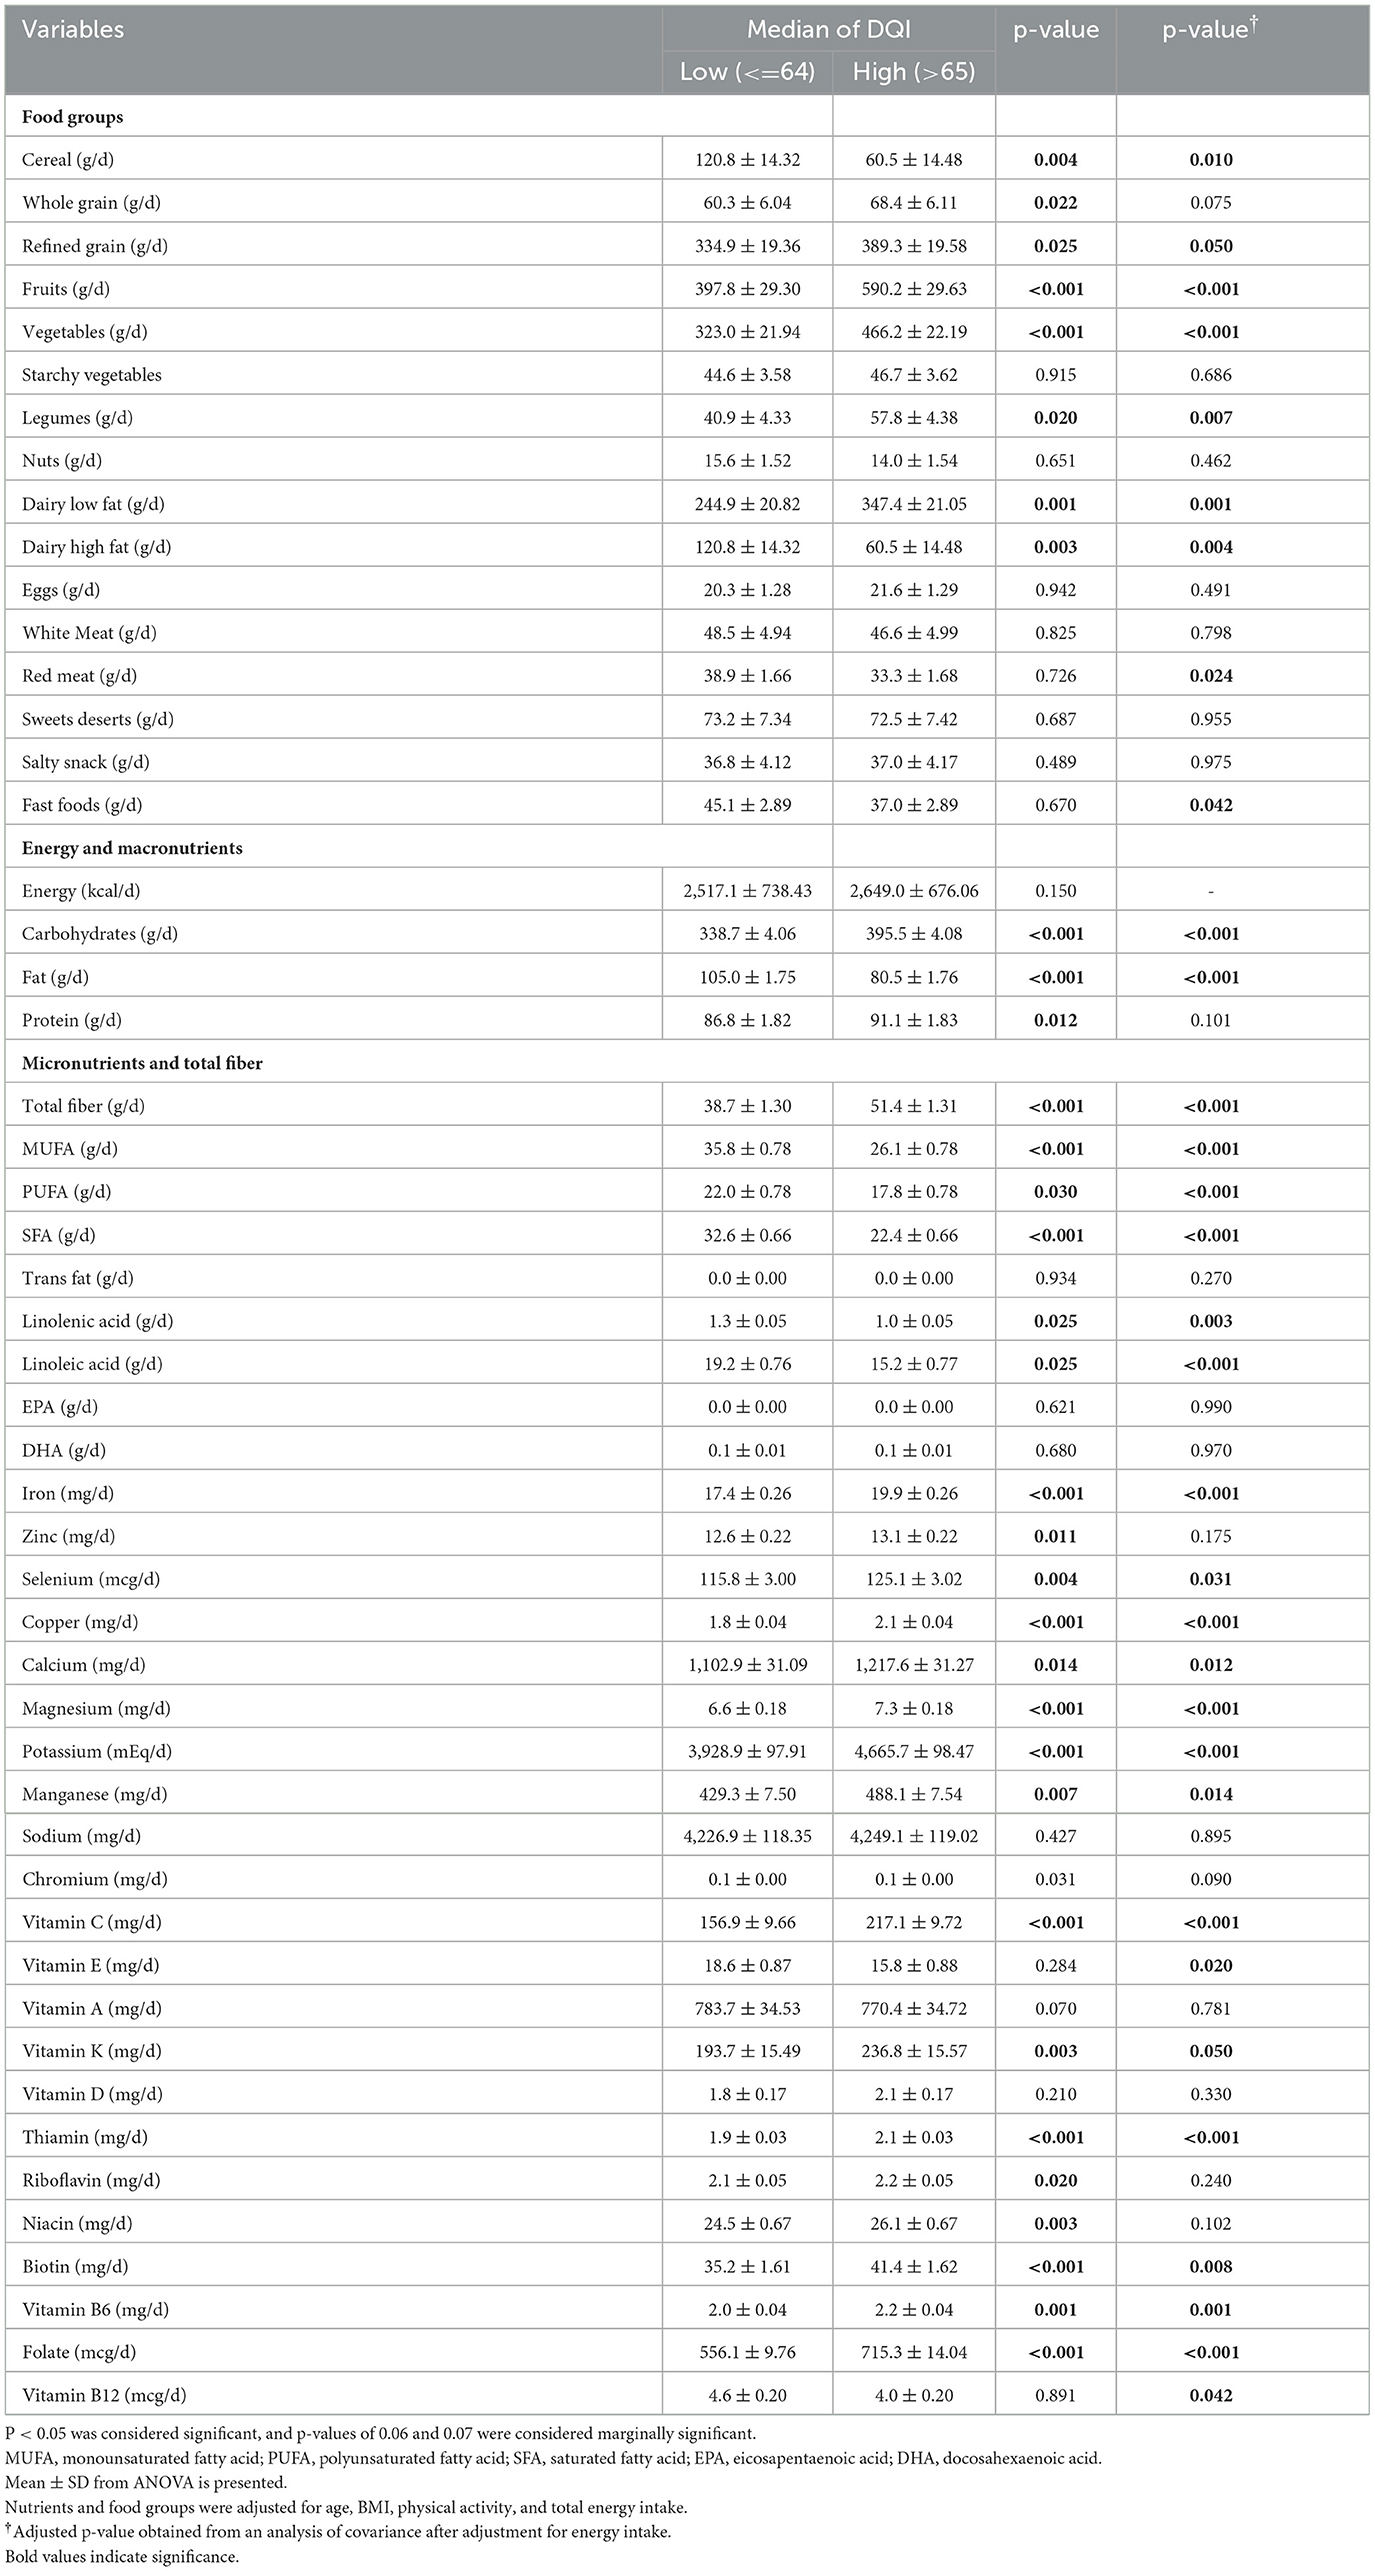
Table 2. Dietary intakes over the categories of DQI-I (n = 200).
Inflammatory markers across the low and high categories of DQI-I and its components
No statistically significant difference was found in the level of PAI-1, Gal-3, and MCP-1 between the low and high DQI-I categories, before adjustment for cofounders (p>0.05). However, after adjustment for age, BMI, physical activity, total energy intake, socioeconomic status, education, supplement intake, age of starting obesity, and history of weight loss, the mean of PAI-1, Gal-3, hs-CRP, and MCP-1 was lower in participants with higher DQI-I (p < 0.05; Table 3). HOMA-IR was significantly lower in women with a higher score of adequacy (p < 0.05), both in the crude model and two adjusted models (adjusted for age, BMI, physical activity, total energy intake, economic status, and education in Model 1; and further adjustment for supplement intake, age of starting obesity, and history of weight loss in Model 2). Lower levels of PAI-1 and TGF-β were found in participants with higher balance scores after controlling for age, BMI, physical activity, total energy intake, economic status, education, supplement intake, age of starting obesity, and history of weight loss (p = 0.042, p = 0.040, respectively). Furthermore, the levels of IL-1β (p = 0.011) in Model 1 and MCP-1(p = 0.031) in Model 2 were lower in participants with a higher moderation score. In addition, hs-CRP was lower in participants with a higher moderation score (Table 3).
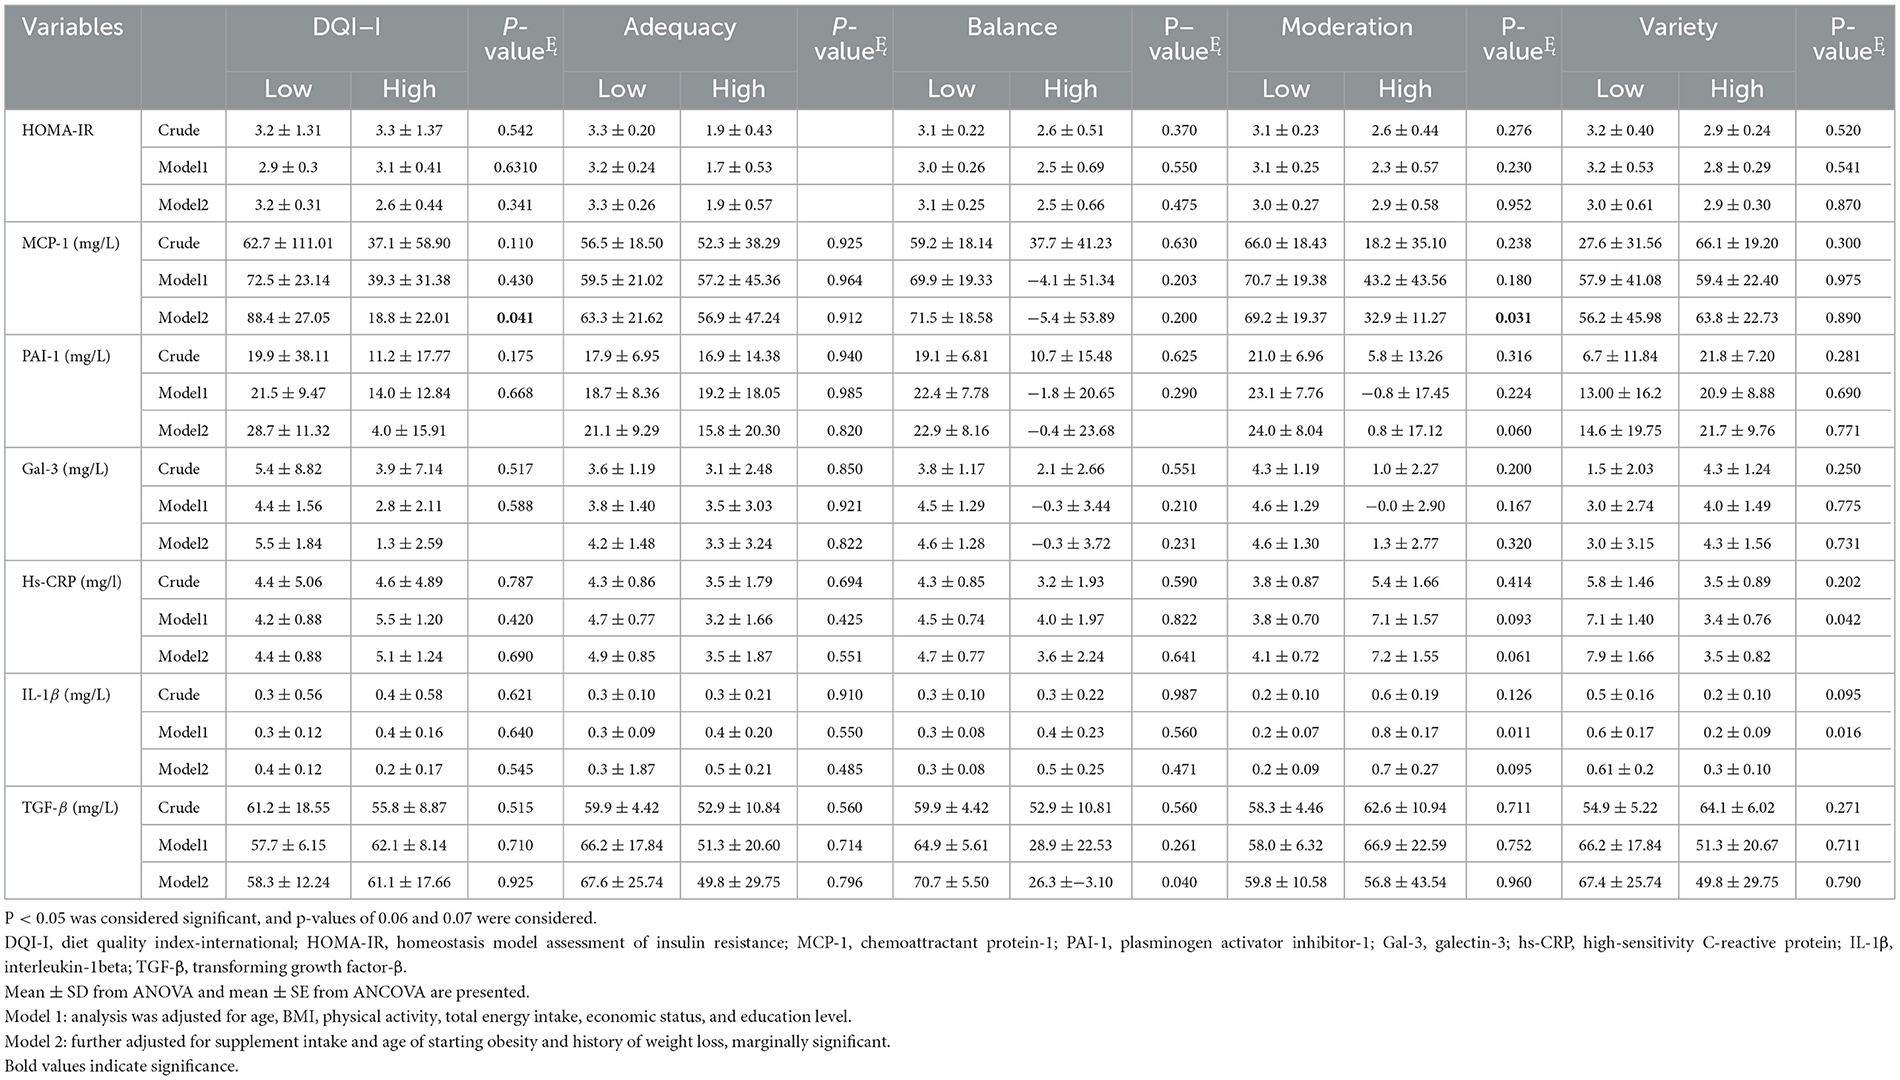
Table 3. Inflammatory markers over the categories of DQI-I and its components (n = 200).
Association between inflammatory markers with DQI-I and its components
No significant association between HOMA-IR and DQI–I (β: −0.021, 95% CI: −0.040, 0.005, p = 0.101) was found in the crude model. However, in Model 2, a marginally significant association (β: −0.015, 95% CI: −0.030, 0.000, p = 0.061) was observed. In addition, in Model 2, a negative association between DQI–I and level of hs–CRP (β: −0.031, 95% CI: −0.104, −0.031, p = 0.023) was observed. Furthermore, there were negative associations between the adequacy component and the level of HOMA–IR (β: −0.025, 95% CI: −0.100, 0.047, p = 0.050) and hs–CRP (β: −0.615, 95% CI: −1.191, −0.020, p = 0.045), after adjusting for confounders (Model 2; Table 4). In addition, higher balance component scores were negatively associated with TGF–β (β: −6.270, 95% CI: −39.211, −3.661, p = 0.020) in Model 2. There was a negative and marginal association between higher moderation scores and Gal−3 (β: −0.451, 95% CI: −1.171,0.060, p = 0.060) (Model 2). In Model 2, a negative association was found between variety score and HOMA–IR (β: −0.080, 95% CI: −0.202, −0.000, p = 0.041), MCP−1 (β: −0.562, 95% CI: −11.414, −0.282, p = 0.021), and hs–CRP levels (β: −0.311, 95% CI: −0.970,0.001, p = 0.052) (Table 4).
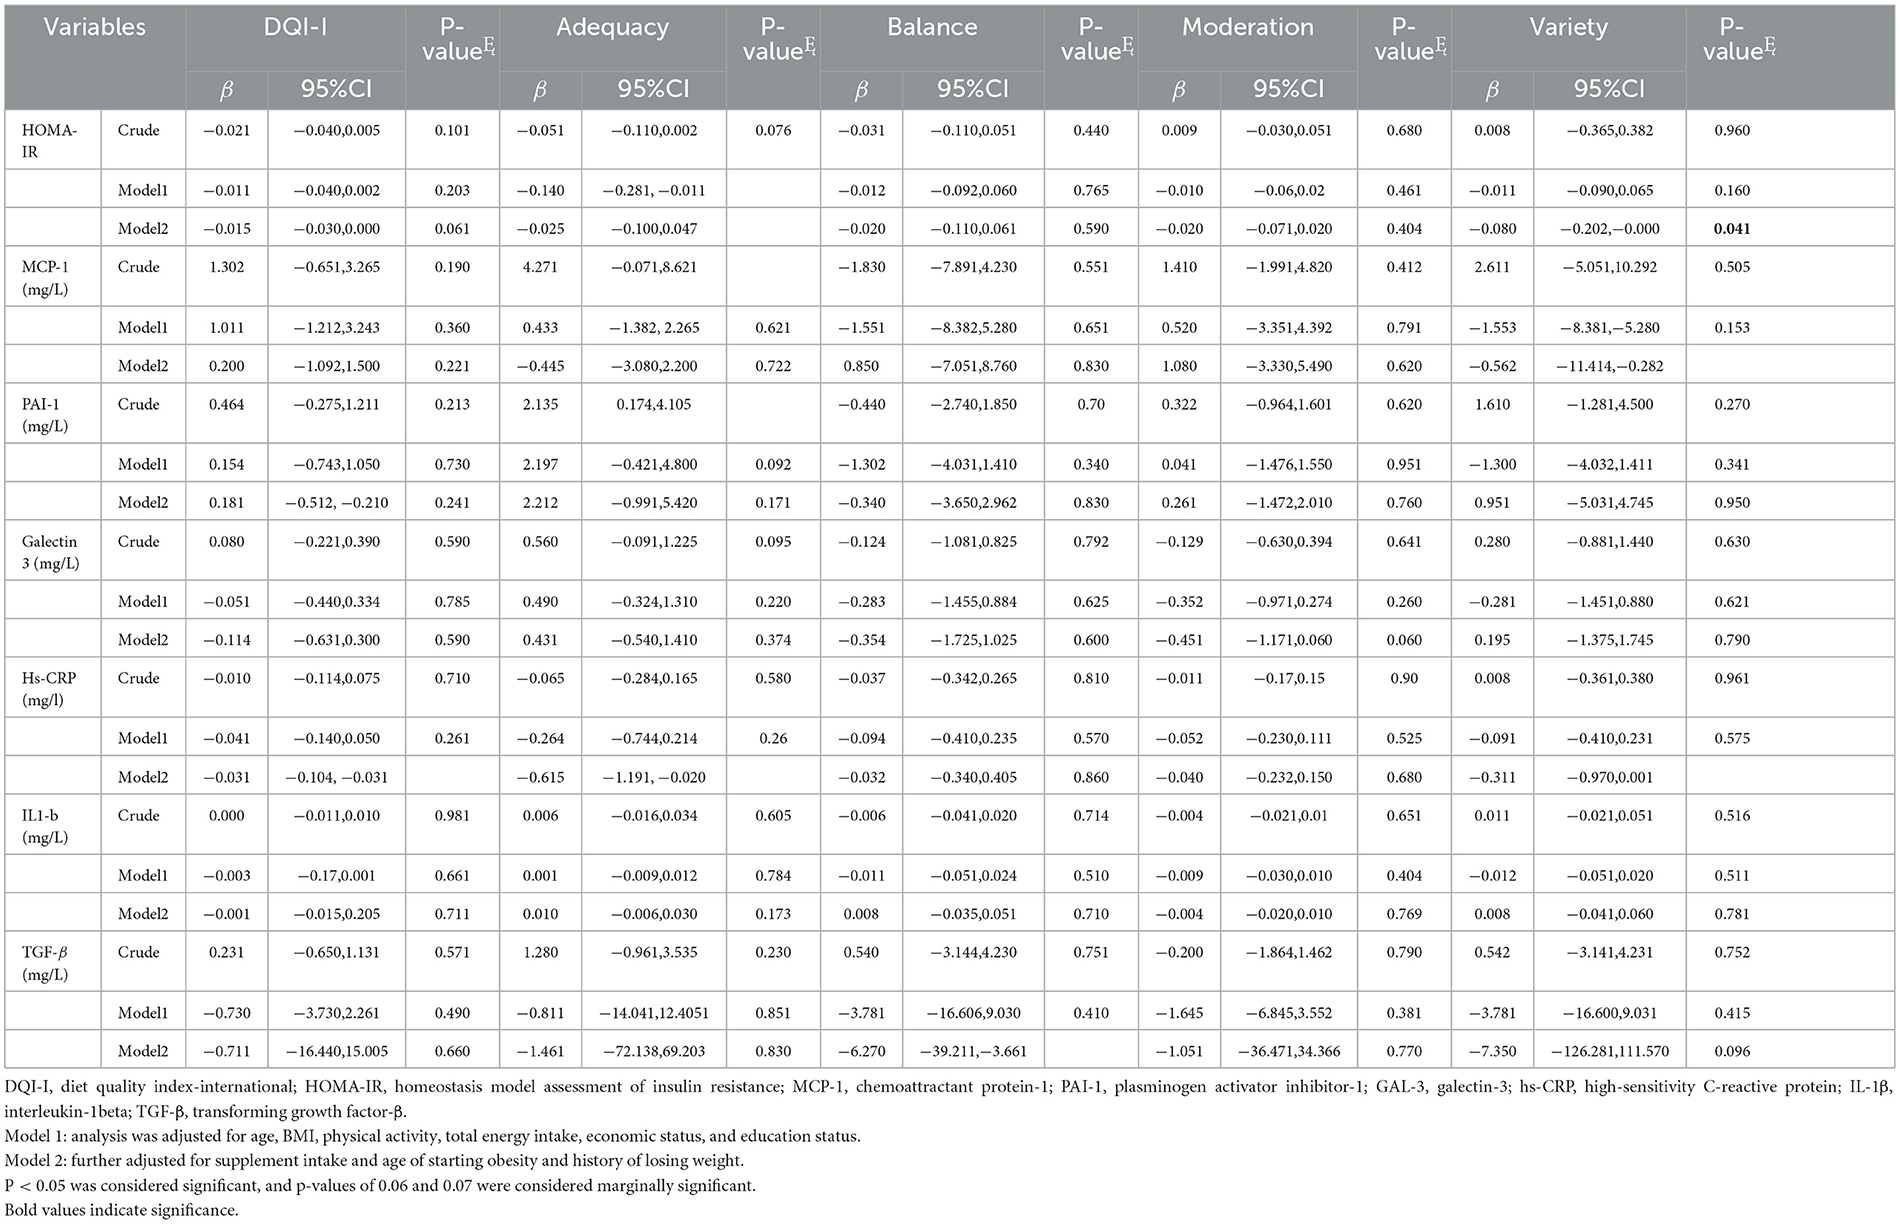
Table 4. Association between DQI-I and its components and inflammatory markers (n = 200).
Prediction of inflammatory markers by ROC curve analysis
Figure 1 demonstrates the ROC curve of DQI-I to predict inflammatory markers. This analysis showed the calculated area under the curve (AUC) with 95% CI for HOMA-IR (Figure 1E), with a cut point of 3.13 (AUC=0.698, 0.511–0.699, p = 0.05), which was statistically significant. Furthermore, the AUC with 95% CI for MCP-1 (Figure 1A) with a cut point of 15.4 (AUC=0.433, CI = 0.339–0.527), PAI-1 (Figure 1B) with a cut point of 6.21 (AUC=0.459 CI=0.350–0.567), Gal-3 (Figure 1C) with a cut point 1.23 (AUC = 0.533, CI = 0.376–0.691), hs-CRP (Figure 1D) with a cut point a 2.25 (AUC = 0.532 CI = 0.440-0.624), IL-1β (Figure 1F) with a cut point of 0.36 (AUC = 0.529, CI = 0.436–0.622), and TGF-β (Figure 1G) with a cut point of 65.06 (AUC = 0.522, CI = 0.401–0.528) were non-significant (p>0.05). These findings show that DQI-I might better predict HOMA-IR than the other inflammatory markers in this study population.
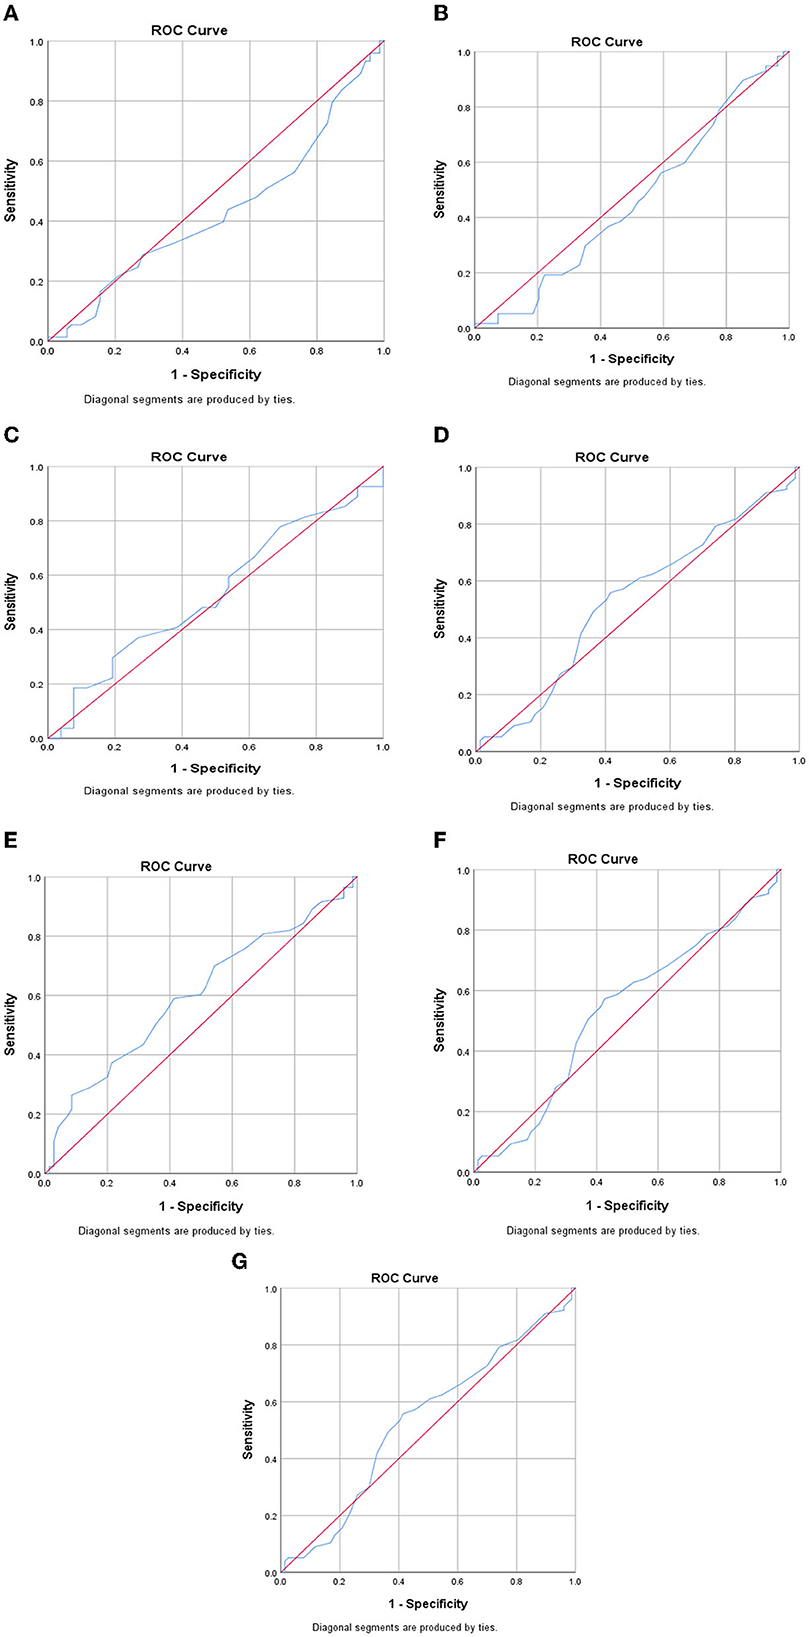
Figure 1. ROC curve of DQ-I to predict inflammatory markers. (A) MCP-1, (B) PAI-1, (C) Gal-3, (D) hs-CRP, (E) HOMA-IR, (F) IL-1β, (G) TGF-β.
Discussion
This study examined associations between inflammatory markers, including HOMA-IR, MCP-1, PAI-1, Gal-3, hs-CRP, IL-1β, TGF-β, and DQI-I in Iranian overweight and obese women. DQI-I was negatively associated with hs-CRP and HOMA-IR. Furthermore, there were negative associations between the adequacy score and hs-CRP and HOMA-IR, as well as between the balance score and TGF-β. In addition, the variety score was inversely associated with MCP-1, hs-CRP, and HOMA-IR, while the moderation score was negatively related to Gal-3 levels. These results are in line with our hypothesis that DQI-I is probably associated with inflammatory markers. Due to the other studies that showed the role of inflammation in obesity and causing related comorbidities and complications such as metabolic syndrome and cardiovascular disease, our findings are of significance (52–54).
The findings of this study showed that hs-CRP is negatively associated with total DQI-I score and score of adequacy and variety. The evidence shows that a healthy diet may be associated with lower levels of inflammation (55). The variety of components in the DQI-I emphasizes the higher intake of fruits and vegetables, meat, poultry, fish, egg, dairy, beans, and grains (35). In line with our findings, a previous study found an inverse link between prudent dietary patterns and hs-CRP levels (56). A prudent dietary pattern was characterized by a higher intake of fruit, vegetables, legumes, fish, poultry, and whole grains, which was similar to the food groups in the variety of components of our study. Furthermore, a higher intake of fruits and vegetables is associated with a lower level of inflammation, which might be attributed to anti-inflammatory properties of phytochemicals in fruits and vegetables (55). The adequacy component recommends a higher intake of fiber and vitamin C. Fruits and vegetables are also sources of fiber and vitamin C. Previous studies have shown inverse associations between fiber and vitamin C and hs-CRP (57–59). In addition, a previous study reported a negative association between the Mediterranean index and hs-CRP level (60). The Mediterranean diet was characterized by a higher intake of fruits, vegetables, beans, fish, and fiber, which was comparable to the adequacy component in this study that recommends a higher intake of fiber and vitamin C (32, 61, 62).
This study found a marginally significant association between DQI-I and HOMA-IR. In contrast with our findings, Alkerwi et al. recruited 1,352 participants, aged 18–69 years from Luxembourg, and found no association between the DQI-I and HOMA-IR (49). While the current study only included women, Alkerwi et al. investigated both women and men (49). On the other hand, the findings of our study showed an inverse association between the score of adequacy and lower HOMA-IR. The higher score of adequacy implies a higher intake of vegetables, fruit, grain, fiber, protein, iron, calcium, and vitamin C (35). The evidence shows that the higher consumption of fruits and vegetables is associated with a lower concentration of oxidative stress markers that trigger inflammatory pathways related to IR (63–65). This might explain the mechanism of the association between adequacy score and HOMA-IR.
The findings showed that a healthy diet such as the Mediterranean diet might have a relationship with a lower level of inflammation while unhealthy diets induce pro-inflammatory cytokines such as IL-1 (55, 66, 67). No investigation has examined the association between DQI-I and IL-1β; however, few studies investigated the association between IL-6 and diet quality (48, 56). The Multi-Ethnic Study of Atherosclerosis (MESA) study reported that a healthy dietary pattern was inversely associated with IL-6. Furthermore, this study showed a negative association between IL-6 and a higher intake of vegetables, fruit, whole grains, low-fat dairy products, and poultry (68). A Belgian epidemiological study reported that a dietary index, including dietary diversity, quality, and equilibrium, which was used to measure adherence to the Flemish food-based dietary guidelines, was inversely associated with IL-6 (69). Furthermore, prior research on individuals with metabolic syndrome (Mets) reported an inverse association between higher adherence to Mediterranean-style diet and IL-6, IL-7, and IL-18 (70).
The current findings demonstrated a negative association between the component variety and MCP-1. While there is limited information on the association between diet quality and MCP-1, previous studies reported that the consumption of a healthy diet such as the Mediterranean diet or a higher intake of fruits and vegetables and vitamin C is associated with a lower level of systematic inflammation (70, 71). Consistent with our findings, a study of 66 participants from Spain found a negative association between the Mediterranean diet and MCP-1, which could be due to antioxidants and fiber content of this diet (72). Furthermore, the findings of the current study showed an inverse association between the moderation component and levels of Gal-3. The moderation component indicated lower consumption of total cholesterol and saturated fatty acids, which are associated with higher inflammation (73).
This study has several strengths. The validity and reliability of the FFQ questionnaire have been well established (41). In addition, the analysis was adjusted for a variety of possible confounders.
However, this study also has several limitations. First, while the analysis was adjusted for the various cofounders, potentially residual effects might influence the outcome variables of interest. Second, this study included overweight and obese women; thus, the findings are not generalizable to the whole population. Future studies including men are needed to reveal if the link between DQI-I and inflammatory markers is gender-dependent. Third, the study design was cross-sectional. As a result, causality cannot be conferred due to the observational nature of this study. Future studies with prospective designs are needed. Finally, dietary data were collected using an FFQ questionnaire that is dependent on the subjects' memory, which might result in bias.
Conclusion
The DQI-I probably has a negative association with hs-CRP in overweight and obese Iranian women. Furthermore, the higher score of adequacy probably has an inverse association with HOMA-IR and hs-CRP. In addition, the balance score probably has a negative association with TGF-β. The moderation score probably has a negative association with Gal-3, and the variety score probably has a negative association with HOMA-IR, MCP-1, and hs-CRP. The findings showed that the DQI-I might be a better prediction for HOMA-IR than other inflammatory markers. In summary, having higher DQI-I is probably associated with lower inflammatory markers in overweight and obese women. Future research with a larger sample size and both genders is needed to expand our knowledge regarding associations between diet quality indices and inflammatory markers in the Iranian population.
Data availability statement
The raw data supporting the conclusions of this article will be made available by the authors, without undue reservation.
Ethics statement
This study was conducted according to the guidelines laid down in the Declaration of Helsinki and all procedures involving human subjects were approved by the Ethics Commission of Tehran University of Medical Sciences (IR.TUMS.VCR.REC.1396.2615) and all participants signed written informed consent. The patients/participants provided their written informed consent to participate in this study.
Author contributions
FS and KM implemented and designed the project. FS and SE analyzed and interpreted data. SN prepared the manuscript. SE, RB, SA-A, and AW revised the manuscript. KM supervised the overall project. All authors read and approved the final manuscript.
Funding
This study was supported by the Tehran University of Medical Sciences and Grants from the Tehran University of Medical Sciences (Grant ID: 9711468006).
Acknowledgments
The authors thank the study participants for their cooperation and assistance in physical examinations. They also thank those involved in the nutritional evaluation and database management, as well as the Tehran University of Medical Sciences.
Conflict of interest
The authors declare that the research was conducted in the absence of any commercial or financial relationships that could be construed as a potential conflict of interest.
Publisher's note
All claims expressed in this article are solely those of the authors and do not necessarily represent those of their affiliated organizations, or those of the publisher, the editors and the reviewers. Any product that may be evaluated in this article, or claim that may be made by its manufacturer, is not guaranteed or endorsed by the publisher.
Abbreviations
aMED, alternative Mediterranean Diet; ANCOVA, analysis of covariance; BMI, body mass index; Hs-CRP, high-sensitivity C-reactive protein; CCR2, chemokine receptor-2; DQI, Diet Quality Index; DQI-I, Diet Quality Index-International; AHEI, Alternative Healthy Eating Index; FFQ, food frequency questionnaire; FM, fat mass; FFM, fat-free mass; FMI, fat mass index; FBG, fasting blood glucose; HC, hip circumference; HEI, healthy eating index; HOMA-IR, homeostasis model assessment of insulin resistance; IL-1b, interleukin 1 beta; IR, insulin resistance; IPAQ, validated International Physical Activity Questionnaire; MCP-1, chemoattractant protein-1; MET, metabolic equivalents; NC, neck circumference; PAI-1, plasminogen activator inhibitor-1; TGF-β, transforming growth factor-β; t-PA, tissue-type plasminogen activator; TG, triglyceride; TNF, tumor necrosis factor; ROC, receiver operating characteristic; SD, standard deviation; WHR, waist-to-hip ratio; WC, waist circumference.
References
1. Rahmani A, Sayehmiri K, Asadollahi K, Sarokhani D, Islami F, Sarokhani M. Investigation of the prevalence of obesity in Iran: a systematic review and meta-analysis study. Acta Medica Iranica. (2015) 2015:596–607.
2. Barak F, Falahi E, Keshteli AH, Yazdannik A, Esmaillzadeh A. Adherence to the Dietary Approaches to Stop Hypertension (DASH) diet in relation to obesity among Iranian female nurses. Public Health Nutr. (2015) 18:705–12. doi: 10.1017/S1368980014000822
3. Shiraseb F, Hosseininasab D, Mirzababaei A, Bagheri R, Wong A, Suzuki K, et al. Red, white, and processed meat consumption related to inflammatory and metabolic biomarkers among overweight and obese women. Front Nutr. (2022) 9:1015566. doi: 10.3389/fnut.2022.1015566
4. Zouhal H, Bagheri R, Ashtary-Larky D, Wong A, Triki R, Hackney AC, et al. Effects of Ramadan intermittent fasting on inflammatory and biochemical biomarkers in males with obesity. Physiol Behav. (2020) 225:113090. doi: 10.1016/j.physbeh.2020.113090
5. Mraz M, Haluzik M. The role of adipose tissue immune cells in obesity and low-grade inflammation. J Endocrinol. (2014) 222:R113–R27. doi: 10.1530/JOE-14-0283
6. Fock KM, Khoo J. Diet and exercise in management of obesity and overweight. J Gastroenterol Hepatol. (2013) 28:59–63. doi: 10.1111/jgh.12407
7. Ghodoosi N, Mirzababaei A, Rashidbeygi E, Badrooj N, Sajjadi SF, Setayesh L, et al. Associations of dietary inflammatory index, serum levels of MCP-1 and body composition in Iranian overweight and obese women: a cross-sectional study. BMC Res Notes. (2020) 13:1–7. doi: 10.1186/s13104-020-05390-x
8. Eskandari M, Hooshmand Moghadam B, Bagheri R, Ashtary-Larky D, Eskandari E, Nordvall M, et al. Effects of interval jump rope exercise combined with dark chocolate supplementation on inflammatory adipokine, cytokine concentrations, and body composition in obese adolescent boys. Nutrients. (2020) 12:3011. doi: 10.3390/nu12103011
9. Chen A, Mumick S, Zhang C, Lamb J, Dai H, Weingarth D, et al. Diet induction of monocyte chemoattractant protein-1 and its impact on obesity. Obes Res. (2005) 13:1311–20. doi: 10.1038/oby.2005.159
10. Tully PJ, Baumeister H, Bengel J, Jenkins A, Januszewski A, Martin S, et al. The longitudinal association between inflammation and incident depressive symptoms in men: the effects of hs-CRP are independent of abdominal obesity and metabolic disturbances. Physiol Behav. (2015) 139:328–35. doi: 10.1016/j.physbeh.2014.11.058
11. Sproston N, Ashworth J. Role of C-reactive protein at sites of inflammation and infection. Front Immunol. (2018) 9:754. doi: 10.3389/fimmu.2018.00754
12. Thompson D, Pepys MB, Wood SP. The physiological structure of human C-reactive protein and its complex with phosphocholine. Structure. (1999) 7:169–77. doi: 10.1016/S0969-2126(99)80023-9
14. Kralisch S, Bluher M, Paschke R, Stumvoll M, Fasshauer M. Adipokines and adipocyte targets in the future management of obesity and the metabolic syndrome. Mini Rev Med Chem. (2007) 7:39–45. doi: 10.2174/138955707779317821
15. Gungor N, Saad R, Janosky J, Arslanian S. Validation of surrogate estimates of insulin sensitivity and insulin secretion in children and adolescents. J Pediatr. (2004) 144:47–55. doi: 10.1016/j.jpeds.2003.09.045
16. Shashaj B, Luciano R, Contoli B, Morino GS, Spreghini MR, Rustico C, et al. Reference ranges of HOMA-IR in normal-weight and obese young Caucasians. Acta Diabetol. (2016) 53:251–60. doi: 10.1007/s00592-015-0782-4
17. Hotamisligil GS, Spiegelman BM. Tumor necrosis factor α: a key component of the obesity-diabetes link. Diabetes. (1994) 43:1271–8. doi: 10.2337/diabetes.43.11.1271
18. Hotamisligil GS, Peraldi P, Budavari A, Ellis R, White MF, Spiegelman BM. IRS-1-mediated inhibition of insulin receptor tyrosine kinase activity in TNF-α-and obesity-induced insulin resistance. Science. (1996) 271:665–70. doi: 10.1126/science.271.5249.665
19. Bagheri R, Rashidlamir A, Ashtary-Larky D, Wong A, Alipour M, Motevalli MS, et al. Does green tea extract enhance the anti-inflammatory effects of exercise on fat loss? Br J Clin Pharmacol. (2020) 86:753–62. doi: 10.1111/bcp.14176
20. Juhan-Vague I, Alessi M, Vague P. Increased plasma plasminogen activator inhibitor 1 levels. A possible link between insulin resistance and atherothrombosis. Diabetologia. (1991) 34:457–62. doi: 10.1007/BF00403280
21. Kohler HP, Grant PJ. Plasminogen-activator inhibitor type 1 and coronary artery disease. N Engl J Med. (2000) 342:1792–801. doi: 10.1056/NEJM200006153422406
22. Juhan-Vague I, Roul C, Alessi M, Ardissone J, Heim M, Vague P. Increased plasminogen activator inhibitor activity in non insulin dependent diabetic patients–relationship with plasma insulin. Thromb Haemost. [1989] 61:370–3. doi: 10.1055/s-0038-1646598
23. Shimomura I, Funahasm T, Takahashi M, Maeda K, Kotani K, Nakamura T, et al. Enhanced expression of PAI−1 in visceral fat: possible contributor to vascular disease in obeisty. Nat Med. (1996) 2:800–3. doi: 10.1038/nm0796-800
24. Alessi M, Peiretti F, Morange P, Henry M, Nalbone G, Juhan-Vague I. Production of plasminogen activator inhibitor 1 by human adipose tissue: possible link between visceral fat accumulation and vascular disease. Diabetes. (1997) 46:860–7. doi: 10.2337/diabetes.46.5.860
25. Mandrup-Poulsen T. The role of interleukin-1 in the pathogenesis of IDDM. Diabetologia. (1996) 39:1005–29. doi: 10.1007/BF00400649
26. Dumic J, Dabelic S, Flögel M. Galectin-3: an open-ended story. Biochimica et Biophysica Acta (BBA)-General Subjects. (2006) 1760:616–35. doi: 10.1016/j.bbagen.2005.12.020
27. Pugliese G, Iacobini C, Pesce CM, Menini S. Galectin-3: an emerging all-out player in metabolic disorders and their complications. Glycobiology. (2015) 25:136–50. doi: 10.1093/glycob/cwu111
28. Childs CE, Calder PC, Miles EA. Diet and Immune Function. Basel, Switzerland: Multidisciplinary Digital Publishing Institute. (2019). doi: 10.3390/nu11081933
29. Keller U. Nutritional laboratory markers in malnutrition. J Clin Med. (2019) 8:775. doi: 10.3390/jcm8060775
30. Park KH, Zaichenko L, Peter P, Davis CR, Crowell JA, Mantzoros CS. Diet quality is associated with circulating C-reactive protein but not irisin levels in humans. Metabolism. (2014) 63:233–41. doi: 10.1016/j.metabol.2013.10.011
31. Kuczmarski MF, Mason MA, Allegro D, Zonderman AB, Evans MK. Diet quality is inversely associated with C-reactive protein levels in urban, low-income African-American and white adults. J Acad Nutr Diet. [2013] 113:1620–31. doi: 10.1016/j.jand.2013.07.004
32. Fung TT, McCullough ML, Newby P, Manson JE, Meigs JB, Rifai N, et al. Diet-quality scores and plasma concentrations of markers of inflammation and endothelial dysfunction. Am J Clin Nutr. (2005) 82:163–73. doi: 10.1093/ajcn.82.1.163
33. Kennedy E, Ohls J, Carlson SK. Fleming. The Health Eating Index: design and application. J Am Diet Assoc. (1995) 95:1103–8. doi: 10.1016/S0002-8223(95)00300-2
34. Guenther PM, Casavale KO, Reedy J, Kirkpatrick SI, Hiza HA, Kuczynski KJ, et al. Update of the healthy eating index: HEI-2010. J Acad Nutr Diet. (2013) 113:569–80. doi: 10.1016/j.jand.2012.12.016
35. Kim S, Haines PS, Siega-Riz AM, Popkin BM. The Diet Quality Index-International (DQI-I) provides an effective tool for cross-national comparison of diet quality as illustrated by China and the United States. J Nutr. (2003) 133:3476–84. doi: 10.1093/jn/133.11.3476
36. Joint F Organization WH. Preparation and use of food-based dietary guidelines: World Health Organization. (1998).
37. Montagnese C, Santarpia L, Iavarone F, Strangio F, Sangiovanni B, Buonifacio M, et al. Food-based dietary guidelines around the world: eastern Mediterranean and Middle Eastern countries. Nutrients. (2019) 11:1325. doi: 10.3390/nu11061325
39. Tur JA, Romaguera D, Pons A. The Diet Quality Index-International (DQI-I): is it a useful tool to evaluate the quality of the Mediterranean diet? Br J Nutr. (2005) 93:369–76. doi: 10.1079/BJN20041363
40. Organization WH. World Health Organization-Regional Committee for the Eastern Mediterranean: statement by the delegate of Egypt. (1949).
41. Ebrahimi S, McNaughton SA, Leech RM, Abdollahi M, Houshiarrad A, Livingstone KM, et al. comparison of diet quality indices in a nationally representative cross-sectional study of Iranian households. Nutr J. (2020) 19:1–11. doi: 10.1186/s12937-020-00646-5
42. CDC. Anthropometry Procedures Manual. (2017). Available online at: https://wwwn.cdc.gov/nchs/data/nhanes/2017-2018/manuals/2017_Anthropometry_Procedures_Manual.pdf.
43. Gutch M, Kumar S, Razi SM, Gupta KK, Gupta A. Assessment of insulin sensitivity/resistance. Indian J Endocrinol Metab. (2015) 19:160. doi: 10.4103/2230-8210.146874
44. Graf S, Karsegard VL, Viatte V, Heidegger CP, Fleury Y, Pichard C, et al. Evaluation of three indirect calorimetry devices in mechanically ventilated patients: which device compares best with the Deltatrac II®? A prospective observational study. Clini Nutr. (2015) 34:60–5. doi: 10.1016/j.clnu.2014.01.008
45. Neelakantan N, Whitton C, Seah S, Koh H, Rebello SA, Lim JY, et al. Development of a semi-quantitative food frequency questionnaire to assess the dietary intake of a multi-ethnic urban Asian population. Nutrients. (2016) 8:528. doi: 10.3390/nu8090528
46. Ghaffarpour M, Houshiar-Rad A, Kianfar H. The manual for household measures, cooking yields factors and edible portion of foods. Tehran: Nashre Olume Keshavarzy. (1999) 7:42–58.
48. Kim M-H, Bae Y-J. Evaluation of diet quality of children and adolescents based on nutrient and food group intake and Diet Quality Index-International (DQI-I). Korean J Community Nutr. (2010) 15:1–14.
49. Alkerwi Aa, Vernier C, Crichton GE, Sauvageot N, Shivappa N, Hébert JR. Cross-comparison of diet quality indices for predicting chronic disease risk: findings from the Observation of Cardiovascular Risk Factors in Luxembourg (ORISCAV-LUX) study. Br J Nutr. (2015). 113:259–69. doi: 10.1017/S0007114514003456
50. Craig CL, Marshall AL, Sjöström M, Bauman AE, Booth ML, Ainsworth BE, et al. International physical activity questionnaire: 12-country reliability and validity. Med Sci Sports Exerc. (2003) 35:1381–95. doi: 10.1249/01.MSS.0000078924.61453.FB
51. Ainsworth BE, Haskell WL, Herrmann SD, Meckes N, Bassett DR, Tudor-Locke C, et al. 2011 Compendium of Physical Activities: a second update of codes and MET values. Med Sci Sports Exerc. (2011) 43:1575–81. doi: 10.1249/MSS.0b013e31821ece12
52. Kaplan MS, Huguet N, Newsom JT, McFarland BH, Lindsay J. Prevalence and correlates of overweight and obesity among older adults: findings from the Canadian National Population Health Survey. J Gerontol A Biol Sci Med Sci. (2003) 58:M1018–M30. doi: 10.1093/gerona/58.11.M1018
53. Ridker PM, Buring JE, Shih J, Matias M, Hennekens CH. Prospective study of C-reactive protein and the risk of future cardiovascular events among apparently healthy women. Circulation. (1998) 98:731–3. doi: 10.1161/01.CIR.98.8.731
54. Hotamisligil GS. Inflammation and metabolic disorders. Nature. (2006) 444:860–7. doi: 10.1038/nature05485
55. Calder PC, Ahluwalia N, Brouns F, Buetler T, Clement K, Cunningham K, et al. Dietary factors and low-grade inflammation in relation to overweight and obesity. Br J Nutr. (2011) 106:S1–S78. doi: 10.1017/S0007114511005460
56. Lopez-Garcia E, Schulze MB, Fung TT, Meigs JB, Rifai N, Manson JE, et al. Major dietary patterns are related to plasma concentrations of markers of inflammation and endothelial dysfunction. Am J Clin Nutr. (2004) 80:1029–35. doi: 10.1093/ajcn/80.4.1029
57. King DE, Egan BM, Woolson RF, Mainous AG, Al-Solaiman Y, Jesri A. Effect of a high-fiber diet vs a fiber-supplemented diet on C-reactive protein level. Arch Intern Med. (2007) 167:502–6. doi: 10.1001/archinte.167.5.502
58. Ajani UA, Ford ES, Mokdad AH. Dietary fiber and C-reactive protein: findings from national health and nutrition examination survey data. J Nutr. (2004) 134:1181–5. doi: 10.1093/jn/134.5.1181FP,ln,noaushighlight,canohighlight
59. Kubota Y, Moriyama Y, Yamagishi K, Tanigawa T, Noda H, Yokota K, et al. Serum vitamin C concentration and hs-CRP level in middle-aged Japanese men and women. Atherosclerosis. (2010) 208:496–500. doi: 10.1016/j.atherosclerosis.2009.07.052
60. Antoniazzi L, Arroyo-Olivares R, Bittencourt MS, Tada MT, Lima I, Jannes CE, et al. Adherence to a Mediterranean diet, dyslipidemia and inflammation in familial hypercholesterolemia. Nutr Metab Cardiovasc Dis. (2021) 31:2014–22. doi: 10.1016/j.numecd.2021.04.006
61. Martínez-González MA, Fernández-Jarne E, Serrano-Martínez M, Marti A, Martinez JA, Martín-Moreno JM. Mediterranean diet and reduction in the risk of a first acute myocardial infarction: an operational healthy dietary score. Eur J Nutr. (2002) 41:153–60. doi: 10.1007/s00394-002-0370-6
62. Hagfors L, Leanderson P, Sköldstam L, Andersson J, Johansson G. Antioxidant intake, plasma antioxidants and oxidative stress in a randomized, controlled, parallel, Mediterranean dietary intervention study on patients with rheumatoid arthritis. Nutr J. (2003) 2:1–11. doi: 10.1186/1475-2891-2-5
63. Al-Hamad D, Raman V. Metabolic syndrome in children and adolescents. Translational Pediatrics. (2017) 6:397–407. doi: 10.21037/tp.2017.10.02
64. Higgins JP, Thomas J, Chandler J, Cumpston M, Li T, Page MJ, et al. Cochrane Handbook for Systematic Reviews of Interventions. Hoboken, NJ: John Wiley & Sons. (2019). doi: 10.1002/9781119536604
65. Suhett LG, Hermsdorff HHM, Cota BC, Ribeiro SAV, Shivappa N, Hébert JR, et al. Dietary inflammatory potential, cardiometabolic risk and inflammation in children and adolescents: a systematic review. Crit Rev Food Sci Nutr. (2021) 61:407–16. doi: 10.1080/10408398.2020.1734911
66. Estruch R. Anti-inflammatory effects of the Mediterranean diet: the experience of the PREDIMED study. Proc Nutr Soc. (2010) 69:333–40. doi: 10.1017/S0029665110001539
67. Piché M-È, Lemieux S, Weisnagel SJ, Corneau L, Nadeau A, Bergeron J. Relation of high-sensitivity C-reactive protein, interleukin-6, tumor necrosis factor-alpha, and fibrinogen to abdominal adipose tissue, blood pressure, and cholesterol and triglyceride levels in healthy postmenopausal women. Am J Cardiol. (2005) 96:92–7. doi: 10.1016/j.amjcard.2005.02.051
68. Anderson AL, Harris TB, Tylavsky FA, Perry SE, Houston DK, Lee JS, et al. Dietary patterns, insulin sensitivity and inflammation in older adults. Eur J Clin Nutr. (2012) 66:18–24. doi: 10.1038/ejcn.2011.162
69. Hoebeeck L, Rietzschel E, Langlois M, De Buyzere M, De Bacquer D, De Backer G, et al. The relationship between diet and subclinical atherosclerosis: results from the Asklepios Study. Eur J Clin Nutr. (2011) 65:606–13. doi: 10.1038/ejcn.2010.286
70. Esposito K, Marfella R, Ciotola M, Di Palo C, Giugliano F, Giugliano G, et al. Effect of a Mediterranean-style diet on endothelial dysfunction and markers of vascular inflammation in the metabolic syndrome: a randomized trial. JAMA. (2004) 292:1440–6. doi: 10.1001/jama.292.12.1440
71. Giugliano D, Ceriello A, Esposito K. The effects of diet on inflammation: emphasis on the metabolic syndrome. J Am Coll Cardiol. (2006) 48:677–85. doi: 10.1016/j.jacc.2006.03.052
72. Casas R, Urpi-Sardà M, Sacanella E, Arranz S, Corella D, Castañer O, et al. Anti-inflammatory effects of the mediterranean diet in the early and late stages of atheroma plaque development. Mediators Inflamm. (2017) 2017:3674390. doi: 10.1155/2017/3674390
Keywords: inflammatory markers, obese, overweight, women, diet quality index-international (DQI-I)
Citation: Shiraseb F, Ebrahimi S, Noori S, Bagheri R, Alvarez-Alvarado S, Wong A and Mirzaei K (2023) The association between diet quality index-international and inflammatory markers in Iranian overweight and obese women. Front. Nutr. 10:1164281. doi: 10.3389/fnut.2023.1164281
Received: 12 February 2023; Accepted: 26 April 2023;
Published: 19 May 2023.
Edited by:
Hui-Xin Liu, China Medical University, ChinaReviewed by:
Vibeke H. Telle-Hansen, Oslo Metropolitan University, NorwayPilar Zafrilla, Catholic University San Antonio of Murcia, Spain
Copyright © 2023 Shiraseb, Ebrahimi, Noori, Bagheri, Alvarez-Alvarado, Wong and Mirzaei. This is an open-access article distributed under the terms of the Creative Commons Attribution License (CC BY). The use, distribution or reproduction in other forums is permitted, provided the original author(s) and the copyright owner(s) are credited and that the original publication in this journal is cited, in accordance with accepted academic practice. No use, distribution or reproduction is permitted which does not comply with these terms.
*Correspondence: Khadijeh Mirzaei, bWlyemFlaV9raEB0dW1zLmFjLmly