Abstract
Introduction and aims:
Dietary Rational Gene Targeting (DRGT) is a therapeutic dietary strategy that uses healthy dietary agents to modulate the expression of disease-causing genes back toward the normal. Here we use the DRGT approach to (1) identify human studies assessing gene expression after ingestion of healthy dietary agents with an emphasis on whole foods, and (2) use this data to construct an online dietary guide app prototype toward eventually aiding patients, healthcare providers, community and researchers in treating and preventing numerous health conditions.
Methods:
We used the keywords “human”, “gene expression” and separately, 51 different dietary agents with reported health benefits to search GEO, PubMed, Google Scholar, Clinical trials, Cochrane library, and EMBL-EBI databases for related studies. Studies meeting qualifying criteria were assessed for gene modulations. The R-Shiny platform was utilized to construct an interactive app called “Eat4Genes”.
Results:
Fifty-one human ingestion studies (37 whole food related) and 96 key risk genes were identified. Human gene expression studies were found for 18 of 41 searched whole foods or extracts. App construction included the option to select either specific conditions/diseases or genes followed by food guide suggestions, key target genes, data sources and links, dietary suggestion rankings, bar chart or bubble chart visualization, optional full report, and nutrient categories. We also present user scenarios from physician and researcher perspectives.
Conclusion:
In conclusion, an interactive dietary guide app prototype has been constructed as a first step towards eventually translating our DRGT strategy into an innovative, low-cost, healthy, and readily translatable public resource to improve health.
Summary of Eat4Genes and its utility. Using our Dietary Rational Gene Targeting approach as a guide, bioinformatic mining of public databases was carried out to identify human studies assessing gene expression after ingestion of healthy dietary agents with an emphasis on whole foods. This information was used in the construction of the dietary Eat4Genes app, which is able to identify healthy dietary agents able to modulate the expression of key risk genes back toward the normal to potentially treat various health conditions. This app is presently a prototype model that provides dietary suggestions, an important step toward future studies testing these suggestions in clinical trials toward moving the Eat4Gene app to a dietary recommendation resource.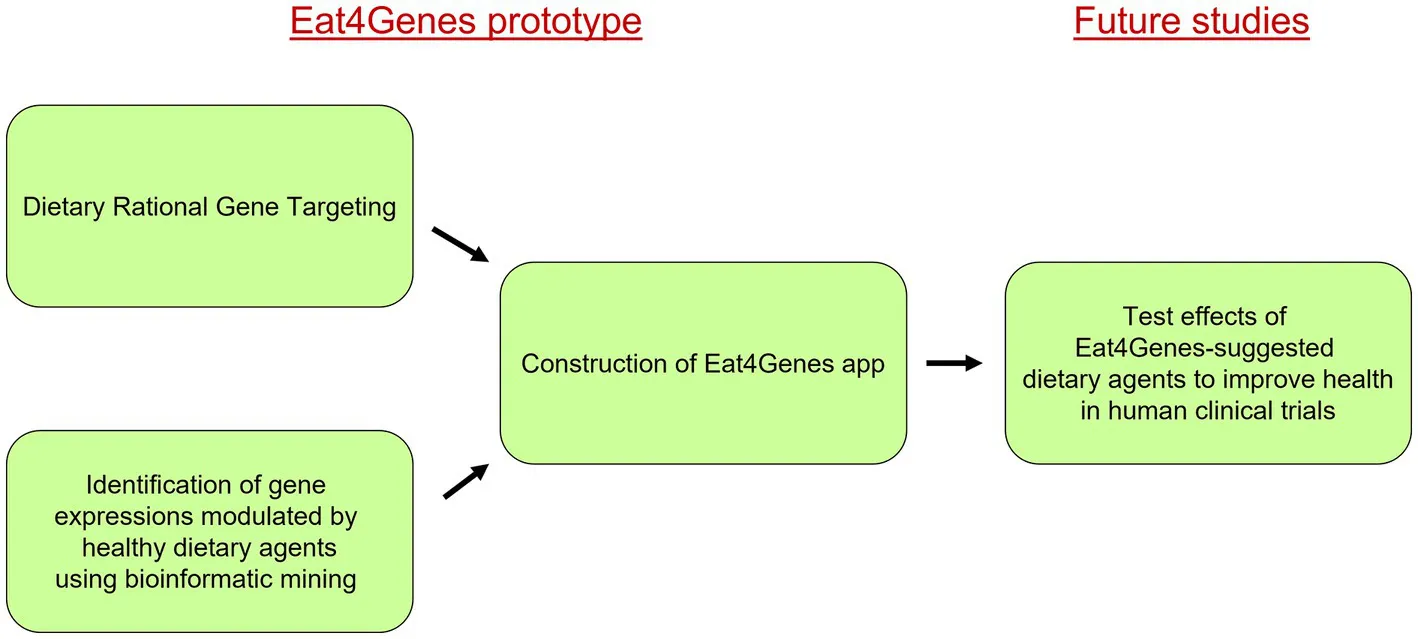
1. Introduction
Much of the world’s population has one or more chronic diseases leading to suffering and high costs of health care (1). While pharmaceutical drugs offer valuable treatments, they can also be expensive and associated with toxic side effects in both the short and long term (2). In fact, healthcare costs (per GDP) have more than tripled in the last 60 years (3). Healthy dietary approaches represent a protective and complementary option for such treatments due to their vastly reduced costs and documented health benefits.
We have developed a low-cost and healthy treatment strategy for a wide range of health associated conditions that we call “dietary rational gene targeting” (DRGT) (4–7). Here, healthy dietary agents such as berries, nuts and whole grains are used to modulate disease-contributing gene expression back toward the normal. This strategy offers many advantages over just pharmaceutical drugs in slowing the disease process including lowering treatment cost, reducing drug toxicity, and being readily translatable since it requires achievable diet modification. It represents an important extension of so-called “nutrigenomic” studies with hopes of expanding and accelerating DRGT use for public therapeutic benefit.
Numerous studies have reported beneficial effects from a plant-based diet, with key bioactive compounds such as polyphenols singled out for their health benefits and in some cases, modulation of gene expression (8–12). This has developed into the precision nutrition field maximizing individual dietary benefit as opposed to less effective general population guidelines (13). Precision nutrition is highly complex and considers genetics, epigenetics, microbiota, physiology and much more with a lot still unknown. We feel that dietary rational gene targeting “leapfrogs” much of this highly complicating variability by assessing the levels of individual mRNA (and resultant protein) expressions, which are key physiological effectors, in turn efficiently contributing to a potential individualized precision nutrition dietary strategy. For example, healthy dietary reduction in the expression level of VEGF-A (Vascular endothelial growth factor A) to combat cancer metastasis is a good example of our dietary strategy as opposed to only the use of a pharmaceutical drug such as which is expensive and sometimes toxic (14).
While the targeting of key disease-related genes/proteins with healthy diet has excellent promise, a surprising lack of such studies directly translatable to human in vivo have been carried out. Instead, most studies have focused on cell culture at non-physiological concentrations of dietary agents and dietary rodent studies that do not translate well to human. Recent studies by Martin-Hernandez et al. (15) and Zheng et al. (16) have provided a valuable framework for a nutrigenomics web app model although this model is limited by its emphasis on purified bioactive compounds in cell culture studies. Cell culture studies are a weak substitute for in vivo, especially for dietary studies given the complexity of the human digestive system. Additionally, while some such isolated botanical compounds are available as dietary supplements, their health benefits are unclear due to low bioavailability and limited food matrix synergy (17–21).
Here, we provide a major extension of such studies to emphasize whole food and extracts, in vivo human ingestion, and the therapeutic targeting of a wide range of health conditions to greatly improve the potential effectiveness of our food suggestions. Our overall hypothesis is that identification of healthy whole foods that modulate health condition-causing gene expression back toward the normal is a low-cost, healthy, and readily-translatable complementary therapeutic approach to costly and sometimes toxic pharmaceutical drugs. Here “Condition” is defined as any state of health; i.e., optimal or sub-optimal, with sub-optimal then including diseases and disorders. Construction of our new interactive dietary guide app (“Eat4Genes”) examines, for the first time, the relationship between conditions, risk gene expression, and whole food diet in human following ingestion using studies collected from published clinical trials and bioinformatic resources and includes development of a preliminary ranking system for presentation of DRGT results. We envision this prototype app as a key first step toward eventually aiding patients, healthcare providers, community and researchers in treating and preventing numerous health conditions.
2. Materials and methods
2.1. Bioinformatic mining and in vivo dataset
To assess the effect of dietary agents (whole foods, food extracts, and purified phytochemicals) on gene expression, we carried out extensive public database mining. Here, we used the Boolean search operator AND in combination with the keywords “human,” “gene expression”, and separately, each individual dietary agent of interest (below). Databases searched included the National Center for Biotechnology Information’s (NCBI) Gene Expression Omnibus (GEO) (22); PubMed (23); Google Scholar (24); clinical trials published through the U.S. Library of Medicine (25); the Cochrane library (26); and the European Molecular Biology Laboratory’s European Bioinformatics Institute (EMBL-EBI) (27). Where necessary, the NCBI GEO2R web tool was used to analyze noncurated data (28). Hits were further filtered to select only studies involving human oral consumption of these dietary agents, appropriate controls, and clearly accessible and interpretable data. Retrospective questionnaire studies were excluded.
2.2. Dietary agents searched (keywords)
As part of the above databases searches, each of the following dietary agents were searched representing whole foods, whole food extracts, and purified phytochemicals with reported health benefits: grape, olive oil, ginkgo, soy, oatmeal, grains, cereal, garlic, blueberry, walnuts, cashews, pistachios, hazelnuts, Brazil nuts, almonds, broccoli, kale, spinach, ginger, mushrooms, pineapple, nuts, beans, ginseng, pomegranate, legumes, kiwi, flaxseed, acai, black cherry, rosemary, mango, oranges, apples, passionfruit, coffee, yogurt, fiber, green tea, vegetable juice, turmeric, epigallocatechin gallate (EGCG), curcumin, genistein, quercetin, resveratrol, lycopene, berberine, hesperidin, sulforaphane, and apigenin. These dietary agents were selected based on significant published evidence for their health benefits (e.g., 8-12, 20-21, 29-43) with the caveat that there is no known perfectly healthy food.
2.3. DRGT data collection, cleaning, and preparation
The DRGT dataset at the heart of Eat4Genes has three main data sources: our compiled list of health conditions and the desired risk gene modulation to improve these conditions (condition-to-gene abbreviated “condition2Gene”); our compiled curated list of human in vivo ingestion studies that quantify how consumption of nutrients influences gene expression (“geneData”); and in vitro human cell culture results available from NutrigenomeDB.
The condition2Gene subtable was created to link health conditions to known key risk genes. Such risk genes were identified through independent compilations from PubMed, known pharmaceutical targets, and the NCBI resource “Genes and Disease” (29). The geneData subtable contains the data for all of the mined dietary gene expression studies. The gene expression data was extracted from the studies and converted to log2-derived fold change (L2FC). While all results were included such as no (neutral) gene expression change, our preferred and highest rated data are dietary conditions leading to a greater than 1.2-fold (L2FC > 0.263) up-or down-modulation (a value within the wide cutoff range of our references), and with a normal value of p of <0.05. In addition to the above, a “geneNames” subtable was created to form a consistent naming convention using the HGNC (HUGO Gene Nomenclature Committee) site multi-symbol checker tool to find approved gene symbols and full gene names. The subtable nutrientInfo contains information on the nutrients. We use the word “nutrients” to include healthy phytochemicals as well as functional foods (e.g., fruits and vegetables) that can be consumed by humans. The dataset contains 51 different nutrients and each is linked to the category (whole food, whole food extract, or phytochemical), a brief description, a link to an external webpage with more information, and a link to a small icon to represent the nutrient. Finally, the studyData subtable includes the reference name of the study; the nutrient; the full name of the study; a brief summary; the GEO accession number used for the expression data (if available); a link to the study; whether the study was in vivo or in vitro; the consumption method; the type of subject; the concentration of the nutrient used; the sample size of the study; and the ranking. Combined, the Eat4Genes DRGT dataset consists of these five linked subtables that capture the relationships between nutrients, scientific studies, conditions, genes, and gene expression (Figure 1).
Figure 1
In addition to our human dietary ingestion mining data, part of this dataset was derived from the NutrigenomeDB web resource (15). While NutrigenomeDB content is almost all in vitro and so significantly less valuable, it is still of some interest to our dataset. Here, we cloned the NutrigenomeDB relational database from the publicly-available github repository (30) and exported its nutrigenomic table. The resulting dataset consisted of 48 studies involving two whole foods and 24 nutrients. The NutrigenomeDB team had already performed a differential expression analysis of nutrigenomics experiments performed on human cells found in the Gene Expression Omnibus (GEO) repository. Therefore, we were able to incorporate these results directly into the below Eat4Genes app.
2.4. Eat4Genes app construction
We harmonized and joined the above data and embedded it in the Eat4Genes web app using Shiny (31), a framework for easily implementing web applications based entirely on R [20] and allowing users to interactively query and visualize data. It is modeled as an interactive webpage that serves as a food guide to help treat or prevent specific conditions based on the targeting of key genes. The prototype app has been publicly deployed (32) and its source code and DRGT dataset are available via a public github repository (33).
The app build strategy included home page construction with the option to select dietary suggestions for either a specific condition or specific gene through drop-down menus. For the “By Condition/Disease” selection, four sub-menus then appear including Food Guide, Targeted Genes, Full Report, and Data Sources. To view results for the “By Gene” selection, two sub-menus are available including Food Guide and Data Sources. For visualizations, bar charts and bubble charts are provided as choices. The package used to create this is highcharter (34), an R-based wrapper of the Highcharts (35) Javascript library. Overall, the app is organized so that the main results are provided on the second page that the user sees; as the user advances through sub-pages, higher-level details based on their selections are provided. The main results page also has two different visualizations for the user to choose from as well as text results to accommodate either lay or scientifically-knowledgeable viewers.
2.5. App ranking system
The goal of the ranking system is to assess the likelihood that users will potentially achieve a desired risk gene modulation with app selected dietary agents. At this time and at the most basic level, our rankings are based – from highest to lowest – in the order human whole food oral ingestion, whole food extract (such as extra virgin olive oil) oral ingestion, purified dietary supplement oral ingestion, cell culture studies, and cell culture studies with higher, less physiologically-relevant dietary supplement concentration. That is, clinical trials in which humans ingest nutrients and then have their changes in gene expression analyzed are, in general, considered the highest quality studies because their results are most likely to translate into practice. In vitro human studies (that is, studies of how nutrients change gene expression in human cell lines) are also considered but do not necessarily translate into in vivo effects so are considered of lesser value. In addition, the extent of each fold modulation (effect size) and associated statistical significance also contribute to our rankings, with modulations of p < 0.05 given more weight than p > 0.05. Independent duplicate studies with the same nutrient demonstrating the same direction of modulation are also rated higher although there are presently a very limited amount of such studies. The heuristics used in the relative rankings are given in github (30) with sufficient detail that they can easily be improved upon and even replaced in future research while preserving all functionality of Eat4Genes. Given the lack of human in vivo ingestion studies, we are not able to construct a more meaningful detailed numeric ranking system at this time and thus, consider this above relative ranking as a basic introductory guide. Nonetheless, since this is such an important consideration for translating our dietary guide to human usage, we are establishing this basic relative ranking for our current Eat4Genes app prototype with the caveat that it can be expanded upon over time (See Discussion).
2.6. Statistical analyses
Effect sizes and statistical analyses were obtained from each mined source; i.e., these gene expression datasets were directly downloaded from each study. Experimental designs varied and included microarray, qPCR and RNA sequencing but were uniformly reported as normalized data using reference controls. For our proposed prototype ranking system for presentation of DRGT results, these data were sorted by effect sizes and correlate p values presented without filtering, with higher and lower values, respectively, prioritized. An effect size versus p value plot is also included in the app Full Report to highlight the most prominent and significant gene expression modulations. Cohort sizes and time of test diet administration for each study are presented in both tables and underscore the wide range of experimental designs.
3. Results
3.1. Bioinformatic mining
Fifty-one human healthy dietary agent ingestion studies were identified in the examined databases that met our qualifying criteria. Of these, 37 were human whole food or whole food extract studies as listed in Table 1 (36–70). These include 18 different whole foods and extracts (out of the 41 whole food items searched). Some of these studies included multiple timepoints, increasing the usable data. GEO and/or PubMed databases contained all such data; i.e., this data was not scattered throughout the various databases utilized. Despite varying conditions (e.g., time of test diet administration), the number of modulated genes for those studies examining whole genome expression was reasonably consistent (1,061 ± 227 SEM). Whole food human ingestion studies reported to modulate genes included grape, Brazil nuts, walnuts, hazelnuts, pistachios, soy, broccoli, yogurt, blueberries, bilberries, garlic, kiwi, and fruit and vegetable blend concentrate (36, 39, 42–47, 49, 51–55, 64–67). Whole food extract human ingestion studies reported to modulate genes included grape extract, green tea extract, soy extract, olive oil, broccoli extract, orange juice, Bergeris vulgaris juice, and apple and blueberry juice (37, 38, 40, 41, 43, 48, 50, 56–63, 68–70). In addition, purified bioactive phytochemicals with gene modulatory effects were identified from 14 independent studies (63, 71–83). They included curcumin, quercetin, resveratrol, EGCG (epigallocatechin gallate), genistein, soy isoflavones (genistein, daidzein, glycitein), DIM (3,3′-diindolylmethane), sulforaphane, and hesperidin (Table 2). Modulated gene expression was observed in a variety of cells/tissues in these studies including peripheral blood mononuclear cells (PBMCs), white blood cells, whole blood, blood monocytes, breast cancer biopsies, prostate cancer biopsies, nipple aspirate fluid, rectal biopsies, muscle biopsies, nasal lavage cells, blood lymphocytes, and bronchoscopy cells. In addition, we identified 96 key risk genes for a wide range of pathologies (e.g., HMGCR for Hypercholesterolemia) for our app.
Table 1
| Food type | Diet time | Cell/tissue | N | References |
|---|---|---|---|---|
| Grapes | 3 weeks | PBMCs | 6 | (36) |
| 1,2,4,12 h | blood lymphocytes | 6 | (37) | |
| 8 weeks | whole blood | 13 | (38) | |
| 3 h and 4 weeks | PBMCs | 20 | (39) | |
| 6–12 months | PBMCs | 6 | (40) | |
| 8 weeks | muscle biopsies | 38 | (41) | |
| 9 weeks | whole blood | 10 | (42) | |
| Nuts | 6 weeks | rectal biopsies | 9 | (43) |
| 2–3 weeks | breast cancer/normal biopsy | 5 | (44) | |
| 4 weeks | whole blood | 22 | (45) | |
| 6 weeks | whole blood | 12 | (46) | |
| 4 months | pistachios | 49 | (47) | |
| Soy | 7–30 days | breast cancer biopsies | 51 | (48) |
| 8 weeks | PBMCs | 18 | (49) | |
| Broccoli | 4–8 weeks | prostate biopsies | 48 | (50) |
| 3 days | nasal lavage cells | 5 | (51) | |
| Yogurt | 9 weeks | PBMCs | 30 | (52) |
| 2,4,6 h | whole blood | 6 | (53) | |
| 2,4,6 h | whole blood | 7 | (54) | |
| 8 weeks | PBMCs | 25 | (55) | |
| Olive oil | 4 h | PBMCs | 12 | (56) |
| 4 h | PBMCs | 12 | (56) | |
| 3 weeks | PBMCs | 18 | (57) | |
| 3 weeks | PBMCs | 18 | (58) | |
| 5 h | PBMCs | 13 | (59) | |
| 6 h | PBMCs | 6 | (60) | |
| 3 weeks | PBMCs | 10 | (61) | |
| 4 h | PBMCs | 20 | (62) | |
| Other | ||||
| Orange juice | 4 weeks | white blood cells | 10 | (63) |
| Blueberries | 4 weeks | PBMCs | 40 | (64) |
| Bilberries | 8 weeks | PBMCs | 27 | (65) |
| Garlic | 3 h | whole blood | 17 | (66) |
| Green tea extract | 6 weeks | rectal biopsies | 11 | (43) |
| Kiwi | 8 weeks | whole blood | 10 | (67) |
| Berberis juice | 8 weeks | whole blood | 40 | (68) |
| Fruit/veg juice | 8 weeks | whole blood | 28 | (69) |
| Apple juice | 4 weeks | lymphocytes | 143 | (70) |
Human whole food or whole food extract ingestion gene expression studies.
PBMCs, peripheral blood mononuclear cells; N refers to the study participant number.
Table 2
| Dietary agent | Diet time | Cell/tissue | N | References |
|---|---|---|---|---|
| Curcumin | 0–12 h | white blood cells | 12 | (71) |
| DIM | 4–6 weeks | white blood cells | 13 | (72) |
| EGCG/RES | 12 weeks | SAT abdominal sub-Q | 25 | (73) |
| Genistein | 3–6 weeks | prostate biopsies | 10 | (74) |
| 84 days | PBMCs | 20 | (75) | |
| 1 month | prostate tissue | 14 | (76) | |
| Hesperidin | 4 weeks | white blood cells. | 10 | (63) |
| Isoflavones | 6 months | nipple aspirate | 49 | (77) |
| Quercetin | 2 weeks | blood monocytes | 3 | (78) |
| 12 weeks | PBMCs | 78 | (79) | |
| Resveratrol | 12 weeks | adipose/skeletal tissue | 15 | (80) |
| 30 days | muscle | 10 | (81) | |
| 2 months | PBMCs | 46 | (82) | |
| Sulforaphane | 6 weeks | bronchoscopy cells | 29 | (83) |
Human purified phytochemical ingestion gene expression studies.
EGCG, epigallocatechin gallate; DIM, 3,3′-diindolylmethane; RES, resveratrol; PBMCs, peripheral blood mononuclear cells; N refers to the study participant number.
3.2. Bioinformatic mining: in vivo versus in vitro and ranking
Although these dietary human ingestion studies were enough to construct our below Eat4Genes app, our mining also revealed a surprising modest number of studies translatable to human in vivo prior to filtering, underscoring the need for more such studies. Instead, beyond the Table 1 whole food-related studies, most dietary related gene expression studies found used human cells in culture as are well summarized in NutrigenomeDB (15), many at non-physiological concentrations of dietary agents. Even the above 14 human in vivo ingestion studies with purified phytonutrient supplements are of more questionable value given their typical poor bioavailability in vivo, their uncertain long-term effects as compared with whole foods, and their high concentrations in some cases. Based on this, we prioritized our mined studies as detailed in the Methods “Ranking” section. Exact rankings are not possible at this time given the lack of in vivo data such as confirmatory studies by independent laboratories carried out under similar conditions. Nonetheless, our “relative” ranking system provides a prototype foundation for an important DRGT issue, and one that will be improved and refined over time as additional clinical studies are performed.
3.3. Eat4Genes app implementation
Figure 2 shows the basic structure of Eat4Genes. Users first enter a home page that describes the app, then obtain nutrient suggestions either for a condition by selecting By Condition/Disease or for a specific gene by selecting By Gene. Subsequent results are presented in four views: Food Guide, Targeted Genes, Full Report, and Data Sources. In summary:
Home Page: the user first sees the Home page. The left panel contains our mission statement, which is also the introduction to this paper. The right column of the home page presents some statistical evidence for the value of our food guide.
By Condition Page: users can search for results based on a specified condition or disease selected through a drop-down menu. Results will then show all of the nutrients that modulate the expression of key risk genes and in a direction that benefits a particular condition. This page has four sub-menus: Food Guide, Targeted Genes, Full Report, and Data Sources. In summary:
Figure 2
Food Guide Page: the left panel of the Food Guide page shows the dietary nutrients suggested for each health condition classified by category. Beneath that, there are instructions on how to navigate the page and a brief explanation of the rankings. On the right side, the user is shown the visualization model with interaction instructions. Underneath the main section of the page, the user can view more information on the food guide in table form, including the nutrient, the ranking, the category, a brief description, and a link to an external webpage.
Targeted Genes Page: the main result of the Targeted Genes page is a table showing the matches of key risk genes for the condition. It contains, for each matching gene: the gene, the direction of modulation, the nutrient, the ranking, and the type. On the left side of the page, a panel shows the user’s information about the table. It explains up and down regulation of gene expression. It also shows the user the key risk genes found in the Eat4Genes database for the condition they have selected.
Full Report Page: the Full Report provides a summary of the data given to the user on the app in more detail, intended for healthcare providers and others interested in a more in-depth review of the data pooled to create the food guide.
Data Sources Page: this page provides the user with the studies referenced for the food guide that they have received. Here the user can see, for each study: the ranking, the nutrient, the name of the study, a link to the study, a brief summary, whether the study was in vitro or in vivo, the type of nutrient, the concentration of the nutrient used in the study, and the sample size of the study.
By Gene Page: the users have the option to search for results by specifying a gene and desired expression direction: up or down. The results show only the nutrients that affect that gene’s expression in that specified direction. This page has two sub-menus: food Guide and Data Sources. These pages have the same above layouts as their counterparts in the By Condition page.
About Page: this page provides the user with a summary of the purpose of the Eat4Genes app, an explanation of the ranking system, and our defined food type categories (whole foods, whole food extracts and phytochemicals).
To make results accessible to a wider audience, Eat4Genes provides visualizations of the Food Guide section as bar charts or bubble charts to enable a choice of views. In the bubble chart, the size of each circle is based on the ranking value. To show users the different types of recommended nutrients, the app uses a hierarchical packed bubble graph, which groups the bubbles by category. When the user hovers over a bubble, the name of the nutrient, a small image, the ranking, and a description with important information about the nutrient are shown. When the user clicks on the bubble, they are directed to a website with more nutritional information.
Eat4Genes is also targeted to two different demographics: (1) lay users seeking only basic details, such as less technically-knowledgeable patients or community members, and (2) those seeking more details, such as healthcare providers, technically-knowledgeable patients, and biomedical researchers. This added detail is provided in the optional Full Report menu. It was added based on feedback recommendations from our Usability survey (N = 17), which was otherwise positive about the app outlay.
3.4. Patient consultation scenario
We illustrate the utility of the app in two usage scenarios within the limitations of our current prototype app as discussed below. In the first scenario, someone diagnosed with hypertension, or a healthcare professional on their behalf, consults the Eat4Genes app to obtain dietary guidance as a complement or alternative to pharmaceuticals. On the app’s home page, two workflow options are presented: search by a condition or search by a specific gene. Since this user is searching by a condition, the By Condition/Disease option is selected at the top of the page and the user is prompted to select their health condition.
On the next page, the Food Guide sub-menu page first appears and on the left side, the user sees a list of the dietary nutrients sorted by category (Figure 3). On the right-hand side, the user sees a plot of the suggested foods, ordered by ranking, and colored by nutrient category. For this scenario, orange juice, egg yolks, soy, soy oil and rosemary are among the top suggested foods. The user can then download an image file of their results if desired (Figure 4A). At the bottom of this page, a table of results used to create the food plots can be viewed and, in the case of a healthcare professional user, this information used to explain the food guide to their patient.
Figure 3
Figure 4
For some users the interactive bubble view, annotated with additional information, may be more effective and compelling. From Food Guide, the user simply selects Bubble View to view nutrients in the form of a bubble plot on the right-hand side (Figure 4B). Each category can also be clicked to remove or emphasize; e.g., the “Phytochemicals” category can be clicked to remove it such that only whole foods and whole food extracts are now displayed. Larger bubbles represent the relatively stronger suggestions and the nutrients are sorted by category. The user can also hover over a given nutrient for additional mouseover information; e.g., hovering over orange juice reveals the nutrient name, a small image, the relative ranking, and a brief description (Figure 5). Clicking on the bubble opens a new tab with even more information. All plots can also be downloaded.
Figure 5
The user can next explore which hypertension-associated key genes were targeted by these foods on the Targeted Genes sub-menu page. Both upregulated gene expressions (e.g., NOS3) and downregulated gene expressions (e.g., ACE) are shown here for this hypertension example with nutrient and ranking information also provided (Figure 6). Finally, the user can access the evidence behind the dietary suggestions by navigating to the Data Sources sub-page. Figure 7 shows the Data Sources table generated for hypertension that includes basic information about each study, the study title, and links to the published paper. Here the provider sees that the results are based on 14 studies, two in vivo and twelve in vitro. The top in vivo study examined orange juice as a potential protective agent for cardiovascular diseases (63), making it more likely to be directly relevant for hypertension. The second in vivo study examined gene expression differences caused by soy in patients with breast cancer (48). An eventual judgement would eventually be needed as to whether a study such as this (e.g., using a cancer patient study population) is relevant to address hypertension for the patient being considered. Relative to this, we emphasize that we are describing an app prototype in this manuscript and so throughout, carefully use the word “guide” instead of “recommendation.” The latter word is not yet warranted through use of the current app and will require, among other things, additional confirmational studies by independent labs and determination of how representative gene expression response to a given nutrient for anyone compares to studies of those with existing pathologies such as the above soy example.
Figure 6
Figure 7
3.5. Researcher scenario
We now consider a second scenario in which the user is a research scientist studying a particular gene, e.g., the hypertension risk gene ACE (57). This scenario could also apply to patients who know the aberrantly expressed condition gene responsible for their pathology (e.g., ERBB2/Her2 for women with Her2-dependent breast cancer). For a researcher, this could help them consider translationally-relevant human dietary intervention studies, which nutrients to include in these studies relative to their research gene or health condition of interest, and to hypothesize how their app findings could be translated into practice through diet for further study. For ACE and hypertension, they could use the app to determine which nutrients may have a beneficial gene expression modulation (reduction in the case of ACE) to potentially treat hypertension.
Navigating to the top of the homepage, they would select the By Gene option. The user will then be given the option to search for a specific gene, either by typing it in or scrolling down the list of genes, and can also indicate their desired gene expression modulation (up or down). This in turn leads to the sub-page “Food Guide” again, but this time the results use only the ACE gene to identify healthy dietary agents that down modulate its expression. These results are listed in the panel on the left side of the page (Figure 8). The researcher now sees nutrients associated with down modulation of ACE. In the bubble chart (Figure 8), the researcher can see each nutrient, as well as the strength of evidence for this nutrient, as displayed by both the relative ranking and the size of the nutrient’s bubble. The researcher can also use the toggle button to see results in the plot view. This researcher will likely also want to read the original data studies using the Data Sources sub-page as above for the patient consultation scenario.
Figure 8
4. Discussion
Eat4Genes represents a significant first step towards translating the DRGT approach into a clinical deliverable in the form of a dietary guide for healthcare providers, patients, researchers, and the general community. Toward this end, we have carried out a large scale bioinformatic mining of data from multiple public gene expression databases to compile a list of genes modulated by numerous dietary nutraceuticals with a documented history of health benefits. The prototype DRGT dataset is available as an expandable resource for DRGT research and applications. The prototype Eat4Gene app enables users to find dietary guidance by condition or by genes with visualizations that show the findings along with the scientific evidence supporting them.
The prototype Eat4Genes dataset and app serve as a foundation for future work on a dietary treatment guide for patients. It is the first dietary app, to our knowledge, to focus on how whole foods change gene expression beneficially for conditions based on key health condition risk genes supported by rigorous scientific studies. This resource is an extension of the digital web model created by Martin-Hernandez et al. (15) and Zheng et al. (16).
Eat4Genes also provides a basic foundation for dietary suggestion ranking and its use in Eat4Genes. We emphasize that implementation of exact ranking is not possible until a significant number of quality in vivo clinical studies are carried out that confirm dietary suggestions, both at the level of target gene modulation and associated health benefit. There are simply not close to this number of available such studies – including replicated studies by independent groups – at this time. Nonetheless, we herein provide a useful strategy for such a ranking system that is a “relative” ranking at this time and based on comparing and prioritizing studies of interest. Thus, our present app numbers are not useful per se as absolute indictors of a study’s ranking but rather in comparison with other studies. For example, on a 1–100 scale, a present ranking of 90 means that this study compares well with other available studies based on criteria presented in the methods section. In the future, we envision that a 90 ranking would no longer be a relative assessment but rather a stand-alone value indicating excellence as assessed by numerous criteria, some not even available yet to us. These criteria would include present prioritized categories (i.e., with human whole food ingestion at the top and cell culture studies with high nutrient concentration as the bottom as well as study p values, gene modulation effect sizes, and independent lab verification of observed nutrient gene expression modulations) plus future data from many more independent lab verification studies of observed nutrient gene expression modulations; comparison of healthy individual study gene expression results to those where the study subjects have pathologies; comparative dietary agent concentration(s) and quantity range; sample size (already partially addressed by statistical significance analysis); prioritization of greater gene expression modulations; epidemiological study comparisons; and the inclusion of rodent studies although as lower prioritized studies.
In addition to patient/healthcare professional/general community value, Eat4genes also supports scientists interested in translational research. These researchers can refer to our app for identification of healthy dietary agents that modulate their research gene(s) and condition(s) of interest. If such dietary agents are found, and they modulate a given gene of interest in the right direction, they have the potential of providing future therapeutic benefit for patients. This provides a new potential line of research for investigators, such as basic preliminary studies to see if the modulation identified in our app also occurs in a relevant cell culture line or in vivo model of interest and, if successful, follow-up clinical-related studies.
It is also important to consider food matrix contributions to any in vivo dietary response, whether it’s whole food or purified botanicals. The food matrix refers to the complex physical and chemical interactions of compounds present in food and how this affects bioavailability (5, 18). Thus, whole food effects vary depending upon the mixture of ingested foods. Purified dietary supplement effects and bioavailability would also vary depending on the either synergistic or antagonistic effects of whole foods taken with them, or if they are taken without food. How this impacts our gene expression endpoint will require future controlled studies focused on specific botanical compounds taken in combination with different whole foods.
The main limitation to our approach thus far is as mentioned above: a limited pool of public database human ingestion studies to draw from such that the present app is a prototype that emphasizes “suggested” diets rather than “recommended” ones. To progress to our goal of a dietary recommendation app, improved ranking confidence is required. Another limitation is that this approach is tailored to conditions that are caused by aberrant expression or activity of one or a small number of key risk genes. Polygenic diseases would be difficult to treat this way due to the need for many modulating dietary agents. Nonetheless, many conditions fit this “small number of key risk genes” description as evidenced by the many single genes targeted by pharmaceutical drugs. That said, it is important to emphasize that nutrition should not be a replacement to necessary and rational pharmacological treatment. It is also important to note that in addition to increasing the intake of healthy foods, app users should control the consumption of unhealthy and pervasive hyper-palatable foods including saturated fat or refined carbohydrates. Relative to this, it is worth noting that while our approach is skewed toward healthy diet due to all the associated “general” health benefits, even unhealthy diets modulate gene expression and in some cases, could be beneficial by modulating the expression of key disease-associated genes in the desired direction.
In conclusion, an interactive dietary guide app prototype has been constructed towards translating our DRGT strategy into an innovative, low-cost, healthy, and readily translatable public resource to improve health. To maximize the potential effectiveness of food suggestions, the app emphasizes mined public database data using human whole food ingestion, and is intended to eventually aid patients, healthcare providers, community and researchers in treating and prevent numerous health conditions. To underscore its utility, user scenarios from physician or patient and researcher perspectives are included. Our intent is that the prototype app presented in this paper is a valuable first step that sets the stage for its future expansion and development through (1) the continued addition of future diet and gene expression study data, and (2) the addition of data from clinical studies on specific foods targeting specific key disease genes carried out as guided by our app. In addition to the need of these two future developments, and depending upon future technology and cost, (3) successful future implementation of our app for treating pathologies for a given individual will most preferably include that individual assess their specific response to a healthy diet suggestion from our app; i.e., not all individuals will respond to diet the same way as our summarized mined data.
Funding
This work was supported by the Bender Scientific Fund, the Wildermuth Foundation, and the Institute for Data Explorations and Applications at Rensselaer Polytechnic Institute.
Publisher’s note
All claims expressed in this article are solely those of the authors and do not necessarily represent those of their affiliated organizations, or those of the publisher, the editors and the reviewers. Any product that may be evaluated in this article, or claim that may be made by its manufacturer, is not guaranteed or endorsed by the publisher.
Statements
Data availability statement
The original contributions presented in the study are included in the article/supplementary material, further inquiries can be directed to the corresponding author.
Author contributions
Author contributions to the manuscript include web design and construction and data preparation by MF, JC, and ZX. Supervision of the web design and construction and data preparation by JE and KB. Dietary study data mining by VS. Data mining, creation of the dietary rational gene targeting strategy, dietary study data compilation, and assisting supervision of the web design and construction by DC. All authors contributed to the article and approved the submitted version.
Acknowledgments
We thank Tamia Brefo, Jeffrey Chai, Jessica Coco, Shathni Ravindrababu, and Natasha Rosa for their contributions to the original app and database preparation as part of the RPI Data Analytics Research class.
Conflict of interest
The authors declare that the research was conducted in the absence of any commercial or financial relationships that could be construed as a potential conflict of interest.
References
1.
HajatCSteinE. The global burden of multiple chronic conditions: a narrative review. Prev Med Rep. (2018) 12:284–93. doi: 10.1016/j.pmedr.2018.10.008
2.
VincentRS. The high cost of prescription drugs: causes and solutions. Blood Cancer J. (2020) 10:71. doi: 10.1038/s41408-020-0338-x
3.
Ctrs for Medicare & Medicaid Services. (2021). Historical. (Accessed May 12, 2022) Available at: https://www.cms.gov/Research-Statistics-Dataand-Systems/Statistics-Trends-and-Reports/NationalHealthExpendData/NationalHealthAccountsHistorical
4.
SaxenaARIlicZSripadaVCrawfordDR. Lower concentrations of curcumin inhibit Her2-Akt pathway components in human breast cancer cells, and other dietary botanicals potentiate this and lapatinib inhibition. Nutr Res. (2020) 78:93–104. doi: 10.1016/j.nutres.2020.05.007
5.
BagyiJSripadaVAidoneAMLinHYRuderEHCrawfordDR. Dietary rational targeting of redox-regulated genes. Free Radic Biol Med. (2021) 173:19–28. doi: 10.1016/j.freeradbiomed.2021.07.021
6.
HushmendySJayakumarLHahnABBhoiwalaDBhoiwalaDLCrawfordDR. Select phytochemicals suppress human T-lymphocytes and mouse splenocytes suggesting their use in autoimmunity and transplantation. Nutr Res. (2009) 29:568–78. doi: 10.1016/j.nutres.2009.08.003
7.
ZmijewskiPAGaoLYSaxenaARChavannesNKHushmendySFBhoiwalaDLet al. Fish oil improves gene targets of down syndrome in C57BL and BALB/c mice. Nutr Res. (2015) 35:440–8. doi: 10.1016/j.nutres.2015.02.007
8.
LilaMA. From beans to berries and beyond: teamwork between plant chemicals for protection of optimal human health. Ann N Y Acad Sci. (2007) 1114:372–80. doi: 10.1196/annals.1396.047
9.
TasneemSLiuBLiBChoudharyMIWangW. Molecular pharmacology of inflammation: medicinal plants as anti-inflammatory agents. Pharmacol Res. (2019) 139:126–40. doi: 10.1016/j.phrs.2018.11.001
10.
MehtaJRayalamSWangX. Cytoprotective effects of natural compounds against oxidative stress. Antioxidants. (2018) 7:147. doi: 10.3390/antiox7100147
11.
KhuranaSVenkataramanKHollingsworthAPicheMTaiTC. Polyphenols: benefits to the cardiovascular system in health and in aging. Nutrients. (2013) 5:3779–827. doi: 10.3390/nu5103779
12.
ChenDMilacicVChenMSWanSBLamWHHuoCet al. Tea polyphenols, their biological effects and potential molecular targets. Histol Histopathol. (2008) 23:487–96. doi: 10.14670/HH-23.487
13.
KirkDCatalCTekinerdoganB. Precision nutrition: a systematic literature review. Comput Biol Med. (2021) 133:104365. doi: 10.1016/j.compbiomed.2021.104365
14.
MooreDCMcVeyGN. Cost savings analysis and toxicity audit of a bevacizumab dose rounding policy at a community cancer center. J Oncol Pharm Pract. (2018) 24:42–6. doi: 10.1177/1078155216675517
15.
Martín-HernándezRRegleroGOrdovásJMDávalosA. NutriGenomeDB: a nutrigenomics exploratory and analytical platform. Database (Oxford) (2019). baz097 p.
16.
ZhengTNiYLiJChowBKCPanagiotouG. Designing dietary recommendations using system level interactomics analysis and network-based inference. Front Physiol. (2017) 8:753. doi: 10.3389/fphys.2017.00753
17.
ManachCScalbertAMorandCRémésyCJiménezL. Polyphenols: food sources and bioavailability. Am J Clin Nutr. (2004) 79:727–47. doi: 10.1093/ajcn/79.5.727
18.
YangMKooSISongWOChunOK. Food matrix affecting anthocyanin bioavailability: review. Curr Med Chem. (2011) 18:291–300. doi: 10.2174/092986711794088380
19.
LiuRH. Health benefits of fruit and vegetables are from additive and synergistic combinations of phytochemicals. Am J Clin Nutr. (2003) 78:517S–20S. doi: 10.1093/ajcn/78.3.517S
20.
KundurSPrayagASelvakumarPNguyenHMcKeeLCruzCet al. Synergistic anticancer action of quercetin and curcumin against triple-negative breast cancer cell lines. J Cell Physiol. (2019) 234:11103–18. doi: 10.1002/jcp.27761
21.
ChandraSSahKBagewadiAKeluskarVShettyARNaikZ. Additive and synergistic effect of phytochemicals in prevention of oral cancer. European journal of. Gen Dent. (2012) 1:142–7. doi: 10.4103/2278-9626.105354
22.
EdgarRDomrachevMLashAE. Gene expression omnibus: NCBI gene expression and hybridization array data repository. Nucleic Acids Res. (2002) 30:207–10. doi: 10.1093/nar/30.1.207
23.
Ntnl Libr for Medicine Ntnl Ctr for Biotech Info. (2022). PubMed. (Accessed April 8, 2022) Available at: https://pubmed.ncbi.nlm.nih.gov/
24.
Google scholar. (2022) (Accessed April 8, 2022) Available at: https://scholar.google.com/
25.
U.S. Library of Medicine. (2022). ClinicalTrials.gov. (Accessed April 8, 2022) Available at: https://clinicaltrials.gov/
26.
Cochrane. (2022). Cochrane library. (Accessed April 8, 2022) Available at: https://www.cochranelibrary.com/
27.
European Molecular Biology Laboratory. (2022). EMBL’s European bioinformatics institute. (Accessed April 8, 2022) Available at: https://www.ebi.ac.uk/
28.
Ntnl Ctr for Biotech Info (US). (2022). About GEO2R. (Accessed May 14, 2022) Available at: https://www.ncbi.nlm.nih.gov/geo/info/geo2r.html
29.
Ntnl Ctr for Biotech Info (US). (1998). Genes and disease. Ntnl Ctr for Biotech Info (US) Available at: https://www.ncbi.nlm.nih.gov/books/NBK22183/
30.
NutrigenomeDB. (2022). (Accessed May 15, 2022) Available at: https://github.com/rmartin84/NutriGenomeDB
31.
ChangWChengJAllaireJJSievertCSchloerkeBXieYet al. (2021). Shiny: web application framework for R. Available at: https://CRAN.R-project.org/package=shinyRpackageversion1.7.1
32.
The Rensselaer Data INCITE Program. (2022). Eat4Genes web app. (Accessed May 15, 2022) Available at: https://olyerickson.shinyapps.io/Eat4Genes/
33.
The Rensselaer Data INCITE Program. (2022). Eat4Genes code and data repository. (Accessed May 15, 2022) Available at: https://github.rpi.edu/DataINCITE/Eat4Genes
34.
KunstJet al. (2022). CRAN – package highcharter. (Accessed April 1, 2022) Available at: https://cran.r-project.org/web/packages/highcharter/index.html
35.
HighsoftAS. (2022). Highcharts JS JavaScript charting library. (Accessed May 10, 2022) Available at: https://www.highcharts.com/
36.
MilellaRAGasparroMAlagnaFCardoneMFRotunnoSAmmolloCTet al. Microarray data and pathway analyses of peripheral blood mononuclear cells from healthy subjects after a three weeks grape-rich diet. Data Brief. (2020) 29:105278. doi: 10.1016/j.dib.2020.105278
37.
BatyFFacompréMWiegandJSchwagerJBrutscheMH. Analysis with respect to instrumental variables for the exploration of microarray data structures. BMC Bioinf. (2006) 7:422. doi: 10.1186/1471-2105-7-422
38.
MilenkovicDVanden BergheWBobyCLerouxCDeclerckKSzarc Vel SzicKet al. Dietary flavanols modulate the transcription of genes associated with cardiovascular pathology without changes in their DNA methylation state. PLoS One. (2014) 9:e95527. doi: 10.1371/journal.pone.0095527
39.
BardagjyASHuQGieblerKAFordASteinbergFM. Effects of grape consumption on biomarkers of inflammation, endothelial function, and PBMC gene expression in obese subjects. Arch Biochem Biophys. (2018) 646:145–52. doi: 10.1016/j.abb.2018.04.003
40.
Tomé-CarneiroJLarrosaMYáñez-GascónMJDávalosAGil-ZamoranoJGonzálvezMet al. One-year supplementation with a grape extract containing resveratrol modulates inflammatory-related microRNAs and cytokines expression in peripheral blood mononuclear cells of type 2 diabetes and hypertensive patients with coronary artery disease. Pharmacol Res. (2013) 72:69–82. doi: 10.1016/j.phrs.2013.03.011
41.
HokayemMBlondEVidalHLambertKMeugnierEFeillet-CoudrayCet al. Grape polyphenols prevent fructose-induced oxidative stress and insulin resistance in first-degree relatives of type 2 diabetic patients. Diabetes Care. (2013) 36:1454–61. doi: 10.2337/dc12-1652
42.
BøhnSKMyhrstadMCWThoresenMErlundIVasstrandAKMarciuchAet al. Bilberry/red grape juice decreases plasma biomarkers of inflammation and tissue damage in aged men with subjective memory impairment-a randomized clinical trial. BMC Nutr. (2021) 7:75. doi: 10.1186/s40795-021-00482-8
43.
HuYMcIntoshGHLe LeuRKSomashekarRMengXQGopalsamyGet al. Supplementation with Brazil nuts and green tea extract regulates targeted biomarkers related to colorectal cancer risk in humans. Br J Nutr. (2016) 116:1901–11. doi: 10.1017/S0007114516003937
44.
Elaine HardmanWPrimeranoDALegenzaMTMorganJFanJDenvirJ. mRNA expression data in breast cancers before and after consumption of walnut by women. Data Brief. (2019) 25:104050. doi: 10.1016/j.dib.2019.104050
45.
Di RenzoLMerraGBottaRGualtieriPManzoAPerroneMAet al. Post-prandial effects of hazelnut-enriched high fat meal on LDL oxidative status, oxidative and inflammatory gene expression of healthy subjects: a randomized trial. Eur Rev Med Pharmacol Sci. (2017) 21:1610–26. PMID:
46.
Di RenzoLCioccoloniGBernardiniSAbenavoliLAielloVMarchettiMet al. A hazelnut-enriched diet modulates oxidative stress and inflammation gene expression without weight gain. Oxidative Med Cell Longev. (2019) 2019:1–11. doi: 10.1155/2019/4683723
47.
CanudasSHernández-AlonsoPGaliéSMuralidharanJMorell-AzanzaLZalbaGet al. Pistachio consumption modulates DNA oxidation and genes related to telomere maintenance: a crossover randomized clinical trial. Am J Clin Nutr. (2019) 109:1738–45. doi: 10.1093/ajcn/nqz048
48.
ShikeMDoaneASRussoLCabalRReis-FilhoJSGeraldWet al. The effects of soy supplementation on gene expression in breast cancer: a randomized placebo-controlled study. J Natl Cancer Inst. (2014) 106:dju189. doi: 10.1093/jnci/dju189
49.
WangJSiegmundKTsengCCLeeASWuAH. Soy food supplementation, dietary fat reduction and peripheral blood gene expression in postmenopausal women – a randomized, controlled trial. Mol Nutr Food Res. (2011) 55:S264–77. doi: 10.1002/mnfr.201100242
50.
ZhangZGarzottoMDavisEW2ndMoriMStollerWAFarrisPEet al. Sulforaphane bioavailability and chemopreventive activity in men presenting for biopsy of the prostate gland: a randomized controlled trial. Nutr Cancer. (2020) 72:74–87. doi: 10.1080/01635581.2019.1619783
51.
RiedlMASaxonADiaz-SanchezD. Oral sulforaphane increases phase II antioxidant enzymes in the human upper airway. Clin Immunol. (2009) 130:244–51. doi: 10.1016/j.clim.2008.10.007
52.
PeiRDiMarcoDMPuttKKMartinDAGuQChitchumroonchokchaiCet al. Low-fat yogurt consumption reduces biomarkers of chronic inflammation and inhibits markers of endotoxin exposure in healthy premenopausal women: a randomised controlled trial. Br J Nutr. (2017) 118:1043–51. doi: 10.1017/S0007114517003038
53.
SagayaFMHurrellRFVergèresG. Postprandial blood cell transcriptomics in response to the ingestion of dairy products by healthy individuals. J Nutr Biochem. (2012) 23:1701–15. doi: 10.1016/j.jnutbio.2012.01.001
54.
BurtonKJPimentelGZanggerNVionnetNDraiJMcTernanPGet al. Modulation of the peripheral blood transcriptome by the ingestion of probiotic yoghurt and acidified milk in healthy, young men. PLoS One. (2018) 13:e0192947. doi: 10.1371/journal.pone.0192947
55.
ZarratiMShidfarFNourijelyaniKMofidVHossein Zadeh-AttarMJBidadKet al. Lactobacillus acidophilus La5, Bifidobacterium BB12, and Lactobacillus casei DN001 modulate gene expression of subset specific transcription factors and cytokines in peripheral blood mononuclear cells of obese and overweight people. Biofactors. (2013) 39:633–43. doi: 10.1002/biof.1128
56.
D'AmoreSVaccaMCarielloMGrazianoGD'OrazioASalviaRet al. Genes and miRNA expression signatures in peripheral blood mononuclear cells in healthy subjects and patients with metabolic syndrome after acute intake of extra virgin olive oil. Biochim Biophys Acta. (2016) 1861:1671–80. doi: 10.1016/j.bbalip.2016.07.003
57.
Martín-PeláezSCastañerOKonstantinidouVSubiranaIMuñoz-AguayoDBlanchartGet al. Effect of olive oil phenolic compounds on the expression of blood pressure-related genes in healthy individuals. Eur J Nutr. (2017) 56:663–70. doi: 10.1007/s00394-015-1110-z
58.
CastañerOCovasMIKhymenetsONyyssonenKKonstantinidouVZunftHFet al. Protection of LDL from oxidation by olive oil polyphenols is associated with a downregulation of CD40-ligand expression and its downstream products in vivo in humans. Am J Clin Nutr. (2012) 95:1238–44. doi: 10.3945/ajcn.111.029207
59.
FarràsMVallsRMFernández-CastillejoSGiraltMSolàRSubiranaIet al. Olive oil polyphenols enhance the expression of cholesterol efflux related genes in vivo in humans. A randomized controlled trial. J Nutr Biochem. (2013) 24:1334–9. doi: 10.1016/j.jnutbio.2012.10.008
60.
KonstantinidouVKhymenetsOFitoMDe La TorreRAngladaRDopazoAet al. Characterization of human gene expression changes after olive oil ingestion: an exploratory approach. Folia Biol. (2009) 55:85–91. PMID:
61.
KhymenetsOFitóMCovasMIFarréMPujadasMAMuñozDet al. Mononuclear cell transcriptome response after sustained virgin olive oil consumption in humans: an exploratory nutrigenomics study. OMICS. (2009) 13:7–19. doi: 10.1089/omi.2008.0079
62.
CamargoARuanoJFernandezJMParnellLDJimenezASantos-GonzalezMet al. Gene expression changes in mononuclear cells in patients with metabolic syndrome after acute intake of phenol-rich virgin olive oil. BMC Genomics. (2010) 11:253. doi: 10.1186/1471-2164-11-253
63.
MilenkovicDDevalCDubrayCMazurAMorandC. Hesperidin displays relevant role in the nutrigenomic effect of orange juice on blood leukocytes in human volunteers: a randomized controlled cross-over study. PLoS One. (2011) 6:e26669. doi: 10.1371/journal.pone.0026669
64.
Rodriguez-MateosAIstasGBoschekLFelicianoRPMillsCEBobyCet al. Circulating anthocyanin metabolites mediate vascular benefits of blueberries: insights from randomized controlled trials, metabolomics, and nutrigenomics. J Gerontol A Biol Sci Med Sci. (2019) 74:967–76. doi: 10.1093/gerona/glz047
65.
KolehmainenMMykkänenOKirjavainenPVLeppänenTMoilanenEAdriaensMet al. Bilberries reduce low-grade inflammation in individuals with features of metabolic syndrome. Mol Nutr Food Res. (2012) 56:1501–10. doi: 10.1002/mnfr.201200195
66.
CharronCSDawsonHDAlbaughGPSolversonPMVinyardBTSolano-AguilarGIet al. A single meal containing raw, crushed garlic influences expression of immunity-and cancer-related genes in whole blood of humans. J Nutr. (2015) 145:2448–55. doi: 10.3945/jn.115.215392
67.
BøhnSKMyhrstadMCThoresenMHoldenMKarlsenATunheimSHet al. Blood cell gene expression associated with cellular stress defense is modulated by antioxidant-rich food in a randomised controlled clinical trial of male smokers. BMC Med. (2010) 8:54. doi: 10.1186/1741-7015-8-54
68.
PirouzpanahSAsemaniSShayanfarABaradaranBMontazeriV. The effects of Berberis vulgaris consumption on plasma levels of IGF-1, IGFBPs, PPAR-γ and the expression of angiogenic genes in women with benign breast disease: a randomized controlled clinical trial. BMC Complement Altern Med. (2019) 19:324. doi: 10.1186/s12906-019-2715-1
69.
WilliamsEJBainesKJBerthonBSWoodLG. Effects of an encapsulated fruit and vegetable juice concentrate on obesity-induced systemic inflammation: a randomised controlled trial. Nutrients. (2017) 9:116. doi: 10.3390/nu9020116
70.
van BredaSGWilmsLCGajSJennenDGBriedéJJHelsperJPet al. Can transcriptomics provide insight into the chemopreventive mechanisms of complex mixtures of phytochemicals in humans?Antioxid Redox Signal. (2014) 20:2107–13. doi: 10.1089/ars.2013.5528
71.
ChengDLiWWangLLinTPoianiGWassefAet al. Pharmacokinetics, pharmacodynamics, and PKPD modeling of curcumin in regulating antioxidant and epigenetic gene expression in healthy human volunteers. Mol Pharm. (2019) 16:1881–9. doi: 10.1021/acs.molpharmaceut.8b01246
72.
KotsopoulosJZhangSAkbariMSalmenaLLlacuachaquiMZeligsMet al. BRCA1 mRNA levels following a 4-6-week intervention with oral 3,3′-diindolylmethane. Br J Cancer. (2014) 111:1269–74. doi: 10.1038/bjc.2014.391
73.
MostJWarnkeIBoekschotenMVJockenJWEde GrootPFriedelAet al. The effects of polyphenol supplementation on adipose tissue morphology and gene expression in overweight and obese humans. Adipocytes. (2018) 7:190–6. doi: 10.1080/21623945.2018.1469942
74.
BilirBSharmaNVLeeJHammarstromBSvindlandAKucukOet al. Effects of genistein supplementation on genome-wide DNA methylation and gene expression in patients with localized prostate cancer. Int J Oncol. (2017) 51:223–34. doi: 10.3892/ijo.2017.4017
75.
NiculescuMDPopEAFischerLMZeiselSH. Dietary isoflavones differentially induce gene expression changes in lymphocytes from postmenopausal women who form equal as compared with those who do not. J Nutr Biochem. (2007) 18:380–90. doi: 10.1016/j.jnutbio.2006.06.002
76.
ZhangHGordonRLiWYangXPattanayakAFowlerGet al. Genistein treatment duration effects biomarkers of cell motility in human prostate. PLoS One. (2019) 14:e0214078. doi: 10.1371/journal.pone.0214078
77.
KhanSAChattertonRTMichelNBrykMLeeOIvancicDet al. Soy isoflavone supplementation for breast cancer risk reduction: a randomized phase II trial. Cancer Prev Res (Phila). (2012) 5:309–19. doi: 10.1158/1940-6207.CAPR-11-0251
78.
BoomgaardenIEgertSRimbachGWolfframSMüllerMJDöringF. Quercetin supplementation and its effect on human monocyte gene expression profiles in vivo. Br J Nutr. (2010) 104:336–45. doi: 10.1017/S0007114510000711
79.
KhorshidiMMoiniAAlipoorERezvanNGorgani-FiruzjaeeSYaseriMet al. The effects of quercetin supplementation on metabolic and hormonal parameters as well as plasma concentration and gene expression of resistin in overweight or obese women with polycystic ovary syndrome. Phytother Res. (2018) 32:2282–9. doi: 10.1002/ptr.6166
80.
YoshinoJConteCFontanaLMittendorferBImaiSSchechtmanKBet al. Resveratrol supplementation does not improve metabolic function in nonobese women with normal glucose tolerance. Cell Metab. (2012) 16:658–64. doi: 10.1016/j.cmet.2012.09.015
81.
TimmersSKoningsEBiletLHoutkooperRHvan de WeijerTGoossensGHet al. Calorie restriction-like effects of 30 days of resveratrol supplementation on energy metabolism and metabolic profile in obese humans. Cell Metab. (2011) 14:612–22. doi: 10.1016/j.cmet.2011.10.002
82.
SeyyedebrahimiSKhodabandehlooHNasli EsfahaniEMeshkaniR. The effects of resveratrol on markers of oxidative stress in patients with type 2 diabetes: a randomized, double-blind, placebo-controlled clinical trial. Acta Diabetol. (2018) 55:341–53. doi: 10.1007/s00592-017-1098-3
83.
WiseRAHolbrookJTCrinerGSethiSRayapudiSSudiniKRet al. Lack of effect of Oral Sulforaphane administration on Nrf2 expression in COPD: a randomized, double-blind, placebo controlled trial. PLoS One. (2016) 11:e0163716. doi: 10.1371/journal.pone.0163716
84.
MajdanMBobrowska-KorczakB. Active compounds in fruits and inflammation in the body. Nutrients. (2022) 14:2496. doi: 10.3390/nu14122496
85.
KhaliliLTMEA-EMallickAKEl EnshasyHASayyedRZ. Nuts as a part of dietary strategy to improve metabolic biomarkers: a narrative review. Front Nutr. (2022) 9:881843. doi: 10.3389/fnut.2022.881843
86.
AuneDGiovannucciEBoffettaPFadnesLTKeumNNoratTet al. Fruit and vegetable intake and the risk of cardiovascular disease, total cancer and all-cause mortality-a systematic review and dose-response meta-analysis of prospective studies. Int J Epidemiol. (2017) 46:1029–56. doi: 10.1093/ije/dyw319
87.
RudrapalMKhairnarSJKhanJDukhyilABAnsariMAAlomaryMNet al. Dietary polyphenols and their role in oxidative stress-induced human diseases: insights into protective effects, antioxidant potentials and mechanism(s) of action. Front Pharmacol. (2022) 13:806470. doi: 10.3389/fphar.2022.806470
88.
FinicelliMDi SalleAGalderisiUPelusoG. The Mediterranean diet: an update of the clinical trials. Nutrients. (2022) 14:2956. doi: 10.3390/nu14142956
89.
TanSJIsmailIS. Potency of selected berries, grapes, and Citrus fruit as neuroprotective agents. Evid Based Complement Alternat Med. (2020) 2020:1–12. doi: 10.1155/2020/3582947
90.
MullinsAPArjmandiBH. Health benefits of plant-based nutrition: focus on beans in cardiometabolic diseases. Nutrients. (2021) 13:519. doi: 10.3390/nu13020519
91.
HadjimbeiEBotsarisGChrysostomouS. Beneficial effects of yoghurts and probiotic fermented milks and their functional food potential. Foods. (2022) 11:2691. doi: 10.3390/foods11172691
92.
QiaoYZhangKZhangZZhangCSunYFengZ. Fermented soybean foods: a review of their functional components, mechanism of action and factors influencing their health benefits. Food Res Int. (2022) 158:111575. doi: 10.1016/j.foodres.2022.111575
93.
CalabreseEJKozumboWJ. The phytoprotective agent sulforaphane prevents inflammatory degenerative diseases and age-related pathologies via Nrf2-mediated hormesis. Pharmacol Res. (2021) 163:105283. doi: 10.1016/j.phrs.2020.105283
94.
MilesEACalderPC. Effects of Citrus fruit juices and their bioactive components on inflammation and immunity: a narrative review. Front Immunol. (2021) 12:712608. doi: 10.3389/fimmu.2021.712608
95.
KumarKMehraRGuinéRPFLimaMJKumarNKaushikRet al. Edible mushrooms: a comprehensive review on bioactive compounds with health benefits and processing aspects. Foods. (2021) 10:2996. doi: 10.3390/foods10122996
96.
MarinoABattagliniMMolesNCiofaniG. Natural antioxidant compounds as potential pharmaceutical tools against neurodegenerative diseases. ACS Omega. (2022) 7:25974–90. doi: 10.1021/acsomega.2c03291
97.
SurampudiPEnkhmaaBAnuuradEBerglundL. Lipid lowering with soluble dietary Fiber. Curr Atheroscler Rep. (2016) 18:75. doi: 10.1007/s11883-016-0624-z
98.
RobertsJLMoreauR. Functional properties of spinach (Spinacia oleracea L.) phytochemicals and bioactives. Food Funct. (2016) 7:3337–53. doi: 10.1039/C6FO00051G
Summary
Keywords
healthy dietary agents, dietary guide, dietary rational gene targeting, bioinformatics, gene expression, risk genes, app, healthcare
Citation
Ford ML, Cooley JM, Sripada V, Xu Z, Erickson JS, Bennett KP and Crawford DR (2023) Eat4Genes: a bioinformatic rational gene targeting app and prototype model for improving human health. Front. Nutr. 10:1196520. doi: 10.3389/fnut.2023.1196520
Received
29 March 2023
Accepted
04 May 2023
Published
26 May 2023
Volume
10 - 2023
Edited by
George Lagoumintzis, University of Patras, Greece
Reviewed by
Egeria Scoditti, Institute of Clinical Physiology (CNR), Italy; Alberto Davalos, Madrid Institute for Advanced Studies (IMDEA), Spain
Updates
Copyright
© 2023 Ford, Cooley, Sripada, Xu, Erickson, Bennett and Crawford.
This is an open-access article distributed under the terms of the Creative Commons Attribution License (CC BY). The use, distribution or reproduction in other forums is permitted, provided the original author(s) and the copyright owner(s) are credited and that the original publication in this journal is cited, in accordance with accepted academic practice. No use, distribution or reproduction is permitted which does not comply with these terms.
*Correspondence: Dana R. Crawford, crawfod@amc.edu
Disclaimer
All claims expressed in this article are solely those of the authors and do not necessarily represent those of their affiliated organizations, or those of the publisher, the editors and the reviewers. Any product that may be evaluated in this article or claim that may be made by its manufacturer is not guaranteed or endorsed by the publisher.