Abstract
Objective:
This study aims to evaluate the origin of the neonatal gut microbiota on the 14th day and probiotic intervention in the third trimester.
Methods:
Samples were obtained from a total of 30 pregnant individuals and their offspring, divided into a control group with no intervention and a probiotic group with live combined Bifidobacterium and Lactobacillus tablets, analyzing by 16S rRNA amplicon sequencing of the V4 region to evaluate the composition of them. Non-metric multidimensional scaling and SourceTracker were used to evaluate the origin of neonatal gut microbiota.
Results:
We found that the microbiota in the neonatal gut at different times correlated with that in the maternal microbiota. The placenta had more influence on meconium microbiota. Maternal gut had more influence on neonatal gut microbiota on the 3rd day and 14th day. We also found that the maternal gut, vaginal, and placenta microbiota at full term in the probiotic group did not have a significantly different abundance of Bifidobacterium, Lactobacillus, or Streptococcus. However, some other bacteria changed in the maternal gut and their neonatal gut in the probiotic group.
Introduction
There are billions of microbial cells in the human body, which are vital to human health (1, 2). These bacteria are found at the highest density in the intestinal tract and are called the gut microbiota (1). The gut microbiota tends to be stable from the neonatal period to adulthood (1, 3). The neonatal gut microbiota is complicated and influenced by the placenta, umbilical cord, and amniotic fluid, so the foundation of the neonatal gut microbiota may begin from the neonate during the gestational period (4, 5). The gut microbiota of pregnant women may induce premature delivery (6). The gut microbiota of neonates can lead to allergic asthma in childhood by influencing the function of immune cells (7). This relationship was also found in children with infantile intestinal disease or other diseases (7, 8).
Recent research has shown that enterococcus species that are orally administered to pregnant mice can be detected via genetic markers in the meconium of offspring delivered by cesarean section (4). Another study first described the molecular mechanism through which the maternal gut microbiome can regulate nervous system development in mice (9). These findings showed the possibility of manual intervention of offspring’s gut microbiota. Bifidobacterium species are vital to human health and are used in combination with probiotics (10). Some research has shown that Bifidobacterium can be vertically transmitted from mother to infant (11). A published RCT showed that oral probiotics administered during the gestational period can reduce the incidence of neonatal allergic disease, although the underlying mechanism is still unclear (12). Therefore, determining the origin of the neonatal gut microbiota and evaluating the potential application of probiotic intervention are necessary.
Materials and methods
Study design and participants
A total of 31 pregnant women receiving antenatal care at the 1st Affiliated Hospital of Jinan University were recruited in this study and randomly assigned to the probiotic group (n = 15) and the control group (n = 16) (NCT06241222). Informed consent was obtained from pregnant women (at least 32 gestational weeks) who met the inclusion criteria. Newborns were followed until 14 days after natural delivery, and all newborns in our study were breastfed. During follow-up, one pregnant woman in the probiotic group was excluded due to loss of follow-up. Pregnant inclusive criteria were as follows: 1. Chinese woman who is pregnant with a single fetus; and 2. First pregnancy and term delivery. Newborns’ inclusive criteria were as follows: 1. Normal weight (>2,500 g, <4,000 g); 2. Term infant (>37 weeks, <42 weeks); and 3. Natural birth. Pregnant exclusive criteria were as follows: 1. Gastrointestinal disease or family history; 2. Vaginitis before pregnancy; 3. Antibiotic usage during pregnancy; 4. Hypertension, diabetes mellitus, hyperthyroidism, hypothyroidism, autoimmune disease, or other endocrine and metabolic disease; 5. Gestational hypertensive disease, gestational diabetes mellitus, or other gestational disease; 6. Transfusion history, organ transplantation history or immunotherapy history; and 7. Other probiotics or prebiotics usage during pregnancy. Newborn’s exclusive criteria were as follows: 1. Abnormal weight (>4,000 g, <2,500 g); 2. With congenital diseases; and 3. Intrapartum fetal complication.
Probiotic management
In our study, 14 pregnant women were randomly assigned to the probiotic group, and the rest were assigned to the control group. After enrollment, pregnant women in the probiotic group received a combination of living Bifidobacterium longum (1 ∗ 108 CFU, no less than 5 ∗ 106 CFU), Lactobacillus delbrueckii bulgaricus (1 ∗ 107 CFU, no less than 5 ∗ 105 CFU), and Streptococcus thermophilus (1 ∗ 107 CFU, no less than 5 ∗ 105 CFU) tablets produced by Inner Mongolia Shuangqi Pharmaceutical Co., Ltd. PRC. Pregnant individuals in the probiotic group were administered two tablets twice a day (2 g/d) until natural delivery, and those in the control group took no pills.
Fecal, vaginal secretion, placental, and meconium collection
Fecal collection
Feces from pregnant patients were collected twice—between weeks 32 and 34 and before natural labor. Feces collected at weeks 32–34 were collected internally, thereby avoiding contamination with foreign material. The feces were stored in a domestic refrigerator and transferred to the laboratory freezer at −80°C for 24 h. Feces collected before labor were obtained in the hospital and transferred to the laboratory freezer within 30 min of collection (13, 14).
Vaginal secretion collection
Vaginal secretions were collected twice between weeks 32 and 34 and before natural labor. The pregnant woman was asked to not engage in sexual behavior, clean the vulva, clean the vagina, or use vaginal medicine within 48 h before sample collection. Vaginal secretions before natural labor were collected before membrane rupture occurred. The samples were transferred to the laboratory freezer within 30 min of collection, thereby avoiding contamination by foreign material.
Placenta collection
Placenta samples ranging from the umbilical cord to 3 cm were collected by stripping the amniotic membrane after a natural birth. The blood was rinsed with sterile saline. Four to six pieces of placenta were sampled from the fetal surface. Each piece had a volume of approximately 1 cm3. The placenta sample was transferred to the laboratory freezer within 30 min of collection.
Meconium collection
Meconium was collected three times on the 1st day, 3rd day, and 14th day after a natural delivery. On the 1st day and 3rd day, meconium was collected internally, thereby avoiding contamination with foreign material in the hospital, and was transferred to the laboratory freezer within 30 min of collection. On the 14th day, meconium was collected, stored in a domestic refrigerator, and then transferred to a laboratory freezer within 24 h of collection.
Experimental procedures
DNA extraction and sample quality control
For the soil, feces, and intestinal content samples, DNA was extracted by using a Magnetic Soil and Stool DNA Kit (TianGen, China, Catalog #: DP712). For other types of samples, DNA was extracted by using the CTAB extraction method. Please refer to the QC Report for the sample quality control methods.
Amplicon generation
16S rRNA/18SrRNA/ITS genes of distinct regions (16SV4/16SV3/16SV3- V4/16SV4- V5, 18SV4/18SV9, ITS1/ITS2, and ArcV4) were amplified using a specific primer (e.g., 16SV4: 515F- 806R, 18SV4: 528F-706R, and 18SV9: 1380F- 1510R) with a barcode. All PCRs were conducted with 15 μL of Phusion® High-Fidelity PCR Master Mix (New England Biolabs), 0.2 μM forward and reverse primers, and approximately 10 ng of template DNA. Thermal cycling consisted of initial denaturation at 98°C for 1 min, followed by 30 cycles of denaturation at 98°C for 10 s, annealing at 50°C for 30 s, elongation at 72°C for 30 s, and extension at 72°C for 5 min.
PCR product quantification and qualification
The same volume of 1X loading buffer (containing SYB green) was mixed with the PCR products, and electrophoresis was performed on a 2% agarose gel for detection. The PCR products were mixed in ratios with equal densities. The mixture of PCR products was subsequently purified with a Universal DNA Purification Kit (TianGen, China, Catalog #: DP214).
Library preparation and sequencing
Sequencing libraries were generated using the NEBNext® Ultra™ II FS DNA PCR-free Library Prep Kit (New England Biolabs, USA, Catalog#: E7430L) according to the manufacturer’s recommendations, and indexes were added. The library was checked with a Qubit fluorometer and real-time PCR for quantification, and a bioanalyzer was used to assess the size distribution. The quantified libraries were pooled and sequenced on an Illumina platform based on the effective library concentration and data amount.
Data analysis
Data analysis is performed using the single-end reads assembly and quality control.
Data split
Single-end reads were assigned to samples based on their unique barcode and truncated by cutting off the barcode and primer sequence.
Data filtration
Quality filtering on the raw reads was performed under specific filtering conditions to obtain the high-quality clean reads according to the Cutadapt (Martin M., 2011) (V1.9.11), quality-controlled process.
Chimera removal
The reads were compared with the reference database (Gold database2) using the UCHIME algorithm (UCHIME Algorithm3) to detect chimera sequences, and then the chimera sequences were removed. Then, the effective tags were finally obtained.
Operational taxonomic units (OTUs) cluster and species annotation
OTU production
Sequence analysis was performed by Uparse software (Uparse v7.0.10014). Sequences with ≥97% similarity were assigned to the same OTUs. The representative sequence for each OTU was screened for further annotation.
Species annotation
For each representative sequence, the Silva Database5 was used based on the RDP classifier (Version 2.26) algorithm to annotate taxonomic information.
Phylogenetic relationship construction
To study the phylogenetic relationship of different OTUs and the difference of the dominant species in different samples (groups), multiple sequence alignments were conducted using the MUSCLE software (Version 3.8.317).
Data normalization
OTUs abundance information was normalized using a standard sequence number corresponding to the sample with the least sequences. Subsequent analyses of alpha diversity and beta diversity were all performed based on this output normalized data.
Alpha diversity
Alpha diversity is applied in analyzing the complexity of species diversity for a sample through Shannon, calculated with QIIME (Version 1.7.0) and displayed with R software (Version 2.15.3) to identify community richness. Shannon—the Shannon index.8
Beta-diversity
To evaluate the complexity of the community composition and compare the differences between samples (groups), beta diversity was calculated based on weighted and unweighted unifrac distances in QIIME. Non-metric multidimensional scaling (NMDS) was also implemented for data dimension reduction. NMDS uses the distance matrix, but it emphasizes the numerical rank instead. NMDS analysis was implemented through R software with the ade4 package and ggplot2 package.
Source tracker
To estimate the proportion of a microbiota community that comes from a set of source environments, SourceTracker (v1.0), a Bayesian approach, was used. Neonatal gut microbiota was designed as sink, and their maternal gut, vaginal, and placenta microbiota were designed as sources (15).
Co-occurrence network analysis
Spearman’s rank correlation coefficient was calculated using the R package of “ccrepe” between genera based on the relative abundance profile of genera. Networks were then constructed by using the method implemented in Cytoscape (v3.6) (16).
Statistical analysis
The significant difference between the sample communities was determined through linear discriminant analysis of effect size (LEfSe). A p < 0.05 was considered statistically significant. Spearman’s rank correlation between maternal microbiota and neonatal microbiota was analyzed using the stats package and ggplot2 package in R software with a significance level of p < 0.05.
Results
The origin of the neonatal gut microbiota
Non-metric multidimensional scaling (NMDS) was used to analyze the diversity of microbiota in each group. Neonatal gut microbiota was more similar to the placenta and maternal gut microbiota (Figure 1).
Figure 1
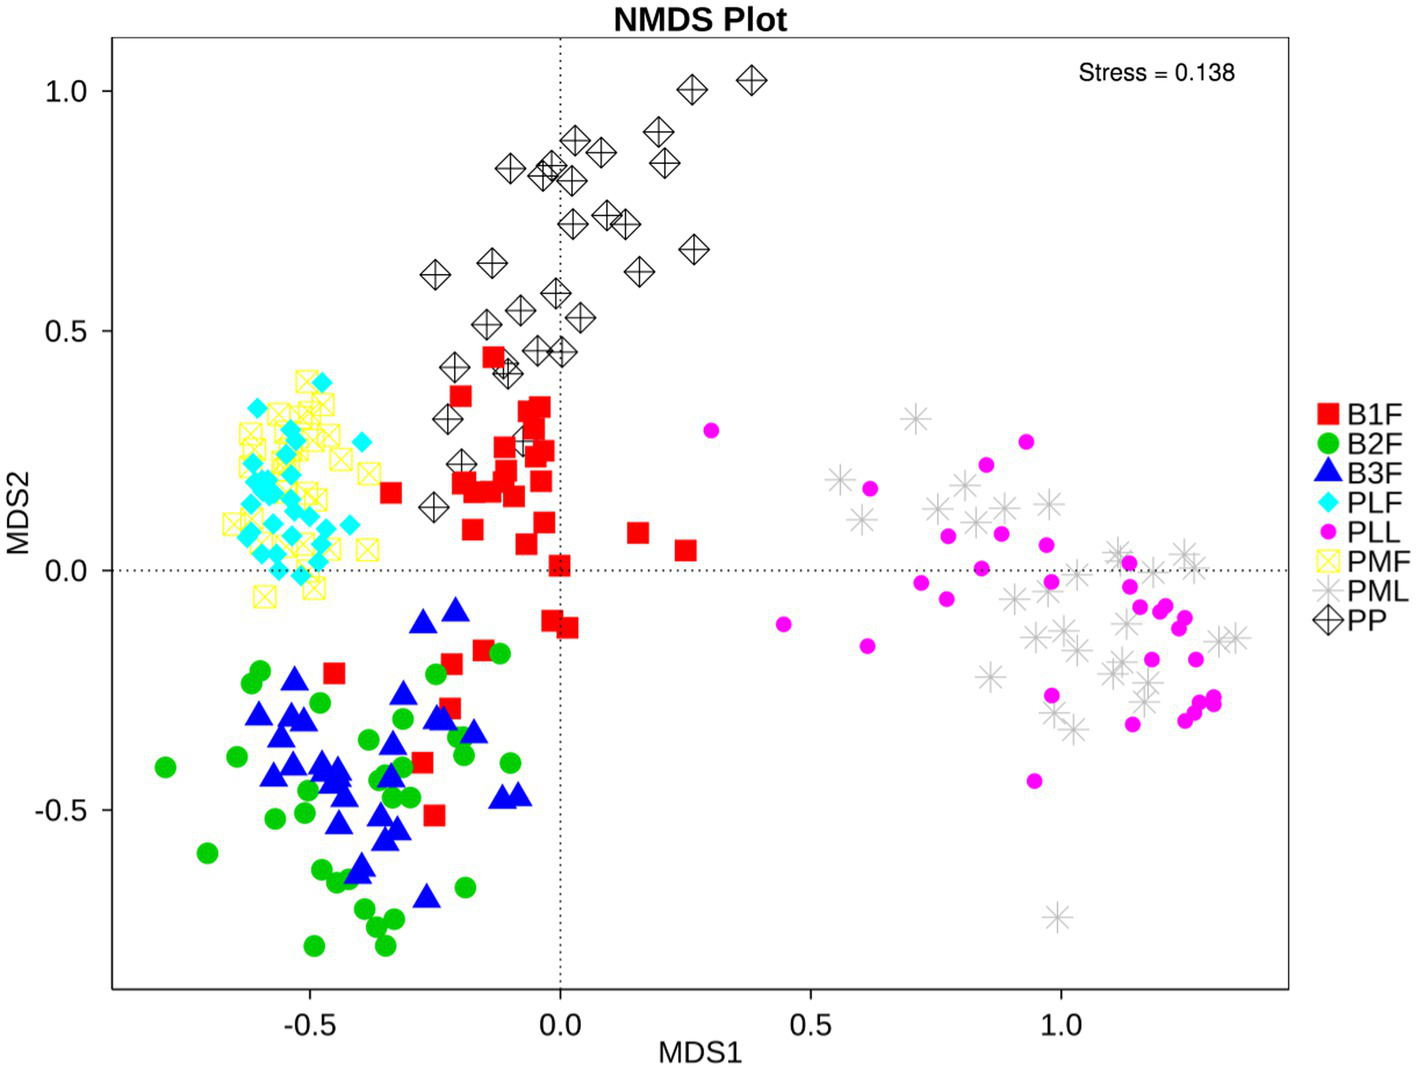
NMDS plot of each sample. PMF, gut microbiota at gestational 32–34 weeks women; PML, vaginal microbiota at gestational 32–34 weeks women; PLF, gut microbiota of gestational full-term women; PLL, vaginal microbiota of gestational full-term women; PP, placenta microbiota; B1F, meconium microbiota; B2F, the gut microbiota of newborns on the 3rd day; B3F, the gut microbiota of newborns on the 14th day. The distance of each point presented the degrees of difference of each sample’s microbiota.
Neonatal gut microbiota proportions were estimated using SourceTracker and samples from the maternal gut, vagina, and placenta. In general, meconium microbiota communities were composed mainly of bacteria from the placenta and an unknown source (Figure 2A). As to neonatal gut microbiota on the 3rd day, it tended to be composed mainly of bacteria from maternal gut microbiota (including 32–34 weeks and full term) and an unknown source (Figure 2B). On the 14th day, neonatal gut microbiota were composed mainly of bacteria from maternal gut microbiota (especially in 32–34 weeks) and an unknown source (Figure 2C).
Figure 2
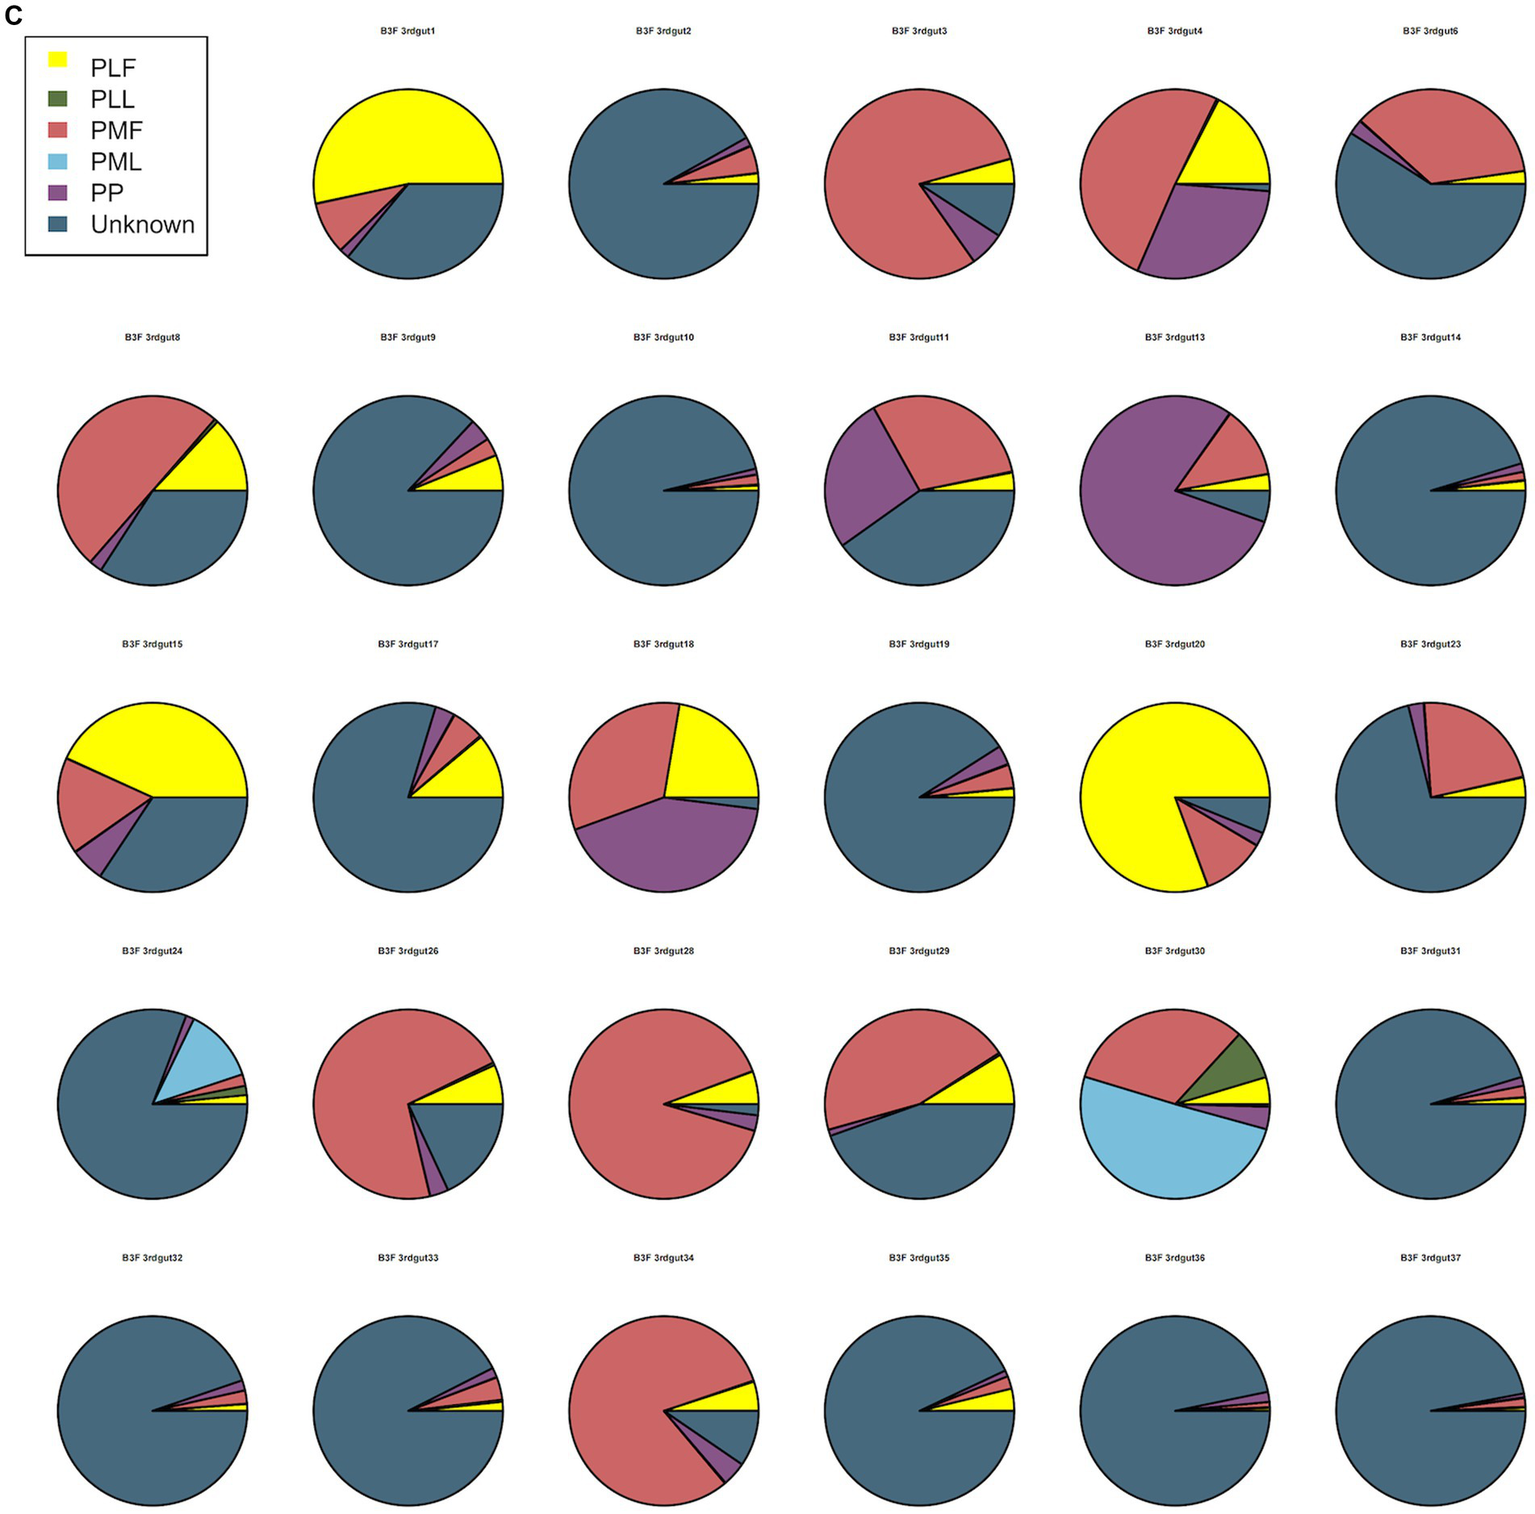
(A) SourceTracker of gut microbiota in B1F. (B) SourceTracker of gut microbiota in B2F. (C) SourceTracker of gut microbiota in B3F. PMF, gut microbiota at gestational 32–34 weeks women; PML, vaginal microbiota at gestational 32–34 weeks women; PLF, gut microbiota of gestational full-term women; PLL, vaginal microbiota of gestational full-term women; PP, placenta microbiota; B1F, meconium microbiota; B2F, the gut microbiota of newborns on the 3rd day; B3F, the gut microbiota of newborns on the 14th day.
The relationship between bacteria from pregnant women and their offspring
Spearman correlation heatmap was used to show the microbiota correlation between pregnant women and their offspring in phylum (Top 10) and genus level (Top 30) (Figure 3).
Figure 3
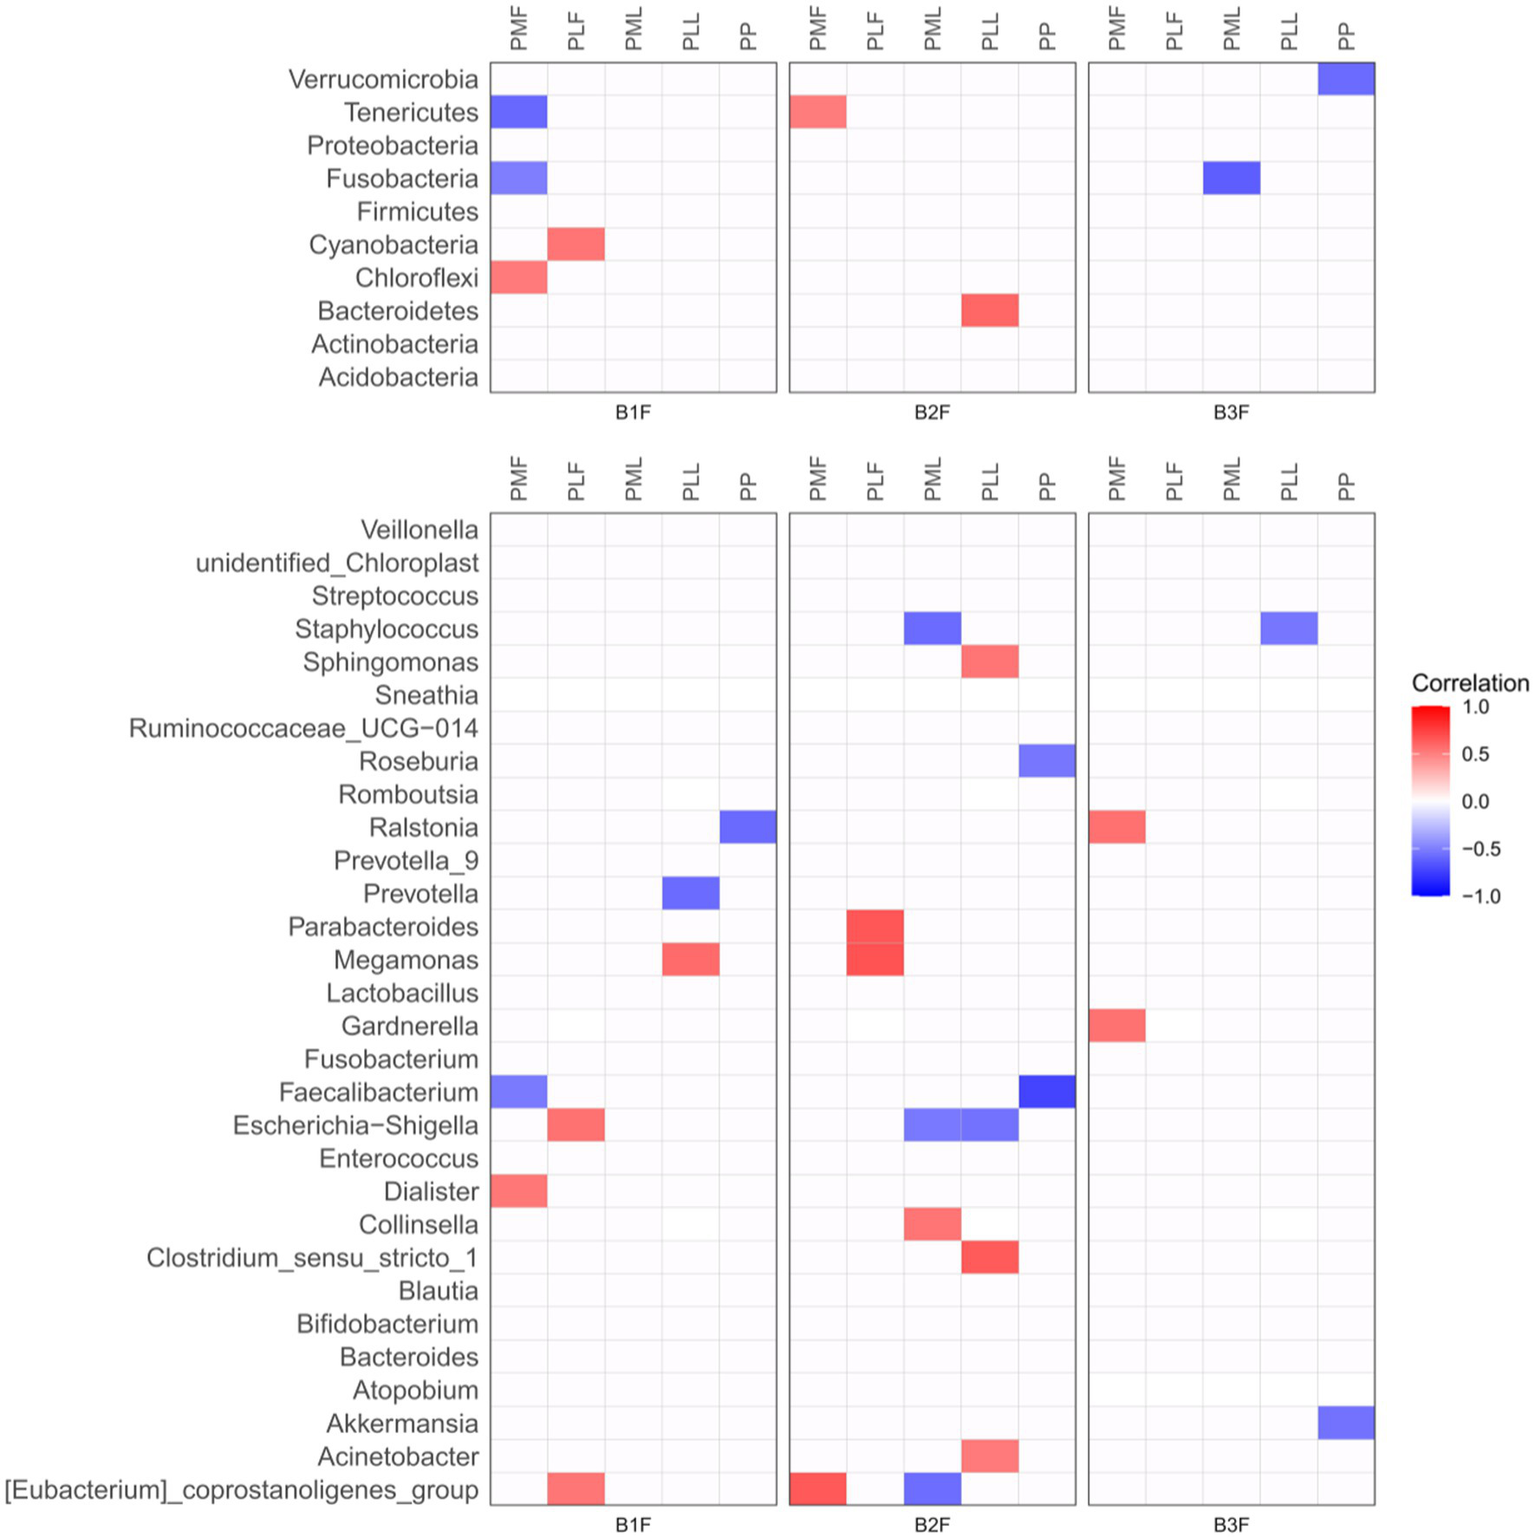
Spearman correlation heatmap of microbiota in pregnancies and their offspring. PMF, gut microbiota at gestational 32–34 weeks women; PML, vaginal microbiota at gestational 32–34 weeks women; PLF, gut microbiota of gestational full-term women; PLL, vaginal microbiota of gestational full-term women; PP, placenta microbiota; B1F, meconium microbiota; B2F, the gut microbiota of newborns on the 3rd day; B3F, the gut microbiota of newborns on the 14th day. Red color represented a positive correlation and blue color represented a negative correlation.
At the phylum level, Chloroflexi in meconium microbiota (B1F) had a positive correlation and Fusobacteria and Tenerivutes in B1F had a negative correlation with those in gut microbiota at gestational 32–34 weeks women (PMF). Cyanobacteria in B1F had a positive correlation with those in the gut microbiota of gestational full-term women (PLF). Tenericutes in the gut microbiota of newborns on the 3rd day (B2F) had a positive correlation with those in PMF. Bacteroidetes in B2F had a positive correlation with those in the vaginal microbiota of gestational full-term women (PLL). Fusobacteria in the gut microbiota of newborns on the 14th day (B3F) had a negative correlation with those in vaginal microbiota at gestational 32–34 weeks women (PML). Verrucomicrobia in B3F had a negative correlation with those in placenta microbiota (PP).
At the genus level, Dialister in B1F had a positive correlation and Faecalibacterium in B1F had a negative correlation with those in PMF. Escherichia-Shigella and [Eubacterium]_coprostanoligenes_group in B1F had a positive correlation with those in PLF. Meganonas in B1F had a positive correlation and Prevotella in B1F had a negative correlation with those in PLL. Ralstonia in B1F had a negative correlation with those in PP. [Eubacterium]_coprostanoligenes_group in B2F had a positive correlation with those in PMF. Parabacteroides and Megamonas in B2F had a positive correlation with those in PLF. Collinsella in B2F had a positive correlation, Staphylococcus, Escherichia-Shigella, and [Eubacterium]_coprostanoligenes_group in B2F had a negative correlation with those in PML. Sphingomonas, Clostridium_sensu_stricto_1, and Acinetobacter in B2F had a positive correlation and Escherichia-Shigella in B2F had a negative correlation with those in PLL. Roseburia and Faecalibacterium in B2F had a negative correlation with those in PP. Ralstonia and Gardnerella in B3F had a positive correlation with those in PMF. Staphylococcus in B3F had a negative correlation with those in PLL. Akkermansia in B3F had a negative correlation with those in PP.
Network diagram of the correlation of differential microbiota
We constructed the co-occurrence network of the core genera in maternal microbiota and neonatal microbiota. From this diagram, we see that bacteria have a complicated correlation with other bacteria in the maternal gut, vagina, placenta, and neonatal gut in different stages. The correlation of bacteria in the placenta and meconium was the most complicated. In 32–34 weeks and full term, Bifidobacterium, Lactobacillus, and Streptococcus had complicated relationships with other bacteria. Neonatal gut microbiota’s correlation became uncomplicated gradually from 0 days to 14 days (Figures 4A–D).
Figure 4
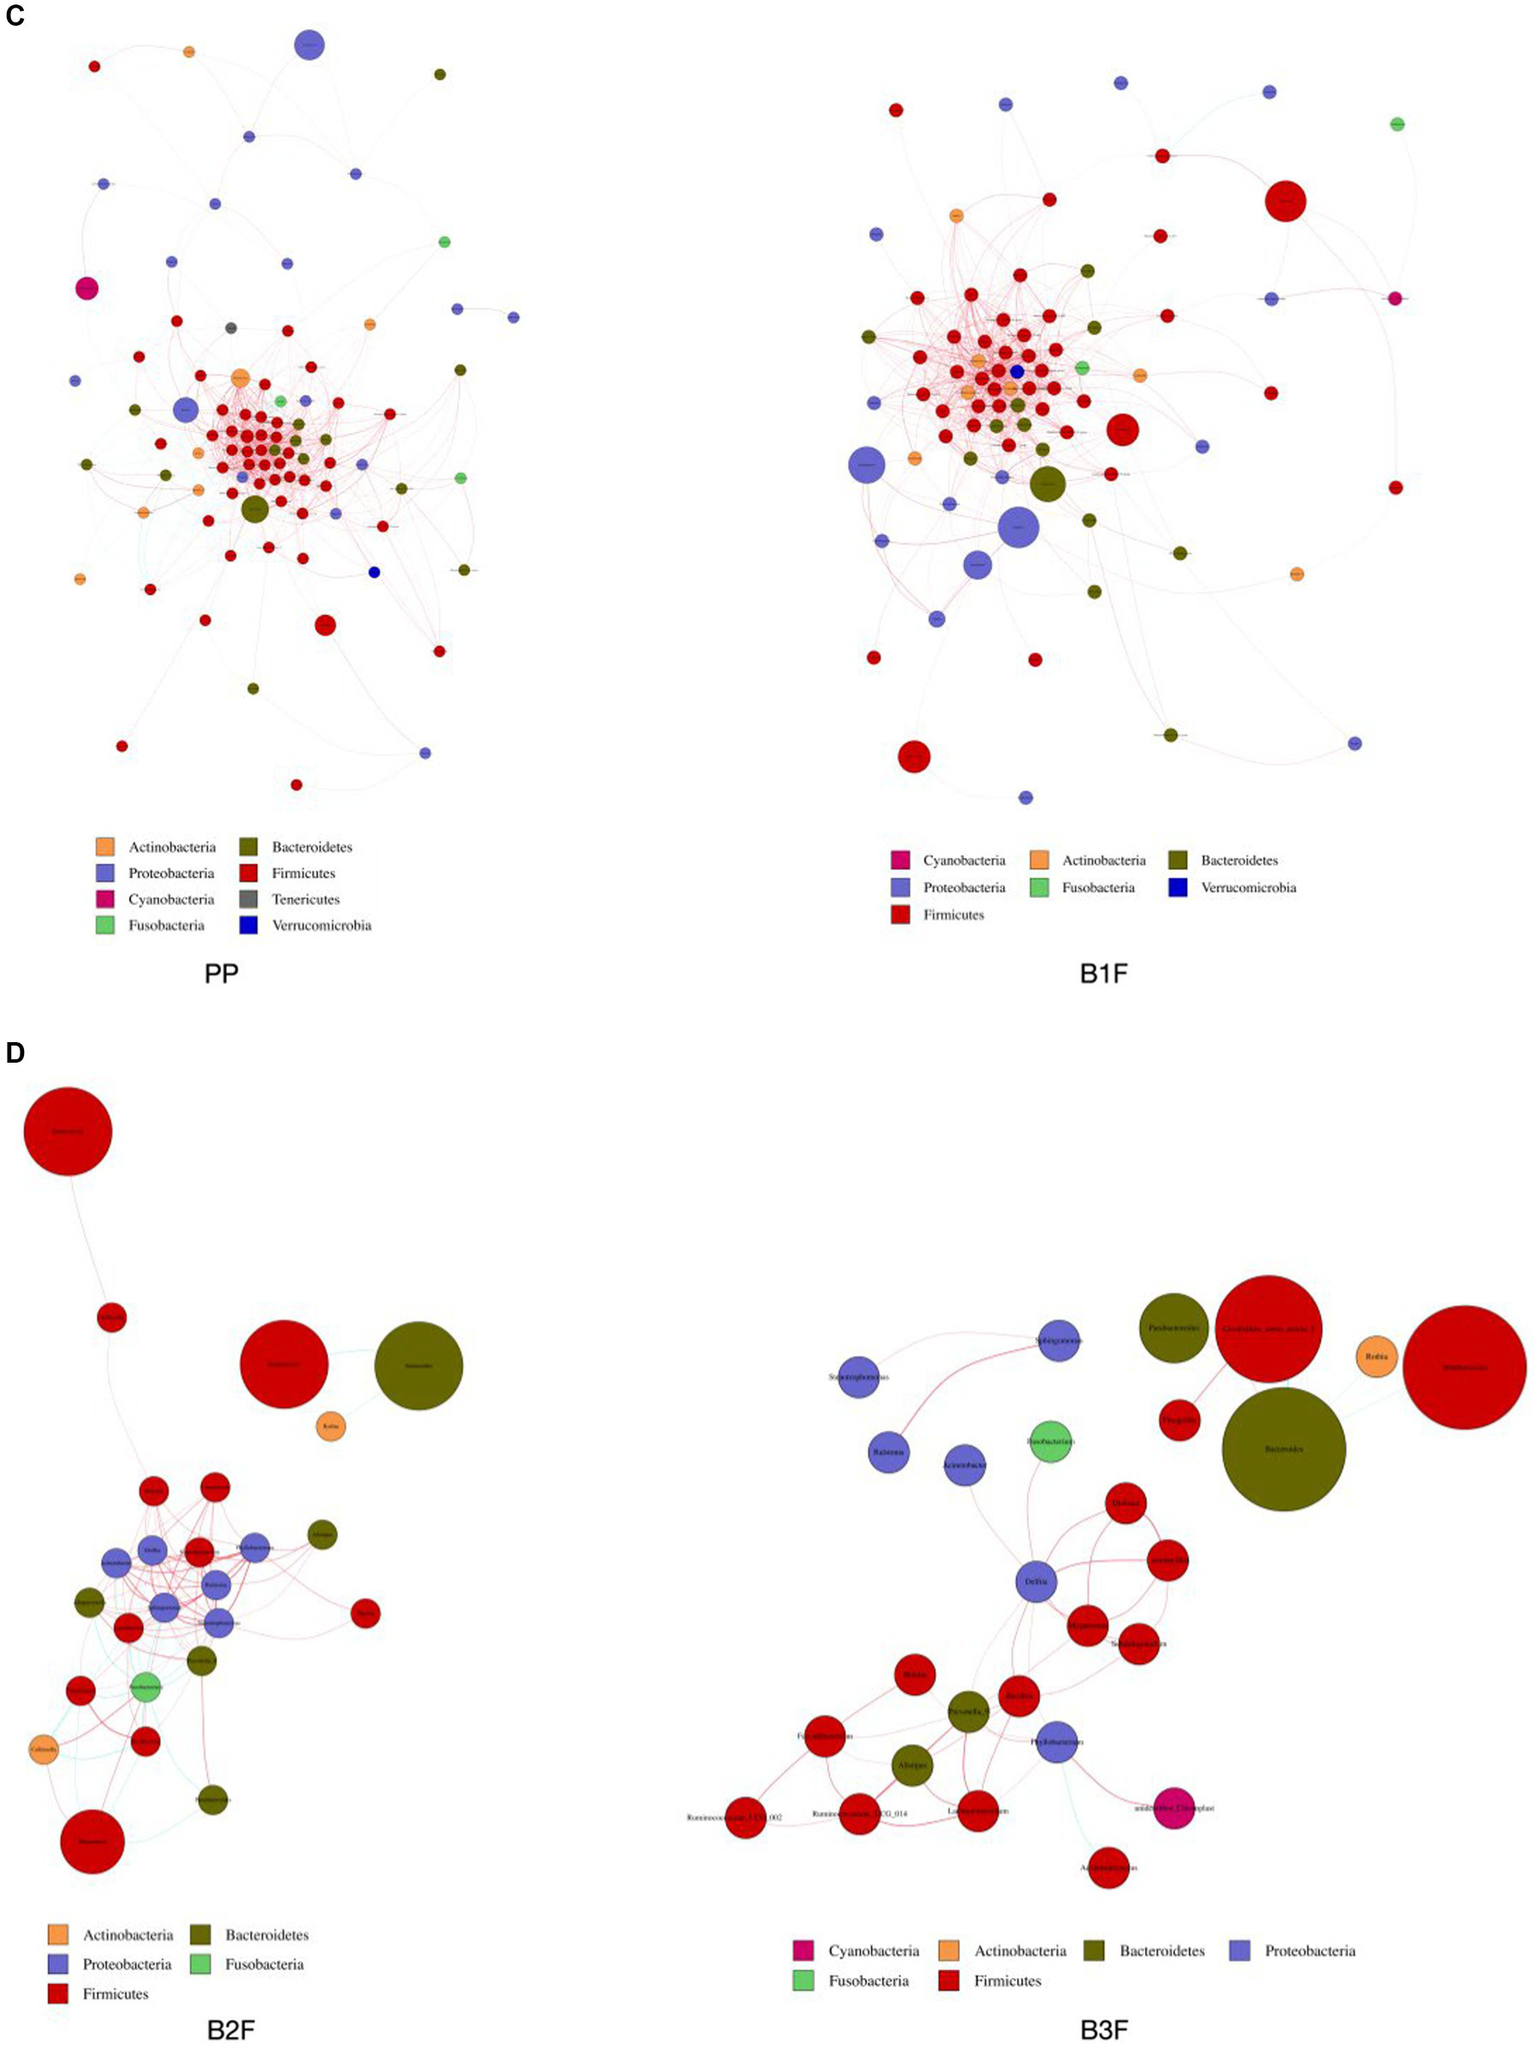
(A) Co-occurrence network of maternal gut microbiota. (B) Co-occurrence network of maternal vaginal microbiota. (C) Co-occurrence network of placenta microbiota and meconium microbiota. (D) Co-occurrence network of neonatal gut microbiota on the 3rd day and 14th day. PMF, gut microbiota at gestational 32–34 weeks women; PML, vaginal microbiota at gestational 32–34 weeks women; PLF, gut microbiota of gestational full-term women; PLL, vaginal microbiota of gestational full-term women; PP, placenta microbiota; B1F, meconium microbiota; B2F, the gut microbiota of newborns on the 3rd day; B3F, the gut microbiota of newborns on the 14th day. Co-occurrence network analysis was based on core genus (average relative abundance > 0.005%). Each node represents each species, node color represents phylum, and node size represents relative OTUs they had. The connecting line represents the existence of a significant correlation between two nodes, Spearman correlation coefficient value below 0 (negative correlation) indicates the green line, Spearman correlation coefficient value greater than 0 (positive correlation) indicates the red line. The thicker the line, the greater the Spearman correlation coefficient between the two nodes.
Microbiota difference between the control group and the probiotic group
Clinical characteristics are recorded in Table 1.
Table 1
| Control group (Mean ± SD) | Probiotic group (Mean ± SD) | P-value | |
|---|---|---|---|
| Maternal age | 27.73 ± 4.50 | 27.20 ± 3.91 | 0.885 |
| Maternal weight (kg) | 65.54 ± 9.03 | 65.34 ± 9.28 | 0.561 |
| Maternal height (cm) | 162.53 ± 8.31 | 158.55 ± 3.82 | 0.060 |
| Maternal BMI (kg/m2) | 24.75 ± 2.29 | 25.94 ± 3.18 | 0.092 |
| Neonatal weight (kg) | 3.45 ± 0.71 | 3.34 ± 0.53 | 0.839 |
| Neonatal height (cm) | 49.73 ± 0.67 | 50.10 ± 1.66 | 0.938 |
| Neonatal head circumference (cm) | 35.60 ± 7.39 | 33.90 ± 0.99 | 0.179 |
Clinical characteristics of pregnancies in different groups.
*p < 0.05.
Alpha diversity difference
The Shannon index was used to evaluate the species diversity index of microbiota. After probiotic treatment, the alpha diversity of meconium microbiota in the probiotic group was significantly lower than those of meconium microbiota in the control group (p < 0.05) (Figure 5).
Figure 5
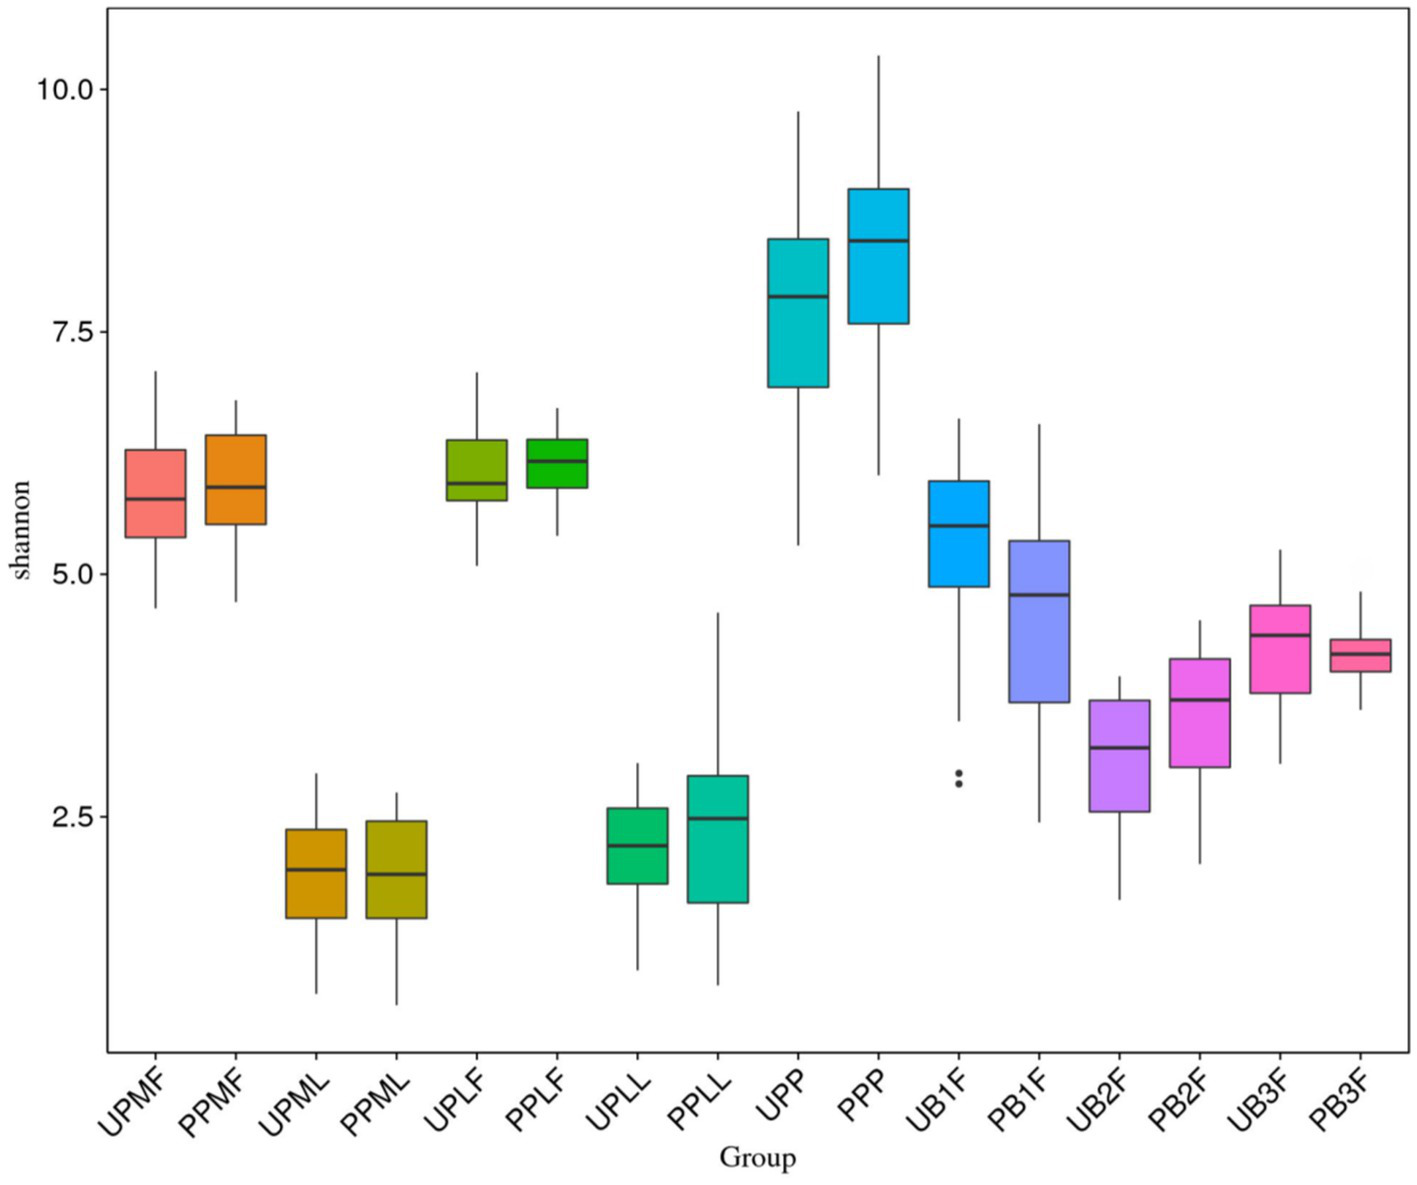
Comparison of alpha diversity (as assessed by the Shannon index) of each group. UPMF, gut microbiota at gestational 32–34 weeks women in control group; PPMF, gut microbiota at gestational 32–34 weeks women in probiotic group; UPML, vaginal microbiota at gestational 32–34 weeks in control group; PPML, vaginal microbiota at gestational 32–34 weeks in probiotic group; UPLF, gut microbiota of gestational full-term women in control group; PPLF, gut microbiota of gestational full-term women in probiotic group; UPLL, vaginal microbiota of gestational full-term women in control group; PPLL, vaginal microbiota of gestational full-term women in probiotic group; UB1F, meconium microbiota in control group; PB1F, meconium microbiota in probiotic group; UB2F, the gut microbiota of newborns on the 3rd day in control group; PB2F, the gut microbiota of newborns on the 3rd day in probiotic group; UB3F, the gut microbiota of newborns on the 14th day in control group; PB3F, the gut microbiota of newborns on the 14th day in probiotic group; UPP, placenta microbiota in control group; PPP, placenta microbiota in probiotic group.
At the phylum level, Firmicutes (54.7%), Bacteroidetes (25.1%), and Actinobacteria (13.6%) were the three most common components of the pregnant gut microbiota at 32–34 weeks in the control group (gut microbiota at gestational 32–34 weeks women in the control group (UPMF)). Firmicutes (49.3%), Bacteroidetes (28.3%), and Proteobacteria (11.7%) were the three most common components of the gut microbiota at 32–34 weeks in the probiotic group before probiotics were administered (gut microbiota at gestational 32–34 weeks women in the probiotic group (PPMF)). The difference between the two groups was not significant (p > 0.05). Firmicutes, Bacteroidetes, and Actinobacteria were the three most abundant components of the pregnant gut microbiota in both the control group (gut microbiota of gestational full-term women in the control group (UPLF)) and the probiotic group after receiving the probiotic (gut microbiota of gestational full-term women in the probiotic group (PPLF)) at full term. The difference between the two groups was not significant (p > 0.05) (Table 2; Figure 6A).
Table 2
| Firmicutes | Bacteroidetes | Actinobacteria | Proteobacteria | |
|---|---|---|---|---|
| UPMF | 54.7 | 25.1 | 13.6 | |
| PPMF | 49.3 | 28.3 | 11.7 | |
| UPLF | 58.0 | 23.4 | 12.2 | |
| PPLF | 61.0 | 18.4 | 12.2 | |
| UPML | 94.2 | 0.4 | 4.9 | |
| PPML | 90.4 | 0.1 | 9.3 | |
| UPLL | 82.5 | 4.0 | 8.2 | |
| PPLL | 84.2 | 1.4 | 12.7 |
Relative OTUs of the gut and vaginal microbiotas at the phylum level (%).
UPMF, gut microbiota at gestational 32–34 weeks women in control group; PPMF, gut microbiota at gestational 32–34 weeks women in probiotic group; UPLF, gut microbiota of gestational full-term women in control group; PPLF, gut microbiota of gestational full-term women in probiotic group; UPML, vaginal microbiota at gestational 32–34 weeks in control group; PPML, vaginal microbiota at gestational 32–34 weeks in probiotic group; UPLL, vaginal microbiota of gestational full-term women in control group; PPLL, vaginal microbiota of gestational full-term women in probiotic group.
Figure 6
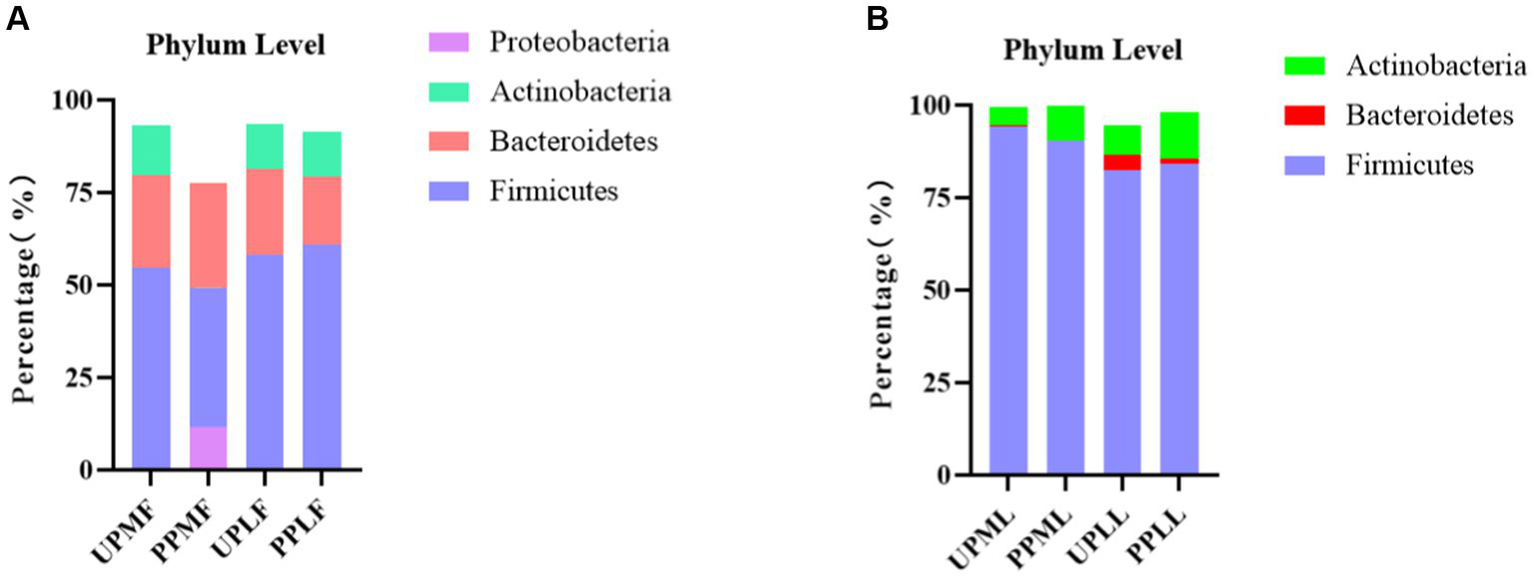
(A,B) Relative OTUs of the gut and vaginal microbiotas at the phylum level.
At the phylum level, Firmicutes (94.2%), Actinobacteria (4.9%), and Bacteroidetes (0.4%) were the three most abundant groups in the vaginal microbiota at 32–34 weeks in both the control group (vaginal microbiota at gestational 32–34 weeks in the control group (UPML)) and the probiotic group before probiotic taken (vaginal microbiota at gestational 32–34 weeks in the probiotic group (PPML)). Firmicutes (82.5%), Actinobacteria (8.2%), and Bacteroidetes (4.0%) were the three most abundant components of the vaginal microbiota in the control group (vaginal microbiota of gestational full-term women in the control group (UPLL)) at full term. Firmicutes (84.2%), Actinobacteria (12.7%), and Teneria (1.4%) were the three most abundant components of the vaginal microbiota in the probiotic group after probiotics were administered (vaginal microbiota of gestational full-term women in the probiotic group (PPLL)) at full term. The difference between the two groups was not significant (p > 0.05) (Table 2; Figure 6B).
Variation in the gut and vaginal microbiota at the genus level in probiotic-treated pregnant patients
At the genus level, Bacteroides (15.6%), Faecalibacterium (12.7%), and Bifidobacterium (11.1%) were the three most abundant components of the gut microbiota in pregnant patients at 32–34 weeks in the control group (UPMF). Bacteroides (17.7%), Escherichia (8.2%), and Faecalibacterium (7.7%) were the three most abundant components of the gut microbiota in pregnant patients at 32–34 weeks in the probiotic group before probiotics were administered (PPMF). The difference between the two groups was not significant (p > 0.05). Bacteroides (14.9%), Faecalibacterium (13.8%), and Bifidobacterium (10.0%) were the three most common components of the gut microbiota at full term in the control group (UPLF). Among the pregnant patients, Bacteroides (13.0%), Blautia (12.3%), and Bifidobacterium (10.4%) were the three most common components of the gut microbiota at full term in the probiotic group after receiving probiotics (PPLF) (Table 3; Figure 7A).
Table 3
| Bacteroides | Faecalibacterium | Bifidobacterium | Blautia | Lactobacillus | Gardenalia | Atopobium | |
|---|---|---|---|---|---|---|---|
| UPMF | 15.6 | 12.7 | 11.1 | 5.2 | |||
| PPMF | 17.7 | 7.7 | 6.3 | ||||
| UPLF | 14.9 | 13.8 | 10.0 | 5.9 | |||
| PPLF | 13.0 | 9.5 | 10.4 | 12.3 | |||
| UPML | 93.0 | 4.6 | 0.2 | ||||
| PPML | 90.1 | 8.8 | 0.5 | ||||
| UPLL | 79.5 | 7.4 | |||||
| PPLL | 82.7 | 11.0 | 1.4 |
Relative OTUs of the gut and vaginal microbiota at the genus level (%).
Figure 7
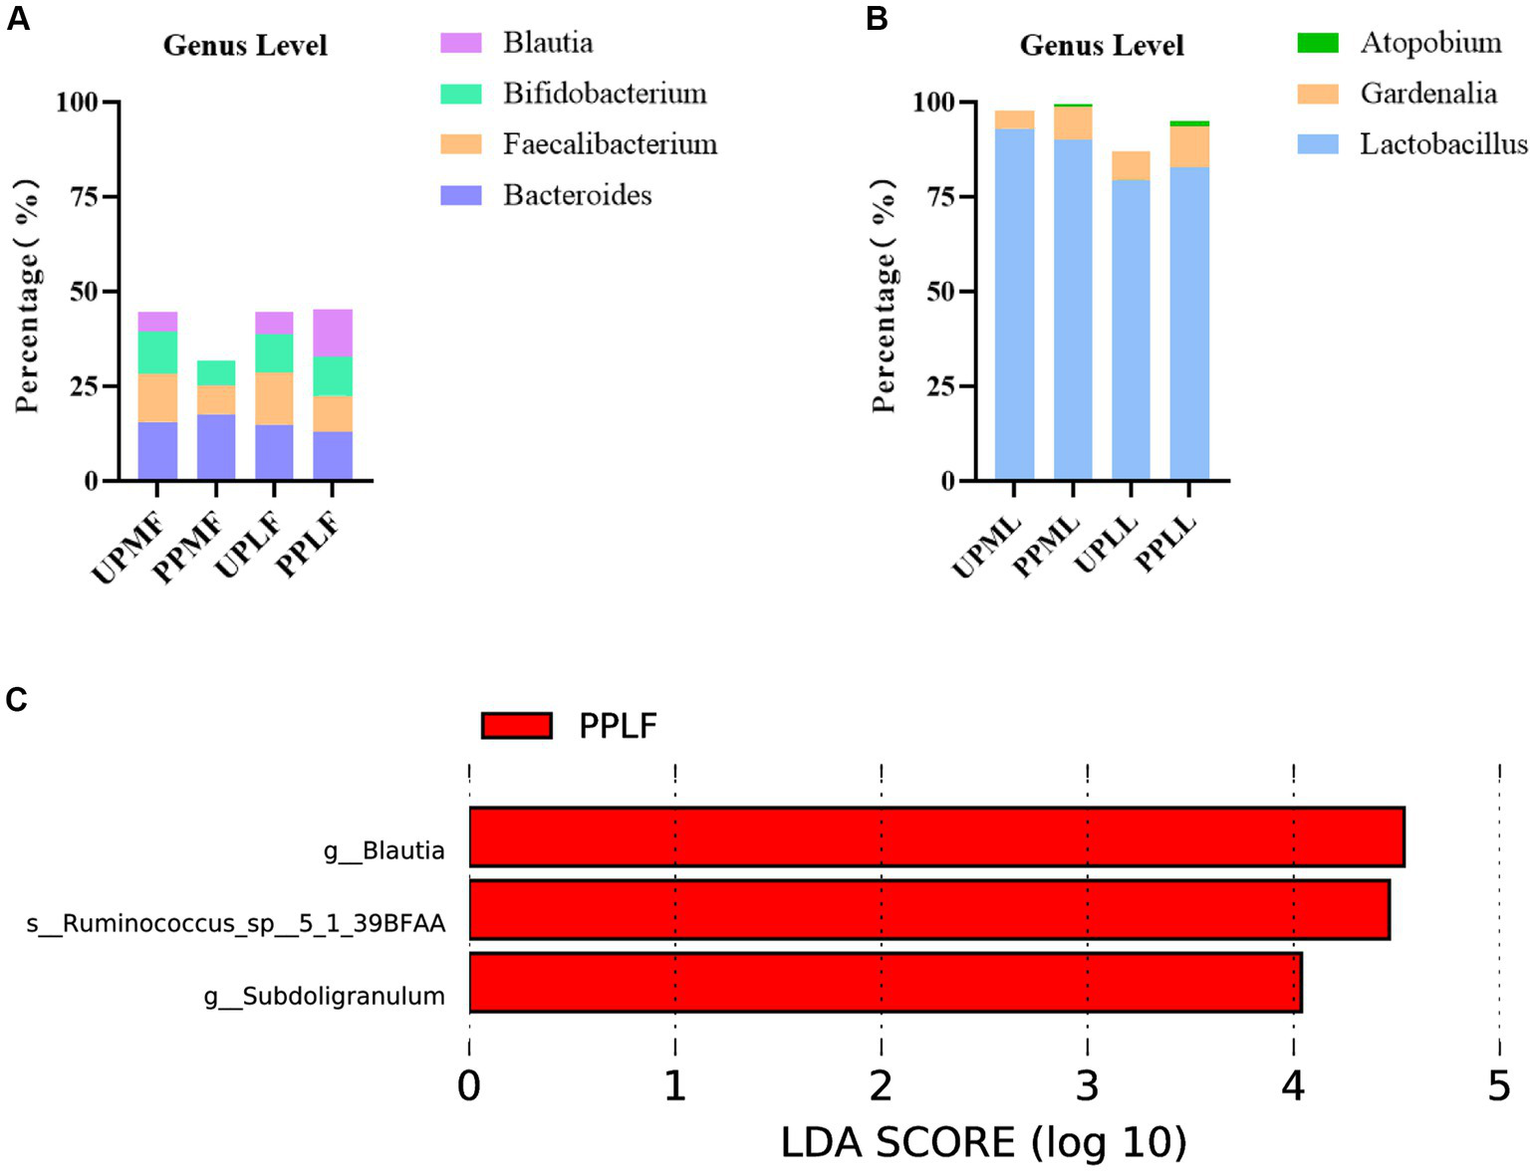
(A,B) Relative OTUs of the gut and vaginal microbiota at the genus level. (C) LDA analysis results for the gut microbiota at full term in the control group and probiotic group. UPMF, gut microbiota at gestational 32–34 weeks women in control group; PPMF, gut microbiota at gestational 32–34 weeks women in probiotic group; UPLF, gut microbiota of gestational full-term women in control group; PPLF, gut microbiota of gestational full-term women in probiotic group; UPML, vaginal microbiota at gestational 32–34 weeks in control group; PPML, vaginal microbiota at gestational 32–34 weeks in probiotic group; UPLL, vaginal microbiota of gestational full-term women in control group; PPLL, vaginal microbiota of gestational full-term women in probiotic group. p_: Phylum, c_: Class, o_: Order, f_: Family, g_: Genus. The length of the bars represents the magnitude of the impact of differential species (i.e., LDA score).
At the genus level, Lactobacillus (93.0%), Gardnerella (4.6%), and Atopobium (0.2%) were the three most abundant components of the vaginal microbiota at 32–34 weeks in the control group (UPML) and probiotic group before probiotics were administered (PPML). Lactobacillus (79.5%), Gardnerella (7.4%), and Leptotrichia (3.8%) were the three most abundant components of the prenatal vaginal microbiota at full term in the control group (UPLL). Lactobacillus (82.7%), Gardnerella (11.0%), and Atopobium (1.4%) were the three most common components of the vaginal microbiota at full term in the probiotic group after probiotics were administered (PPLL). The difference between the two groups was not significant (Table 3; Figure 7B).
In the probiotic group, g_Blautia, s_Ruminococcus_sp_5_1_39BFAA, and g_Subdoligranulum were significantly more abundant in the gut microbiota at full term than in that of the control group (p < 0.05) (Figure 7C).
Variation in the placental microbiota in probiotic-treated pregnant patients
At the phylum level, Proteobacteria (31.8%), Firmicutes (28.0%), and Bacteroidetes (18.3%) were the three most abundant components of the placental microbiota in the control group (placenta microbiota in the control group (UPP)). Firmicutes (33.4%), Proteobacteria (23.9%), and Bacteroidetes (18.3%) were the three most abundant components of the placental microbiota in the probiotic group [placenta microbiota in the probiotic group (PPP)]. The difference between the two groups was not significant (Table 4; Figure 8A).
Table 4
| Firmicutes | Bacteroidetes | Proteobacteria | |
|---|---|---|---|
| UPP | 28.0 | 18.3 | 31.8 |
| PPP | 33.4 | 18.3 | 23.9 |
Relative OTUs of the top three placenta microbiota at the phylum level (%).
Figure 8
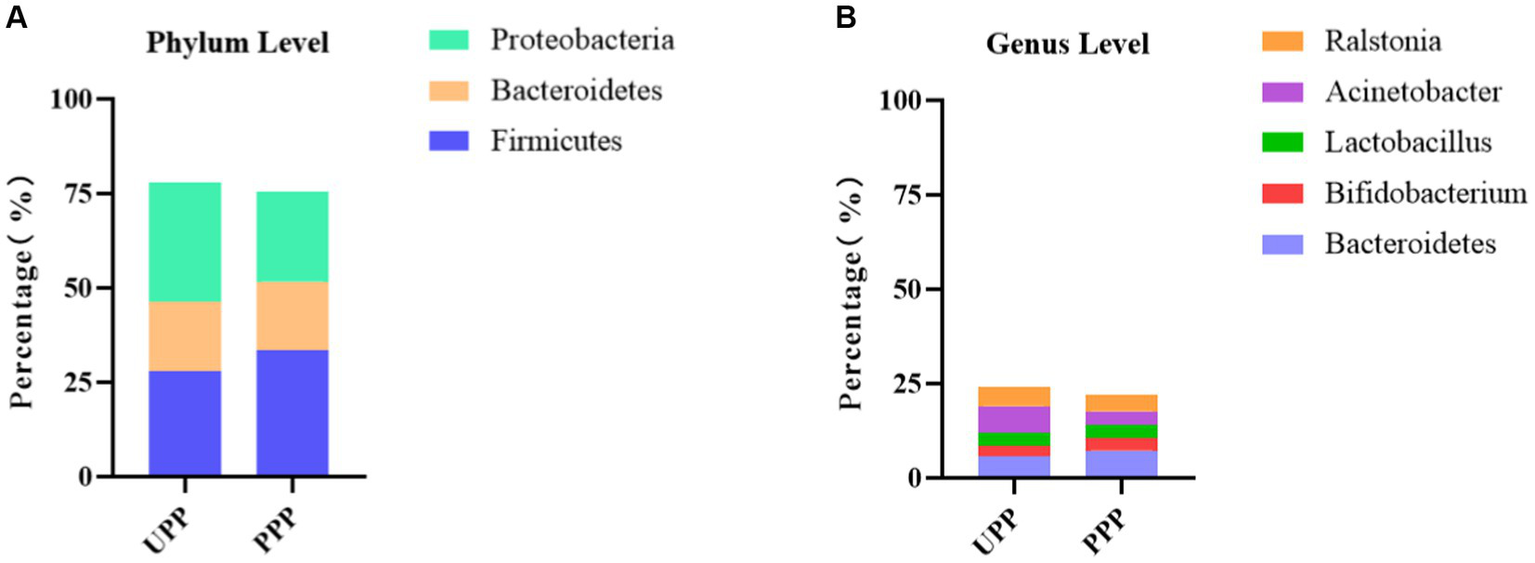
(A) Relative OTUs of the top three placenta microbiota at the phylum level. (B) Relative OTUs of the top five placenta microbiota at the genus level. UPP, placenta microbiota in the control group; PPP, placenta microbiota in the probiotic group.
At the genus level, Acinetobacter (7.1%), Bacteroides (5.8%), and Ralstonia (5.0%) were the three most abundant components of the placental microbiota in the control group (UPP). Bacteroides (7.3%), Ralstonia (4.5%), and Actinobacteria (3.7%) were the three most abundant components of the placental microbiota in the probiotic group (PPP) (Table 5; Figure 8B). The difference between the two groups was not significant (p < 0.05).
Table 5
| Bacteroidetes | Bifidobacterium | Lactobacillus | Acinetobacter | Ralstonia | |
|---|---|---|---|---|---|
| UPP | 5.8 | 2.7 | 3.5 | 7.1 | 5.0 |
| PPP | 7.3 | 3.2 | 3.5 | 3.7 | 4.5 |
Relative OTUs of the top five placenta microbiota at the genus level (%).
The variation in the gut microbiota of newborns in the control group and probiotic group at different times
At the phylum level, Proteobacteria, Firmicutes, and Bacteroidetes were the three most abundant components of the meconium microbiota in both the control group [meconium microbiota in the control group (UB1F)] and the probiotic group [meconium microbiota in the probiotic group (PB1F)]. Firmicutes, Proteobacteria, and Bacteroidetes were the most abundant components in the gut microbiota on the 3rd and 14th day in both the control group [the gut microbiota of newborns on the 3rd day in the control group (UB2F) and the gut microbiota of newborns on the 14th day in the control group (UB3F)] and the probiotic group [the gut microbiota of newborns on the 3rd day in the probiotic group (PB2F) and the gut microbiota of newborns on the 14th day in the probiotic group (PB3F)] (Table 6; Figure 9A).
Table 6
| Firmicutes | Bacteroidetes | Actinobacteria | Proteobacteria | |
|---|---|---|---|---|
| UB1F | 36.6 | 12.4 | / | 47.1 |
| PB1F | 23.1 | 6.0 | / | 70.0 |
| UB2F | 58.9 | / | 13.5 | 19.8 |
| PB2F | 53.7 | / | 18.6 | 20.1 |
| UB3F | 45.1 | / | 13.6 | 23.9 |
| PB3F | 39.7 | / | 23.8 | 25.9 |
Relative OTUs of the top three gut microbiota constituents of neonates at the phylum level (%).
Figure 9
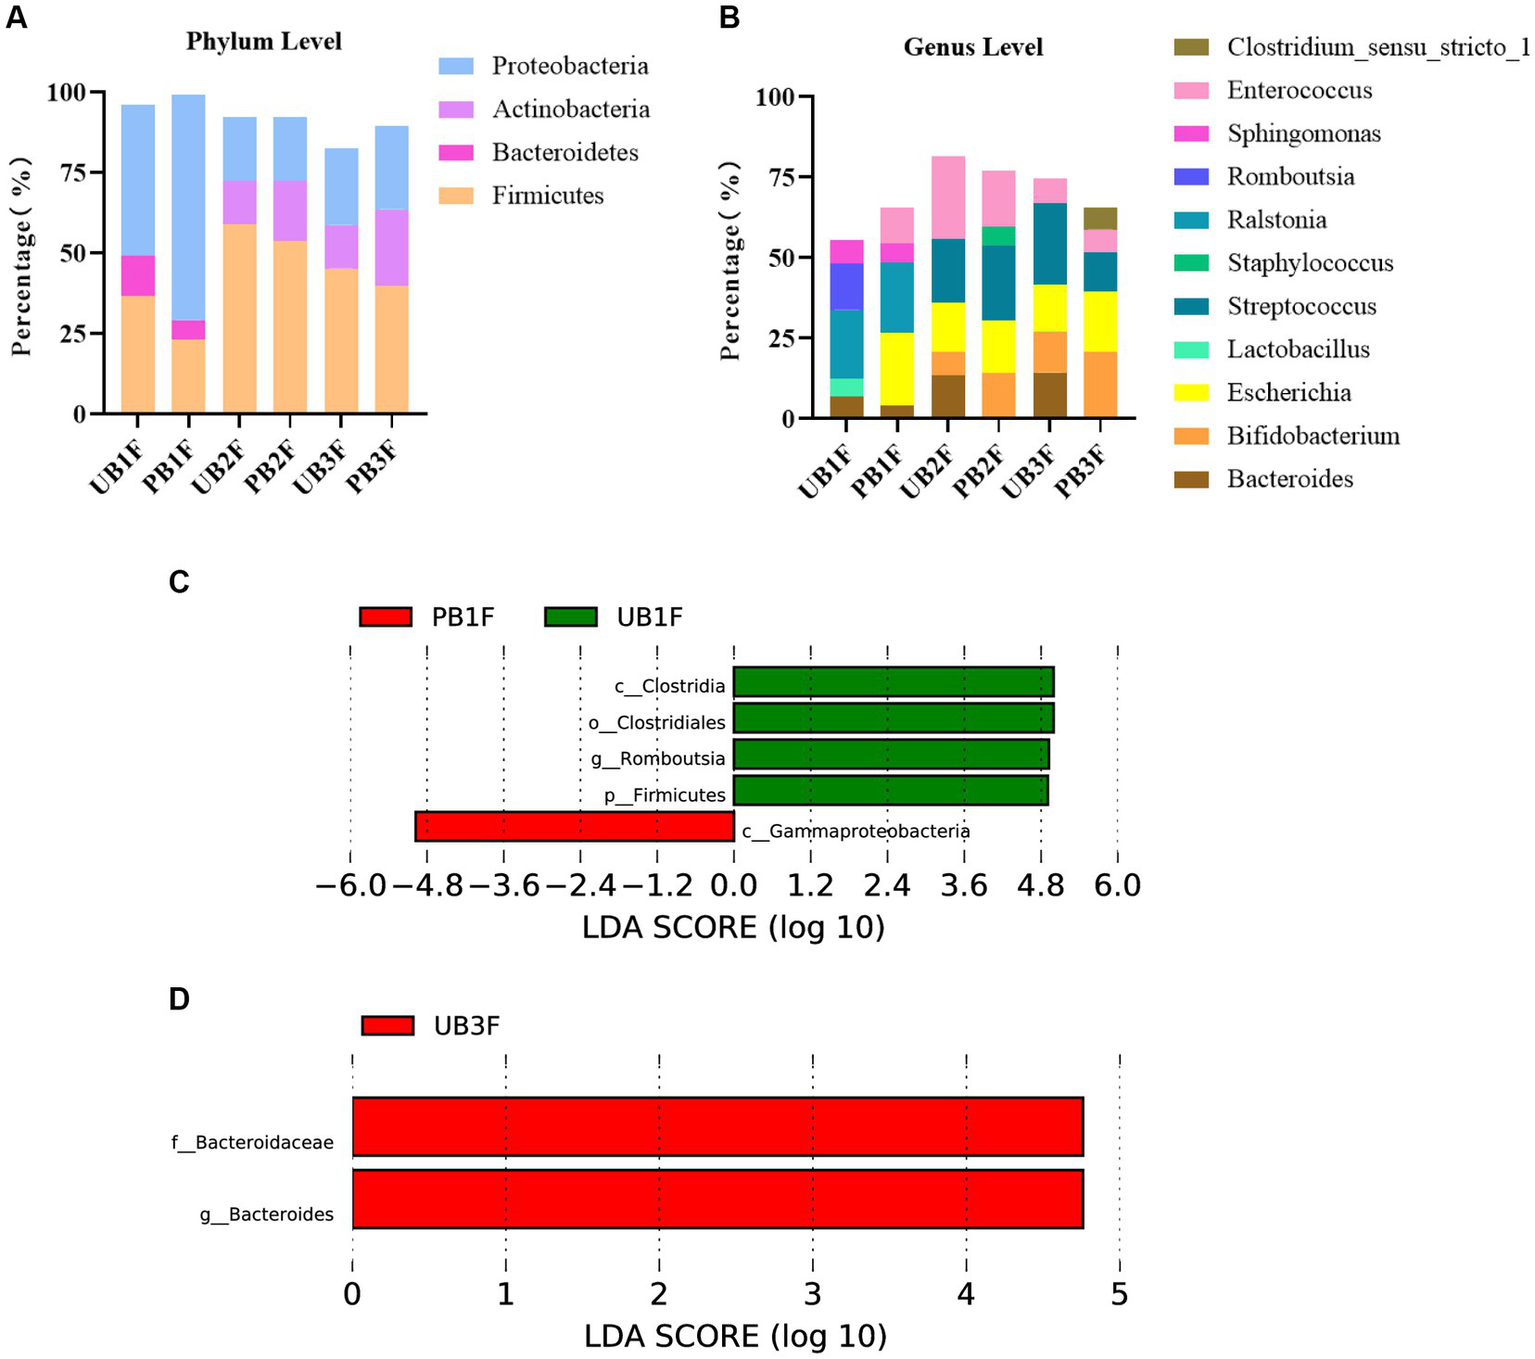
(A) Relative OTUs of the top three gut microbiota constituents of neonates at the phylum level. (B) Relative OTUs of the top five gut microbiota constituents of neonates at the genus level. (C) LDA analysis results for the meconium microbiota in the control group and the probiotic group. (D) LDA analysis results for the infant gut microbiota on the 14th day in the control group and the probiotic group. UB1F, meconium in control group; PB1F, meconium in probiotic group; UB2F, the gut microbiota of newborns on the 3rd day in control group; PB2F, the gut microbiota of newborns on the 3rd day in probiotic group; UB3F, the gut microbiota of newborns on the 14th day in control group; PB3F, the gut microbiota of newborns on the 14th day in probiotic group.
At the genus level, Ralstonia (21.3%), Romboutsia (14.5%), and Sphingomonas (7.2%) were the three most abundant components of the meconium microbiota in the control group (UB1F). Escherichia (22.4%), Ralstonia (22.0%), and Enterococcus (11.4%) were the most abundant components of the meconium microbiota in the probiotic group (PB1F) (Table 7; Figure 7B). Enterococcus (25.8%), Streptococcus (19.8%), and Escherichia (15.3%) were the three most common bacteria in the gut microbiota on the 3rd day in the control group (UB2F). Streptococcus (23.4%), Enterococcus (17.2%), and Escherichia (16.5%) were the three most abundant bacteria in the gut microbiota on the 3rd day in the probiotic group (PB2F) (Table 7; Figure 9B). Streptococcus (25.1%), Escherichia (14.6%), and Bacteroides (14.3%) were the three most abundant components of the gut microbiota on the 14th day in the control group (UB3F). Among the gut microbiota in the probiotic group (PB3F), Bifidobacterium (20.6%), Escherichia (18.8%), and Streptococcus (12.3%) were the three most common components on the 14th day (Table 7; Figure 9B).
Table 7
| Bacteroides | Bifidobacterium | Escherichia | Lactobacillus | Streptococcus | Staphylococcus | Ralstonia | Romboutsia | Sphingomonas | Enterococcus | Clostridium_sensu_stricto_1 | |
|---|---|---|---|---|---|---|---|---|---|---|---|
| UB1F | 6.8 | 5.6 | 21.3 | 14.5 | 7.2 | ||||||
| PB1F | 4.1 | 22.4 | 22.0 | 5.8 | 11.4 | ||||||
| UB2F | 13.3 | 7.4 | 15.3 | 19.8 | 25.8 | ||||||
| PB2F | 14.0 | 16.5 | 23.4 | 5.8 | 17.2 | ||||||
| UB3F | 14.3 | 12.8 | 14.6 | 25.1 | 7.7 | ||||||
| PB3F | 20.6 | 18.8 | 12.3 | 7.0 | 6.7 |
Relative OTUs of the top five gut microbiota constituents of neonates at the genus level (%).
LEfSe was used to estimate the difference between the gut microbiota of newborns in the control group and the probiotic group at different times. In the probiotic group, c_Clostridia, o_Clostridiales, g_Romboutsia, and p_Firmicutes were significantly less abundant in the meconium microbiota than in that of the control group (p < 0.05); c_Gammaproteobacteria were significantly less abundant in the meconium microbiota than in that of the control group (p < 0.05) (Figure 9C). The difference between the two groups on the 3rd day was not significant. F_Bacteroidaceae and g_bacteroides in the probiotic group were significantly less abundant in the gut microbiota than in the control group on the 14th day (p < 0.05) (Figure 9D).
Discussion
The gut microbiota plays a key role in human health throughout life (1). However, we have limited information about their establishment in infants or their mechanism of action (17). Most studies indicate that microorganisms implanted in the newborn gut after birth are influenced by special factors, such as antibodies in the placenta, the umbilical cord (18), and maternal milk (19). Animal experiments have shown that the development of the nervous and immune systems of offspring is influenced by the maternal gut microbiota (20). This influence may be directly or indirectly caused by molecules or antibodies produced by the metabolism of the gut microbiota through the placenta or other pathways (21). In 2010, Maria reported that the gut microbiota of naturally born newborns was similar to that of mothers (22). However, a similar result was not found in cesarean-section pregnancies (22). Therefore, in our study, we analyzed 30 Chinese newborns at different stages. We found that meconium is not bio-clean. Meconium can harbor many microorganisms, such as Proteobacteria, Actinobacteria, and Acidobacteria. SourceTracker program has provided one of the most powerful and effective methods to perform microbial source tracking (15) and has been widely used (23–25). It uses Bayesian methods to evaluate all assignments of sink sequences to all source samples, including an unknown source, and creates a joint distribution of those assignments. Then, the distribution is sampled with a Gibbs sampler to estimate the likelihood that a sequence came from a particular source (26). In our study, we found that gut microbiota in meconium is composed mainly of bacteria from the placenta and an unknown source. We thought that there might be some “pathway” from the placenta to the neonatal gut to transfer bacteria. We also found that on the 3rd day and 14th day, neonatal gut microbiota tended to be composed mainly of bacteria from maternal gut microbiota and an unknown source. This trend is interesting. We thought that after birth, neonatal gut microbiota was still influenced by their maternal placenta at first. However, this influence decreased after disconnecting with the placenta. Interestingly, for some reason, the influence of the maternal gut increased. So, maternal gut microbiota is more vital to their offspring. This finding is controversial, as is our former recognition. Because the vagina and uterine are connected, we previously thought that vaginal microbiota may have more influence on neonatal gut microbiota. Furthermore, previous studies focused little on the co-occurrence of bacterial networks in maternal microbiota and neonatal microbiota. We found that the correlation of bacteria in both maternal microbiota and neonatal microbiota was complicated, especially in the placenta and meconium. Hence, influential factors on neonatal gut microbiota is worthing studied.
Recent studies have focused mainly on the relationship between adult gut microorganisms and disease based on 16S RNA sequencing (17). However, the factors influencing newborn gut microbiota in the early stages of life are still unclear (17). In 2015, 98 Swiss full-term newborns and maternal fecal samples were analyzed via metagenome sequencing by Fredrik (17). The authors found that delivery mode and breastfeeding play key roles in the establishment and evolution of newborn gut microbiota (17). They also found that α diversity increased and β diversity decreased before 3 years of age (17). However, an American study revealed that a child’s gut microbiota becomes stable before 1 year of age (27). This difference in the results might be influenced by race and region (27). In our study, we first analyzed the gut microbiota of Chinese newborns at different stages through 14 days after birth. After using Spearman’s rank correlation analysis, we found that the gut microbiota at different times was related to the maternal microbiota at the phylum and genus levels. However, the influence of the maternal microbiota on the newborn gut microbiota differed in terms of timing and duration. Interestingly, the gut microbiota of newborns on the 14th day had less relationship with maternal microbiota. We hypothesized that these bacteria from pregnant patients have indirect effects, not direct delivery, on their offspring, such as genetic inheritance or microenvironment influence, which becomes more apparent until the newborn gut microbiota becomes more stable (17). In 2015, Bäckhed found that the gut microbiota of 12-month-old children was more similar to that of their mothers than was that of newborns and 4-month-old children. This suggests that the maturation of the gut microbiota is a non-stochastic process that may result from the interactions that occur at different developmental periods between key microbial communities (28).
Many studies have shown that the maternal gut and vaginal microbiota at different stages can influence fetal or newborn gut microbiota (18) via the blood (19), placenta, or direct contact. This relationship could also influence the growth of the fetal nervous and immune systems (29–31). Several observational studies have shown that variations in a child’s gut microbiota can reduce the occurrence of allergic diseases (32). For instance, in 2021, several studies showed the influence of probiotics used by children on allergic diseases (12, 33). It is interesting that in our study, neonatal gut microbiota was more similar to placenta and maternal gut microbiota, especially gut microbiota of meconium. So, can we variate neonatal gut microbiota via maternal probiotic management? Probiotics are common medicines that influence gut microorganisms in newborns by increasing the diversity of the gut microbiota (32, 34). Previous studies showed that probiotics could work in approximately 2–4 weeks (35–37). Bifidobacterium longum, one of the most abundant microorganisms in the intestines of infants and adults, is usually used in probiotics (38). Streptococcus thermophilus (39) and Lactobacillus delbrueckii bulgaricus (40) are considered to be potential probiotics and have been used to promote human health (41, 42). However, few studies have investigated the variation in the gut microbiota of newborns via oral maternal intake of probiotics during pregnancy. In our study, we first administered oral probiotics to pregnant women at 32–34 weeks to investigate the influence of these probiotics on the gut and vaginal microbiota. We found that the abundance of Bifidobacterium increased in maternal gut microbiota and placenta microbiota. Abundance of Lactobacillus increased in maternal vaginal microbiota. However, there is no statistical difference for the small sample size. Furthermore, in the probiotic group, g_Blautia, s_Ruminococcus_sp_5_1_39BFAA, and g_Subdoligranulum were significantly more abundant in the gut microbiota at full term than in the control group. These findings are inconsistent with most of the previous studies. Several previous studies have shown that oral probiotics can alter the gut and vaginal microbiota to achieve therapeutic effects (43, 44). However, some previous studies have shown that probiotics cannot change the diversity or abundance of probiotic bacteria in the microbiota, but they can play a role (45–48). So, it is still controversial on the functional mechanism of probiotics. Even in previous studies with the conclusion that probiotic supplements could vary the abundance of probiotic bacteria, the abundance of other bacteria also could change (49). In our study, the abundance of some non-probiotic bacteria changed. Based on co-occurrence network analysis, we speculated that probiotics can change the microenvironment through their metabolites or receptor-mediated genes (50). However, determining the mechanism of this process will require further investigation.
In a previous study in 2016, Paul found that administering probiotics to pregnant and lactating rats changed the gut microbiota of their offspring and reduced the incidence of obesity in their offspring (51). In our study, the abundance of Bifidobacterium increased in neonatal gut microbiota in 3 days and 14 days in the probiotic group, but there is no statistical significance. However, some other bacteria in meconium and on the 14th day between the probiotic group and the control group had significant differences after probiotic management. Whether oral probiotics can change the gut microbiota of offspring is still controversial, too. Several studies have shown that probiotics can only affect Toll-like receptor expression in the placenta and in the newborn gut, not by affecting the constitution of the microbiota (52). In 2011, Boyle R investigated allergic disease in newborns in a randomized controlled trial of 250 pregnancies with high-risk factors. The authors found that probiotics administered to pregnant women after 36 weeks to full term could not prevent infantile eczema (53). Several studies have shown that probiotics administered from 36 weeks to 3 months after delivery can reduce the occurrence of infantile allergic dermatitis (54). These studies showed that probiotics taken after delivery may have a greater impact on newborns. In our study, based on co-occurrence network analysis, we speculated that probiotics also have an indirect effect on maternal and neonatal gut microbiota.
Our study has several limitations: first, the small sample size was the main limitation of the study. Second, we did not collect oral and mother milk microbiota. Third, further study is needed to investigate the relationship between maternal microbiota and their offspring’s microbiota after the 14th day.
Conclusion
Maternal microbiota is vital to their offspring. In this study, we found that the microbiota in the neonatal gut at different times correlated with that in the maternal microbiota in the 3rd trimester and at full term. The placenta had more influence on meconium microbiota. The maternal gut had more influence on neonatal gut microbiota on the 3rd day and 14th day. Currently, the probiotic dosing we use during pregnancy does not alter the abundance of Bifidobacterium, Lactobacillus, or Streptococcus in the maternal gut, vaginal, and placental microbiota at the full term. However, we found that some other bacteria changed in the maternal gut and the neonatal gut in the probiotic group (Figure 10). We may need further study to investigate the mechanism of maternal-to-infant gut microbiota transmission.
Figure 10
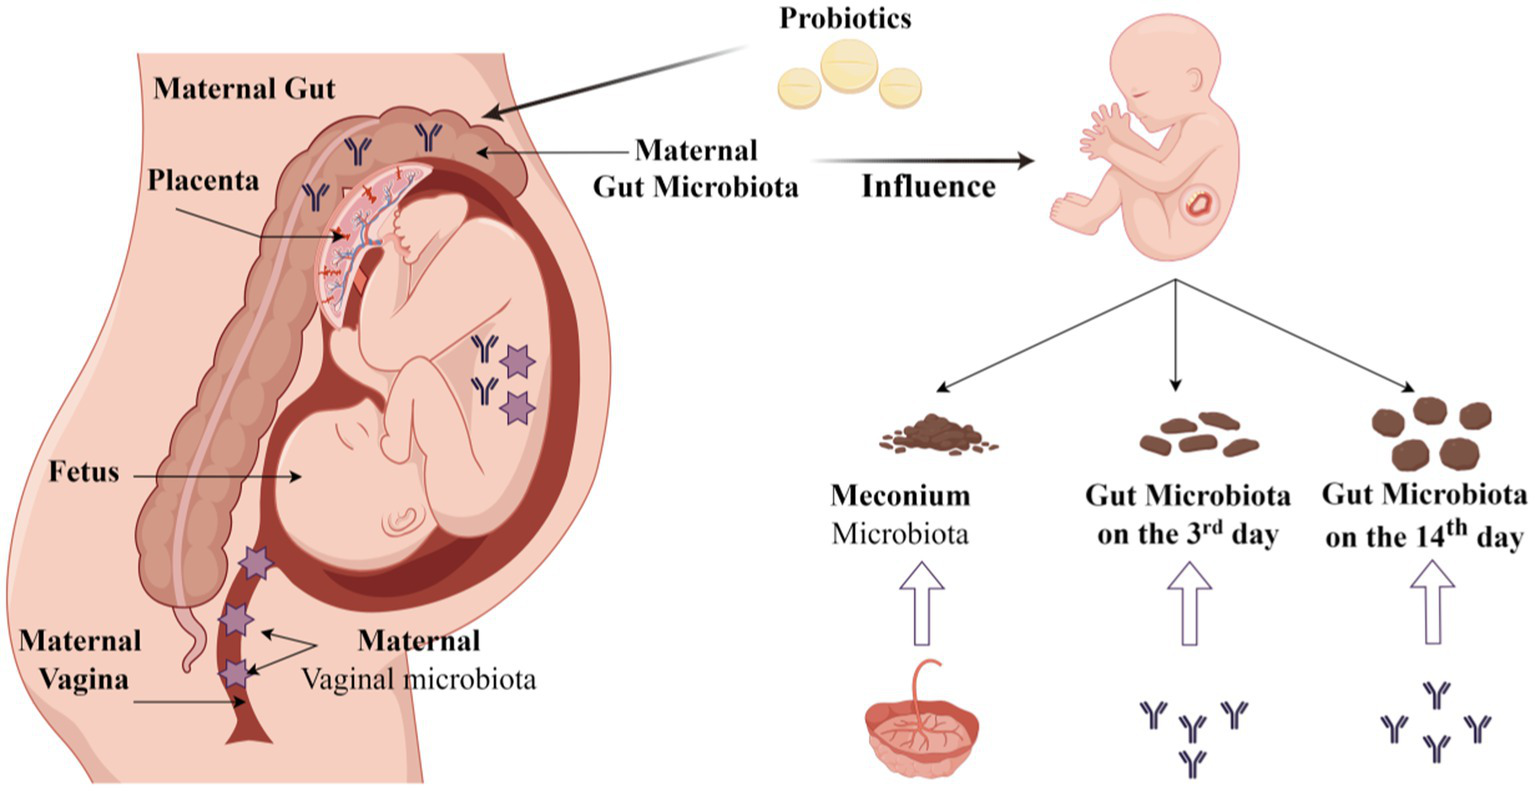
Origin of the neonatal gut microbiota and probiotic intervention (By Figdraw).
Statements
Data availability statement
The datasets presented in this study can be found in online repositories. The names of the repository/repositories and accession number(s) can be found at: https://www.ncbi.nlm.nih.gov/, PRJNA1053345.
Ethics statement
The study project was authorized by the Institutional Review Board (IRB) for Human Subject Research at the First Affiliated Hospital of Jinan University (2019-011). The studies were conducted in accordance with the local legislation and institutional requirements. Written informed consent for participation in this study was provided by the participants’ legal guardians/next of kin.
Author contributions
ZL: Funding acquisition, Investigation, Writing – original draft, Writing – review & editing. YZ: Methodology, Software, Writing – original draft, Writing – review & editing. XT: Data curation, Formal analysis, Writing – original draft. TK: Methodology, Resources, Writing – review & editing. QG: Methodology, Resources, Writing – review & editing. XX: Investigation, Methodology, Project administration, Writing – review & editing. CX: Investigation, Methodology, Project administration, Writing – review & editing.
Funding
The author(s) declare that financial support was received for the research, authorship, and/or publication of this article. This study was supported by the Department of Science and Technology of Guangzhou (Grant no. SL2022A04J00792). This study was also supported by the Guangdong Provincial Key Laboratory of Human Digital Twin (2022B1212010004).
Conflict of interest
The authors declare that the research was conducted in the absence of any commercial or financial relationships that could be construed as a potential conflict of interest.
Publisher’s note
All claims expressed in this article are solely those of the authors and do not necessarily represent those of their affiliated organizations, or those of the publisher, the editors and the reviewers. Any product that may be evaluated in this article, or claim that may be made by its manufacturer, is not guaranteed or endorsed by the publisher.
- PMF
Gut microbiota at gestational 32-34 weeks women
- PML
Vaginal microbiota at gestational 32-34 weeks women
- PLF
Gut microbiota of gestational full-term women
- PLL
Vaginal microbiota of gestational full-term women
- PP
Placenta microbiota
- B1F
Meconium microbiota
- B2F
The gut microbiota of newborns on the 3rd day
- B3F
The gut microbiota of newborns on the 14th day
- UPMF
Gut microbiota at gestational 32-34 weeks women in control group
- PPMF
Gut microbiota at gestational 32-34 weeks women in probiotic group
- UPML
Vaginal microbiota at gestational 32-34 weeks in control group
- PPML
Vaginal microbiota at gestational 32-34 weeks in probiotic group
- UPLF
Gut microbiota of gestational full-term women in control group
- PPLF
Gut microbiota of gestational full-term women in probiotic group
- UPLL
Vaginal microbiota of gestational full-term women in control group
- PPLL
Vaginal microbiota of gestational full-term women in probiotic group
- UB1F
Meconium microbiota in control group
- PB1F
Meconium microbiota in probiotic group
- UB2F
The gut microbiota of newborns on the 3rd day in control group
- PB2F
The gut microbiota of newborns on the 3rd day in probiotic group
- UB3F
The gut microbiota of newborns on the 14th day in control group
- PB3F
The gut microbiota of newborns on the 14th day in probiotic group
- UPP
Placenta microbiota in control group
- PPP
Placenta microbiota in probiotic group
- OTU
Operational Taxonomic Units
Glossary
Footnotes
1.^http://cutadapt.readthedocs.io/en/stable/
2.^http://drive5.com/uchime/uchime_download.html
3.^http://www.drive5.com/usearch/manual/uchime_algo.html
6.^http://sourceforge.net/projects/rdp-classifier/
References
1.
MilaniCDurantiSBottaciniFCaseyETurroniFMahonyJet al. The first microbial colonizers of the human gut: composition, activities, and health implications of the infant gut microbiota. Microbiol Mol Biol Rev. (2017) 81:17. doi: 10.1128/MMBR.00036-17
2.
LozuponeCAStombaughJIGordonJIJanssonJKKnightR. Diversity, stability and resilience of the human gut microbiota. Nature. (2012) 489:220–30. doi: 10.1038/nature11550
3.
YatsunenkoTReyFEManaryMJTrehanIDominguez-BelloMGContrerasMet al. Human gut microbiome viewed across age and geography. Nature. (2012) 486:222–7. doi: 10.1038/nature11053
4.
JiménezEFernándezLMarínMLMartínROdriozolaJMNueno-PalopCet al. Isolation of commensal bacteria from umbilical cord blood of healthy neonates born by cesarean section. Curr Microbiol. (2005) 51:270–4. doi: 10.1007/s00284-005-0020-3
5.
DigiulioDBRomeroRAmoganHPKusanovicJPBikEMGotschFet al. Microbial prevalence, diversity and abundance in amniotic fluid during preterm labor: a molecular and culture-based investigation. PLoS One. (2008) 3:e3056. doi: 10.1371/journal.pone.0003056
6.
AagaardKMaJAntonyKMGanuRPetrosinoJVersalovicJ. The placenta harbors a unique microbiome. Sci Transl Med. (2014) 6:237ra65. doi: 10.1126/scitranslmed.3008599
7.
FujimuraKESitarikARHavstadSLinDLLevanSFadroshDet al. Neonatal gut microbiota associates with childhood multisensitized atopy and t cell differentiation. Nat Med. (2016) 22:1187–91. doi: 10.1038/nm.4176
8.
RautavaSLuotoRSalminenSIsolauriE. Microbial contact during pregnancy, intestinal colonization and human disease. Nat Rev Gastroenterol Hepatol. (2012) 9:565–76. doi: 10.1038/nrgastro.2012.144
9.
VuongHEPronovostGNWilliamsDWColeyESieglerELQiuAet al. The maternal microbiome modulates fetal neurodevelopment in mice. Nature. (2020) 586:281–6. doi: 10.1038/s41586-020-2745-3
10.
WongCBSugaharaHOdamakiTXiaoJZ. Different physiological properties of human-residential and non-human-residential bifidobacteria in human health. Benef Microbes. (2018) 9:111–22. doi: 10.3920/BM2017.0031
11.
MilaniCMancabelliLLugliGADurantiSTurroniFFerrarioCet al. Exploring vertical transmission of bifidobacteria from mother to child. Appl Environ Microbiol. (2015) 81:7078–87. doi: 10.1128/AEM.02037-15
12.
ColquittASMilesEACalderPC. Do probiotics in pregnancy reduce allergies and asthma in infancy and childhood? A systematic review. Nutrients. (2022) 14:1852. doi: 10.3390/nu14091852
13.
ChooJMLeongLERogersGB. Sample storage conditions significantly influence faecal microbiome profiles. Sci Rep. (2015) 5:16350. doi: 10.1038/srep16350
14.
GorzelakMAGillSKTasnimNAhmadi-VandZJayMGibsonDL. Methods for improving human gut microbiome data by reducing variability through sample processing and storage of stool. PLoS One. (2015) 10:e0134802. doi: 10.1371/journal.pone.0134802
15.
KnightsDKuczynskiJCharlsonESZaneveldJMozerMCCollmanRGet al. Bayesian community-wide culture-independent microbial source tracking. Nat Methods. (2011) 8:761–3. doi: 10.1038/nmeth.1650
16.
ShannonPMarkielAOzierOBaligaNSWangJTRamageDet al. Cytoscape: a software environment for integrated models of biomolecular interaction networks. Genome Res. (2003) 13:2498–504. doi: 10.1101/gr.1239303
17.
BäckhedFRoswallJPengYFengQJiaHKovatcheva-DatcharyPet al. Dynamics and stabilization of the human gut microbiome during the first year of life. Cell Host Microbe. (2015) 17:690–703. doi: 10.1016/j.chom.2015.04.004
18.
MillenJWWoollamDH. Maternal nutrition in relation to abnormal foetal development. Proc Nutr Soc. (1960) 19:1–5. doi: 10.1079/pns19600003
19.
RelmanDA. The human microbiome: ecosystem resilience and health. Nutr Rev. (2012) 70:S2–9. doi: 10.1111/j.1753-4887.2012.00489.x
20.
KearneyJFPatelPStefanovEKKingRG. Natural antibody repertoires: development and functional role in inhibiting allergic airway disease. Annu Rev Immunol. (2015) 33:475–504. doi: 10.1146/annurev-immunol-032713-120140
21.
GrindstaffJLBrodieERKettersonED. Immune function across generations: integrating mechanism and evolutionary process in maternal antibody transmission. Proc Biol Sci. (2003) 270:2309–19. doi: 10.1098/rspb.2003.2485
22.
Dominguez-BelloMGCostelloEKContrerasMMagrisMHidalgoGFiererNet al. Delivery mode shapes the acquisition and structure of the initial microbiota across multiple body habitats in newborns. Proc Natl Acad Sci USA. (2010) 107:11971–5. doi: 10.1073/pnas.1002601107
23.
ChenXXuJRenESuYZhuW. Co-occurrence of early gut colonization in neonatal piglets with microbiota in the maternal and surrounding delivery environments. Anaerobe. (2018) 49:30–40. doi: 10.1016/j.anaerobe.2017.12.002
24.
KaponoCAMortonJTBouslimaniAMelnikAVOrlinskyKKnaanTLet al. Creating a 3d microbial and chemical snapshot of a human habitat. Sci Rep. (2018) 8:3669. doi: 10.1038/s41598-018-21541-4
25.
HydeERNavas-MolinaJASongSJKuenemanJGAckermannGCardonaCet al. The oral and skin microbiomes of captive komodo dragons are significantly shared with their habitat. Msystems. (2016) 1:46. doi: 10.1128/mSystems.00046-16
26.
McgheeJJRawsonNBaileyBAFernandez-GuerraASisk-HackworthLKelleyST. Meta-sourcetracker: application of bayesian source tracking to shotgun metagenomics. Peerj. (2020) 8:e8783. doi: 10.7717/peerj.8783
27.
YatsunenkoTReyFEManaryMJTrehanIDominguez-BelloMGContrerasMet al. Human gut microbiome viewed across age and geography. Nature. (2012) 486:222–27. doi: 10.1038/nature11053
28.
La RosaPSWarnerBBZhouYWeinstockGMSodergrenEHall-MooreCMet al. Patterned progression of bacterial populations in the premature infant gut. Proc Natl Acad Sci USA. (2014) 111:12522–7. doi: 10.1073/pnas.1409497111
29.
RossMGBeallMH. Adult sequelae of intrauterine growth restriction. Semin Perinatol. (2008) 32:213–8. doi: 10.1053/j.semperi.2007.11.005
30.
FallCH. Evidence for the intra-uterine programming of adiposity in later life. Ann Hum Biol. (2011) 38:410–28. doi: 10.3109/03014460.2011.592513
31.
BatesonPBarkerDClutton-BrockTDebDD'UdineBFoleyRAet al. Developmental plasticity and human health. Nature. (2004) 430:419–21. doi: 10.1038/nature02725
32.
CukrowskaBBierlaJBZakrzewskaMKlukowskiMMaciorkowskaE. The relationship between the infant gut microbiota and allergy. The role of bifidobacterium breve and prebiotic oligosaccharides in the activation of anti-allergic mechanisms in early life. Nutrients. (2020) 12:946. doi: 10.3390/nu12040946
33.
Tan-LimCEsteban-IpacNRectoMCastorMCasis-HaoRJNanoA. Comparative effectiveness of probiotic strains on the prevention of pediatric atopic dermatitis: a systematic review and network meta-analysis. Pediatr Allergy Immunol. (2021) 32:1255–70. doi: 10.1111/pai.13514
34.
MichailS. The role of probiotics in allergic diseases. Allergy Asthma Clin Immunol. (2009) 5:5. doi: 10.1186/1710-1492-5-5
35.
LaiHLiYHeYChenFMiBLiJet al. Effects of dietary fibers or probiotics on functional constipation symptoms and roles of gut microbiota: a double-blinded randomized placebo trial. Gut Microbes. (2023) 15:2197837. doi: 10.1080/19490976.2023.2197837
36.
SchaubACSchneiderEVazquez-CastellanosJFSchweinfurthNKettelhackCDollJet al. Clinical, gut microbial and neural effects of a probiotic add-on therapy in depressed patients: a randomized controlled trial. Transl Psychiatry. (2022) 12:227. doi: 10.1038/s41398-022-01977-z
37.
BaggaDReichertJLKoschutnigKAignerCSHolzerPKoskinenKet al. Probiotics drive gut microbiome triggering emotional brain signatures. Gut Microbes. (2018) 9:1–11. doi: 10.1080/19490976.2018.1460015
38.
YaoSZhaoZWangWLiuX. Bifidobacterium longum: protection against inflammatory bowel disease. J Immunol Res. (2021) 2021:8030297. doi: 10.1155/2021/8030297
39.
WuYLiSTaoYLiDHanYShowPLet al. Fermentation of blueberry and blackberry juices using lactobacillus plantarum, streptococcus thermophilus and bifidobacterium bifidum: growth of probiotics, metabolism of phenolics, antioxidant capacity in vitro and sensory evaluation. Food Chem. (2021) 348:129083. doi: 10.1016/j.foodchem.2021.129083
40.
NaiduASBidlackWRClemensRA. Probiotic spectra of lactic acid bacteria (lab). Crit Rev Food Sci Nutr. (1999) 39:13–126. doi: 10.1080/10408699991279187
41.
ChangCHChenYSLeeTTChangYCYuB. Lactobacillus formosensis sp. Nov., a lactic acid bacterium isolated from fermented soybean meal. Int J Syst Evol Microbiol. (2015) 65:101–6. doi: 10.1099/ijs.0.070938-0
42.
VitettaLLlewellynHOldfieldD. Gut dysbiosis and the intestinal microbiome: streptococcus thermophilus a key probiotic for reducing uremia. Microorganisms. (2019) 7:228. doi: 10.3390/microorganisms7080228
43.
LahtinenSJBoyleRJKivivuoriSOppedisanoFSmithKRRobins-BrowneRet al. Prenatal probiotic administration can influence bifidobacterium microbiota development in infants at high risk of allergy. J Allergy Clin Immunol. (2009) 123:499–501.e8. doi: 10.1016/j.jaci.2008.11.034
44.
NishijimaKShukunamiKKotsujiF. Probiotics affects vaginal flora in pregnant women, suggesting the possibility of preventing preterm labor. J Clin Gastroenterol. (2005) 39:447–8. doi: 10.1097/01.mcg.0000159269.58480.4b
45.
RobertsJLGolloshiMHardingDBConduahMLiuGDrissiH. Bifidobacterium longum supplementation improves age-related delays in fracture repair. Aging Cell. (2023) 22:e13786. doi: 10.1111/acel.13786
46.
KimCSChaLSimMJungSChunWYBaikHWet al. Probiotic supplementation improves cognitive function and mood with changes in gut microbiota in community-dwelling older adults: a randomized, double-blind, placebo-controlled, multicenter trial. J Gerontol A Biol Sci Med Sci. (2021) 76:32–40. doi: 10.1093/gerona/glaa090
47.
TakedaTAsaokaDNojiriSYanagisawaNNishizakiYOsadaTet al. Usefulness of bifidobacterium longum bb536 in elderly individuals with chronic constipation: a randomized controlled trial. Am J Gastroenterol. (2023) 118:561–8. doi: 10.14309/ajg.0000000000002028
48.
MartoniCJEvansMChowCTChanLSLeyerG. Impact of a probiotic product on bowel habits and microbial profile in participants with functional constipation: a randomized controlled trial. J Dig Dis. (2019) 20:435–46. doi: 10.1111/1751-2980.12797
49.
YuJZhuPShiLGaoNLiYShuCet al. Bifidobacterium longum promotes postoperative liver function recovery in patients with hepatocellular carcinoma. Cell Host Microbe. (2024) 32:131–144.e6. doi: 10.1016/j.chom.2023.11.011
50.
FurrieE. Probiotics and allergy. Proc Nutr Soc. (2005) 64:465–9. doi: 10.1079/pns2005466
51.
PaulHABomhofMRVogelHJReimerRA. Diet-induced changes in maternal gut microbiota and metabolomic profiles influence programming of offspring obesity risk in rats. Sci Rep. (2016) 6:20683. doi: 10.1038/srep20683
52.
RautavaSColladoMCSalminenSIsolauriE. Probiotics modulate host-microbe interaction in the placenta and fetal gut: a randomized, double-blind, placebo-controlled trial. Neonatology. (2012) 102:178–84. doi: 10.1159/000339182
53.
BoyleRJIsmailIHKivivuoriSLicciardiPVRobins-BrowneRMMahLJet al. Lactobacillus gg treatment during pregnancy for the prevention of eczema: a randomized controlled trial. Allergy. (2011) 66:509–16. doi: 10.1111/j.1398-9995.2010.02507.x
54.
DotterudCKStorrøOJohnsenROienT. Probiotics in pregnant women to prevent allergic disease: a randomized, double-blind trial. Br J Dermatol. (2010) 163:616–23. doi: 10.1111/j.1365-2133.2010.09889.x
Summary
Keywords
gut microbiota, vaginal microbiota, placenta microbiota, neonatal gut microbiota, probiotic
Citation
Li Z, Zhang Y, Tan X, Kian Deng T, Gao Q, Xiao X and Xu C (2024) Origin of the neonatal gut microbiota and probiotic intervention: a randomized controlled trial. Front. Nutr. 11:1389417. doi: 10.3389/fnut.2024.1389417
Received
21 February 2024
Accepted
09 April 2024
Published
30 April 2024
Volume
11 - 2024
Edited by
Stefania Arioli, University of Milan, Italy
Reviewed by
Giorgio Gargari, University of Milan, Italy
Alejandra Romo-Araiza, Anahuac University of North Mexico, Mexico
Updates
Copyright
© 2024 Li, Zhang, Tan, Kian Deng, Gao, Xiao and Xu.
This is an open-access article distributed under the terms of the Creative Commons Attribution License (CC BY). The use, distribution or reproduction in other forums is permitted, provided the original author(s) and the copyright owner(s) are credited and that the original publication in this journal is cited, in accordance with accepted academic practice. No use, distribution or reproduction is permitted which does not comply with these terms.
*Correspondence: Xiaomin Xiao, jnuxiaoxiaomin@163.comChengfang Xu, xuchengf@mail.sysu.edu.cn
†These authors have contributed equally to this work
Disclaimer
All claims expressed in this article are solely those of the authors and do not necessarily represent those of their affiliated organizations, or those of the publisher, the editors and the reviewers. Any product that may be evaluated in this article or claim that may be made by its manufacturer is not guaranteed or endorsed by the publisher.