- 1Department of Clinical Nutrition, Xinhua Hospital Affiliated to Shanghai Jiao Tong University School of Medicine, Shanghai, China
- 2Department of Clinical Nutrition, College of Health Science and Technology, Shanghai Jiao Tong University School of Medicine, Shanghai, China
- 3Shanghai Key Laboratory of Pediatric Gastroenterology and Nutrition, Shanghai, China
- 4Shanghai Institute for Pediatric Research, Shanghai, China
Purpose: Hyperuricemia (HUA), a common complication in children and adolescents with obesity, has not received sufficient attention. Therefore, the purpose of this study was to compare the predictive ability of different HUA obesity indicators.
Methods: The records of 349 children and adolescents with obesity aged 6–17 years (233 boys and 116 girls) who visited the Nutrition Clinic of Xinhua Hospital, Shanghai Jiao Tong University School of Medicine between January 2012 and December 2023 were included in this retrospective study. The relationship between different obesity indices and HUA was analyzed by univariate and multivariate analysis. The predictive value of triponderal mass index (TMI) and waist-to-height ratio (WHtR) for HUA was evaluated by the receiver operating characteristic (ROC) curve, and the optimal cutoff point was calculated.
Results: In this study, the prevalence of HUA in the general population was 42.40% (41.20% in boys and 44.82% in girls). Multiple regression analysis revealed that after controlling for age and sex, body mass index (BMI), TMI, waist circumference (WC), hip circumference (HC), WHtR, fat mass (FM), and skeletal muscle mass (SMM) were independent risk factors for HUA (p < 0.05). After controlling for age and stratification by gender, BMI, WC, HC, and SMM of boys and girls with obesity were positively correlated with the risk of HUA (p < 0.05). However, TMI, WHtR, body fat percentage, and FM were only positively associated with the risk of HUA in obese girls (p < 0.05). Moreover, TMI and WHtR were 18.2 kg/m3 and 0.56, respectively, in the ROC curve analysis.
Conclusion: The prevalence of HUA was high in children and adolescents with obesity aged 6–17 years. In addition, our results underscored that the combination of TMI and WHtR can be used as a potential early predictor of HUA risk in children and adolescents with obesity, especially in girls.
Introduction
Hyperuricemia (HUA) is an important risk factor for diseases such as metabolic syndrome, cardiovascular disease, hypertension, type 2 diabetes mellitus, and gout (1–4). Unfortunately, HUA has become a common chronic disease among adults. However, its occurrence in children and adolescents has not received sufficient attention from clinicians and parents. It should be noted that with the increasing consumption of purine-rich meats, high fructose beverages, and the rapid rise in obesity rates, HUA has become a disease of high incidence in children and adolescents (5–8). In a study of 54,580 children and adolescents aged 3 to 19, the overall estimated prevalence of HUA was 23.3%, with a prevalence rate of 26.6% among boys, which was higher than 19.8% among girls (9). In addition, the prevalence of HUA was significantly higher in children with overweight (37.6%), obesity (50.6%), and extremely obesity (64.5%) than in normal weight children (9).
Although it has been shown that obesity increases the risk of HUA, current studies focused on which obesity indicators can effectively and rapidly predict HUA during early screening have been inconsistent. An increasing number of studies have found that traditional obesity indicators such as body mass index (BMI), waist circumference (WC), hip circumference (HC), and waist-to-height ratio (WHtR) are significantly positively correlated with HUA (10, 11). In addition, it has been shown that an increase in serum uric acid (SUA) levels leads to gradual and significant increases in BMI, WC, WHtR, percentage body fat (PBF), and muscle mass (10).
Because HUA is a common disease with obvious sex differences, we previously conducted a comparison of various obesity indicators and HUA in children and adolescents of different sex. These previous results showed that after adjusting for age, BMI, WC, HC, skeletal muscle mass(SMM), and PBF were positively associated with the risk of HUA in boys and girls with obesity (12). Although BMI, SMM, and PBF are the most influential indicators of HUA, they have shortcomings such as complex calculations and the need for specific detection equipment, which preclude them from being directly applied to early risk screening for HUA.
Recently, triponderal mass index (TMI) has attracted interest as a new tool for obesity screening in children and adolescents (13, 14). For children and adolescents aged 8–17, the TMI threshold for diagnosing overweight status is 16.0 kg/m3 for boys and 16.8 kg/m3 for girls, and the TMI threshold for diagnosing obesity status is 18.8 kg/m3 for boys and 19.7 kg/m3 for girls (13). Among children and adolescents, BMI has different diagnostic thresholds for overweight and obesity at different age groups. Its advantages include low volatility and convenient detection in different age groups. It can be seen that the advantages of TMI are not only that it changes relatively stably across different age groups, but also that it is more convenient to determine overweight or obesity. Moreover, the correlation between TMI and PBF and fat mass (FM) is much higher than BMI (13, 14).
However, currently, no studies have analyzed the relationship between TMI and HUA in children and adolescents of different sex. In the face of the increasing incidence of HUA in children and adolescents, we explored the predictive role of obesity indicators in boys and girls to provide a more concise, rapid, and reproducible method for the early detection of HUA in children and adolescents.
Materials and methods
Study subjects and groups
The data were collected from obese children and adolescents who visited the Nutrition Clinic of Xinhua Hospital, Shanghai Jiao Tong University School of Medicine between January 2012 and December 2023. This study was approved by the Ethics Committee of the Xinhua Hospital, School of Medicine, Shanghai Jiao Tong University (XHEC-C-2024-098-1).
The inclusion criteria for this study were (1) children and adolescents with a BMI at or above the 95th percentile (P95) for children of the same age and sex (based on WHO standards); (2) children and adolescents 6–17 years of age; (3) children and adolescents with complete data. Subjects were excluded from the study if they met one of the following criteria: (1) obesity due to endocrine or inherited metabolic diseases; (2) patients with malignant tumors and severe liver and kidney dysfunction; (3) patients taking drugs that affect uric acid levels; and (4) patients taking psychotropic drugs. The subjects were divided into an HUA group and a non-HUA group based on the SUA level of the population and stratified by male and female sex. In previous studies, HUA in children and adolescents was defined as SUA > 420 μmol/L (7 mg/dL) in boys and SUA > 360 μmol/L (6 mg/dL) in girls (9, 15).
Anthropometric and clinical measurements
Basic participant information such as age, sex, and physical indicators were measured and recorded by a registered dietitian in the outpatient clinic. Height, WC, and HC were measured according to standard protocols. Participant body weight, PBF, FM, and SMM were measured using whole-body bioelectrical impedance analysis (InBody 720, Biospace Inc., South Korea). BMI, TMI, waist-to-hip ratio (WHR), and WHtR were calculated as follows: BMI (kg/m2) = (weight in kg)/(height in meters)2; TMI (kg/m3) = (weight in kg)/(height in meters)3; WHR = WC (cm)/HC (cm); and WHtR = WC (cm)/height (cm). Venous blood samples were obtained from fasting participants in the morning and sent to the clinical laboratory center for SUA, triglyceride (TG), and total cholesterol (TC) analysis.
Statistical analysis
Data were analyzed using SPSS V.25.0 statistical software. Kolmogorov–Smirnov test was used to evaluate the normal distribution of parameters. Data for continuous variables are expressed as median (P25, P75), and categorical variables are expressed as frequency and percentage (%). To compare differences in various indicators between HUA and non-HUA based on sex, an independent two-tailed t test was applied for continuous data with a normal distribution, a Wilcoxon signed-rank test was used for continuous variables with a non-normal distribution, and a Chi-squared test was performed for categorical variables. Pearson correlation was used to evaluate the correlation between SUA and various factors. A multiple logistic regression model was used to evaluate the effects of different physical indicators and body composition variables on the risk of HUA. Model 1 used unadjusted regression, and Model 2 used regression adjusted for age and sex. To explore possible cutoff values for TMI and WHtR, we used receiver operating characteristic (ROC) curves to predict the occurrence of HUA. All p-values were calculated using a bilateral test, and the significance level of each test was set at p < 0.05.
Results
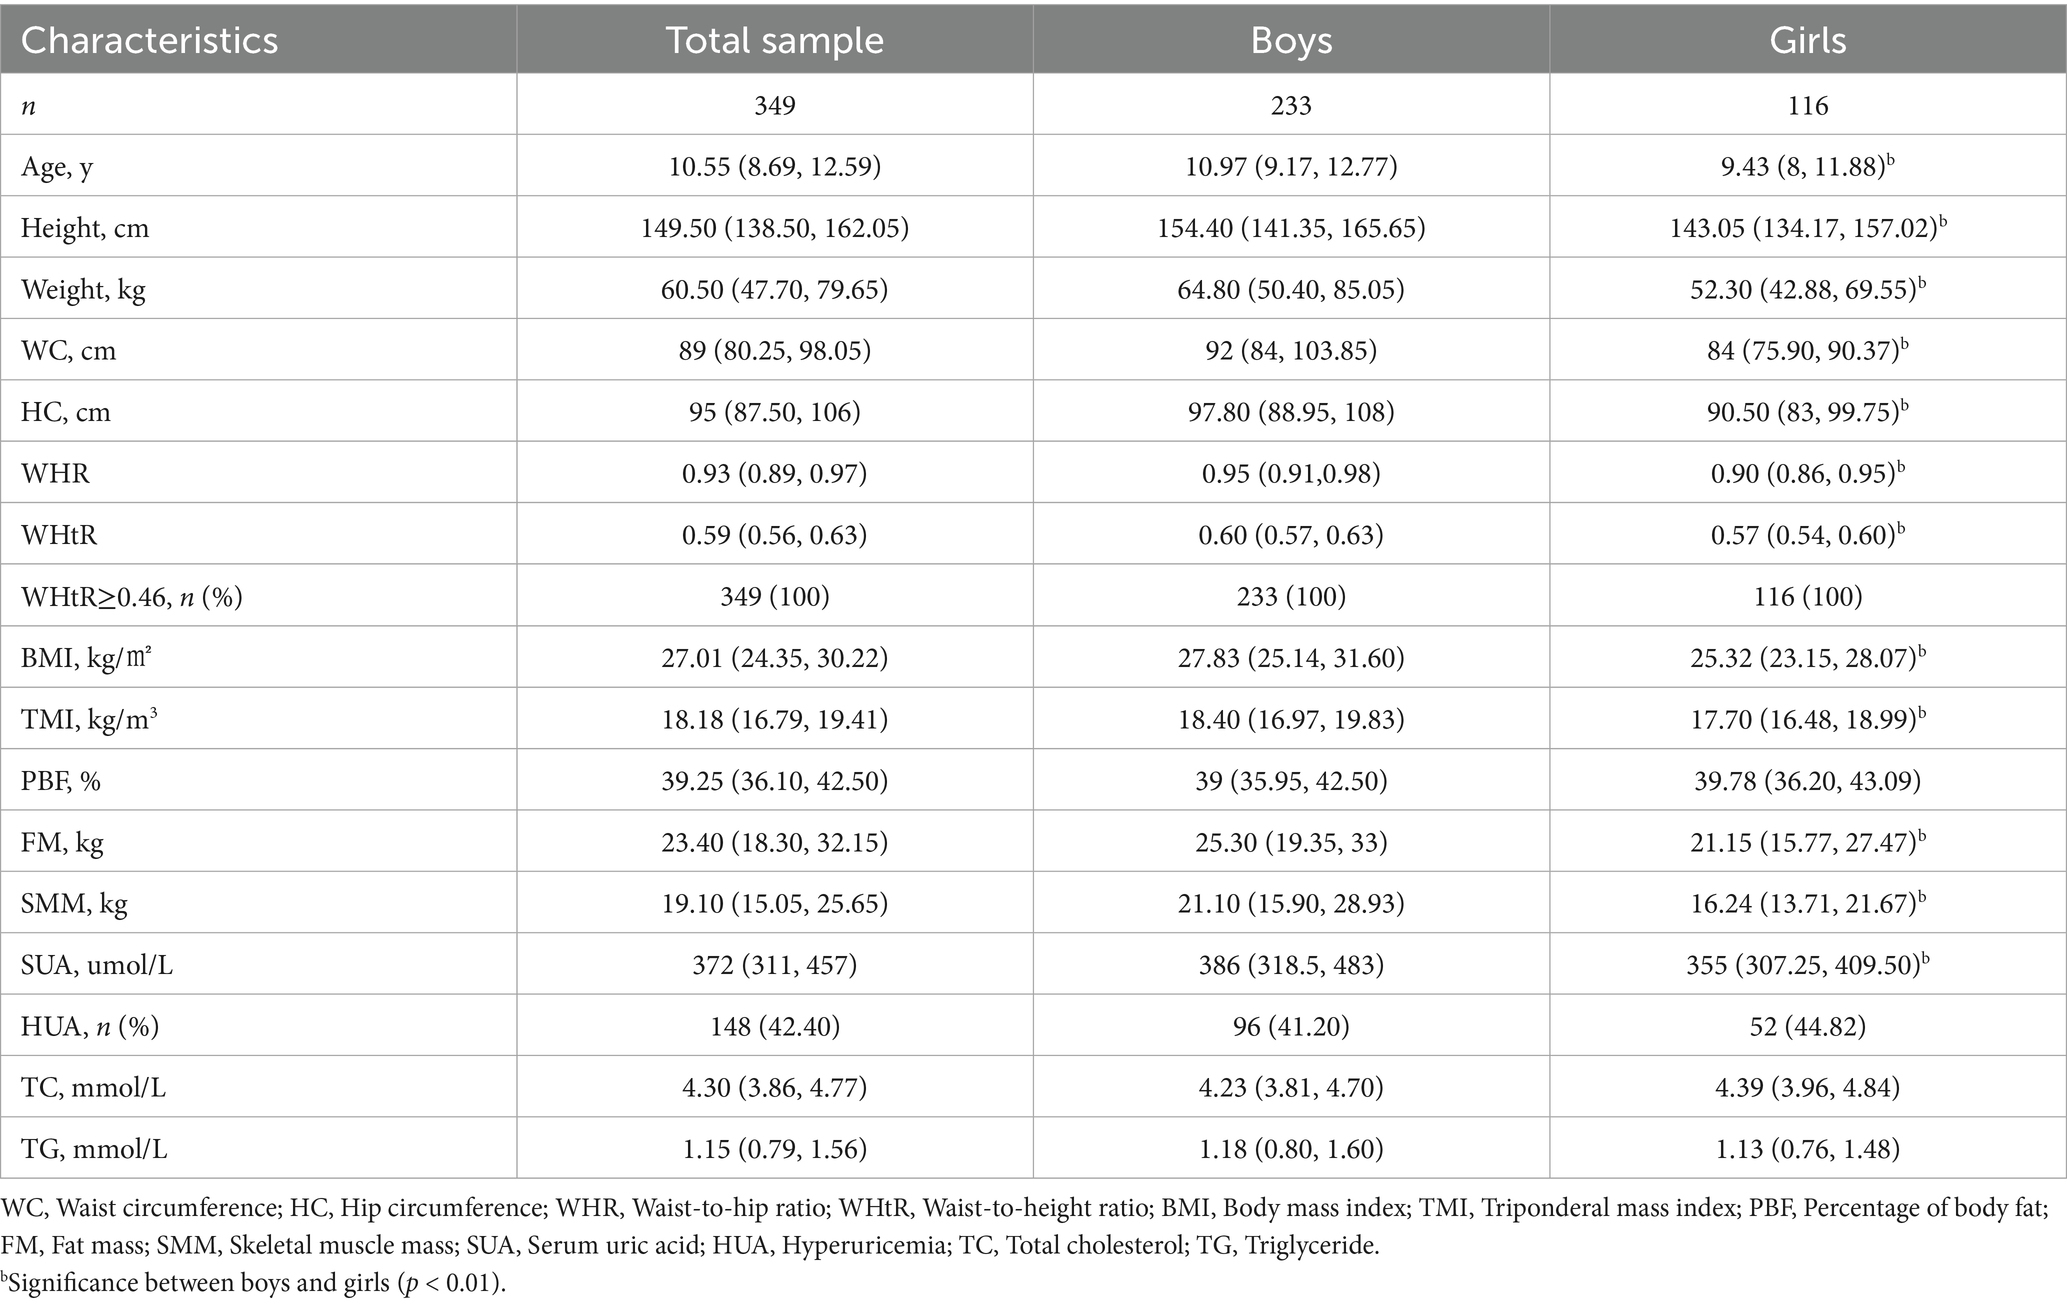
A total of 349 subjects with complete data were included in the study (233 boys and 116 girls) with an average age of 10.55 years (8.69, 12.59) (Table 1). The boys were older and had higher WC, HC, WHR, WHtR, BMI, TMI, FM, SMM, and SUA than the girls (p < 0.05). The overall estimated prevalence of HUA was 42.4% (148/349), with 41.20% (96/233) in boys and 44.82% (52/116) in girls. WHtR values were ≥ 0.46 in the entire sample.
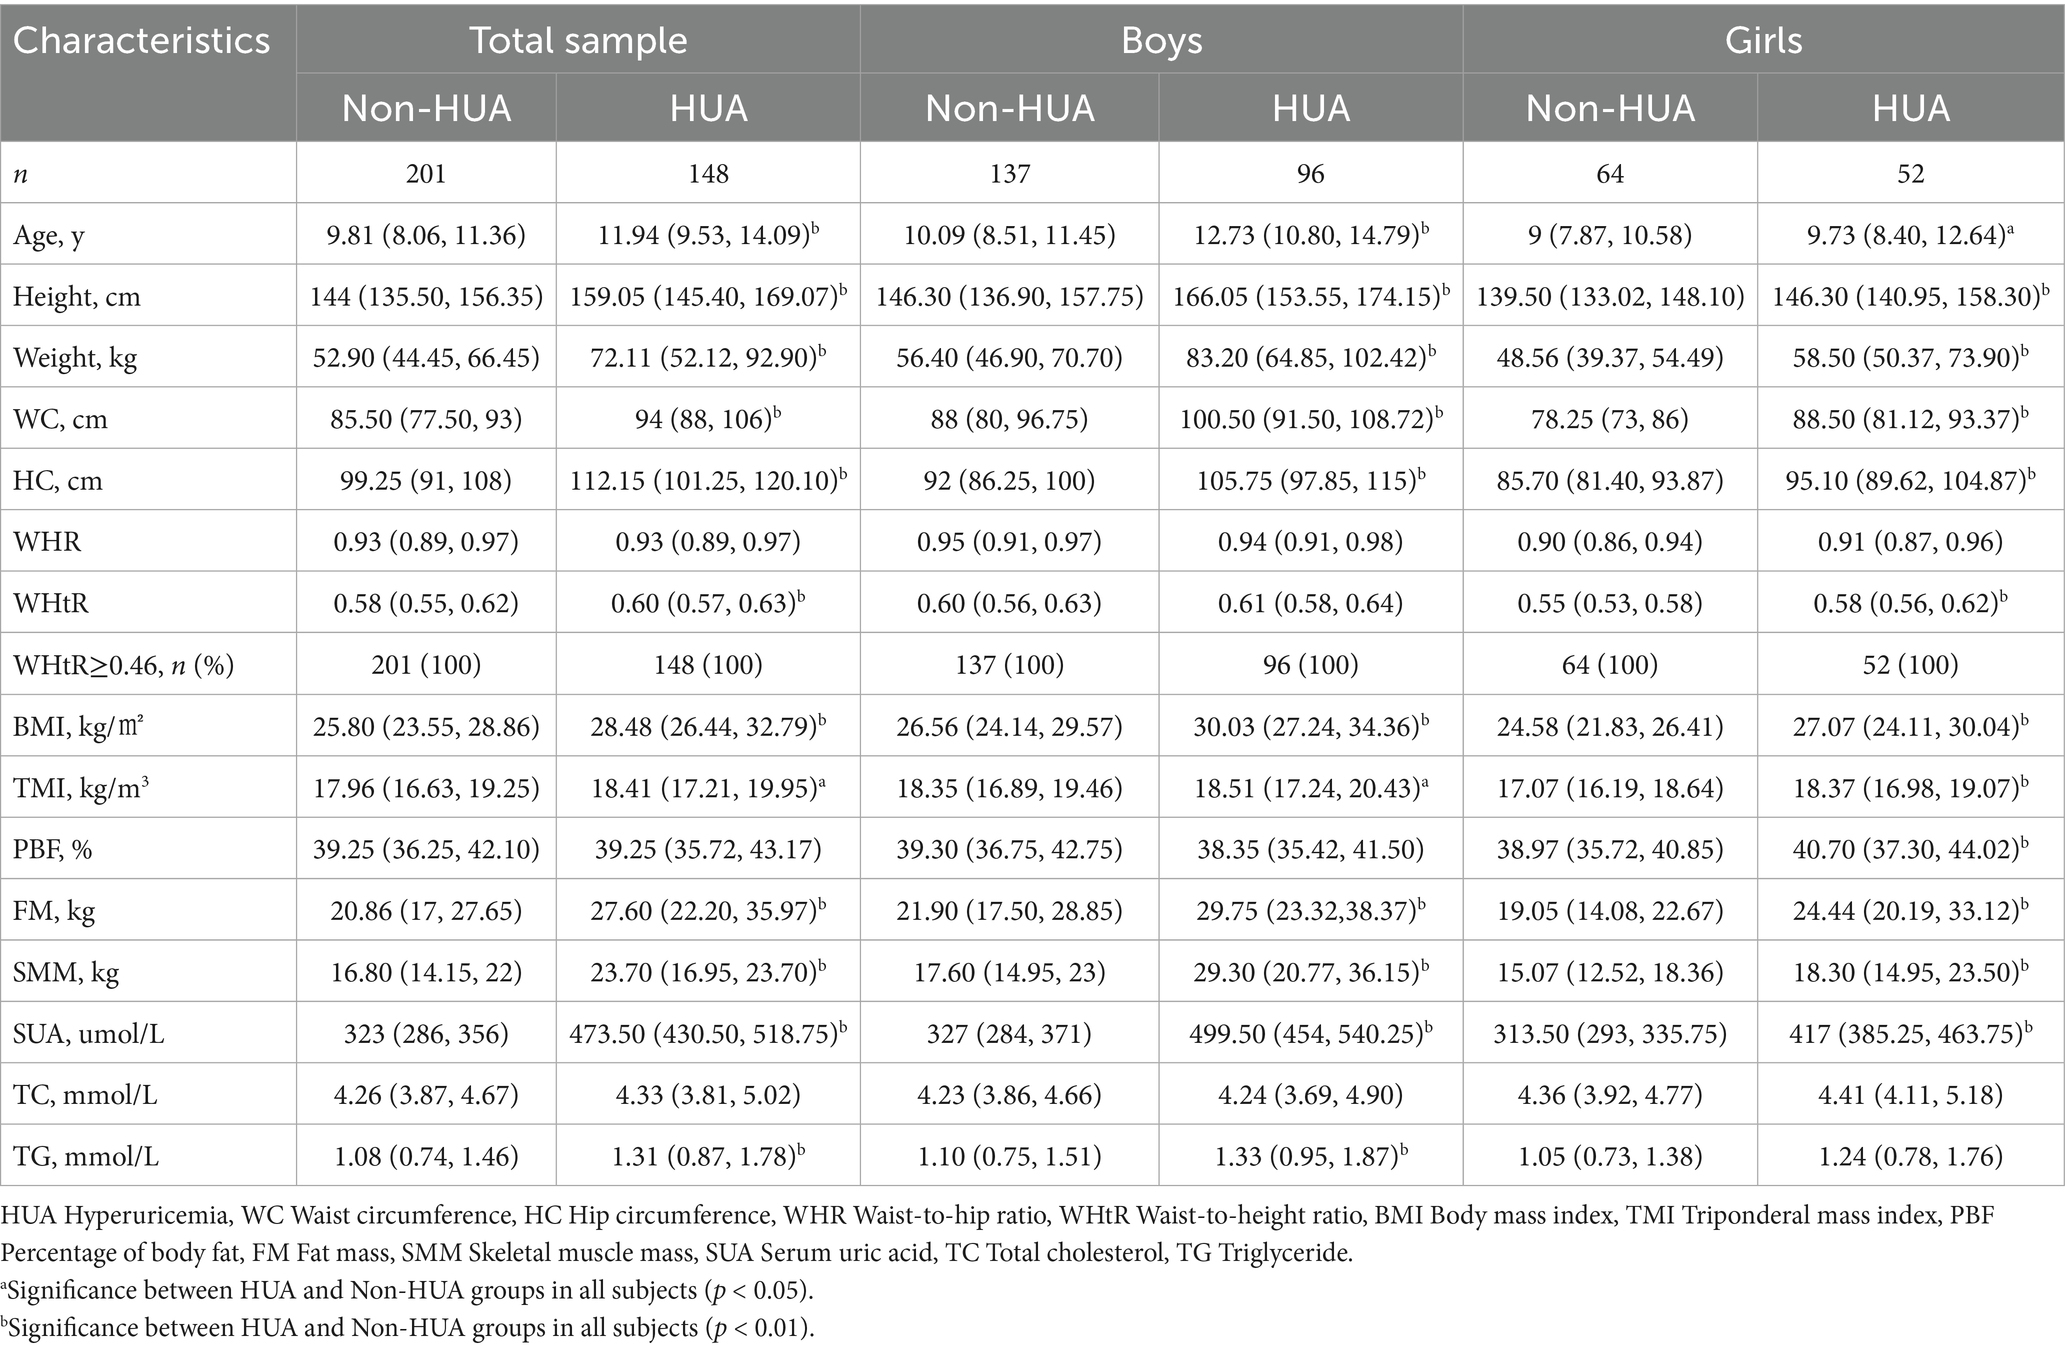
The age, WC, HC, WHtR, BMI, TMI, FM, SMM, and TG of the HUA group were higher than those of the non-HUA group (p < 0.05, Table 2). In boys, age, WC, HC, BMI, TMI, FM, SMM, and TG were higher in the HUA group than in the non-HUA group (p < 0.05, Table 2). In girls, age, WC, HC, WHtR, BMI, TMI, PBF, FM, SMM, and TG were higher in the HUA group than in the non-HUA group (p < 0.05, Table 2). In the total sample, WHR was not significantly higher in the HUA group than in the non-HUA group (p > 0.05, Table 2).
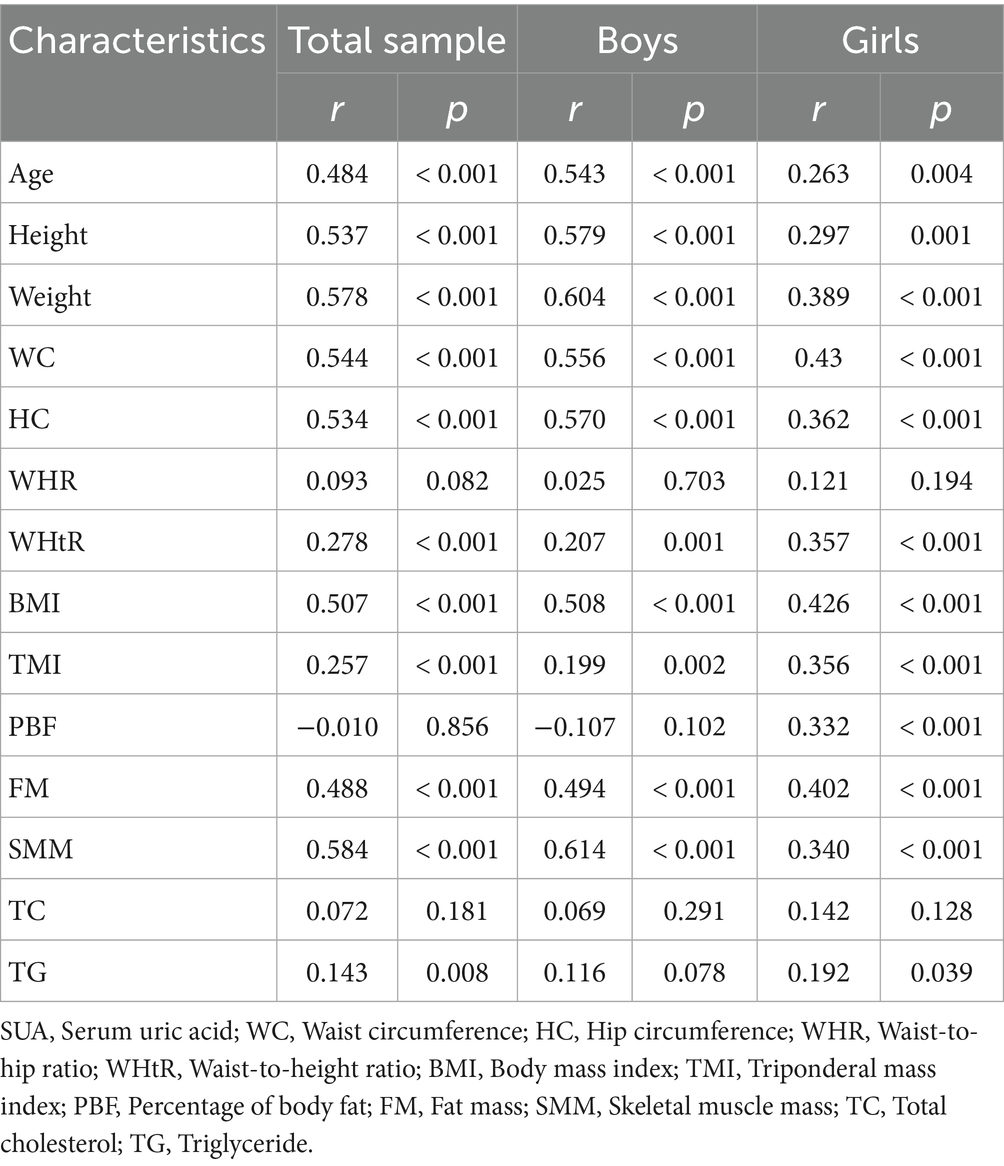
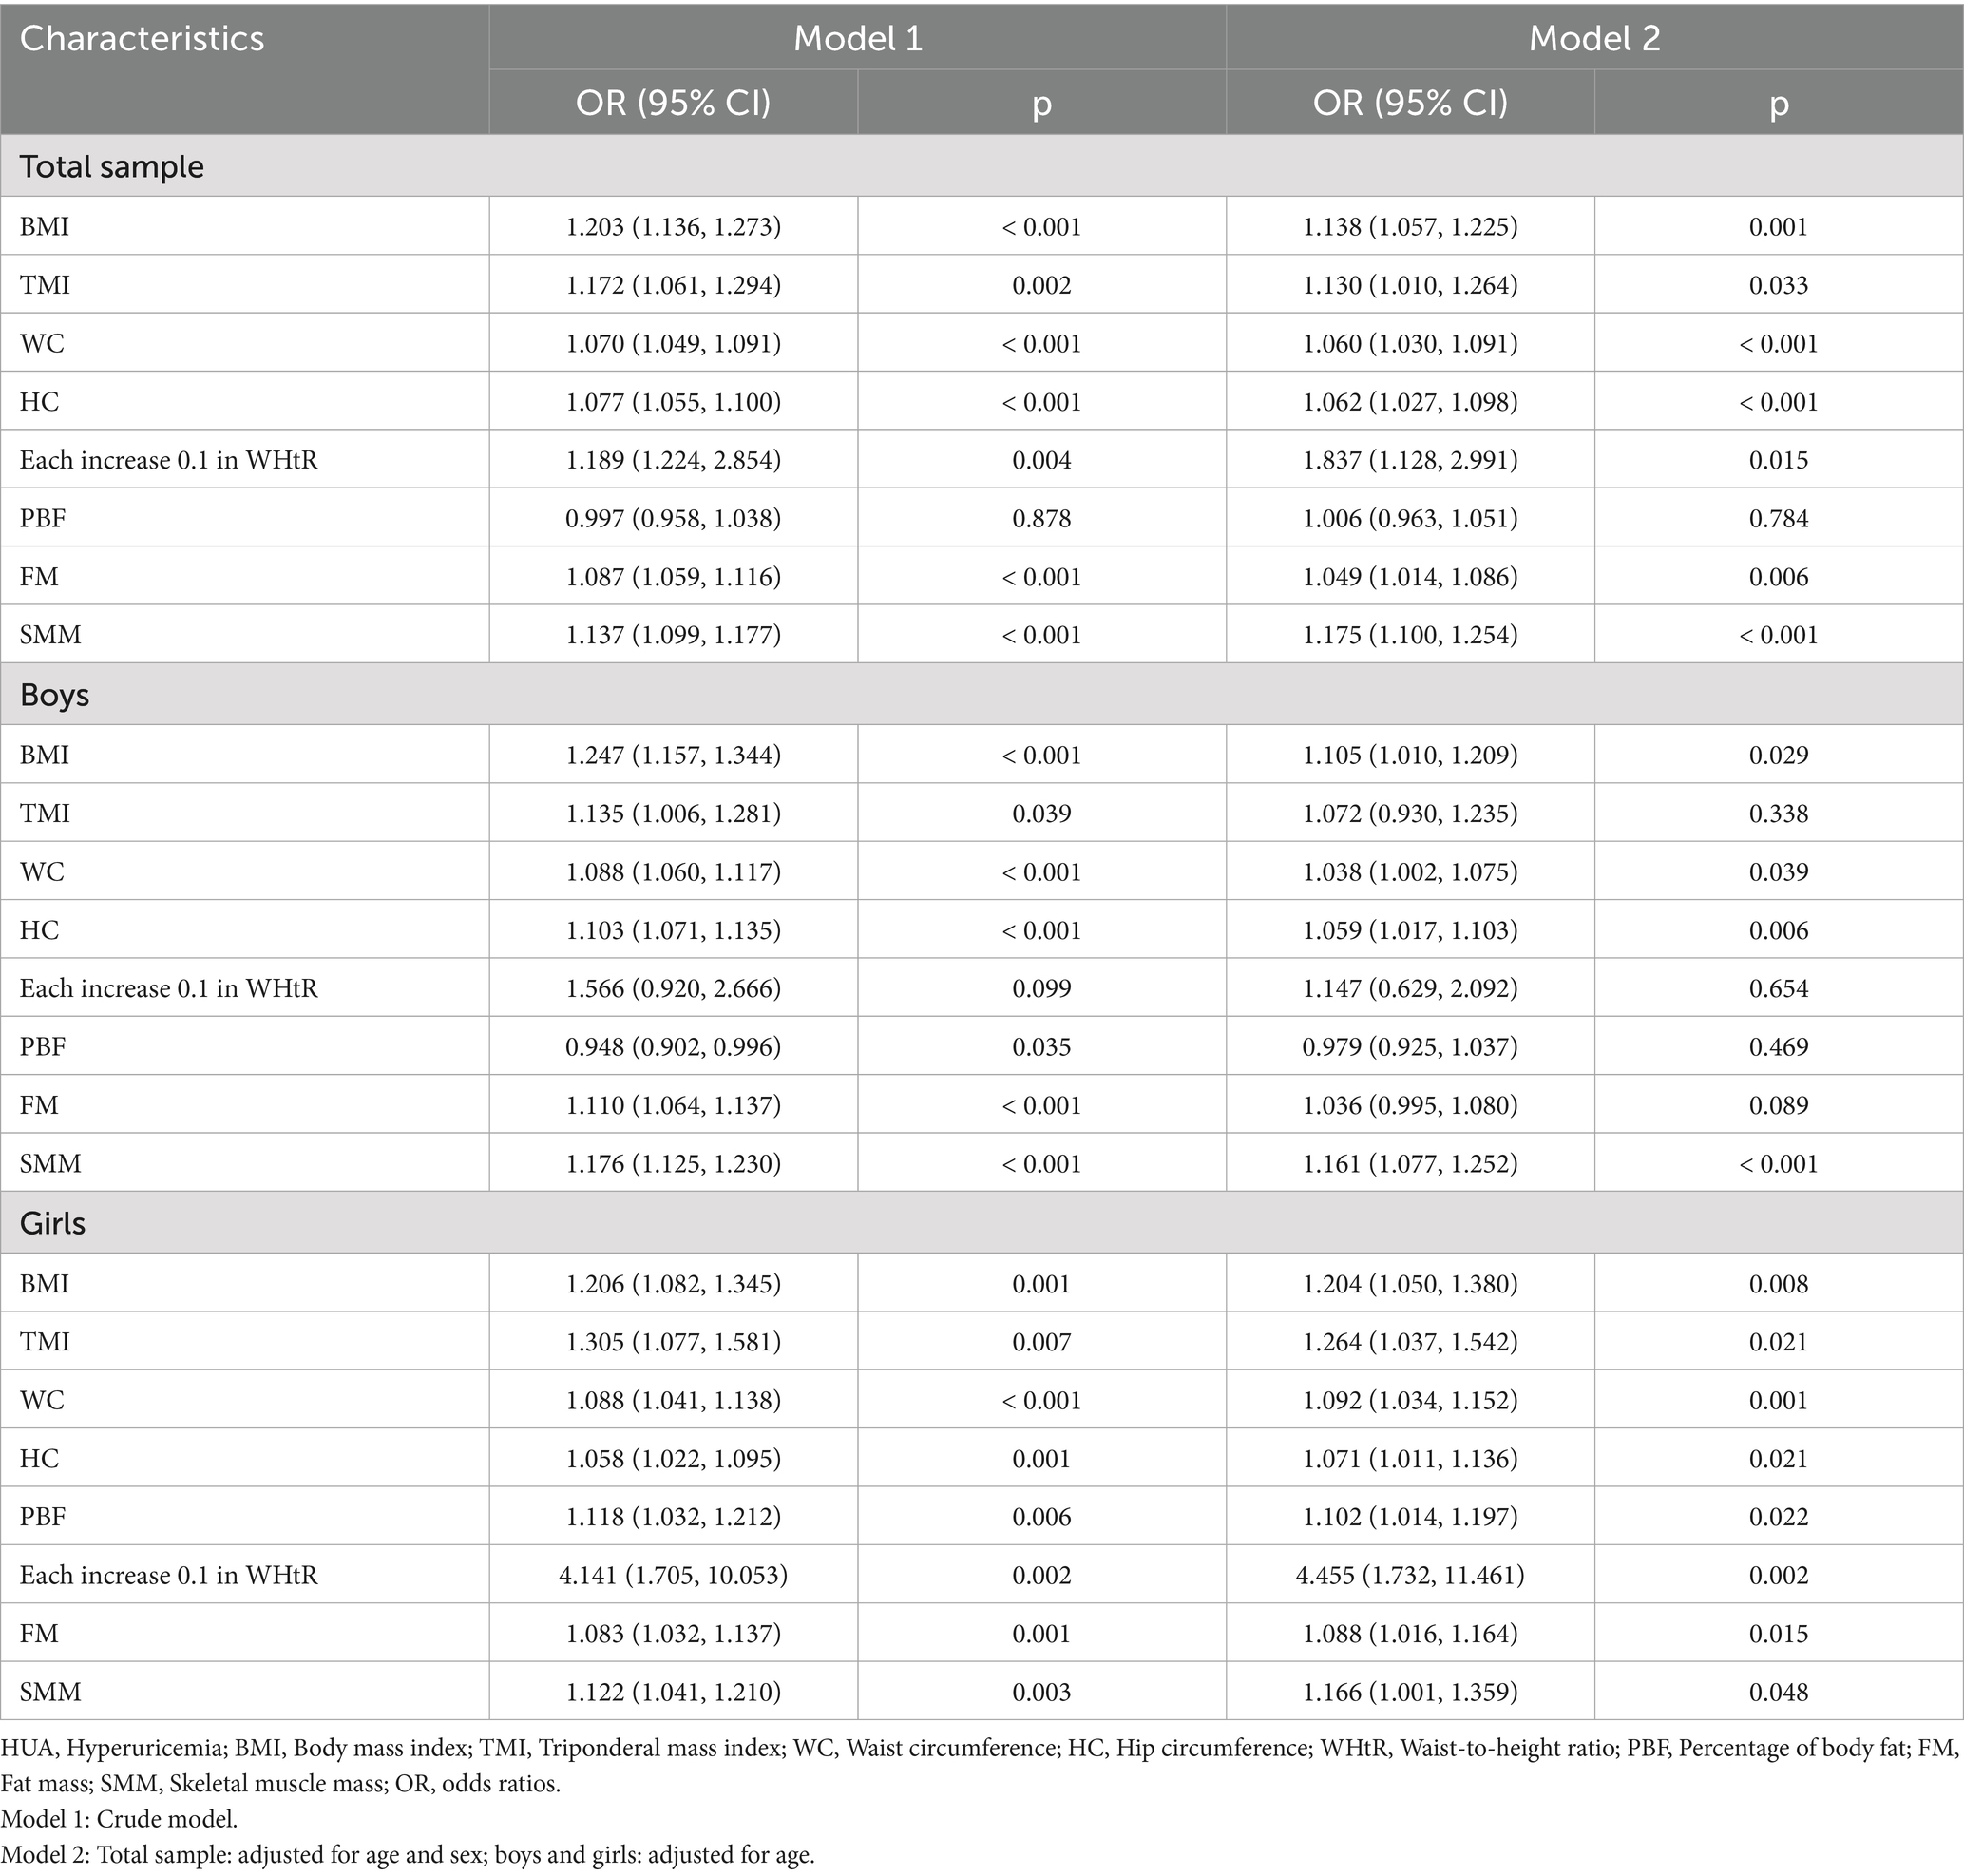
Correlation analysis (Table 3) showed that SUA was significantly positively correlated with age, WC, HC, WHtR, BMI, TMI, FM, SMM, and TG in the whole sample (p < 0.05). Further multiple regression analysis (Table 4) revealed that BMI, TMI, WC, HC, WHtR, FM, and SMM were independent risk factors for HUA after controlling for age and sex (Model 2, p < 0.05). In the different sex groups, after controlling for age, BMI, WC, HC, and SMM were positively correlated with the risk of HUA in boys with obesity. In addition, BMI, TMI, WC, HC, WHtR, PBF, FM, and SMM were positively associated with the risk of HUA in girls with obesity (Model 2, p < 0.05).
To further predict HUA, we performed ROC curve analysis on TMI (systemic obesity index) and WHtR (reflecting abdominal obesity) in the total sample (Figure 1). Results showed that TMI had a cut point value of 18.2 kg/m3 (sensitivity 58.1%; specificity 56.2%) and an area under the curve of 0.579 (95% CI: 0.518–0.639). Additionally, WHtR had a cut point value of 0.56 (sensitivity 83.8%; specificity 35.3%) and an area under the curve of 0.598 (95% CI: 0.538–0.657). Therefore, these values may be used to predict HUA (p < 0.05).
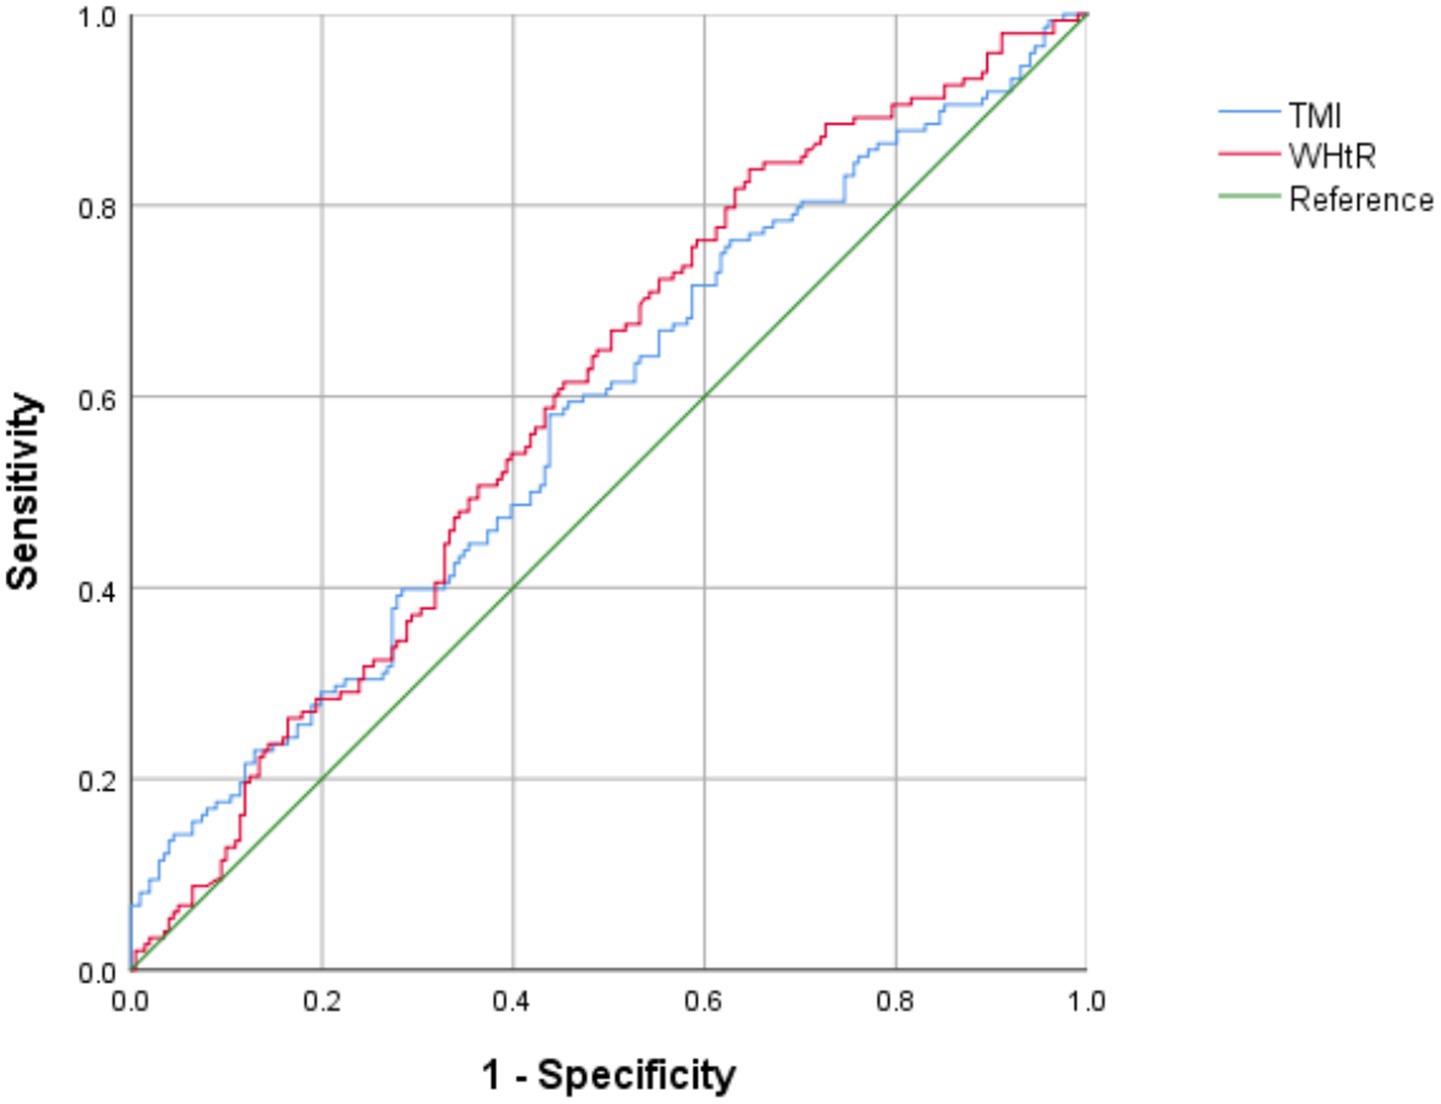
Figure 1. Receiver operating characteristic (ROC) curve of TMI and WHtR for identifying HUA in children and adolescents with obesity.
Discussion
In this study, we found that the incidence of HUA in children and adolescents with obesity was as high as 42.4%. By evaluating the possibility of multiple obesity indicators as risk indicators and predictors of HUA in children and adolescents, we found that different obesity indicators had different positive effects on HUA. We also determined that TMI (18.2 kg/m3) and WHtR (0.56) have the potential to predict HUA.
The incidence of HUA in children and adolescents varies by country due to different diagnostic criteria, ethnicities, lifestyles, and obesity incidence. In a Brazilian study of 1,750 overweight and obese participants aged 6–17, the overall prevalence of HUA was 10.3%, and the prevalence of HUA in subjects with overweight and obesity was 51.3% (10). This is higher than the 42.4% prevalence of HUA in children and adolescents with obesity in the current study. The difference is mainly because the reference standard for HUA in the above-referenced study was lower (5.5 mg/dL) than the standards used in our study (7 mg/dL in boys and 6 mg/dL in girls) (9, 15). As the prevalence of HUA is high in children and adolescents with overweight and obesity, it is necessary to determine appropriate obesity indicators for the early prediction of HUA.
In children and adolescents, BMI and BMI-Z scores are the most commonly used indicators of obesity. In a study of 1,329 participants (16), BMI and BMI-Z scores in both boys and girls with HUA were higher than those in the non-HUA group, which is consistent with our findings. Moreover, further multiple regression analysis found that BMI and BMI-Z score were independent risk factors for HUA (16, 17). Our study further explored the influence of BMI, HC, and WC on HUA by comparing BMI with HC and WC. Results showed that the BMI odds ratio (OR) value (1.138) was higher than those of HC (1.062) and WC (1.060), and this was consistent in boys and girls.
Although BMI and BMI-Z are widely used as diagnostic indicators of obesity in children and adolescents, they cannot be quickly calculated and evaluated due to the different criteria for different ages and sex. This further limits the use of BMI and BMI-Z as routine screening indicators. Many recent studies have shown that TMI is relatively stable in different age groups, significantly positively correlated with PBF, and more accurately assesses PBF. These are advantages that BMI does not have (13, 14). Therefore, we included TMI in this study of HUA in children and adolescents. Our results suggest that TMI is an independent risk factor for HUA and that TMI OR values are higher than those of WC and HC. Because TMI is a simple and relatively stable indicator across age groups, we further used ROC curve analysis to determine the optimal TMI cutoff value based on the ability to determine the presence of HUA. Our ROC curve analysis results suggest that a TMI value of 18.2 kg/m3 can be used to predict the occurrence of HUA to a certain extent. In other words, when the TMI value exceeds 18.2 kg/m3, it should draw the attention of parents. They can consider taking the child to the hospital for a check-up and having the SUA index tested.
BMI and TMI are indicators used to assess obesity, where WC and WHtR have been proposed as simple and effective measures of central obesity (18–20). This study found that HUA was closely and positively correlated with WC and WHtR. In addition, WC was found to be an independent risk factor for HUA, which is consistent with the results of Susann et al. (21) and our previous study (12). Further ROC curve analysis showed that WHtR effectively predicted the occurrence of HUA when the cutoff value of 0.56 was reached. Regarding body composition indicators, the results showed that FM was an independent risk factor for HUA, further explaining why WHtR may play a predictive role; this was more obvious in girls. Moreover, this study found that TG was higher in the HUA group than in the non-HUA group, which may be related to higher FM in the HUA group. However, the mechanism involving the interaction between SUA metabolism, lipid metabolism, and adipogenesis remains unclear and requires further study (22).
Importantly, previous studies have shown that TMI is positively associated with an increase in WHtR in individuals aged 7–20 (23, 24). In addition, TMI has been shown to accurately identify central obesity in children and adolescents, exceeding the accuracy of BMI when WHtR is used as a central obesity reference indicator (25). Therefore, in the prediction of HUA in children and adolescents with obesity, TMI can be used as an indicator of systemic obesity for predicting the risk of HUA. This finding suggests that WHtR, as an indicator of abdominal obesity, can be combined with TMI to predict the risk of HUA.
The occurrence of HUA is not only related to obesity and FM but also to muscle mass. As muscle is a source of purines (26, 27), which plays an important role in promoting the occurrence of HUA. This explains our identification of SMM as an independent risk factor for HUA, both in the general population and in boys and girls. In addition, larger HC generally reflects higher muscle mass (28, 29), which is a potential explanation for the greater effect of HC than WC on HUA. Furthermore, our research shows that the SMM value of boys is higher than that of girls, and the OR value of SMM for boys is higher than that for girls. This result can explain to a certain extent the reason why the OR value of TMI is higher in girls than in boys.
This study has some limitations. First, this was a cross-sectional single-center study, and further multi-center prospective studies are needed to prove the relationship between different obesity indicators and HUA. In addition, indicators such as the dietary habits, physical activities, socioeconomic status and pubertal development of the participants were not included in this study. This may have caused us to overlook some HUA risk factors. Overall, obesity indicators and SUA levels can be considered a profile response to diet, lifestyle and other indicators. Third, unfortunately, blood glucose and insulin were not included in this study. In our future research, we will further conduct studies on the correlation between hyperuricemia and blood glucose and insulin. Fourth, our data were collected at a single center, which are not a representative sample of obese children and adolescents from other regions or ethnicities. In future research, we will conduct multi-center studies and further incorporate indicators such as diet, exercise, economy and genetics (30).
Conclusion
In conclusion, the prevalence of HUA was higher in children and adolescents with obesity, but there was no difference between the sexes. In this population, BMI, TMI, WC, HC, WHtR, FM, and SMM were identified as the main risk factors for the occurrence of HUA. Furthermore, it is worth noting that considering TMI and WHtR are relatively stable and easy to calculate in all ages, they have the potential to be used as predictive indicators of HUA in children and adolescents with obesity. However, in the future, multi-center prospective studies will still be needed for further research and verification.
Data availability statement
The data that support the findings of this study are available from the corresponding author upon reasonable request. Requests to access these datasets should be directed to bml1eWFuZ0B4aW5odWFtZWQuY29tLmNu.
Ethics statement
The studies involving humans were approved by Ethics Committee of the Xinhua Hospital, School of Medicine, Shanghai Jiao Tong University. The studies were conducted in accordance with the local legislation and institutional requirements. Written informed consent for participation in this study was provided by the participants’ legal guardians/next of kin.
Author contributions
YN: Conceptualization, Data curation, Formal analysis, Funding acquisition, Investigation, Methodology, Project administration, Validation, Writing – original draft, Writing – review & editing. YZ: Data curation, Methodology, Supervision, Writing – review & editing. JS: Data curation, Formal analysis, Funding acquisition, Methodology, Project administration, Supervision, Writing – review & editing. YF: Funding acquisition, Methodology, Supervision, Writing – review & editing. QT: Conceptualization, Data curation, Funding acquisition, Investigation, Methodology, Project administration, Software, Supervision, Validation, Writing – review & editing. XS: Conceptualization, Formal analysis, Investigation, Methodology, Project administration, Supervision, Validation, Visualization, Writing – original draft, Writing – review & editing.
Funding
The author(s) declare that financial support was received for the research and/or publication of this article. This study was supported by the 2023 Shanghai Municipal Health Commission Health Industry Clinical Research Special Project (No. 20234Y0038).
Acknowledgments
The authors acknowledge all the children and adolescents who participated in this study and their parents.
Conflict of interest
The authors declare that the research was conducted in the absence of any commercial or financial relationships that could be construed as a potential conflict of interest.
Generative AI statement
The authors declare that no Gen AI was used in the creation of this manuscript.
Publisher’s note
All claims expressed in this article are solely those of the authors and do not necessarily represent those of their affiliated organizations, or those of the publisher, the editors and the reviewers. Any product that may be evaluated in this article, or claim that may be made by its manufacturer, is not guaranteed or endorsed by the publisher.
References
1. Johnson, RJ, Lanaspa, MA, and Gaucher, EA. Uric acid: a danger signal from the RNA world that may have a role in the epidemic of obesity, metabolic syndrome, and cardiorenal disease: evolutionary considerations. Semin Nephrol. (2011) 31:394–9. doi: 10.1016/j.semnephrol.2011.08.002
2. Kanbay, M, Segal, M, Afsar, B, Kang, DH, Rodriguez-Iturbe, B, and Johnson, RJ. The role of uric acid in the pathogenesis of human cardiovascular disease. Heart. (2013) 99:759–66. doi: 10.1136/heartjnl-2012-302535
3. Gustafsson, D, and Unwin, R. The pathophysiology of hyperuricaemia and its possible relationship to cardiovascular disease, morbidity and mortality. BMC Nephrol. (2013) 14:164. doi: 10.1186/1471-2369-14-164
4. Mortada, I. Hyperuricemia, type 2 diabetes mellitus, and hypertension: an emerging association. Curr Hypertens Rep. (2017) 19:69. doi: 10.1007/s11906-017-0770-x
5. Rao, J, Yan, Y, Cheng, H, Hou, D, Zhao, X, Shan, X, et al. Uric acid mediated the relationship between obesity and hypertension in children and adolescents: a population-based cohort study. Nutr Metab Cardiovasc Dis. (2023) 34:214. doi: 10.1016/j.numecd.2023.10.007
6. Zykova, SN, Storhaug, HM, Toft, I, Chadban, SJ, Jenssen, TG, and White, SL. Cross-sectional analysis of nutrition and serum uric acid in two Caucasian cohorts: the Aus Diab study and the Tromsø study. Nutr J. (2015) 14:1–11. doi: 10.1186/s12937-015-0032-1
7. Reis, LN, Borfe, L, Brand, C, Franke, SI, Renner, JD, Gaya, AR, et al. Food consumption is associated with hyperuricemia in boys. High Blood Press Cardiovasc Prev. (2020) 27. doi: 10.1007/s40292-020-00406-w
8. Jørgensen, RM, Bøttger, B, Vestergaard, ET, Kremke, B, Bahnsen, RF, Nielsen, BW, et al. Uric acid is elevated in children with obesity and decreases after weight loss. Front Pediatr. (2022) 9:814166. doi: 10.3389/fped.2021.814166
9. Rao, J, Ye, P, Lu, J, Chen, B, Li, N, Zhang, H, et al. Prevalence and related factors of hyperuricaemia in Chinese children and adolescents: a pooled analysis of 11 population-based studies. Ann Med. (2022) 54:1608. doi: 10.1080/07853890.2022.2083670
10. Moulin-Mares, SR, Oliosa, PR, Faria, ER, Zago-Gomes, MP, and Mill, JG. Association of uric acid with cardiovascular risk in Brazilian children and adolescents. Nutr Metab Cardiovasc Dis. (2020) 31:314. doi: 10.1016/j.numecd.2020.09.012
11. Qian, Y, Kong, YW, Wan, NJ, and Yan, YK. Associations between body mass index in different childhood age periods and hyperuricemia in young adulthood: the China health and nutrition survey cohort study. World J Pediatr. (2022) 18:680. doi: 10.1007/s12519-022-00573-x
12. Xie, L, Mo, PK, Tang, Q, Zhao, X, Zhao, X, Cai, W, et al. Skeletal muscle mass has stronger association with the risk of hyperuricemia than body fat mass in obese children and adolescents. Front Nutr. (2022) 9:792234. doi: 10.3389/fnut.2022.792234
13. Peterson, CM, Su, H, Thomas, DM, Heo, M, Golnabi, AH, Pietrobelli, A, et al. Tri-ponderal mass index vs body mass index in estimating body fat during adolescence. JAMA Pediatr. (2017) 171:629–36. doi: 10.1001/jamapediatrics.2017.0460
14. Niu, Y, Zhang, Y, Sheng, J, Lu, W, Li, J, Mao, X, et al. Tri-ponderal mass index as a screening tool for obesity prediction in children aged 6-9 years. Front Endocrinol (Lausanne). (2023) 14:1277125. doi: 10.3389/fendo.2023.1277125
15. WS/T 560-2017 dietary guide for hyperuricemia and gout patients. Beijing, China: China Standard Press; (2017).
16. Liu, M, Cao, B, Luo, Q, et al. A gender-, age-, and weight status-specific analysis of the high prevalence of hyperuricemia among Chinese children and adolescents with obesity. Diabetes Metab Syndr Obes. (2024) 17:381. doi: 10.2147/DMSO.S448638
17. Xuemei, G, Ningting, X, Xueming, J, et al. Analysis of the prevalence and influencing factors of hyperuricemia in children and adolescents aged 6-17 years in northeastern Sichuan Province. J Pediatr. (2023) 99:604. doi: 10.1016/j.jped.2023.05.001
18. Lo, K, Wong, M, Khalechelvam, P, and Tam, W. Waist-to-height ratio, body mass index and waist circumference for screening paediatric cardio-metabolic risk factors: a meta-analysis. Obes Rev. (2016) 17:1258–75. doi: 10.1111/obr.12456
19. Ashwell, M, and Gibson, S. A proposal for a primary screening tool: ‘keep your waist circumference to less than half your height.’. BMC Med. (2014) 12:207. doi: 10.1186/s12916-014-0207-1
20. Xin'nan, Z, Kelishadi, R, Hong, YM, et al. Establishing international optimal cut-offs of waist-to-height ratio for predicting cardiometabolic risk in children and adolescents aged 6-18 years. BMC Med. (2023) 21:442. doi: 10.1186/s12916-023-03169-y
21. Susann, W-B, Susanna, W, Paul, W, et al. Uric acid and gamma-glutamyl-transferase in children and adolescents with obesity: association to anthropometric measures and cardiometabolic risk markers depending on pubertal stage, sex, degree of weight loss and type of patient care: evaluation of the adiposity patient follow-up registry. Pediatr Obes. (2022) 18:e12989. doi: 10.1111/ijpo.12989
22. Ishiro, M, Takaya, R, Mori, Y, Takitani, K, Kono, Y, Okasora, K, et al. Association of uric acid with obesity and endothelial dysfunction in children and early adolescents. Ann Nutr Metab. (2013) 62:169. doi: 10.1159/000346227
23. Jiang, Y, Dou, YL, Xiong, F, Zhang, L, Zhu, GH, Wu, T, et al. Waist-to-height ratio remains an accurate and practical way of identifying cardiometabolic risks in children and adolescents. Acta Paediatr. (2018) 107:1629–34. doi: 10.1111/apa.14323
24. Shim, YS. The relationship between tri-ponderal mass index and metabolic syndrome and its components in youth aged 10-20 years. Sci Rep. (2019) 9:14462. doi: 10.1038/s41598-019-50987-3
25. Tabib, A, Samiei, N, Ghavidel, AA, Bakhshandeh, H, Noohi, F, Hosseini, S, et al. Reference percentiles for tri-ponderal mass index and its association with general and abdominal obesity among Iranian children and adolescents: A report from the SHED LIGHT study. Am J Hum Biol. (2023) 35:e23885. doi: 10.1002/ajhb.23885
26. Lowenstein, J. Ammonia production in muscle and other tissues: the purine nucleotide cycle. Physiol Rev. (1972) 52:382–414. doi: 10.1152/physrev.1972.52.2.382
27. Moulin-Mares, SRA, Zaniqueli, D, Oliosa, PR, Alvim, RO, Bottoni, JP, and Mill, JG. Uric acid reference values: report on 1750 healthy Brazilian children and adolescents. Pediatr Res. (2021) 89:1855–60. doi: 10.1038/s41390-020-01185-9
28. Seidell, J, Han, T, Feskens, EJ, and Lean, M. Narrow hips and broad waist circumferences independently contribute to increased risk of non-insulin-dependent diabetes mellitus. J Intern Med. (1997) 242:401–6. doi: 10.1046/j.1365-2796.1997.00235.x
29. Han, T, Bijnen, F, Lean, M, and Seidell, J. Separate associations of waist and hip circumference with lifestyle factors. Int J Epidemiol. (1998) 27:422–30. doi: 10.1093/ije/27.3.422
Keywords: hyperuricemia, triponderal mass index, waist-to-height ratio, children and adolescents, obesity
Citation: Niu Y, Zhang Y, Sheng J, Feng Y, Tang Q and Shen X (2025) Triponderal mass index can be used as a potential tool to predict the risk of hyperuricemia in children and adolescents with obesity: a population-based study. Front. Nutr. 12:1544209. doi: 10.3389/fnut.2025.1544209
Edited by:
Paula Ravasco, Catholic University of Portugal, PortugalReviewed by:
Leila Sadeghi-Reeves, Independent Reviewer, Sion, SwitzerlandJan Kubicek, VSB-Technical University of Ostrava, Czechia
Nilton Carlos Machado, São Paulo State University, Brazil
Gianvincenzo Zuccotti, University of Milan, Italy
Yin Li, Tianjin University, China
Ming Ming Guo, Beijing Normal University, China
Copyright © 2025 Niu, Zhang, Sheng, Feng, Tang and Shen. This is an open-access article distributed under the terms of the Creative Commons Attribution License (CC BY). The use, distribution or reproduction in other forums is permitted, provided the original author(s) and the copyright owner(s) are credited and that the original publication in this journal is cited, in accordance with accepted academic practice. No use, distribution or reproduction is permitted which does not comply with these terms.
*Correspondence: Xiuhua Shen, c3JhY2hlbEAxMjYuY29t; Qingya Tang, dGFuZ3Fpbmd5YUB4aW5odWFtZWQuY29tLmNu; Yi Feng, ZmVuZ3lpQHhpbmh1YW1lZC5jb20uY24=
†These authors have contributed equally to this work and share first authorship
 Yang Niu
 Yajie Zhang
 Jinye Sheng1†
 Yi Feng
 Xiuhua Shen