In the published article, there was an error in Figure 2 as published. Figure 2 has been incorrectly replaced with Figure 3. The corrected Figure 2 and its caption appear below.
Figure 2
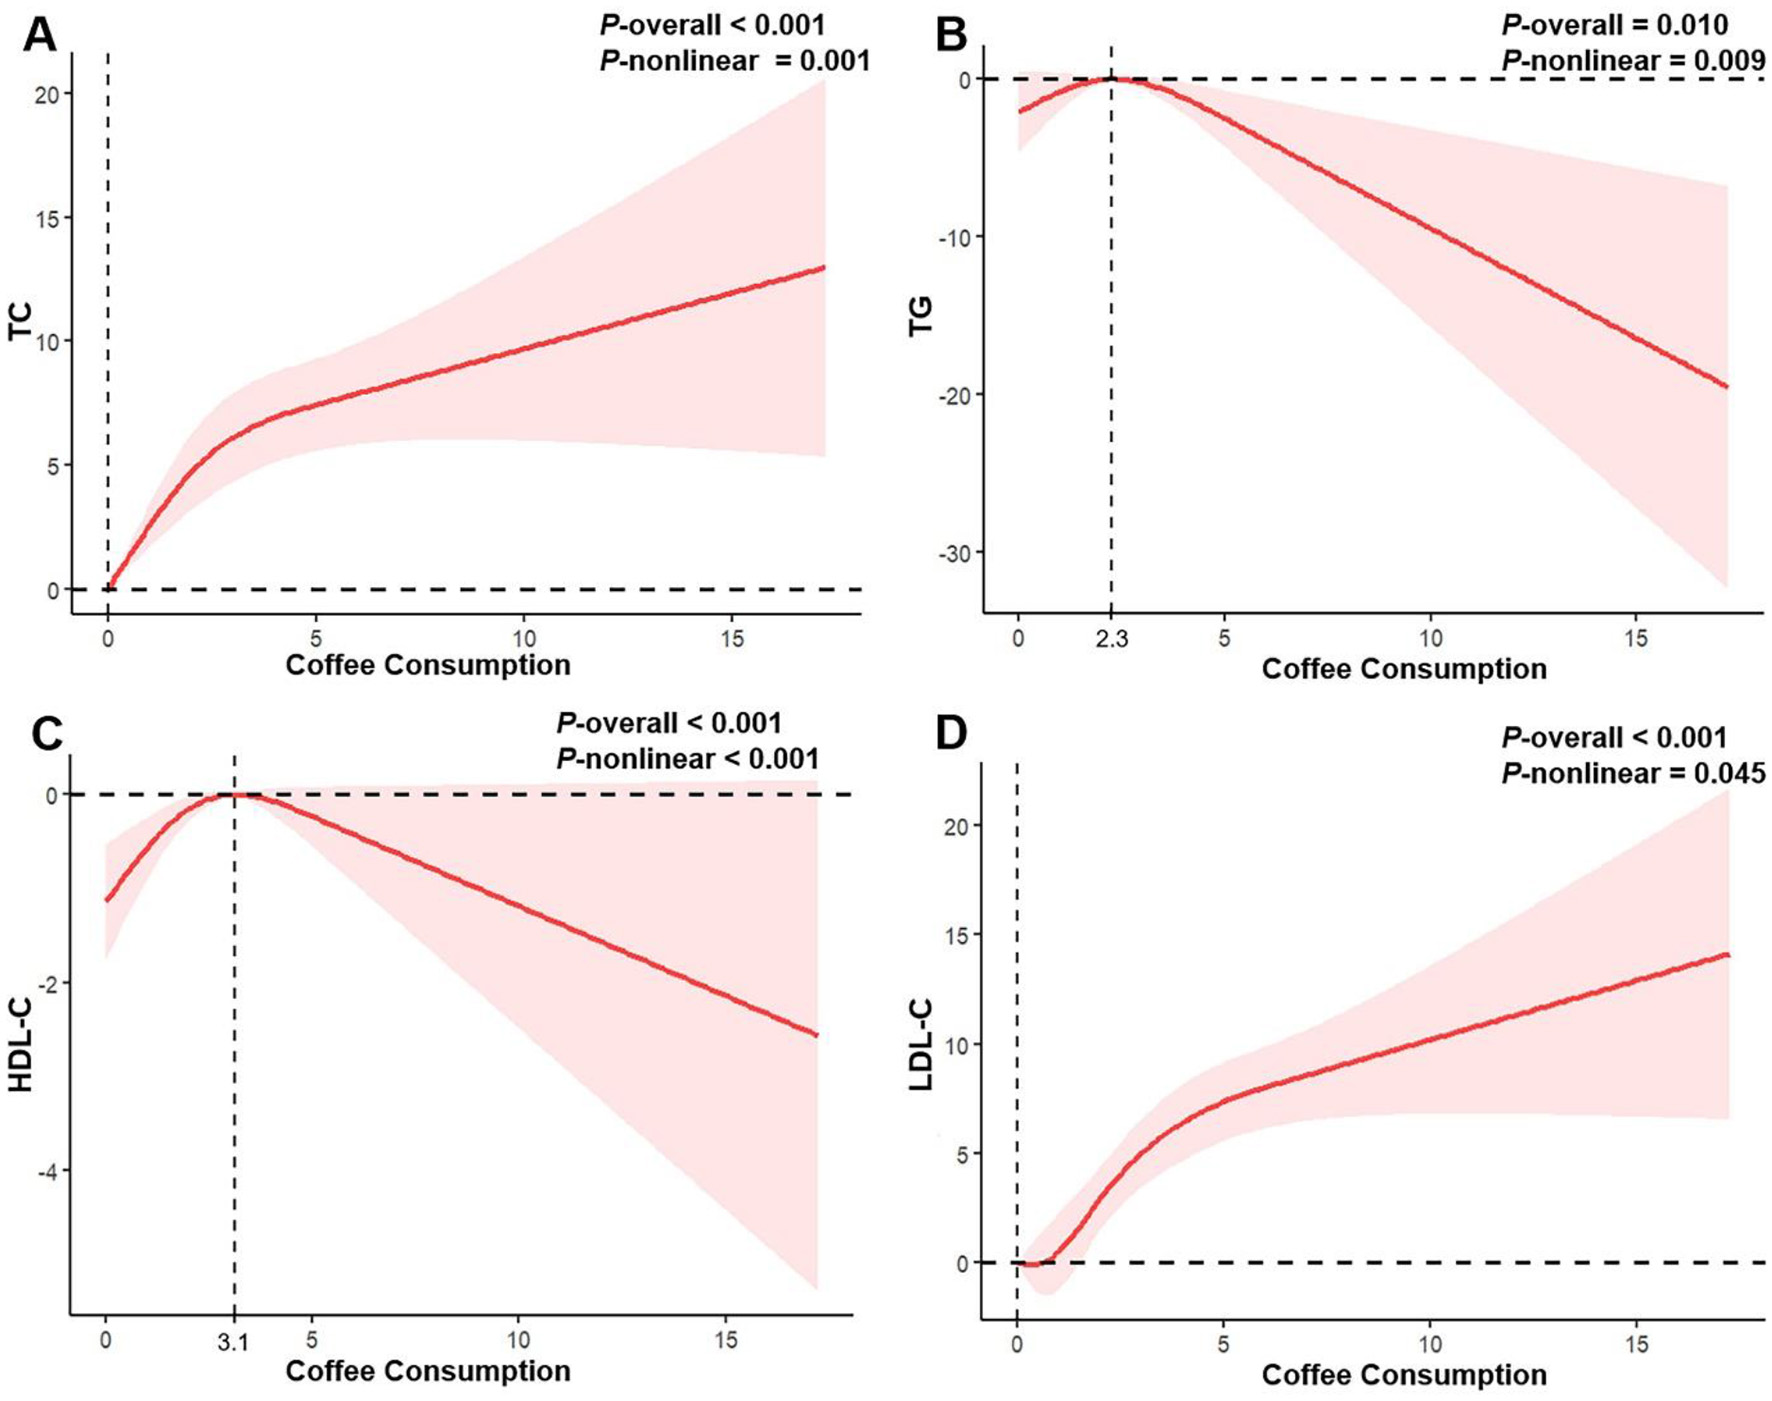
Restricted cubic spline regression analysis of the association between coffee consumption and serum lipid profile in all participants. The solid red lines represent the estimated associations, and the pink shaded regions denote the corresponding 95% confidence intervals. (A) Coffee consumption and total cholesterol; (B) Coffee consumption and triglycerides; (C) Coffee consumption and high-density lipoprotein cholesterol; (D) Coffee consumption and low-density lipoprotein cholesterol.
Figure 3
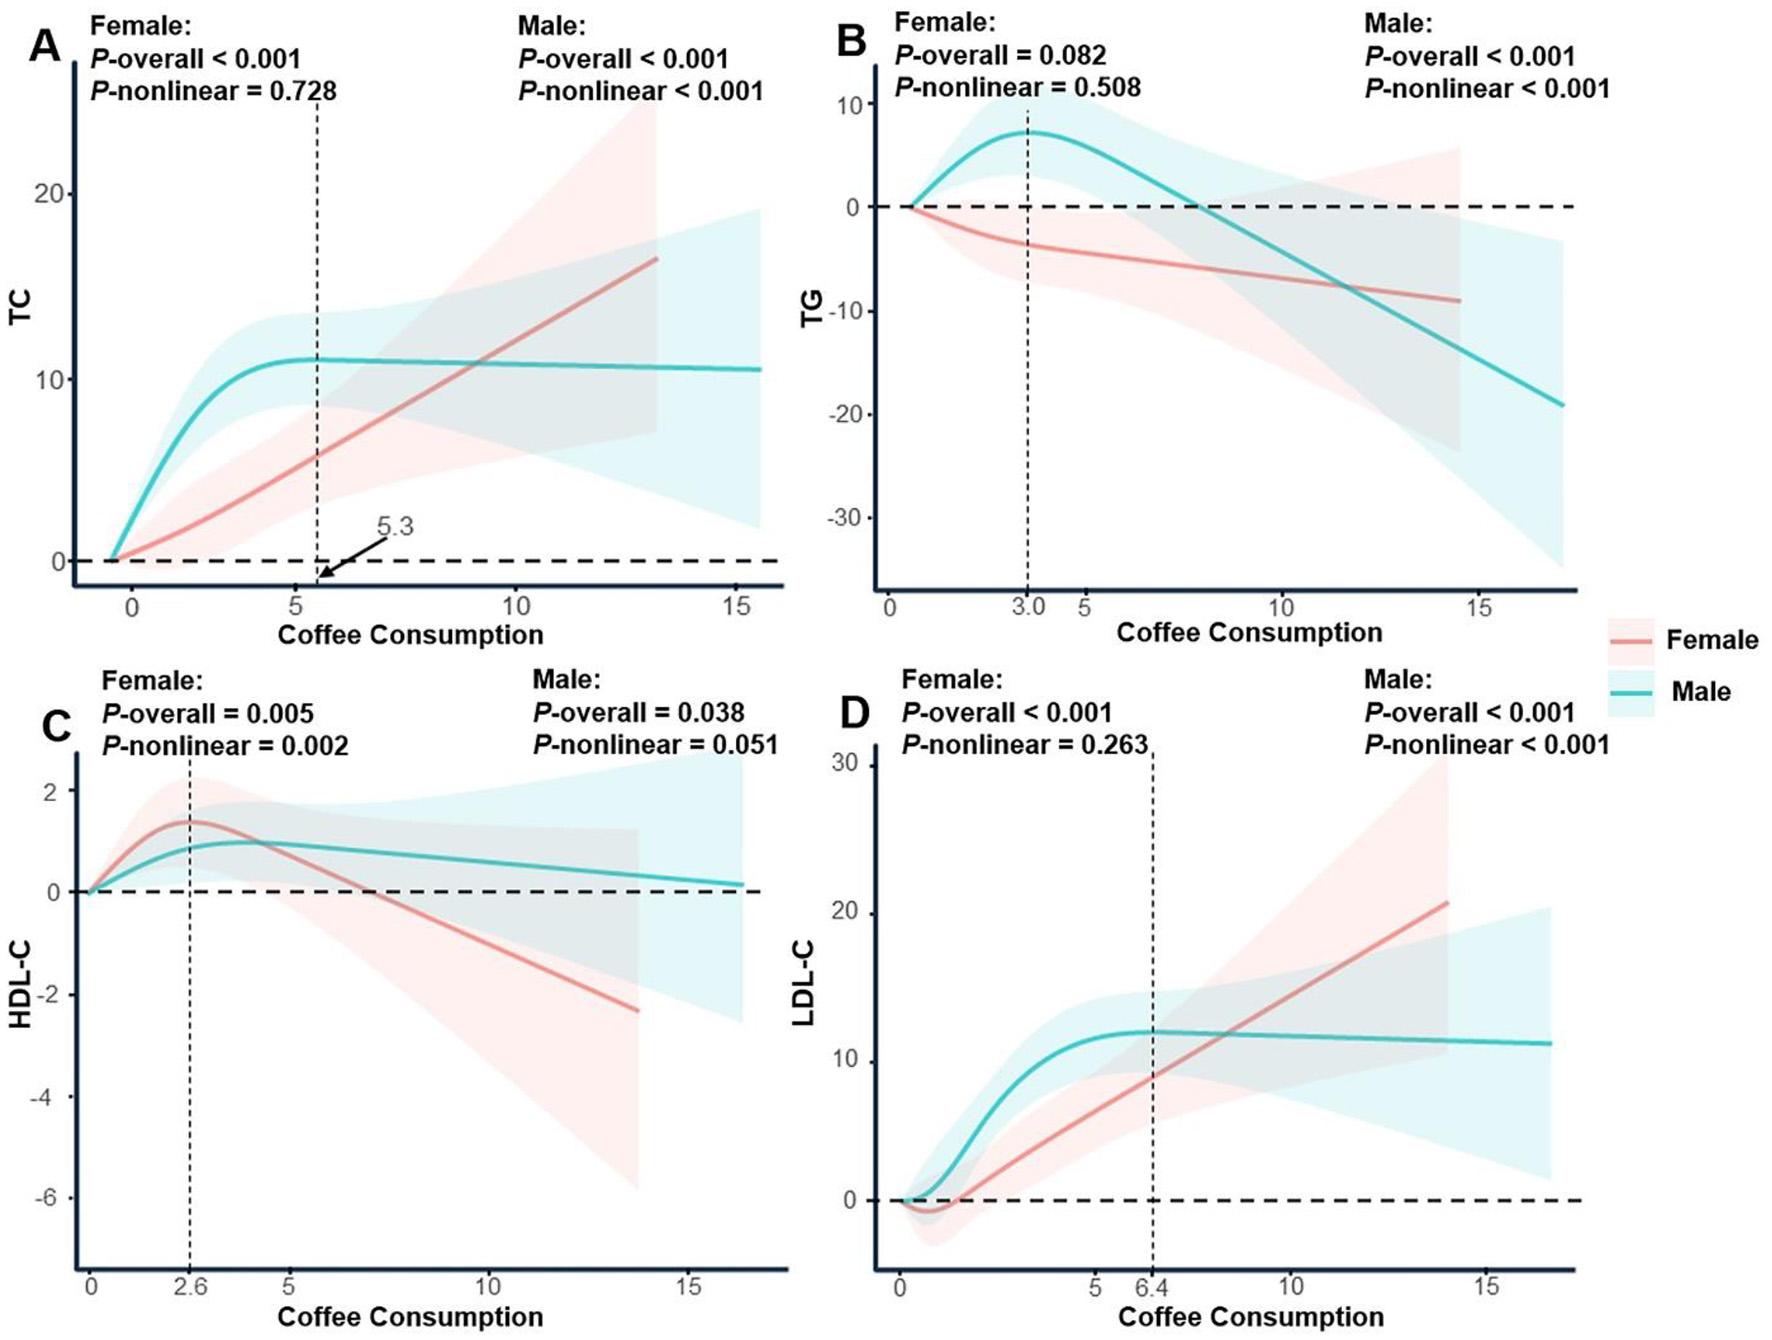
Restricted cubic spline regression analysis of the association between coffee consumption and serum lipid profile stratified by gender. The solid lines represent the estimated associations, and the shaded regions denote the corresponding 95% confidence intervals. (A) Coffee consumption and total cholesterol; (B) Coffee consumption and triglycerides; (C) Coffee consumption and high-density lipoprotein cholesterol; (D) Coffee consumption and low-density lipoprotein cholesterol.
In the published article, there was an error in Figure 3 as published. Figure 3 has been incorrectly replaced with Supplementary Figure S1. The corrected Figure 3 and its caption appear below.
The original article has been updated.
Statements
Publisher’s note
All claims expressed in this article are solely those of the authors and do not necessarily represent those of their affiliated organizations, or those of the publisher, the editors and the reviewers. Any product that may be evaluated in this article, or claim that may be made by its manufacturer, is not guaranteed or endorsed by the publisher.
Summary
Keywords
coffee consumption, serum lipid profile, dose-response relationship, National Health and Nutrition Examination Survey, population-based study
Citation
Mo C, Duan X, Pu J, Zhou X, Zheng Y and Wang S (2025) Correction: Coffee consumption as a double-edged sword for serum lipid profile: findings from NHANES 2005–2020. Front. Nutr. 12:1663658. doi: 10.3389/fnut.2025.1663658
Received
10 July 2025
Accepted
21 July 2025
Published
31 July 2025
Volume
12 - 2025
Edited and reviewed by
Malgorzata Ziarno, Warsaw University of Life Sciences, Poland
Updates
Copyright
© 2025 Mo, Duan, Pu, Zhou, Zheng and Wang.
This is an open-access article distributed under the terms of the Creative Commons Attribution License (CC BY). The use, distribution or reproduction in other forums is permitted, provided the original author(s) and the copyright owner(s) are credited and that the original publication in this journal is cited, in accordance with accepted academic practice. No use, distribution or reproduction is permitted which does not comply with these terms.
*Correspondence: Shiyu Wang 497217505@qq.comYongfeng Zheng zyf730@126.com
†These authors have contributed equally to this work and share first authorship
Disclaimer
All claims expressed in this article are solely those of the authors and do not necessarily represent those of their affiliated organizations, or those of the publisher, the editors and the reviewers. Any product that may be evaluated in this article or claim that may be made by its manufacturer is not guaranteed or endorsed by the publisher.