 Yan-Wei Jiang
 Xiong-Jei Xu
 Rui Wang
 Chun-Mei Chen
- Department of Neurosurgery, Fujian Medical University Union Hospital, Fuzhou, Fujian, China
Background: This meta-analysis aimed to assess the efficacy of radiomics using non-enhanced computed tomography (NCCT) for predicting hematoma expansion in patients with spontaneous intracerebral hemorrhage.
Methods: Throughout the inception of the project to April 11, 2022, a comprehensive search was conducted on PubMed, Embase, and Cochrane Central Register of Controlled Trials. The methodological quality of studies in this analysis was assessed by the radiomics quality scoring system (RQS). A meta-analysis of radiomic studies based on NCCT for predicting hematoma expansion in patients with intracerebral hemorrhage was performed. The efficacy of the radiomics approach and non-contrast CT markers was compared using network meta-analysis (NMA).
Results: Ten articles comprising a total of 1525 patients were quantitatively analyzed for hematoma expansion after cerebral hemorrhage using radiomics. Based on the included studies, the mean RQS was 14.4. The AUC value (95% confidence interval) of the radiomics model was 0.80 (0.76-0.83). Five articles comprising 846 patients were included in the NMA. The results synthesized according to Bayesian NMA revealed that the predictive ability of the radiomics model outperformed most of the NCCT biomarkers.
Conclusions: The NCCT-based radiomics approach has the potential to predict hematoma expansion. Compared to NCCT biomarkers, we recommend a radiomics approach. Standardization of the radiomics approach is required for further clinical implementation.
Systematic review registration: https://www.crd.york.ac.uk/PROSPERO/display_record.php?RecordID=324034, identifier [CRD42022324034].
1. Introduction
Intracerebral hemorrhage is a life-threatening and costly disorder that accounts for 10–15% of all strokes (1). Hematoma expansion is an independent risk factor for poor neurological outcomes. Predictions of hematoma expansion risks can help to stratify patients. Previous studies have reported that spot signs are a good predictor of hematoma expansion (2, 3). Nevertheless, the application of spot signs is limited because computed tomography angiography (CTA) and contrast-enhanced CT are not routinely performed in the emergency department. Non-enhanced CT (NCCT) is most commonly used for intracerebral hemorrhage imaging. Several studies have reported that radiological markers extracted from NCCT, including the black hole, satellite, and blend signs, are related to hematoma expansion (2). However, the extraction of radiomic markers is time-consuming and heterogeneous. Further, the accuracy of radiomic markers may depend on the experience of the clinician who reads the medical images.
Radiomics is a new method for the quantitative analysis of medical images (4). Radiomics analysis was initially implemented in the mining of medical images related to oncology. Recently, the radiomics approach has been applied in non-oncological fields (5). An increasing number of studies have used an NCCT-based radiomics approach to predict hemorrhage expansion(Figure 1) (4, 6, 7). However, data on the predictive efficacy of radiomics methods remain insufficient for further implementation.
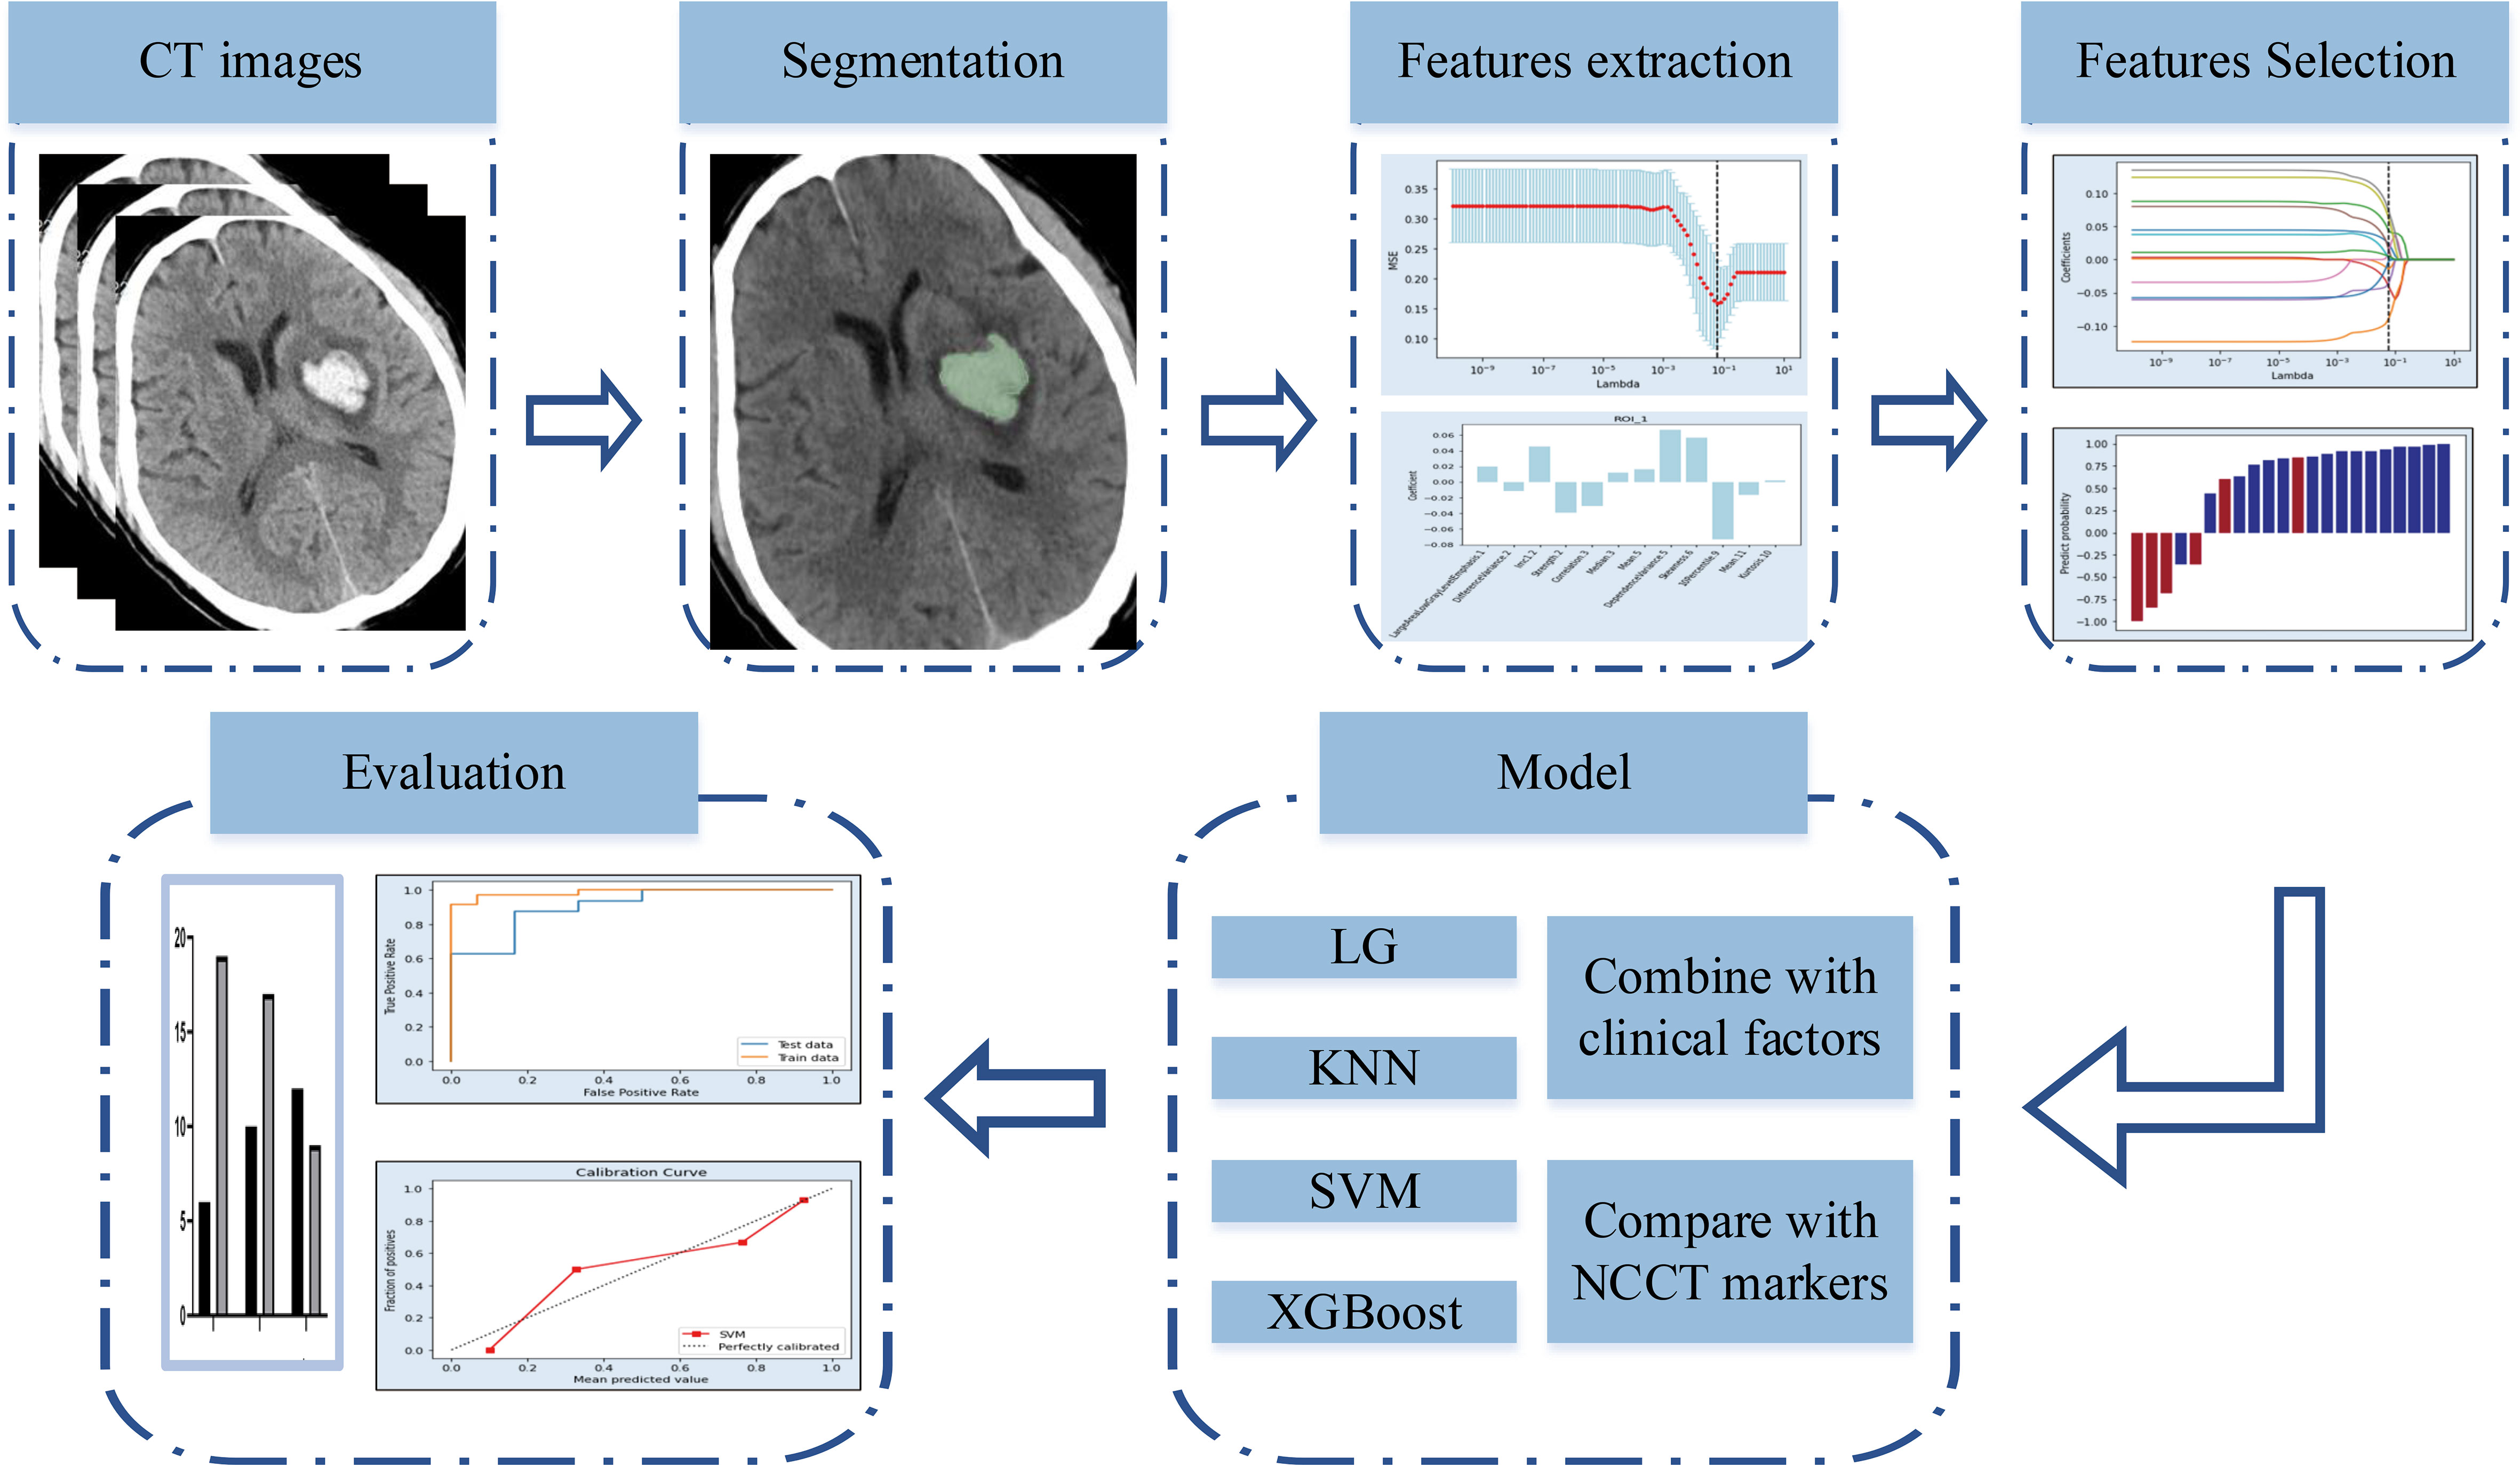
Figure 1 Flowchart of (NCCT-based radiomics. NCCT: non-enhanced computed tomography.
This meta-analysis aimed to determine whether NCCT-based radiomics approaches are effective for predicting hematoma expansion. Radiomics quality scoring (RQS) was used to determine the quality of the studies included in the meta-analysis (8). Network meta-analysis (NMA) was employed to synthesize diagnostic test accuracy data in order to assess the efficacy of different diagnostic tests (9, 10). We compared the efficacy of common NCCT markers and radiomics approaches for predicting intracerebral hemorrhage expansion using NMA.
2. Methods
2.1. Literature search and study selection
This study was conducted according to the Preferred Reporting Items for Systematic Reviews and Meta-Analysis (PRISMA) statement (eTable 1) (11). This study was registered with PROSPERO (CRD42022324034). PubMed, Embase, and the Cochrane Central Register of Controlled Trials were searched thoroughly from inception to April 11, 2022 (eTable 2) for articles in English. References to relevant published articles were also searched to obtain the desired articles.
After pooling the search results from the three databases and removing duplicate articles, the abstracts and titles of the articles were screened independently by two researchers. Eligible articles were identified by a comprehensive reading of the full text. We included all eligible radiomics articles that used non-enhanced CT to assess hematoma expansion in patients with intra-cerebral hemorrhage. Articles that met one or more of the following criteria were excluded: (1) conference abstracts, reviews, letters, case reports, and case series studies with sample sizes < 10; (2) in multiple studies using the same population, only the study with the largest dataset was included; (3) non-human studies; (4) secondary intra-cerebral hemorrhage; (5) intraventricular hemorrhage; and (6) studies without comparison. All inconsistencies were resolved by negotiation or by a third investigator.
2.2. Data extraction
Eligible articles contained information that was independently extracted by two researchers, including authors, year of publication, sample size, number of cases in the training and validation sets, study population, study design, study country, number of institutions, composition of model construction, mode of visualization, interval image examination, research topic, segmentation software, method of extraction of imaging histology features, validation method, method of screening variables, final study characteristics, sensitivity (Se), specificity (Sp), true positives (TPs), false positives (FPs), true negatives (TNs), false negatives (FNs), diagnostic accuracy rate (DAR), diagnostic odds ratio (DOR), number of hematoma expansions, and non-expansions. All inconsistencies were resolved by negotiation or by a third investigator.
2.3. Quality assessment
All eligible studies were assessed for bias using the QUADAS-2 tool for diagnostic meta-analyses (12). Four key domains were assessed, including flow and timing, reference standards, index tests, and patient selection. Three main domains were assessed using the Applicability Concerns Test. Risk of bias was categorized as low, high, or unclear. When all domains were rated as yes, the risk was considered low. A potential risk of bias existed when any of the domains was rated no. The unclear classification only applied when there were insufficient data to report. The 16 components of RQS were used to assessed the quality of radiomics studies (8). Reviewers scored each component and summed up the scores. The procedures for scoring each component have been described previously.
2.4. Outcome measures
We performed a synthetic analysis of TP, FP, TN, and FN indicators of eligible articles using a diagnostic meta-analysis. Comparative analyses were performed for Se, Sp, positive predictive value (PPV), negative predictive value (NPV), DAR, and DOR. Articles that did not provide the four indicators TP, FP, TN, and FN were calculated using the number of cases of hematoma expansion and non-expansion, combined with Se and Sp, using Review Manager 5.4.1. (eTable 3).
Se refers to the proportion of positive cases detected within the group diagnosed with disease by the gold standard; a higher Se indicates a lower chance of a missed diagnosis. Sp refers to the proportion of negative tests within the group diagnosed as disease-free by the gold standard; a higher Sp indicates a lower chance of misdiagnosis. PPV reflects the proportion of individuals with a positive screening test result who are actually sick. NPV reflects the proportion of individuals with a negative screening test result who do not actually have the disease. DAR is defined as the proportion of all cases detected as TPs and TNs by clinical diagnostics within all cases. A higher DOR value indicates that the diagnostic test is more effective at distinguishing between patients and non-patients.
3. Data Synthesis
3.1. Diagnostic meta-analysis to evaluate diagnostic test accuracy
Diagnostic test accuracy indicators, such as Se, Sp, PPV, NPV, DAR, and DOR, were synthesized using a meta-analysis based on a random-effects model. Forest plots were used to represent the effect values (odds ratio, OR) and 95% confidence intervals (CIs). Evaluation of the screening biomarkers (radiological features or radiomics) was based on summary receiver operating characteristic (sROC) curves and areas under the curve (AUCs), whereby a larger AUC indicates better model performance. The Cochrane Q test and I2 were used to measure the heterogeneity of the outcomes. The robustness of the results was evaluated, and sources of heterogeneity were explored by omitting each included article one by one in the pooled analysis. Publication bias was evaluated using funnel plots. A p-value < 0.05 for the Q test or I2 > 50% indicated the possibility of significant heterogeneity.
3.2. NMA
Studies that included a comparison of radiomics and radiological markers were used for the NMA. We used NMA to evaluate the diagnostic value of all radiological features and radiomics evaluating hematoma expansion in cerebral hemorrhage in all eligible studies to estimate the OR and 95% CI for predicting hematoma expansion for Se, Sp, PPV, and NPV in eligible articles, and to summarize the rank order for all screening biomarkers.
The implementation of the NMA was based on a Bayesian model using Markov chain Monte Carlo simulation methods (MCMC), where the calculated prior distribution and likelihood values were substituted into MCMC, and the parameters were adjusted to three chains and 5000 burn-ins using a random-effects model with 50,000 iterations and an interval of 5. An optimal fit state of the convergent posterior distribution was obtained, minimizing the variation of the MCMC error and deviation information criterion to stabilize the ending (13, 14). Trace plots and density distribution plots were used to assess aggregation. We constructed network plots for each outcome measure separately. The plot points represented different screening biomarkers, point sizes indicated the total sample size for each feature, and line thickness represented the number of studies that were conducted between the two points connected. The OR values and 95% CIs between different predictors were represented using forest plots. To better compare diagnostic efficacy, surface under the cumulative ranking (SUCRA) was used to calculate the rankings of the predictors (15). SUCRA values ranged between 0 and 1, with larger values representing higher rankings and diagnostic efficacies.
In hypothesis testing for the NMA, we determined homogeneity and transferability by assessing the baseline characteristics of the included articles, methodological and statistical approaches, and agreement of the same predictor across articles. For consistency tests, we explored local heterogeneity using nodal splits and the deviance information criterion for consistency and inconsistency models (DIC) (16). A smaller difference between DIC values of the two models indicated good agreement.
As most of the articles constructed the model using the training set, we only used data from the validation set for synthetic analysis. Model performance was verified using the validation set. Articles that were not categorized into the training and validation sets were analyzed as validation sets.
All data synthesis was conducted using R version 4.1.2 (“meta” package for diagnostic meta-analysis to evaluate diagnostic test accuracy; “gemtc” package for NMA) and Review Manager 5.4.1.
4. Results
A comprehensive search of 2114 articles was conducted, and 2037 articles were screened after excluding duplicates. Of the 77 full-text articles searched, 67 were excluded according to the inclusion and exclusion criteria (Figure 2). Ten articles comprising a total of 4929 patients were finally included in the meta-analysis, five of which were used for the NMA. (Table 1). The causes of cerebral hemorrhage were spontaneous intracerebral hemorrhage and hypertensive intraparenchymal hematoma. A total of 1391 (28.22%) patients had hematoma expansion. The radiological features or radiomics analysis performed included radiomics model, radiological model, radiomics-radiological model, black hole sign, blend sign, heterogeneity, hypodensity, irregular shape, island sign, midline shift, satellite sign, and swirl sign.
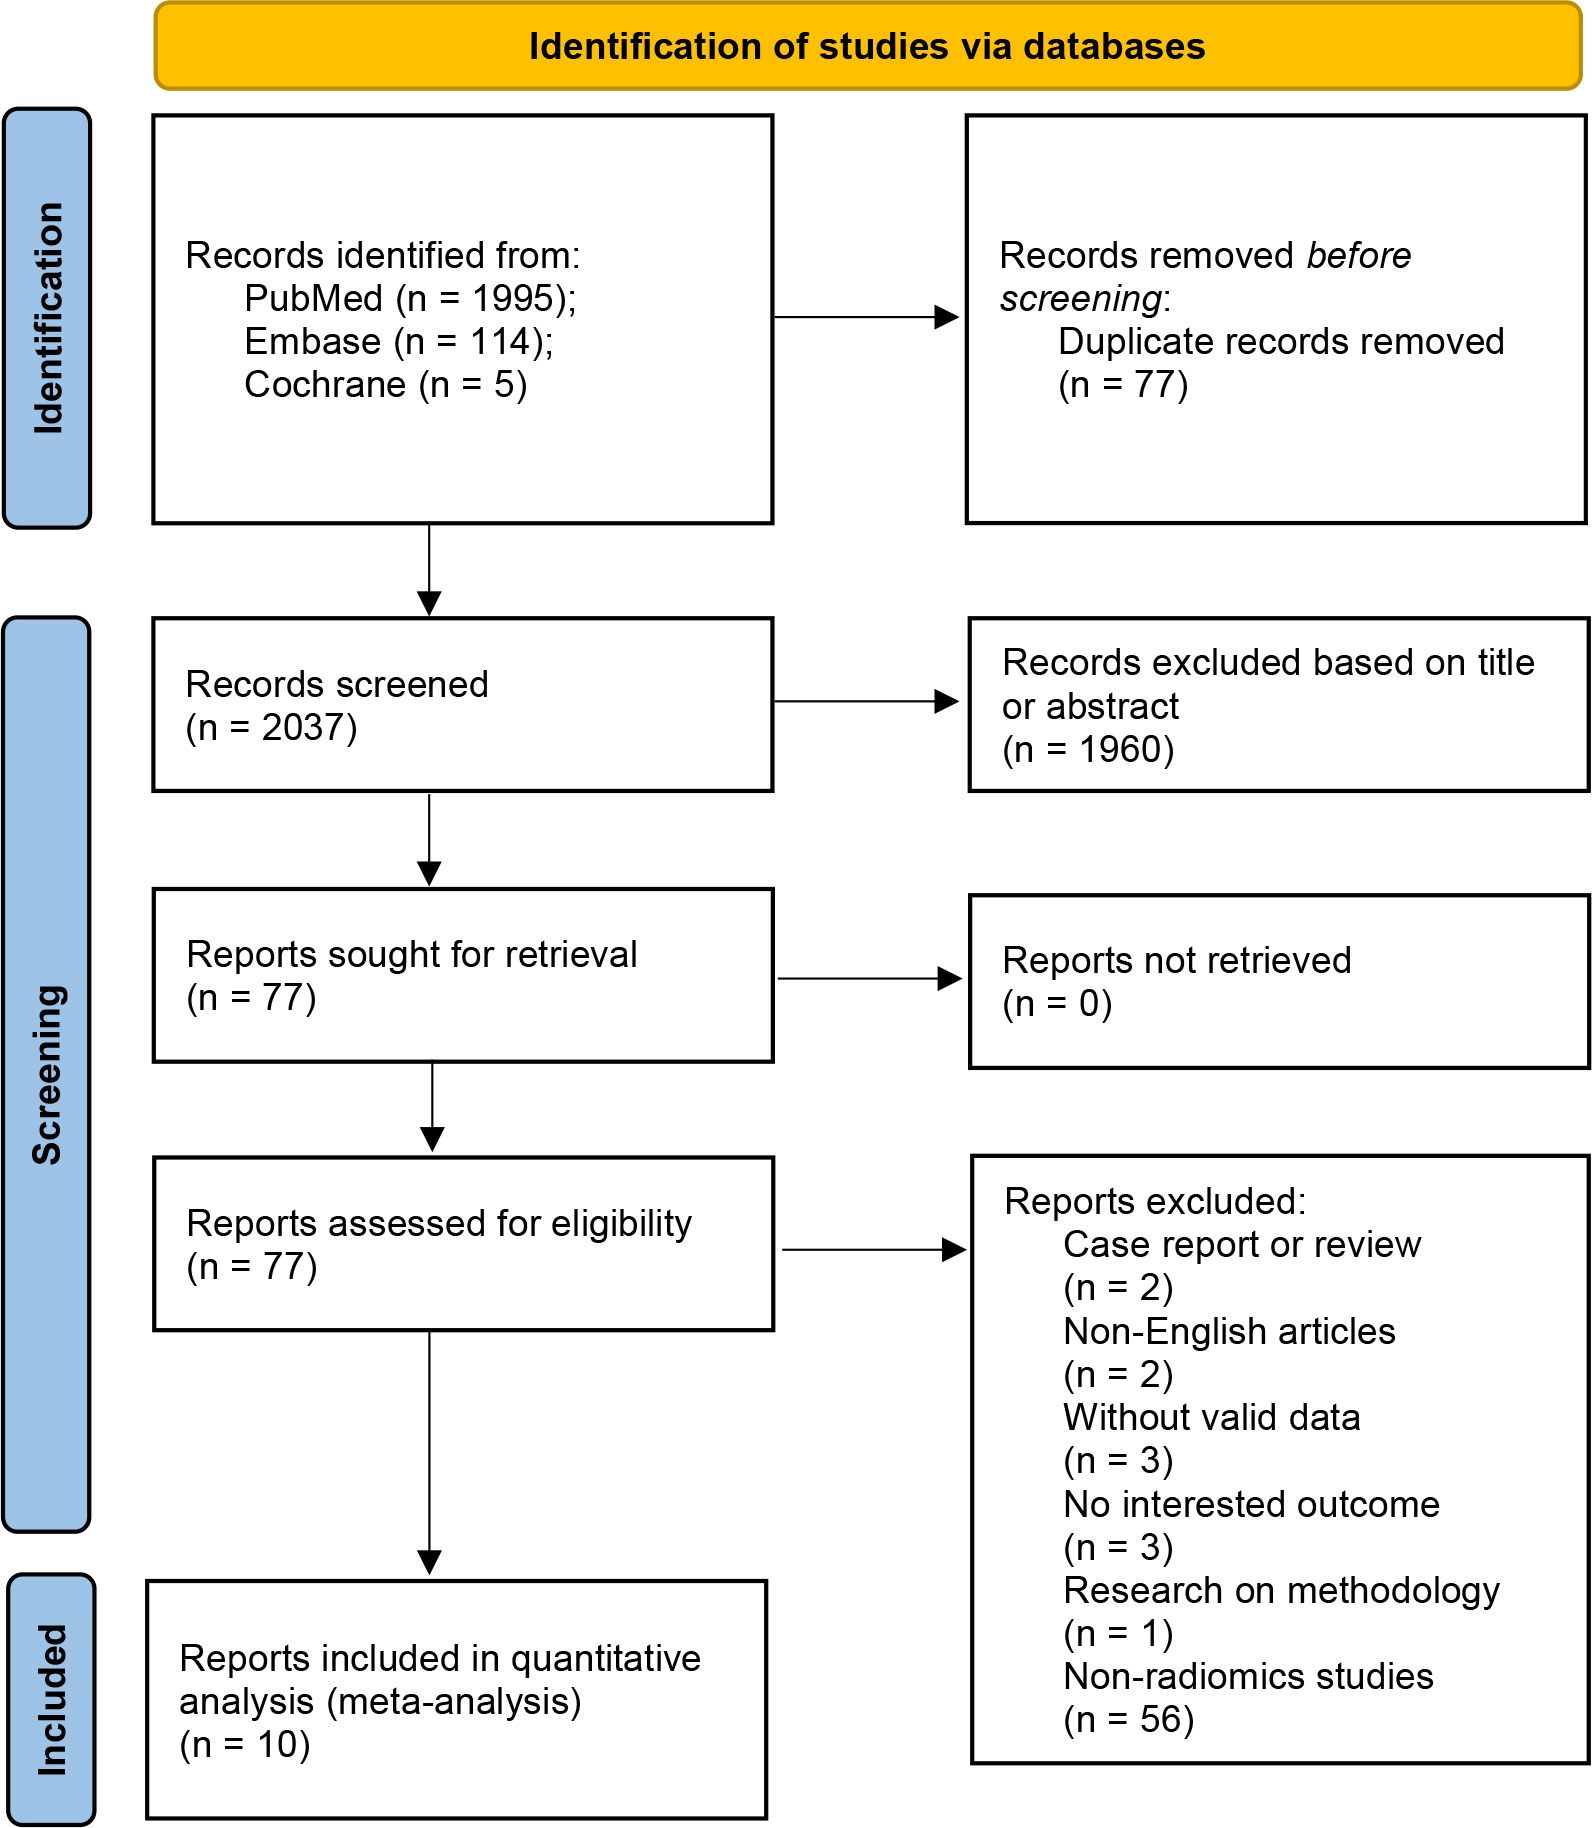
Figure 2 Flowchart for study selection.
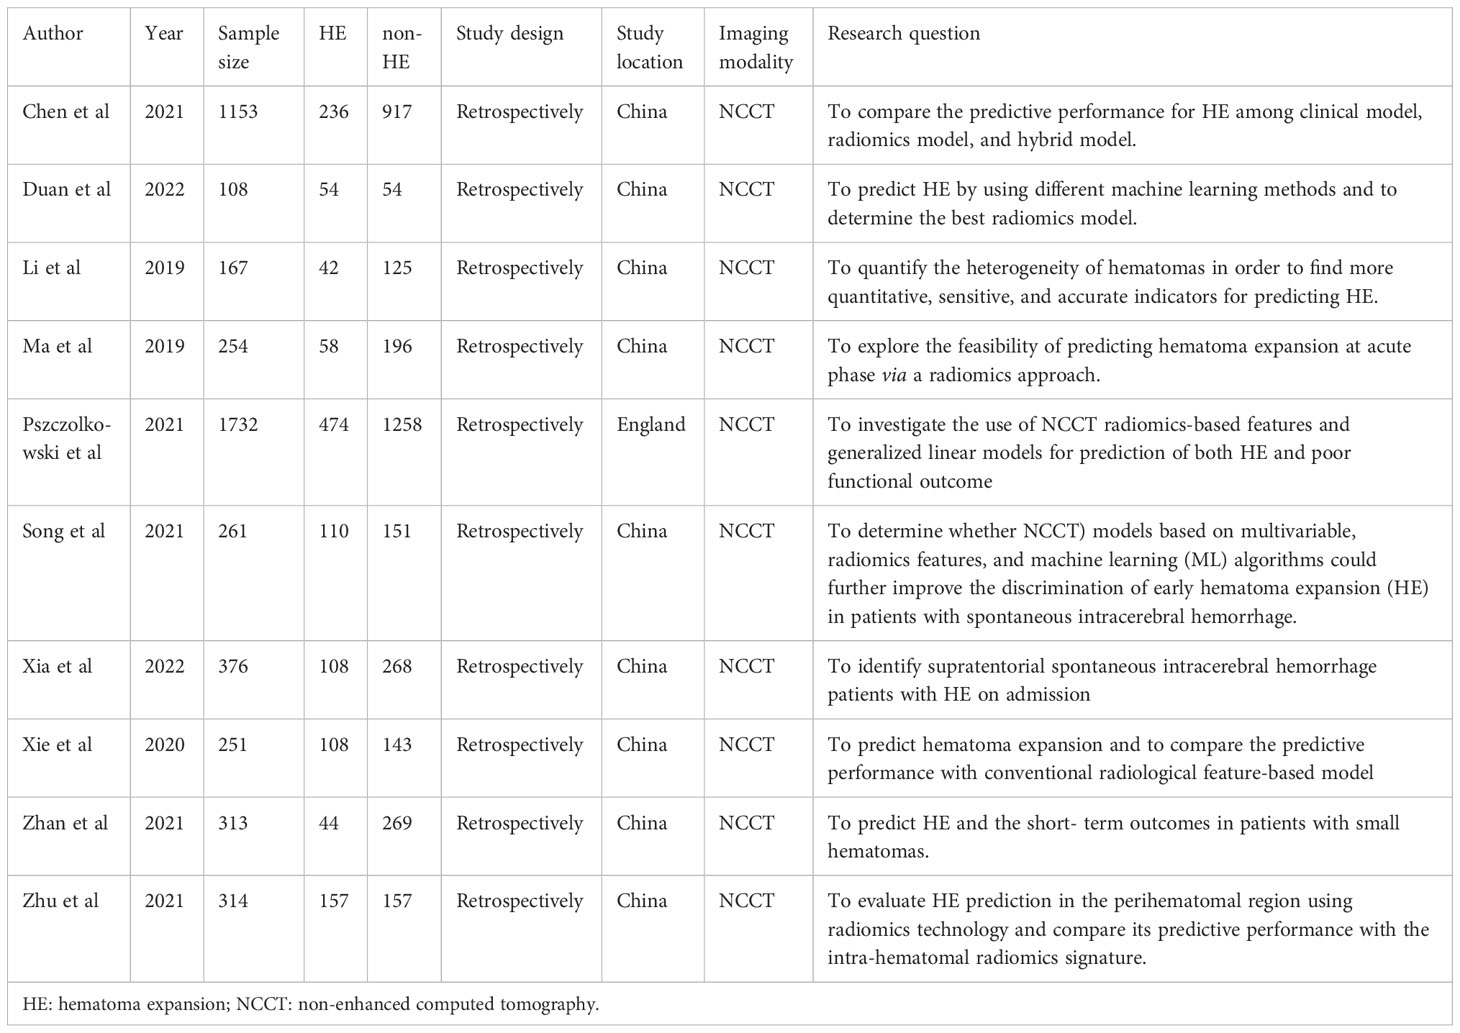
Table 1 Baseline characteristics of included studies.
Based on the QUADAS-2 tool for assessing bias and applicability (eFigure 1), the overall quality of the included articles was satisfactory. For some studies, we could not determine whether the included patients were consecutive or randomized (n=8) and whether a blinded approach and diagnostic thresholds were used for analysis (n=3); these articles were therefore categorized as unclear.
Based on RQSs (Table 2), the included articles were generally of low quality. In ten studies, the mean score was 40% (range, 30.1–69.4%), and one study scored above 50%. The protocols for image acquisition reported in most studies were well-documented. Most studies (70%) used manual segmentation (which is usually performed by an expert drawing ROIs), and three (30%) used semi-automatic segmentation (which combines manual segmentation with some algorithms). Two (20%) of the studies integrated clinical data into radiomic models and suggested that this could improve prediction accuracy.
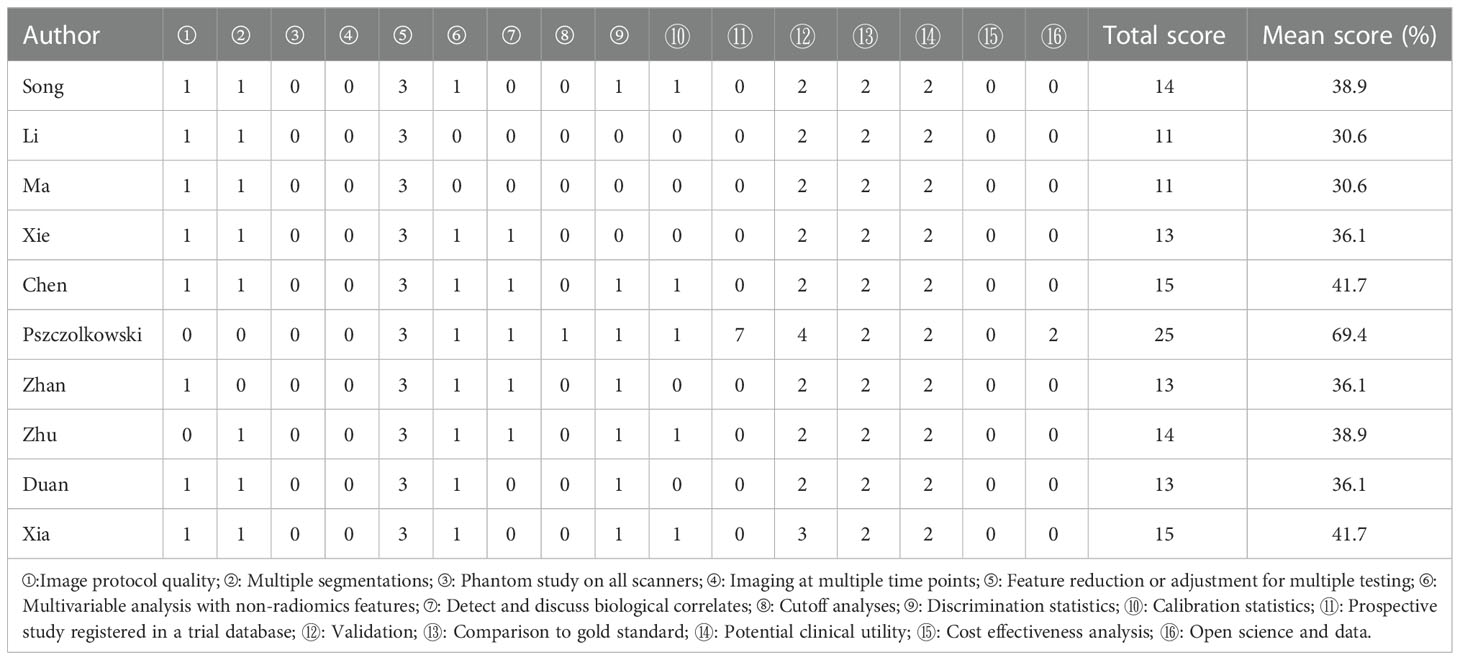
Table 2 Radiomics quality scores.
4.1. Diagnostic test meta-analysis
4.1.1. Radiomics model
Ten studies comprising a total of 1525 patients were quantitatively analyzed for hematoma expansion after cerebral hemorrhage using the radiomics method (4, 6, 7, 17–23). The pooled Se, Sp, PPV, NPV, and DAR were 0.771 (0.710-0.832), 0.743 (0.684-0.801), 0.612 (0.448-0.737), 0.863 (0.815-0.912), and 0.748 (0.707-0.788), respectively (Figure 3). The synthetic DOR was 9.85 (6.01-16.12) (eFigure 2).
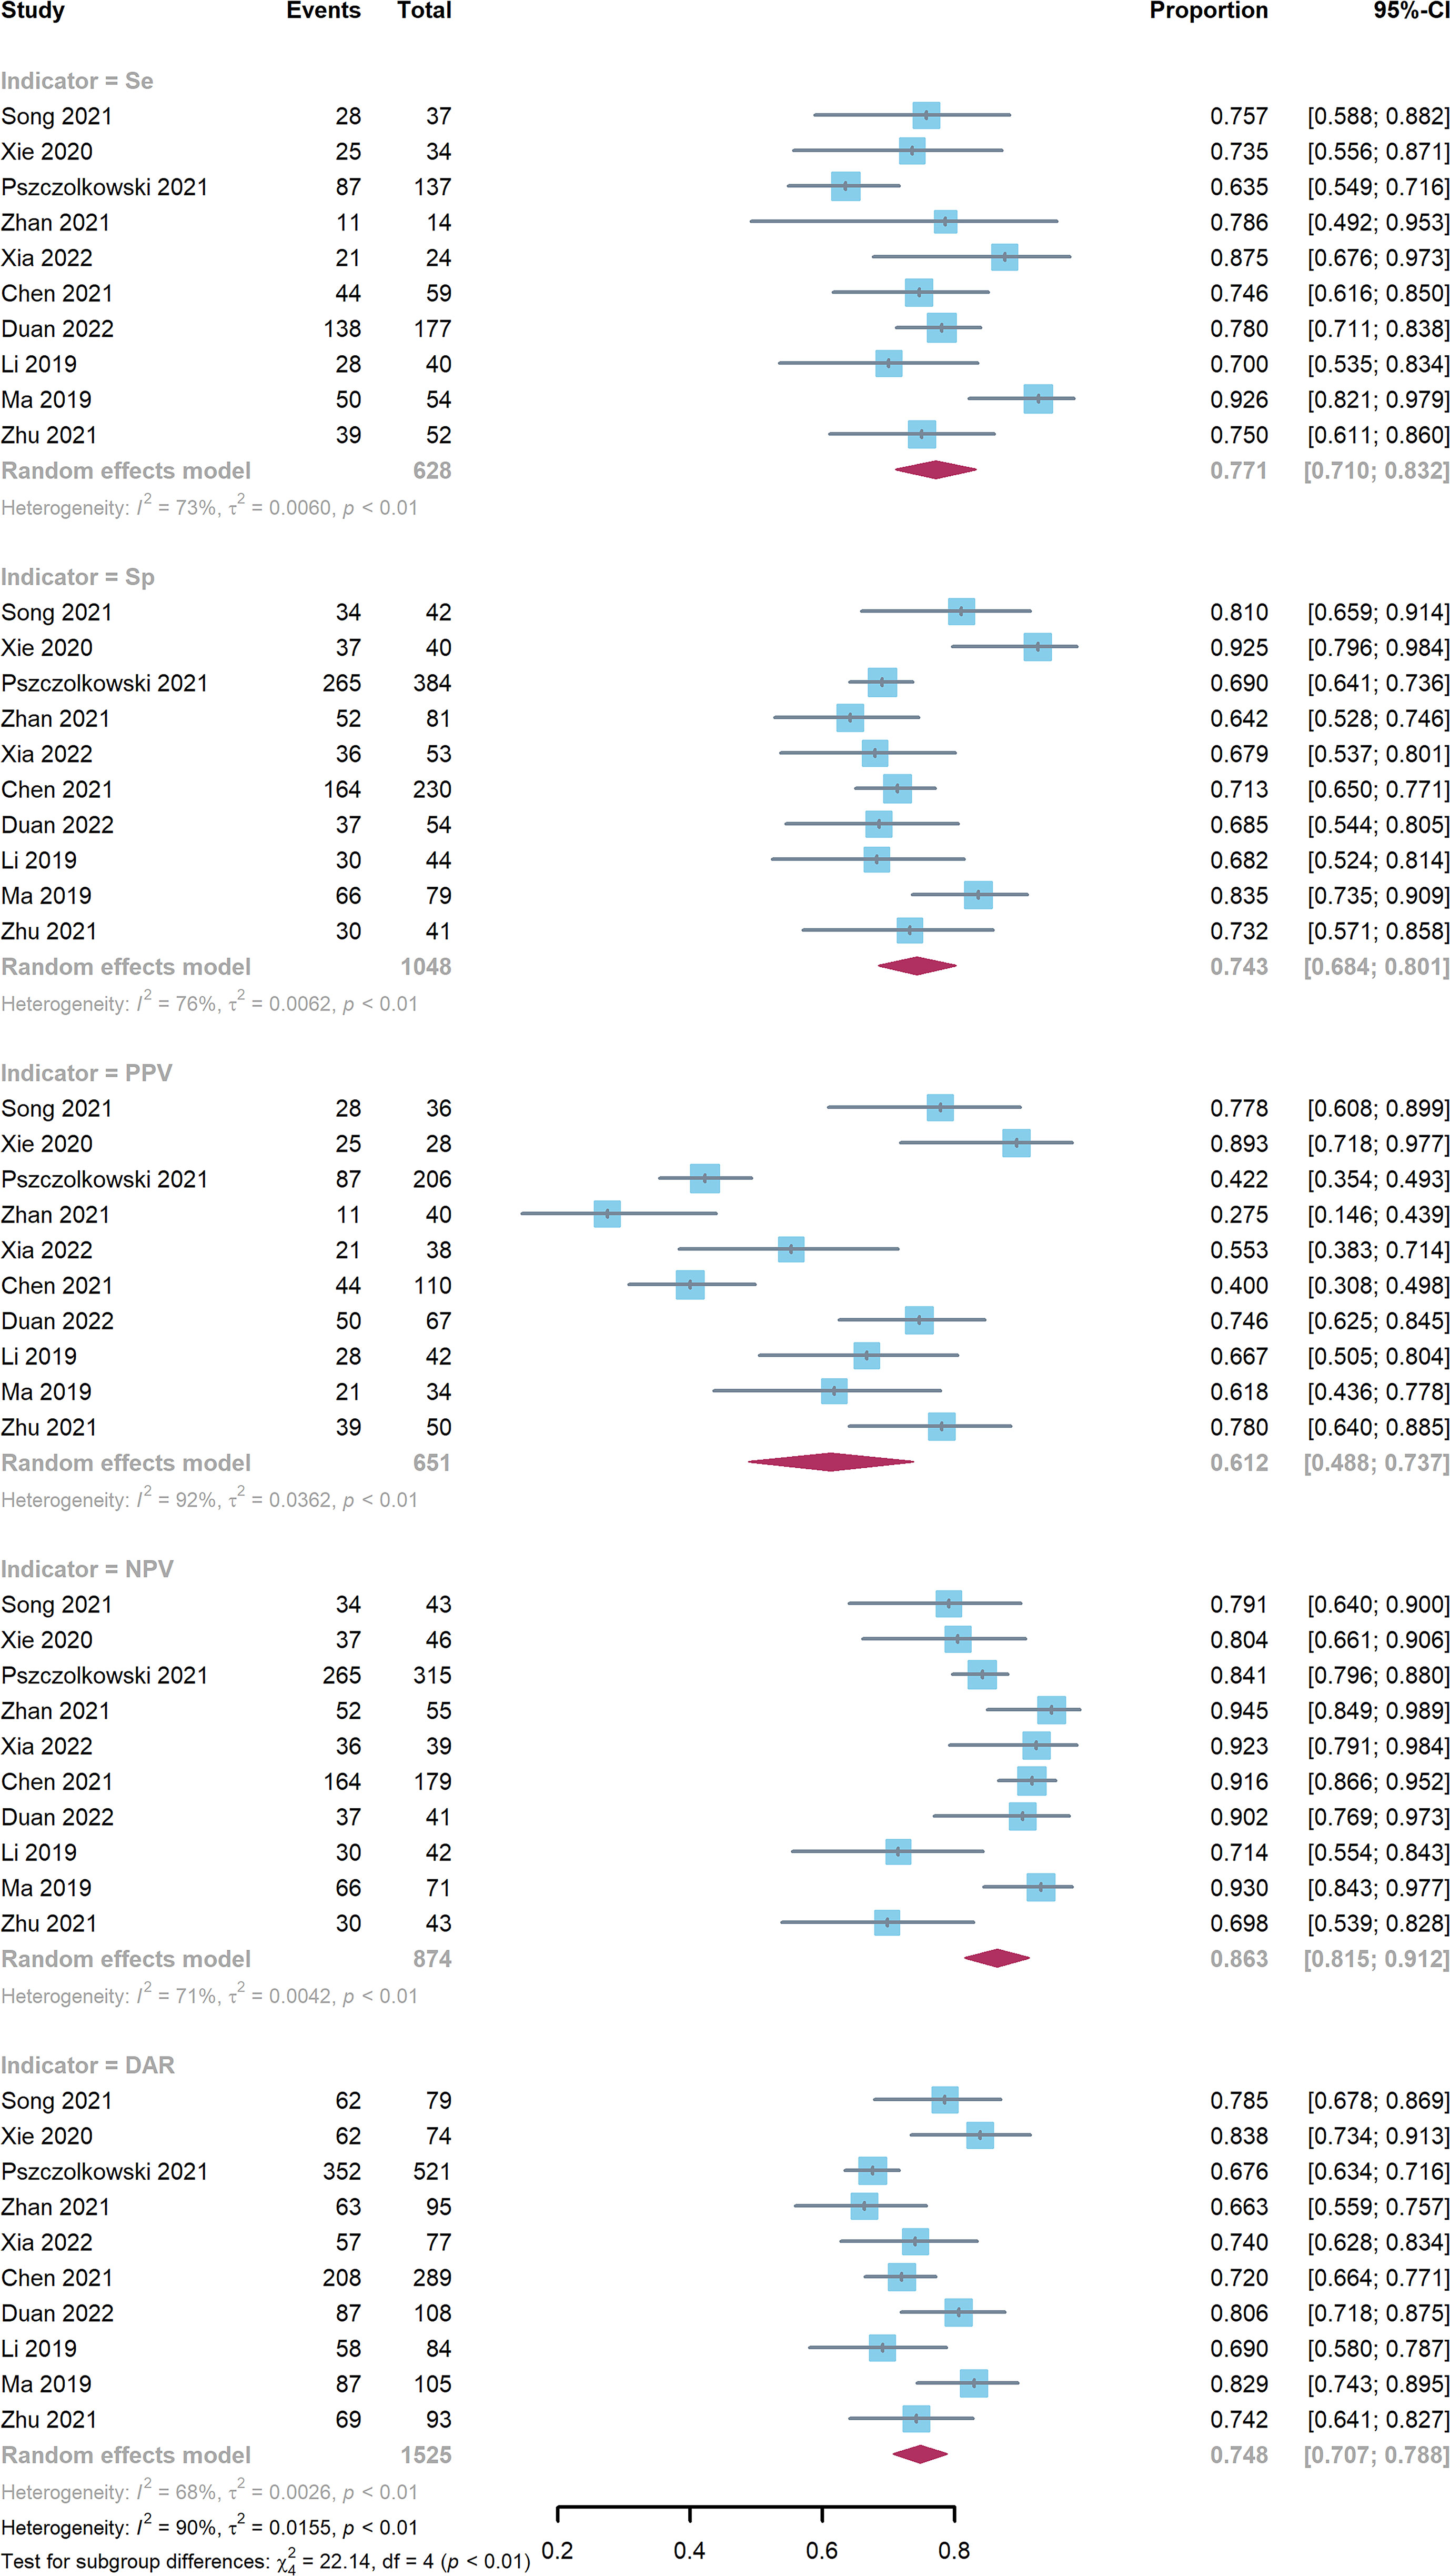
Figure 3 Forest plot of radiomics model. CIs: confidence intervals; DAR: diagnostic accuracy rate; NPV: negative predictive value; PPV: positive predictive value; Se: sensitivity; Sp: specificity.
4.2. sROCs and AUCs
The sROC curves demonstrated similar model performance for the radiomics and radiomics-radiological models, and better performance than that of the other screening biomarkers (eFigure 3). The AUC value (95% CI) of the radiomics model was 0.80 (0.76-0.83) (eFigure 4). However, other biomarkers were not available due to the limited number of studies that obtained AUC values and 95% CIs.
4.3. Sensitivity analysis and publication bias
For most diagnostic indictors, the Cochrane’s Q (p<0.05) and I2 (I2>50%) tests revealed significant heterogeneity. However, no significant changes were observed in the Se, Sp, PPV, NPV, and DAR values after article-by-article exclusion, suggesting the robustness of the outcomes and relatively low potential heterogeneity (eFigures 5). Funnel plots for different diagnostic indicators of the radiomics model suggested publication bias (eFigure 6).
4.4. NMA
Figure 4A presents a network plot of the indicators involved in the composition. In the NMA, 846 patients from five articles were included (4, 6, 7, 21, 22). The results synthesized according to Bayesian NMA revealed that the predictive ability of the radiomics model outperformed most of the NCCT biomarkers (Figure 5). According to SUCRA (eTable 4), both radiomics and radiomics-radiological models were ranked in the top two for Se, Sp, PPV, NPV, and DAR. SUCRA curves are presented in Figures 4B–F.
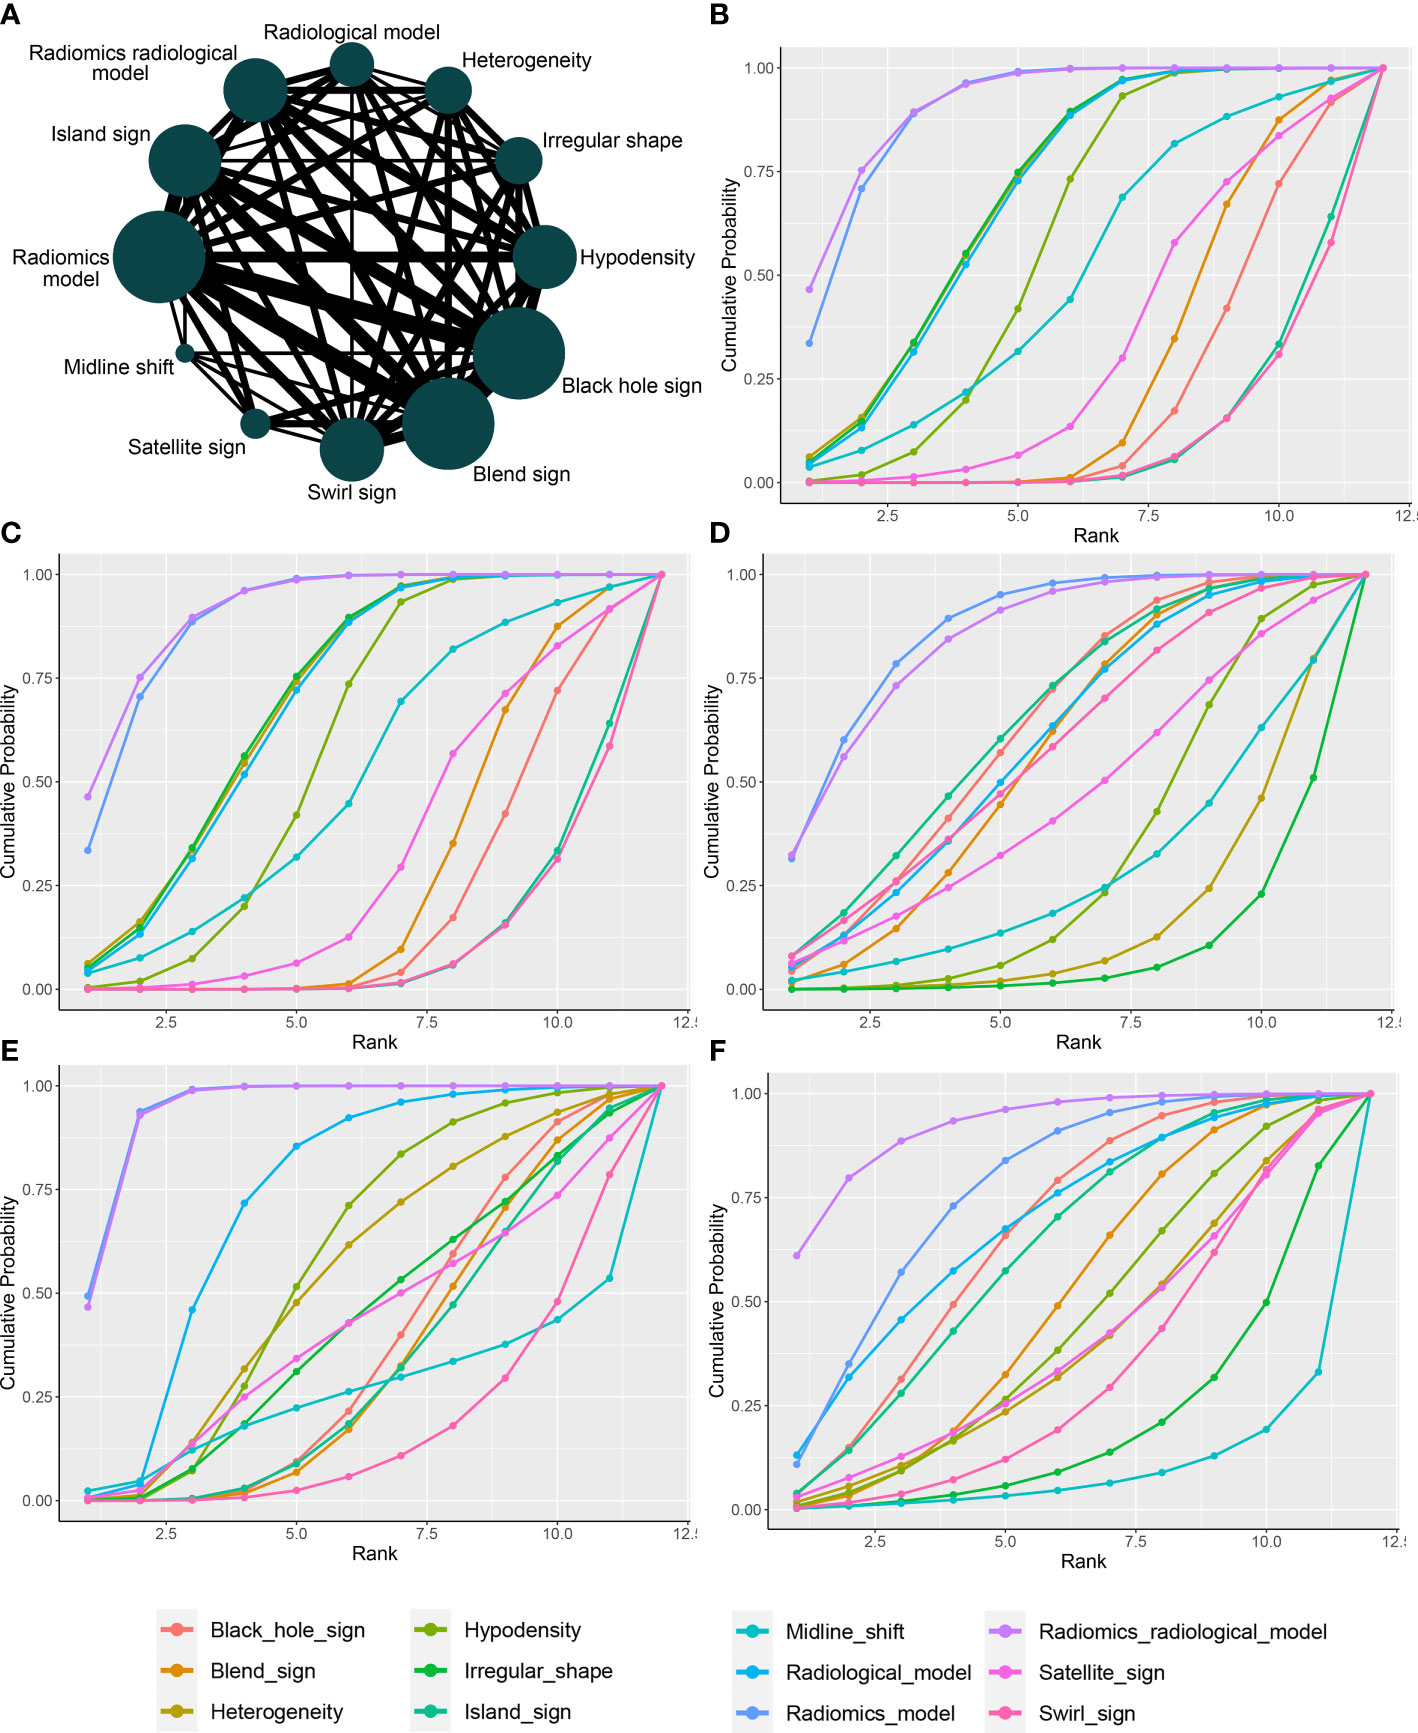
Figure 4 Network plot and SUCRA of biomarkers for ranking the accuracy of diagnosis. (A) The network plot of Bayesian network meta-analysis; (B) sensitivity; (C) specificity; (D) positive predictive value; (E) negative predictive value; (F) diagnosis accuracy rate. SUCRA: Surface under the cumulative ranking curve.
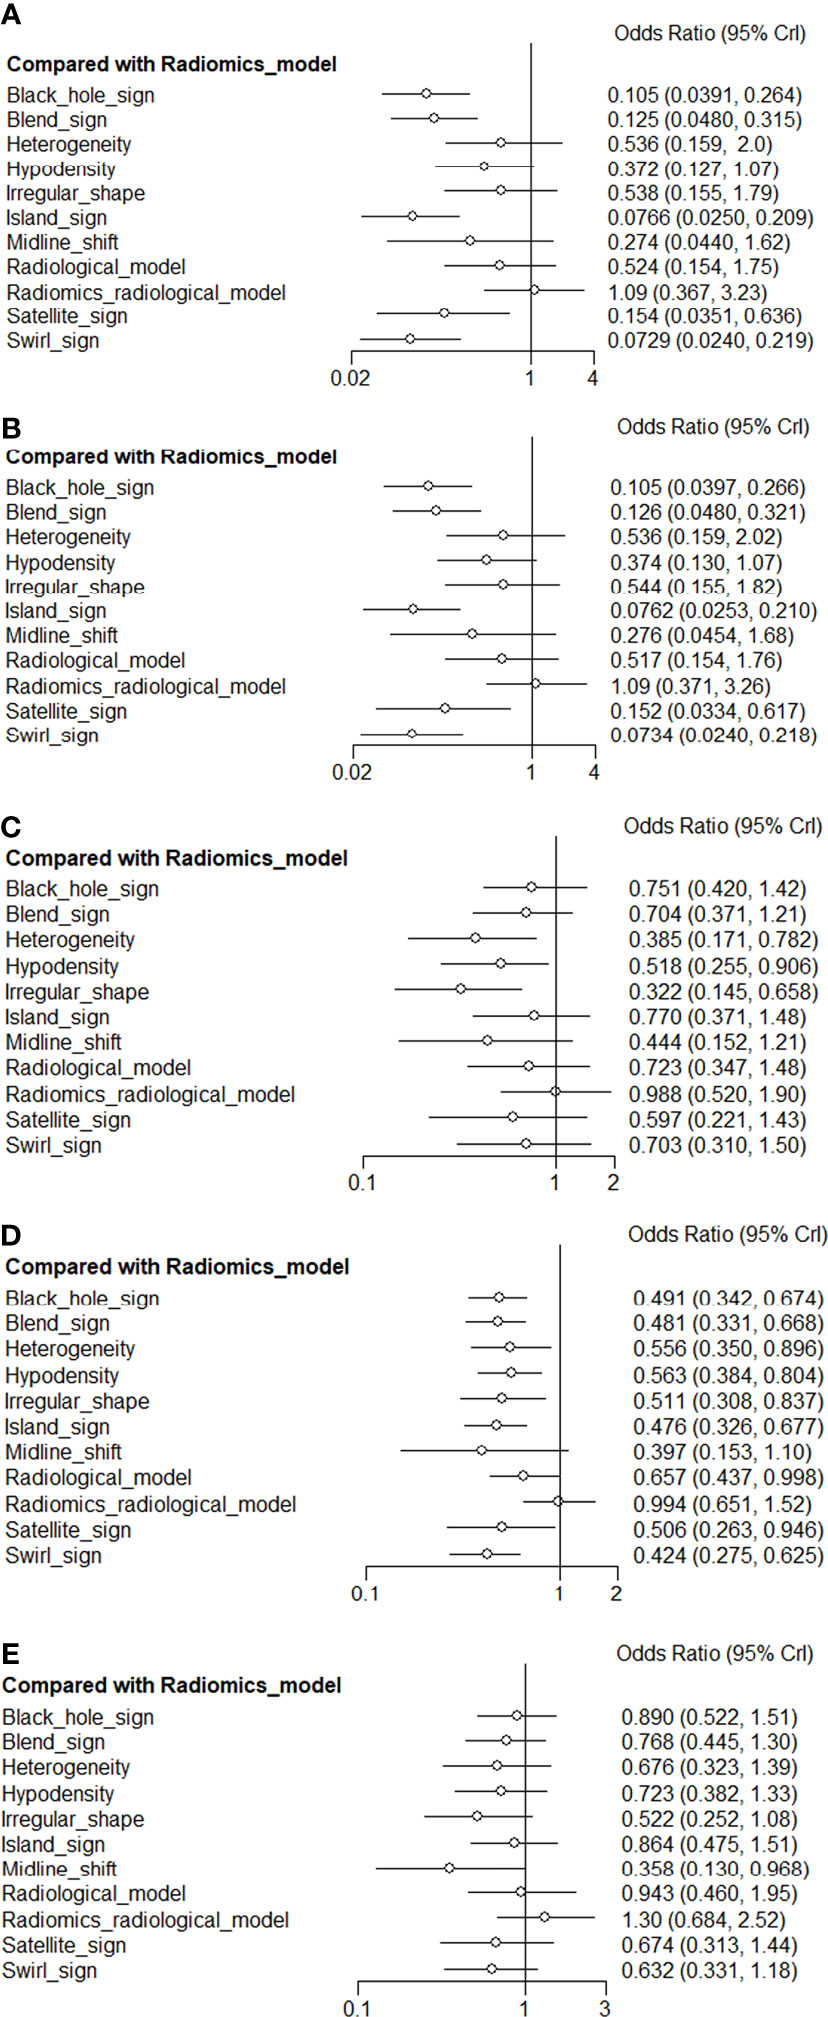
Figure 5 Network forest plot for biomarkers compared with radiomics model. Crl: credible interval.
The results of the node-splitting method revealed good consistency (p > 0.05) in most of the direct or indirect comparisons (eFigure 7). The difference between the DIC values of both the consistent and inconsistent models did not exceed 5 and exhibited good consistency (eTable 5).
5. Discussion
This meta-analysis examined the utility of NCCT-based radiomics methods to predict hematoma expansion. Our analysis indicated that the radiomics approach demonstrated potential for the prediction of hematoma expansion. Despite these promising results, the relatively low RQSs of the included studies revealed that the radiomics approach was suboptimal for clinical application. Additionally, our analysis revealed that the aggregated Se, Sp, and AUC of the radiomics model outperformed those of the radiological biomarkers.
The results of our meta-analysis demonstrated that NCCT-based radiomics is a feasible approach for stratifying the risk of spontaneous intracerebral hemorrhage (21, 24–27). Hematoma expansion is associated with clinical outcomes of spontaneous intracerebral hemorrhage. Though there is currently no definitive therapeutic strategy for prevention of hematoma expansion, we believe that the HE is an appealing target for medical intervention, as it may ultimately help some patients with intracerebral hemorrhages. The CTA spot sign is useful for stratifying patient risk and providing appropriate treatment (3, 28). However, in most medical centers in China, immediate CTA is not routinely performed, thus limiting the implementation of spot signs. NCCT, which is cheaper and more convenient, is the most commonly used method for diagnosing intracerebral hemorrhage. Previous studies have reported that NCCT biomarkers, including the blend sign, black hole sign, and satellite sign, can be used to predict the risk of hematoma expansion. According to Li et al. (29), the blend sign (Figure 6A), which is defined as an area that has relatively low attenuation adjacent to an area with high attenuation, showed 39.3% sensitivity and 95.5% specificity for predicting hematoma growth. The black hole sign (Figure 6B), which represents a low-density area within a hematoma with high density, is reported to have sensitivity of 31.9% and specificity of 94.1% (30). One of the attributes of the satellite sign (Figure 6C) is shape irregularity. A comparative study by Shakya (31) showed that the areas under the curve for the black hole sign and the satellite sign were 63.4% and 67%, respectively. The relatively low efficacy of the predictive ability of a single NCCT biomarker restricts their clinical utility. In contrast, the radiomics studies included in our meta-analysis exhibited superior performance.
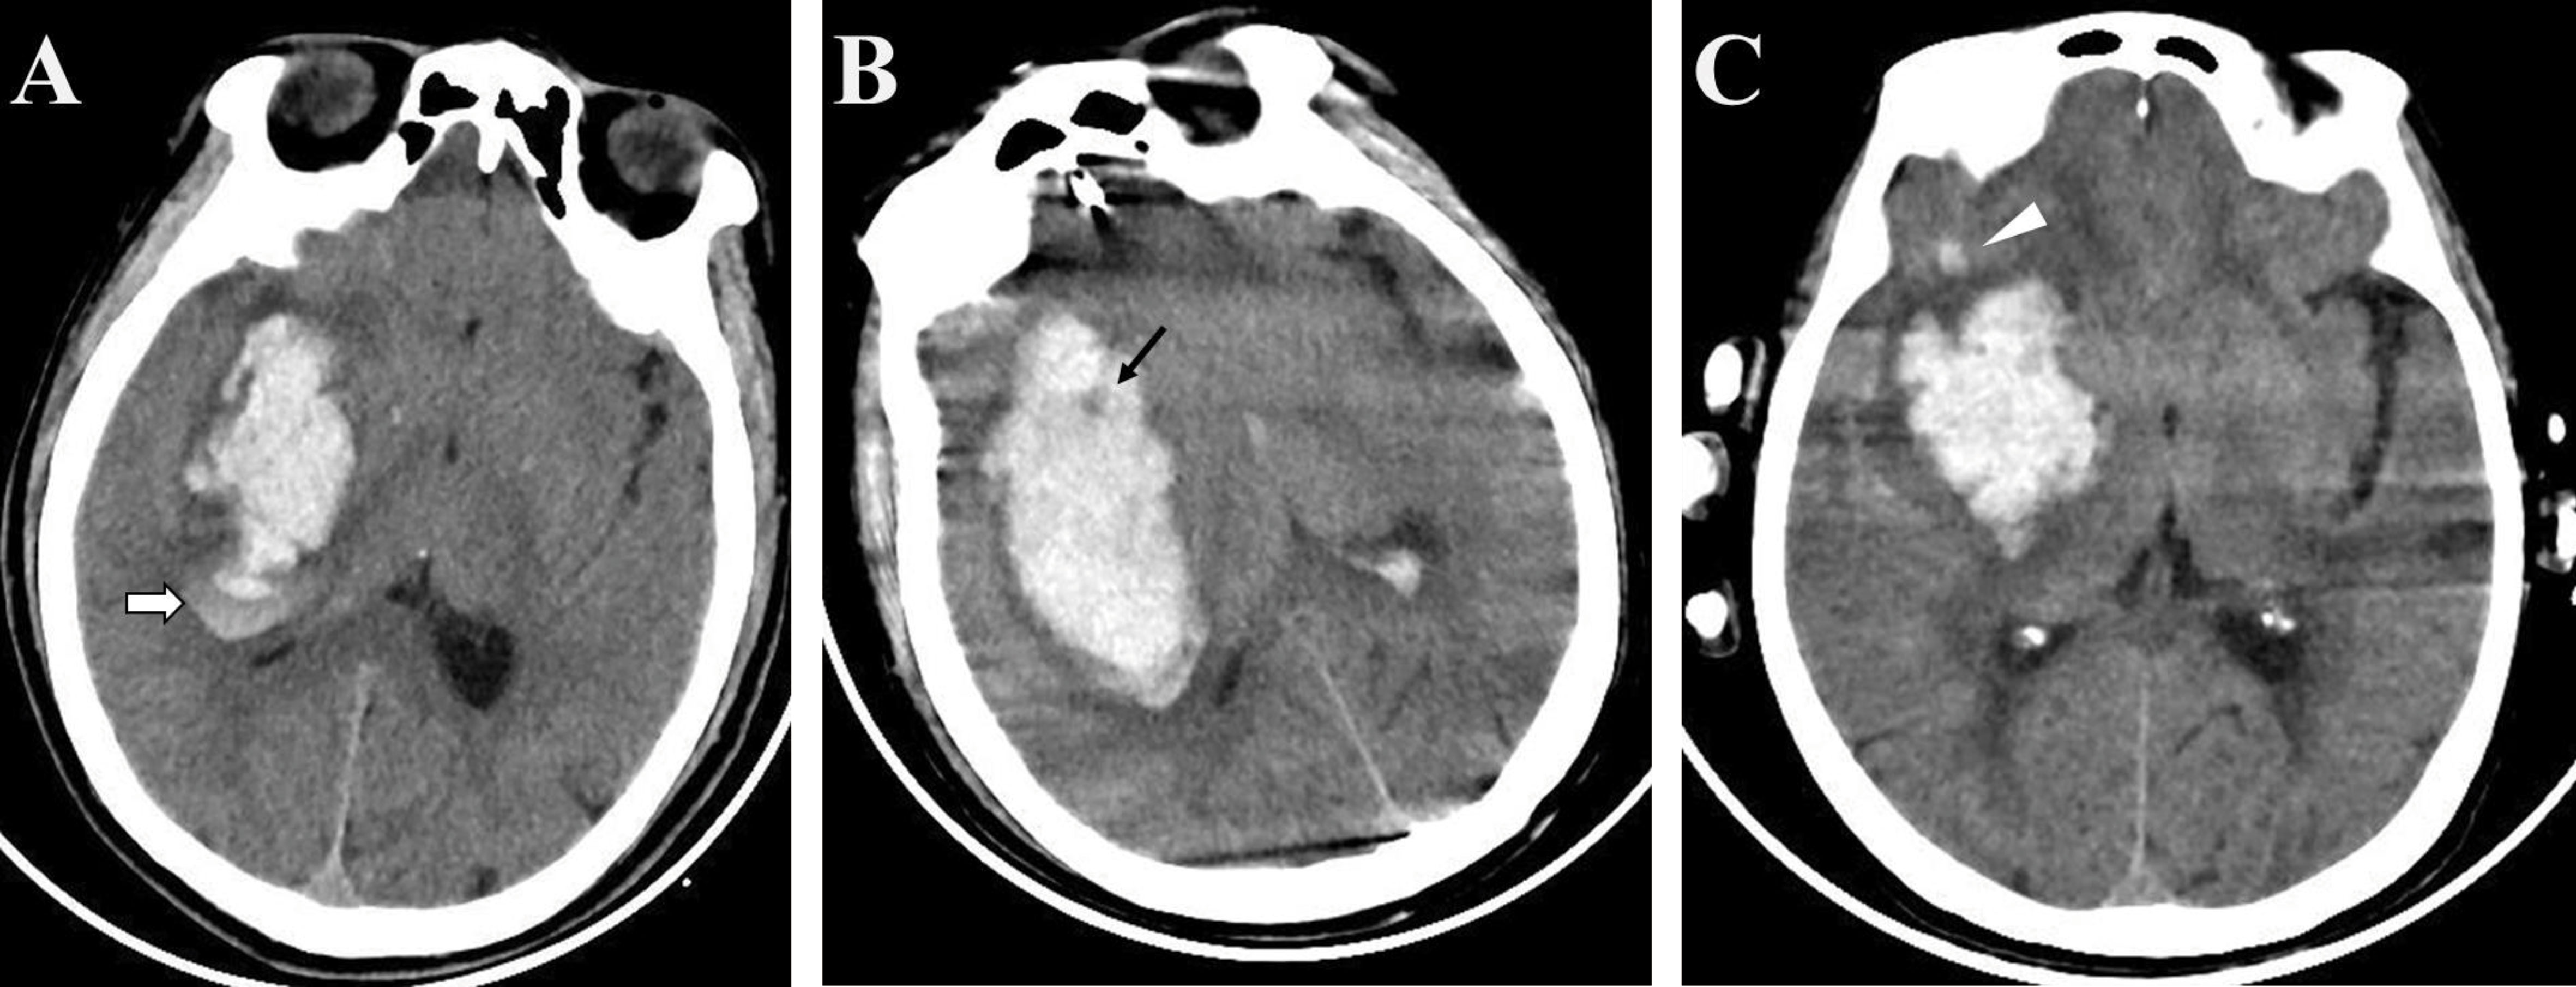
Figure 6 Examples of biomarkers on non-enhanced computed tomography (A) The blend sign is defined as an area with relatively low attenuation adjacent to an area with high attenuation (white arrow); (B) The black hole sign represents a low-density area within a hematoma with high density (black arrow); (C) The satellite sign represents a small lesion completely separate from the main hemorrhage visible in at least one slice (white triangle).
Compared to radiological markers, the radiomics method, which is based on mathematical calculation, is a more stable method to predict the risk of hematoma expansion (4, 32). The definition of radiological markers can be inconsistent, which has hindered clinical implementation of NCCT biomarkers. In this regard, a degree of overlap exists between NCCT markers (33). Moreover, the identification of radiological signs depends on the reader’s experience. Our meta-analysis demonstrated that the efficacy of NCCT markers was suboptimal for implementation in clinical practice. Notably, radiomics features may quantitatively reflect the corresponding NCCT biomarkers. Although a limited number of studies was included, our results demonstrated that the radiomics method outperformed radiological biomarkers for predicting hematoma expansion.
Despite its potential, the radiomics method is relatively novel, and non-standardized imaging protocols remain commonplace. RQS was designed to measure the quality of radiomics research (8, 34). The RQSs, which includes 16 items, can be used to assess the quality of radiomics studies. Although evolving rapidly, research applying radiomics must comply with certain basic principles. For instance, data obtained from other institutions is considered to be more independent and therefore more reliable when compared to data obtained internally. External validation of models is crucial for ensuring their generalizability. Indeed, the lack of external validation is the main factor for a low RQS (35). Standardization of high-quality image-extracted data may be helpful for clinical decision support systems (36, 37).
This study had several limitations. Meta-analysis had the limitation of heterogeneity among studies included. Based on the methods used for image reconstruction, feature extraction, and algorithms used, there were considerable differences between the included studies. Second, there was a limited number of eligible studies in the meta-analysis, possible because the relative improvement in performance of the radiomics method was overestimated, and the radiological markers were understated. Third, radiomics studies are generally of low quality, most lack external validation, and promising results from radiomics should be interpreted with caution. Higher-level evidence from clinical trials is necessary for clinical implementation of radiomics approaches.
In conclusion, our meta-analysis highlights the potential of NCCT-based radiomics approaches to predict hematoma expansion. In this regard, we recommend a radiomics approach over NCCT markers. Nevertheless, standardization of radiomics approaches is necessary for further clinical application, and further multicenter prospective studies with stricter designs are warranted to verify our findings.
Data availability statement
The original contributions presented in the study are included in the article/Supplementary Material. Further inquiries can be directed to the corresponding author.
Author contributions
Y-WJ and X-JX contributed to the study conception and design. Material preparation, data collection and analysis were performed by Y-WJ, X-JX, and C-MC. The first draft of the manuscript was written by Y-WJ and all authors commented on previous versions of the manuscript. All authors read and approved the final manuscript.
Funding
This work was supported by Joint Funds for the innovation of science and Technology, Fujian province (Grant number: 2020Y9055).
Acknowledgments
We thank the colleagues in our department for their help in our study.
Conflict of interest
The authors declare that the research was conducted in the absence of any commercial or financial relationships that could be construed as a potential conflict of interest.
Publisher’s note
All claims expressed in this article are solely those of the authors and do not necessarily represent those of their affiliated organizations, or those of the publisher, the editors and the reviewers. Any product that may be evaluated in this article, or claim that may be made by its manufacturer, is not guaranteed or endorsed by the publisher.
Supplementary material
The Supplementary Material for this article can be found online at: https://www.frontiersin.org/articles/10.3389/fonc.2022.973104/full#supplementary-material
References
1. Romero JM, Hito R, Dejam A, Ballesteros LS, Cobos CJ, Liévano JO, et al. Negative spot sign in primary intracerebral hemorrhage: Potential impact in reducing imaging. Emerg Radiol (2017) 24:1–6. doi: 10.1007/s10140-016-1428-8
2. Boulouis G, Morotti A, Charidimou A, Dowlatshahi D, Goldstein JN. Noncontrast computed tomography markers of intracerebral hemorrhage expansion. Stroke (2017) 48:1120–5. doi: 10.1161/STROKEAHA.116.015062
3. Phan TG, Krishnadas N, Lai VWY, Batt M, Slater L-A, Chandra RV, et al. Meta-analysis of accuracy of the spot sign for predicting hematoma growth and clinical outcomes. Stroke (2019) 50:2030–6. doi: 10.1161/STROKEAHA.118.024347
4. Pszczolkowski S, Manzano-Patrón JP, Law ZK, Krishnan K, Ali A, Bath PM, et al. Quantitative CT radiomics-based models for prediction of haematoma expansion and poor functional outcome in primary intracerebral haemorrhage. Eur Radiol (2021) 31:7945–59. doi: 10.1007/s00330-021-07826-9
5. Chen Q, Zhang L, Mo X, You J, Chen L, Fang J, et al. Current status and quality of radiomic studies for predicting immunotherapy response and outcome in patients with non-small cell lung cancer: A systematic review and meta-analysis. Eur J Nucl Med Mol Imaging (2021) 49:345–60. doi: 10.1007/s00259-021-05509-7
6. Xie H, Ma S, Wang X, Zhang X. Noncontrast computer tomography-based radiomics model for predicting intracerebral hemorrhage expansion: preliminary findings and comparison with conventional radiological model. Eur Radiol (2020) 30:87–98. doi: 10.1007/s00330-019-06378-3
7. Zhan C, Chen Q, Zhang M, Xiang Y, Chen J, Zhu D, et al. Radiomics for intracerebral hemorrhage: are all small hematomas benign? Br J Radiol (2021) 94:20201047. doi: 10.1259/bjr.20201047
8. Lambin P, Leijenaar RTH, Deist TM, Peerlings J, de Jong ECE, van Timmeren J, et al. Radiomics: the bridge between medical imaging and personalized medicine. Nat Rev Clin Oncol (2017) 14:749–62. doi: 10.1038/nrclinonc.2017.141
9. Jiang X, Hui F, Qin X, Wu Y, Liu H, Gao J, et al. Diagnosis accuracy and prognostic significance of the dickkopf-1 protein in gastrointestinal carcinomas: Systematic review and network meta-analysis. J Cancer (2020) 11:7091–100. doi: 10.7150/jca.49970
10. Laukhtina E, Shim SR, Mori K, D'Andrea D, Soria F, Rajwa P, et al. Diagnostic accuracy of novel urinary biomarker tests in non-muscle-invasive bladder cancer: a systematic review and network meta-analysis. Eur Urol Oncol (2021) 4:927–42. doi: 10.1016/j.euo.2021.10.003
11. Page MJ, McKenzie JE, Bossuyt PM, Boutron I, Hoffmann TC, Mulrow CD, et al. The PRISMA 2020 statement: an updated guideline for reporting systematic reviews. BMJ (2021) 372:n71. doi: 10.1186/s13643-021-01626-4
12. Whiting PF, Rutjes AW, Westwood ME, Mallett S, Deeks JJ, Reitsma JB, et al. QUADAS-2: a revised tool for the quality assessment of diagnostic accuracy studies. Ann Intern Med (2011) 155:529–36. doi: 10.7326/0003-4819-155-8-201110180-00009
13. Lu G, Ades AE. Combination of direct and indirect evidence in mixed treatment comparisons. Stat Med (2004) 23:3105–24. doi: 10.1002/sim.1875
14. Shim SR, Kim SJ, Lee J, Rucker G. Network meta-analysis: Application and practice using r software. Epidemiol Health (2019) 41:e2019013. doi: 10.4178/epih.e2019013
15. Salanti G, Ades AE, Ioannidis JP. Graphical methods and numerical summaries for presenting results from multiple-treatment meta-analysis: An overview and tutorial. J Clin Epidemiol (2011) 64:163–71. doi: 10.1016/j.jclinepi.2010.03.016
16. van Valkenhoef G, Dias S, Ades AE, Welton NJ. Automated generation of node-splitting models for assessment of inconsistency in network meta-analysis. Res Synth Methods (2016) 7:80–93. doi: 10.1002/jrsm.1167
17. Chen Q, Zhu D, Liu J, Zhang M, Xu H, Xiang Y, et al. Clinical-radiomics nomogram for risk estimation of early hematoma expansion after acute intracerebral hemorrhage. Acad Radiol (2021) 28:307–17. doi: 10.1016/j.acra.2020.02.021
18. Duan C, Liu F, Gao S, Zhao J, Niu L, Li N, et al. Comparison of radiomic models based on different machine learning methods for predicting intracerebral hemorrhage expansion. Clin Neuroradiol (2022) 32:215–23. doi: 10.1007/s00062-021-01040-2
19. Li H, Xie Y, Wang X, Chen F, Sun J, Jiang X. Radiomics features on non-contrast computed tomography predict early enlargement of spontaneous intracerebral hemorrhage. Clin Neurol Neurosurg (2019) 185:105491. doi: 10.1016/j.clineuro.2019.105491
20. Ma C, Zhang Y, Niyazi T, Wei J, Guocai G, Liu J, et al. Radiomics for predicting hematoma expansion in patients with hypertensive intraparenchymal hematomas. Eur J Radiol (2019) 115:10–5. doi: 10.1016/j.ejrad.2019.04.001
21. Song Z, Guo D, Tang Z, Liu H, Li X, Luo S, et al. Noncontrast computed tomography-based radiomics analysis in discriminating early hematoma expansion after spontaneous intracerebral hemorrhage. Korean J Radiol (2021) 22:415–24. doi: 10.3348/kjr.2020.0254
22. Xia X, Ren Q, Cui J, Dong H, Huang Z, Jiang Q, et al. Radiomics for predicting revised hematoma expansion with the inclusion of intraventricular hemorrhage growth in patients with supratentorial spontaneous intraparenchymal hematomas. Ann Transl Med (2022) 10:8. doi: 10.21037/atm-21-6158
23. Zhu D, Zhang M, Li Q, Liu J, Zhuang Y, Chen Q, et al. Can perihaematomal radiomics features predict haematoma expansion? Clin Radiol (2021) 76:629.e1–e9. doi: 10.1016/j.crad.2021.03.003
24. Morotti A, Arba F, Boulouis G, Charidimou A. Noncontrast CT markers of intracerebral hemorrhage expansion and poor outcome: A meta-analysis. Neurology (2020) 95:632–43. doi: 10.1212/WNL.0000000000010660
25. Morotti A. CT markers of intracerebral hemorrhage expansion: Different sides of the same coin? Neurocrit Care (2019) 31:451–2. doi: 10.1007/s12028-019-00768-7
26. Wei Y, Zhu G, Gao Y, Chang J, Zhang H, Liu N, et al. Island sign predicts hematoma expansion and poor outcome after intracerebral hemorrhage: A systematic review and meta-analysis. Front Neurol (2020) 11:429. doi: 10.3389/fneur.2020.00429
27. Yogendrakumar V, Moores M, Sikora L, Shamy M, Ramsay T, Fergusson D, et al. Evaluating hematoma expansion scores in acute spontaneous intracerebral hemorrhage: a systematic scoping review. Stroke (2020) 51:1305–8. doi: 10.1161/STROKEAHA.119.028574
28. Lei C, Geng J, Chen C, Chang X. Accuracy of the blend sign on computed tomography as a predictor of hematoma growth after spontaneous intracerebral hemorrhage: a systematic review. J Stroke Cerebrovasc Dis (2018) 27:1705–10. doi: 10.1016/j.jstrokecerebrovasdis.2018.01.032
29. Li Q, Zhang G, Huang YJ, Dong M-X, Lv F-J, Wei X, et al. Blend sign on computed tomography: novel and reliable predictor for early hematoma growth in patients with intracerebral hemorrhage. Stroke (2015) 46:2119–23. doi: 10.1161/STROKEAHA.115.009185
30. Li Q, Zhang G, Xiong X, Wang X-C, Yang W-S, Li K-W, et al. Black hole sign: novel imaging marker that predicts hematoma growth in patients with intracerebral hemorrhage. Stroke (2016) 47:1777–81. doi: 10.1161/STROKEAHA.116.013186
31. Shakya MR, Fu F, Zhang M, Shan Y, Yu F, Sun S, et al. Comparison of black hole sign, satellite sign, and iodine sign to predict hematoma expansion in patients with spontaneous intracerebral hemorrhage. BioMed Res Int (2021) 2021:3919710. doi: 10.1155/2021/3919710
32. Shen Q, Shan Y, Hu Z, Chen W, Yang B, Han J, et al. Quantitative parameters of CT texture analysis as potential markersfor early prediction of spontaneous intracranial hemorrhage enlargement. Eur Radiol (2018) 28:4389–96. doi: 10.1007/s00330-018-5364-8
33. Morotti A, Boulouis G, Dowlatshahi D, Li Q, Barras CD, Delcourt C, et al. Standards for detecting, interpreting, and reporting noncontrast computed tomographic markers of intracerebral hemorrhage expansion. Ann Neurol (2019) 86:480–92. doi: 10.1002/ana.25563
34. Sollini M, Antunovic L, Chiti A, Kirienko M. Towards clinical application of image mining: a systematic review on artificial intelligence and radiomics. Eur J Nucl Med Mol Imaging (2019) 46:2656–72. doi: 10.1007/s00259-019-04372-x
35. Ursprung S, Beer L, Bruining A, Woitek R, Stewart GD, Gallagher FA, et al. Radiomics of computed tomography and magnetic resonance imaging in renal cell carcinoma-a systematic review and meta-analysis. Eur Radiol (2020) 30:3558–66. doi: 10.1007/s00330-020-06666-3
36. Arba F, Rinaldi C, Boulouis G, Fainardi E, Charidimou A, Morotti A. Noncontrast computed tomography markers of cerebral hemorrhage expansion: diagnostic accuracy meta-analysis. Int J Stroke (2021) 17 (8), 17474930211061639. doi: 10.1177/17474930211061639
Keywords: non-enhanced computer tomography, radiomics, hematoma expansion, meta-analysis, spontaneous intracerebral hemorrhage
Citation: Jiang Y-W, Xu X-J, Wang R and Chen C-M (2023) Efficacy of non-enhanced computer tomography-based radiomics for predicting hematoma expansion: A meta-analysis. Front. Oncol. 12:973104. doi: 10.3389/fonc.2022.973104
Received: 20 June 2022; Accepted: 20 December 2022;
Published: 10 January 2023.
Edited by:
Chen Liu, Army Medical University, ChinaReviewed by:
Chuyi Huang, Shanghai Jiao Tong University, ChinaArchana Hinduja, Wexner Medical Center, The Ohio State University, United States
Copyright © 2023 Jiang, Xu, Wang and Chen. This is an open-access article distributed under the terms of the Creative Commons Attribution License (CC BY). The use, distribution or reproduction in other forums is permitted, provided the original author(s) and the copyright owner(s) are credited and that the original publication in this journal is cited, in accordance with accepted academic practice. No use, distribution or reproduction is permitted which does not comply with these terms.
*Correspondence: Chun-Mei Chen, Y21jaGVuMjAwOUBzaW5hLmNvbQ==
†These authors have contributed equally to this work