 Hermine Lore Nguena Nguefack1
 M. Gabrielle Pagé2,3
 Manon Choinière2,3
 Alain Vanasse4,5Simon Deslauriers6
 Adriana Angarita-Fonseca1Marc-André Blanchette7
 Anaïs Lacasse1* on behalf of the TorSaDE Cohort Working Group
- 1Department of Health Sciences, Université du Québec en Abitibi-Témiscamingue, Rouyn-Noranda, QC, Canada
- 2Research Centre, Centre Hospitalier de l’Université de Montréal, Montreal, QC, Canada
- 3Department of Anesthesiology and Pain Medicine, Faculty of Medicine, Université de Montréal, Montreal, QC, Canada
- 4Department of Family Medicine and Emergency Medicine, Faculty of Medicine and Health Sciences, Université de Sherbrooke, Sherbrooke, QC, Canada
- 5Research Centre, Centre Hospitalier Universitaire de Sherbrooke, Sherbrooke, QC, Canada
- 6VITAM – Centre de recherche en santé durable, Centre Intégré Universitaire de Santé et de Services Sociaux de la Capitale-Nationale, Quebec, QC, Canada
- 7Département de Chiropratique, Université du Québec à Trois-Rivières, Trois-Rivières, QC, Canada
Objectives: Developing solutions to optimize care trajectories (CareTs) requires examining patient journeys through the health care system. This study aimed to describe CareTs among people living with arthritis and evaluate their association with self-reported health outcomes.
Methods: Analyses were conducted using the TorSaDE Cohort (n = 102,148), which connects the 2007 to 2016 Canadian Community Health Surveys (CCHS) with Quebec administrative databases (longitudinal claims). CareTs of participants living with arthritis according to CCHS (n = 16,631), over the two years before CCHS completion, were clustered using state sequence analysis (months as a time unit). CareT group membership was then put in association with self-reported outcomes (pain intensity and interference, self-perceived general and mental health).
Results: The analysis revealed five CareT groups characterized predominantly by: (1) arthritis-related visits to a specialist (n = 2,756; 16.6%), (2) arthritis-related emergency department visits (n = 2,928; 17.6%), (3) very high all-cause health care utilization and arthritis-related hospitalizations (n = 1,570; 9.4%), (4) arthritis-related medical visits to general practitioners and specialists (n = 2,708; 16.3%), (5) low all-cause health care utilization (n = 6,669; 40.1%). Multivariable results revealed that CareT group membership was associated with higher levels of pain interference (CareT group #3 vs. #5: OR: 1.4, 95%CI: 1.1–1.8) and fair/poor self-perceived general health (CareT group #1 vs. #5: OR: 1.551, 95%CI: 1.319–1.824; #2 vs. #5: OR: 1.244, 95%CI: 1.062–1.457; #3 vs. #5: OR: 1.771, 95%CI: 1.451–2.162; #4 vs. #5: OR: 1.481, 95%CI: 1.265–1.735).
Discussion: Sate sequence analysis is an innovative method of studying CareTs and valuable for making evidence-based decisions taking into account inter- and intra-individual variability.
Introduction
Arthritis includes several conditions that affect joints, the tissues surrounding joints, and other connective tissues (1). In Canada, arthritis is the most prevalent chronic disease, carrying a significant financial burden due to loss of productivity, disability, and increased health care costs (1, 2). This health condition affects approximately 20% of Canadians (2, 3). Over the next decade, an increase of about 3 million cases is expected, which will translate into 9 million persons living with arthritis (3). A number of negative physical, mental, and social consequences have been demonstrated as a result of arthritis (1, 3), which often translate into ambulatory care visits (1).
According to the “6W” model, individuals (who) living with various health conditions (why) will consult various types of health care professionals (which) in different care settings (where). Patients will receive a sequence of services (what) over specific periods of time (when) (4). Care trajectories can thus be defined as “patients' journeys through different components of the health care system over their chronic illness courses, care providers, care units and settings, and over time” (4). Understanding the care trajectories (CareTs) of people living with arthritis can provide policymakers and clinicians with valuable insight for improving the organization of health care and determining optimal planning of care processes (5). However, few studies have investigated CareTs in people living with arthritis. Ruetsch et al. (6) identified four CareT groups among people living with low back pain or osteoarthritis. Group membership was carried out by k-means clustering, where cases were separated into high and low service use intensity for each year using US claim data. However, this technique failed to account for the longitudinal nature of the data (6). Kiadaliri et al. (7) identified four trajectories of physical health care consultations (total number of primary care visits, secondary outpatient care visits, and hospital admissions) within a Swedish osteoarthritis cohort, using group-based trajectory modelling. Moreover, Mose et al. (8) found five 10-year trajectories of musculoskeletal health care use (total number of various types of health care contacts) among adult Danes reporting chronic musculoskeletal pain. The Kiadaliri's and Mose's studies (7, 8) did model the number of health care contacts over time but did not consider which event occurred before another in time (sequence of events). However, this is important to realize that hierarchy and continuity of care can influence the quality of care and patient outcomes (9).
The objective of this study was to describe the heterogeneity of longitudinal CareTs among people living with arthritis using state sequence analysis, an emerging statistical method allowing to group participants showing similar patterns of health care visits over time. The sociodemographic and clinical profile of the individuals who were grouped together in each of the CareT was then compared. Finally, the associations between CareT membership and patient-reported outcomes such as pain intensity, pain interference, perceived general health and perceived mental health were assessed.
Methods
Study design and data source
This observational retrospective cohort study was conducted using the TorSaDE Cohort (10), which was created by linking data from Quebec health administrative databases and the Canadian Community Health Survey (CCHS) database. The CCHS, an annual cross-sectional survey conducted by Statistics Canada (national statistical office), collects data on health status and health care utilization using a representative sample of the Canadian population (11). The TorSaDE Cohort includes CCHS respondents from the province of Quebec who participated in at least one of the five annual cycles (2007–2008, 2009–2010, 2011–2012, 2013–2014, 2015–2016). Quebec health administrative databases were used, which included information about health care services, hospitalizations, diagnoses, and health insurance registration provided to all Quebec residents (universal health care coverage). The TorSaDE Cohort contains longitudinal administrative data from 1996 to 2016. A detailed description of the TorSaDE Cohort is available elsewhere (10). Access to de-identified TorSaDE Cohort data was possible through the Institut de la statistique du Québec (ISQ) secure virtual server (data holder). Ethical authorizations were obtained from the Commission d'accès à l'information du Québec (#1013990) and relevant university Research Ethics Boards (UQAT: # 2018–02 –Lacasse, A.; CHUS: #2017–1504).
Study population
The TorSaDE Cohort includes 102,148 individual participants who completed 103,241 entries (individuals can take part in more than one CCHS cycle). As shown in Figure 1, those who met the following inclusion criteria formed our study population: (1) for individuals with more than one CCHS entry, only the most recent entry was retained (n = 102,148); and (2) participants who responded “yes” to the CCHS question “Do you have arthritis, excluding fibromyalgia?” (n = 16,631). Although arthritis could have been defined using case-finding algorithms applied to administrative health claims (12–15), preference was given to self-reported CCHS data as it allowed for the formation of a community sample of people living with arthritis that includes individuals with little or no contact with the health care system and who are often understudied in administrative database health service research studies. The reliability of self-reported chronic conditions in the CCHS have been shown to be high (16).
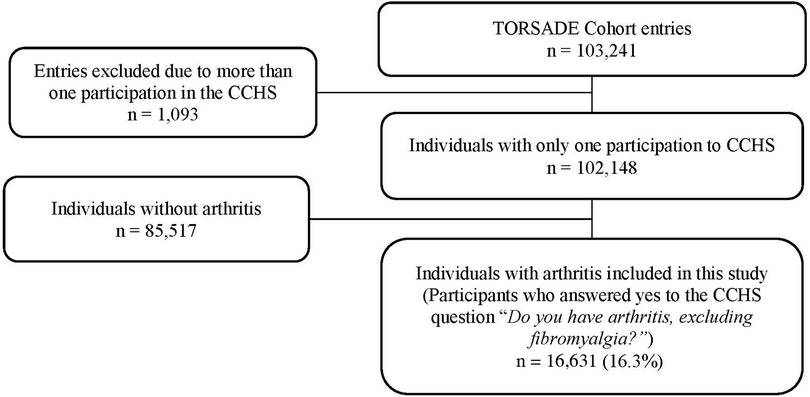
Figure 1. Study sample selection.
Study variables
Care trajectories. CareTs in the two years before CCHS completion were modelled using health administrative data (time unit: months). State sequence analysis based on optimal matching was conducted and allowed to cluster individuals with similar patterns of health care visits over time into various CareT groups (see complete description of the statistical analysis). CareT group membership was then put in association with various patient-reported outcomes measured in the CCHS. Outcomes of interest. Four CCHS outcomes relevant to pain and health-related quality of life were chosen and put in association with CareTs. The outcomes were as follows: (1) pain intensity [respondents reporting pain or discomfort were asked “How would you describe the usual intensity of your pain or discomfort?” (Mild/Moderate/Severe)]; when respondents reported no pain/discomfort, pain intensity was coded as “None”); (2) pain interference [“How many activities does your pain or discomfort prevent?” (None/A few/Some/Most)]; (3) perceived general health [“In general, would you say your health is…?” (Excellent/Very good/Good/Fair/Poor)]; (4) perceived mental health [“In general, would you say your mental health is…?” (Excellent/Very good/Good/Fair/Poor)]. The reliability of responses to CCHS questions has been previously demonstrated (16). Covariables. Covariables were selected according to Andersen's (1995) model (17), which is widely used in health care utilization studies (18). Factors put forward in this model include: (1) health care utilization predisposing factors, i.e., in our study: biological sex, age, race/ethnicity, indigenous identity, country of birth, education, marital status, alcohol consumption, and smoking habits, (2) enabling factors: region of residence (remote, non-remote, rural, urban), income, drug insurance status, access to a general practitioner, number of different prescribers, and access to a pain clinic, and (3) need factors: back problems, Charlson Comorbidity Index (19, 20), and body mass index. To be selected, covariables had to be measured in the five CCHS cycles included in the TorSaDE Cohort and had to be available for at least 15% of our sample (for example, work-related variables were only measured among workers aged 18 to 50 years; other variables are not measured in all CCHS cycle and were thus excluded).
Statistical analysis
Our statistical plan was developed in other to reflect as best as possible the components of the “6W” model (4). Study population characteristics. Descriptive statistics (means, standard deviations, counts and percentages) were used to summarize the main characteristics of the study sample. State sequence analysis. Identification of CareT group membership [i.e., individuals following similar journeys through different components of the health care system over their chronic illness courses, care providers, care units and settings, and over time” (4)] was completed using state sequence analysis (21, 22). The complete description of the state sequence analysis, including (1) Defining the cohort of patients, the observation period, and the time unit, (2) Choice and prioritization of medical events (states) of interest, (3) Use of an appropriate distance or similarity measure method to calculate the distance between the pairs of sequences, resulting in a distance matrix, (4) Selection and application of a classification method based on the calculated distance matrix that results in distinct groups of patients sharing similar patterns of health care utilization (CareT groups), and (5) visual representation of CareT using chronograms (state distribution plots), is presented in Supplementary Digital Content S1. Profiles of the various CareT groups. In addition to chronograms and narrative descriptions of each CareT group, descriptive statistics were also computed (membership count and sociodemographic/clinical profile). CareT groups in relation to self-reported outcomes. Pain intensity, pain interference, perceived general health, and perceived mental health were first compared across CareT groups using bivariate analyses (Chi-square and Kruskal-Wallis tests). Post-hoc pairwise analysis with p-value corrections were performed using Tukey-style multiple comparisons of proportions and Dwass-Steel-Critchlow-Fligner tests. Multivariable logistic regression models were used to assess the association between CareT group membership (independent variable) and two of our outcomes of interest while accounting for confounding factors (for a matter of conciseness, only pain interference and perceived general health were modelled using multivariate analyses). Those two outcomes were prioritized because they covered both pain-specific and generic aspects of patients daily living. In the two multivariable logistic regression models aiming at predicting unfavourable outcomes, pain interference response categories were dichotomized as: 1 = Most/some activities prevented by pain or discomfort; 0 = None/A few activities prevented by pain or discomfort. Perceived general health response categories were dichotomized as: 1 = Poor/Fair; 0 = Excellent/Very good/Good. Odds ratios (OR) and 95% confidence intervals (CI) were calculated. CareT group #5 (“low utilization”) was chosen as the reference category for interpretation. As per recent literature recommendations, all covariables were identified a priori and included in the model (as opposed to other criticized covariate selection techniques such as relying on bivariate regression analysis p-values (23) or stepwise variable selection (24, 25)). Variance inflation factors (VIFs) below 5 (26) were used in order to detect variables with a multicollinearity issue. Various statistics such as the Hosmer-Lemeshow test (values for model 1 and model 2: p = 0.2598 and p < .0001) and the c index (0.889 and 0.832) supported the quality of our models. A sensitivity analysis was carried out to assess the impact of a multiple imputation technique for missing data (25) on our conclusions. Multiple imputation by fully conditional specification (FCS) method was applied with 5 repetitions. State sequence analysis was performed using the R package TraMineR (R Core Team, Vienna, Austria) while all other analyses were carried out with SAS 9.4 (SAS Institute, Cary, NC, USA).
Results
Sample characteristics
The characteristics of study participants are shown in Table 1 (n = 16,631). Mean age was 65.5 ± 13.5 years, 66.7% of participants were females and 2.6% self-identified as Indigenous people. Only half of participants (52.6%) had a medical claim associated with an arthritic condition diagnosis in the two years prior to CCHS completion (non mutually exclusive variables: 28.0% with osteoarthritis diagnosis, 5.7% with a rheumatoid arthritis diagnosis, 37.2% with other arthritic conditions diagnosis). A third (32.3%) perceived their general health as poor or fair, while 33.8% did so for their mental health.
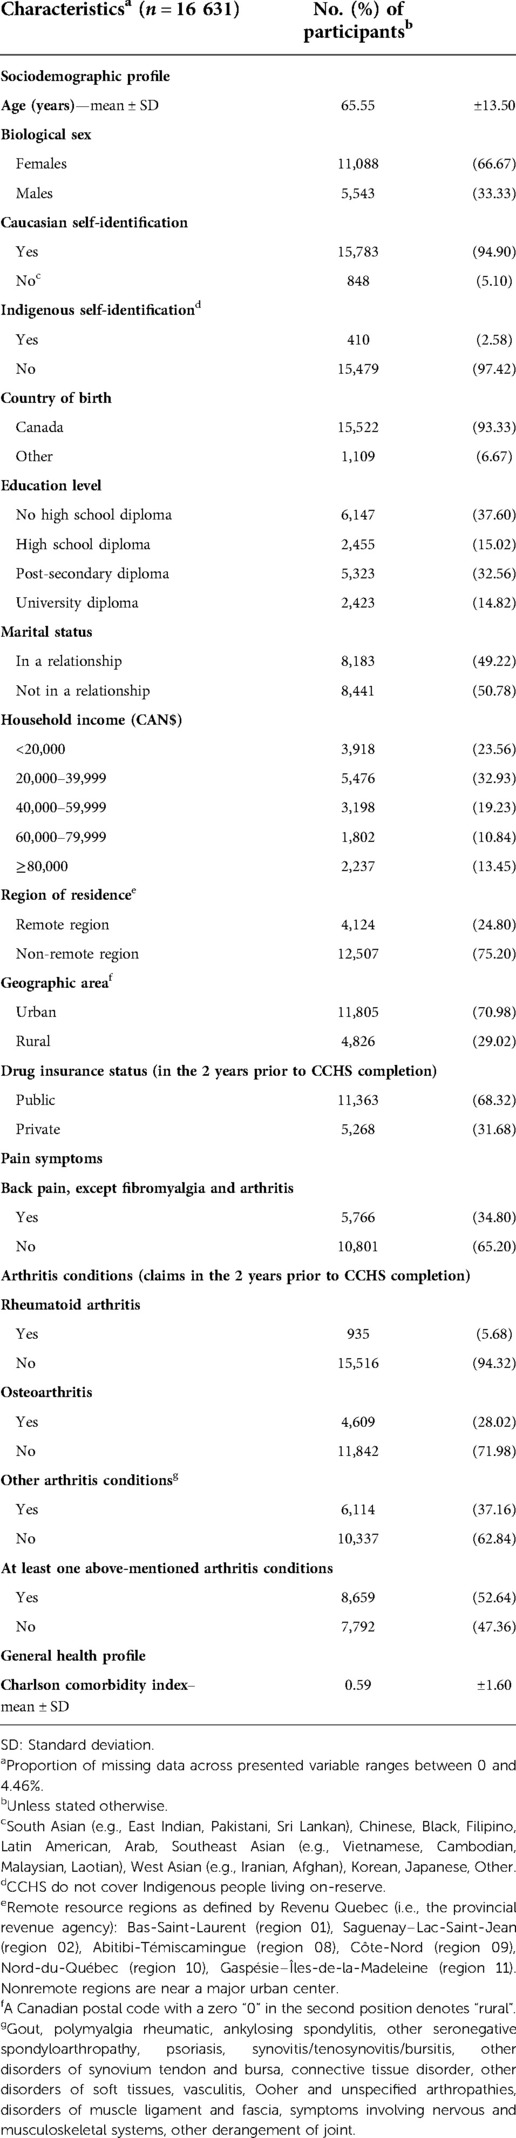
Table 1. Sample characteristics.
Narrative description of CareT groups
Based on the state sequence analysis dendrogram (represents similarities between participants and how they can be grouped) and inertia jump curve (from five, we see that the increase in the number of trajectories/clusters does not provide much more information, i.e., inertia) (Figure 2), patients with similar care sequences were classified into five distinct CareT groups (Figure 3 where each colour represents frequency of different medical events throughout time). According to chronograms' interpretation, their particularities in terms of all-cause health care utilization and arthritis-related visits were described and are presented in Table 2. CareT group #1 was made up of participants with high all-cause health care utilization and frequent arthritis-related ambulatory medical visits with predominance of visits to a specialist as compared to other groups (“high utilization/specialists” n = 2,756; 16.6%). CareT group #2 consisted of participants with moderate all-cause health care utilization and more frequent arthritis-related ED visits than the other groups (“moderate utilization/ED” n = 2,928; 17.6%). CareT group #3 included participants with very high all-cause health care utilization and more frequent arthritis-related hospitalizations than the other groups (“very high utilization/arthritis-related hospitalizations” n = 1,570; 9.4%). CareT group #4 was made up of participants with moderate all-cause health care utilization and more frequent arthritis-related medical visits to GPs or specialists than the other groups (“moderate utilization/arthritis-related physicians” n = 2,708; 16.3%). Lastly, CareT group #5 was made up of participants with low all-cause health care utilization (“low utilization” n = 6,669; 40.1%).
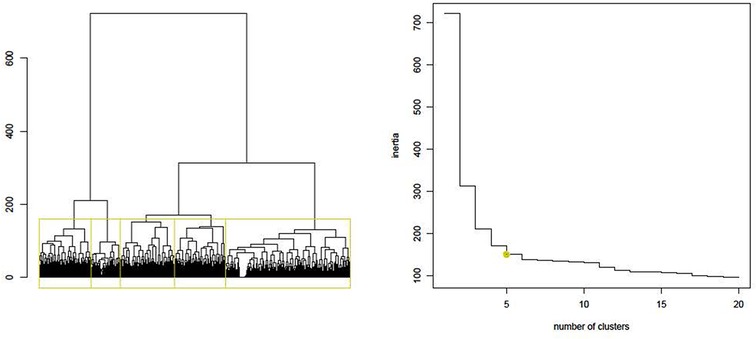
Figure 2. Dendrogram and inertia jump curve for the choice of the number of groups.
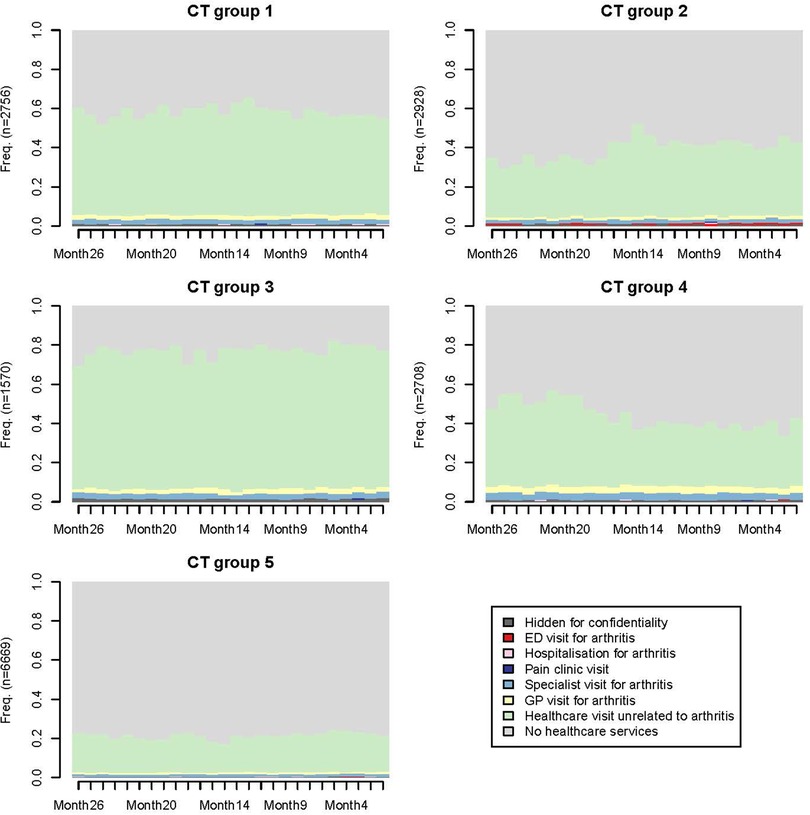
Figure 3. Chronograms reflecting patterns of health care visits over time for each CareT group.
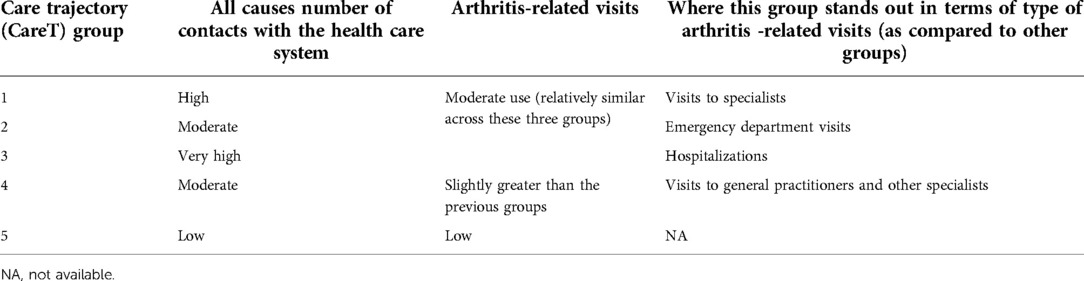
Table 2. CareT groups’ description.
CareT group profiles
Based on bivariate statistical comparisons (without taking confounding factors into account), CareT groups differed in terms of sociodemographic characteristics, utilization of health care services during the two years prior to CCHS completion (Table 3), and health outcomes (Table 4). Specifically, participants in the “very high utilization/arthritis-related hospitalizations” group showed the highest proportion of females (71.2%), participants with no high school diploma (43.3%), participants with an annual household income under CAN$20,000 (31.2%), and individuals with medical claims related to osteoarthritis (35.7%). Furthermore, it featured the smallest proportion of participants residing in a remote region (18.66%). In addition, participants in that group had the highest average number of all-cause GP ambulatory visits (7.00 ± 5.54), specialist ambulatory visits (11.03 ± 14.97), hospitalizations (0.58 ± 0.94), and ED visits (1.42 ± 2.12) in the two years prior to CCHS completion. The “very high utilization/arthritis-related hospitalizations” group also had the highest average Charlson Comorbidity Index (1.85 ± 2.73). The “low utilization” group had the highest proportion of males, participants residing in a remote region and individuals with higher socioeconomic status.
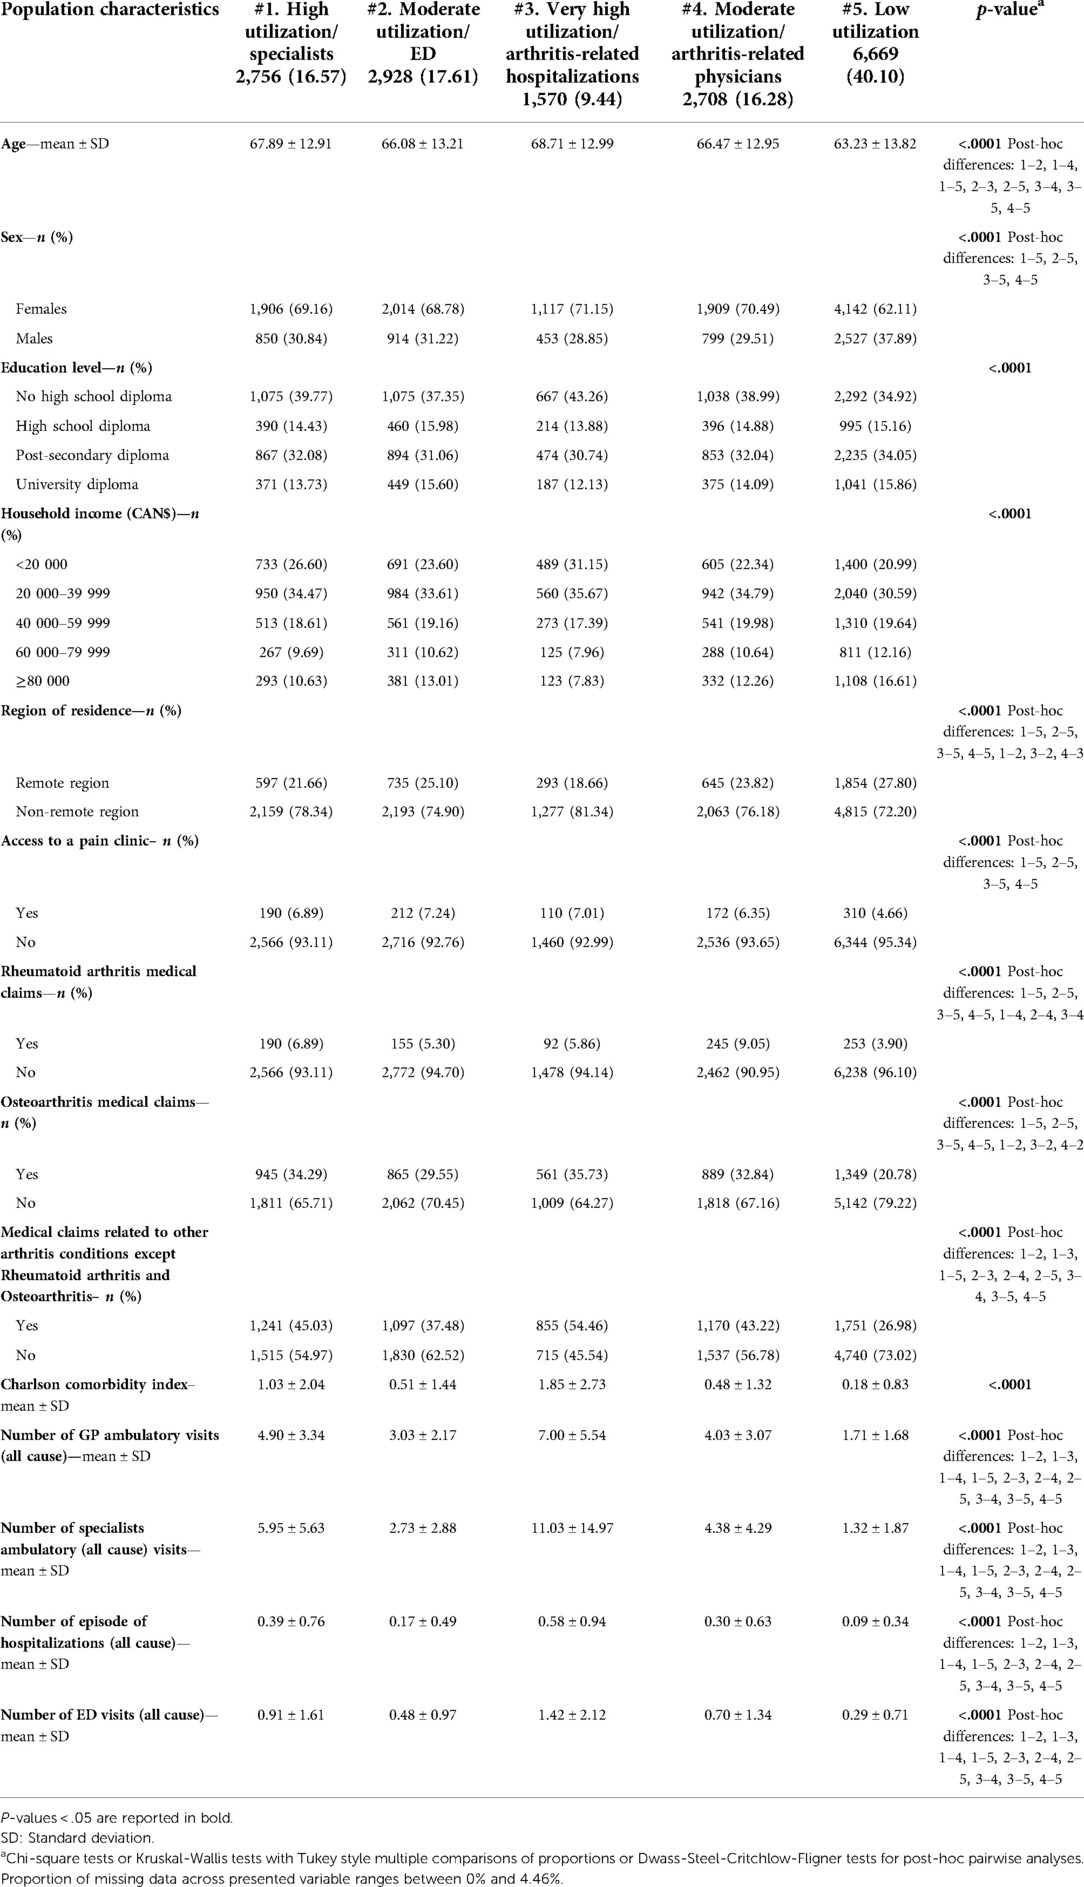
Table 3. Arthritis patients’ characteristics according to their CareT group membership.
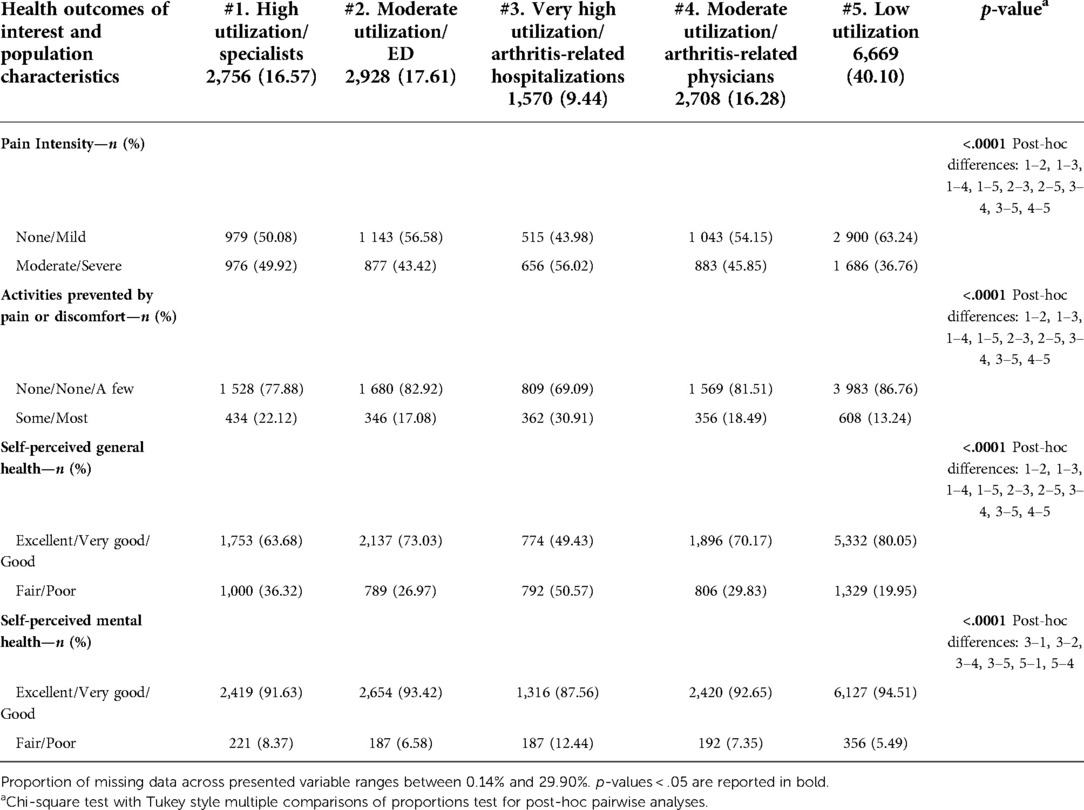
Table 4. Health outcomes of interest according to CareT group membership.
Regarding self-reported health outcomes (Table 4), participants in the “very high utilization/arthritis-related hospitalizations” group had a higher proportion of moderate to severe pain intensity (56.02%), some or most activities prevented by pain or discomfort (30.91%), fair/poor self-perceived general health (50.57%), and fair/poor self-perceived mental health (12.44%) as compared to participants in the other CareT groups. The “low utilization” group showed the best outcomes compared to the other groups.
Multivariable analysis of pain interference
The main results of the multivariable logistic regression model used to assess the association between CareT group membership and pain interference while adjusting for sociodemographic and clinical characteristics are shown in Table 5. Analysis revealed that membership to the “very high utilization/arthritis-related hospitalizations” group was predictive of greater pain interference (associated with a greater risk of seeing some or most of the activities prevented by pain or discomfort) as compared to participants in the “low utilization” group (adjusted OR: 1.4, 95% CI: 1.1–1.8). The complete results of the regression model (including coefficients for all other covariables associated with pain interference) are presented in Supplementary Digital Content S2.
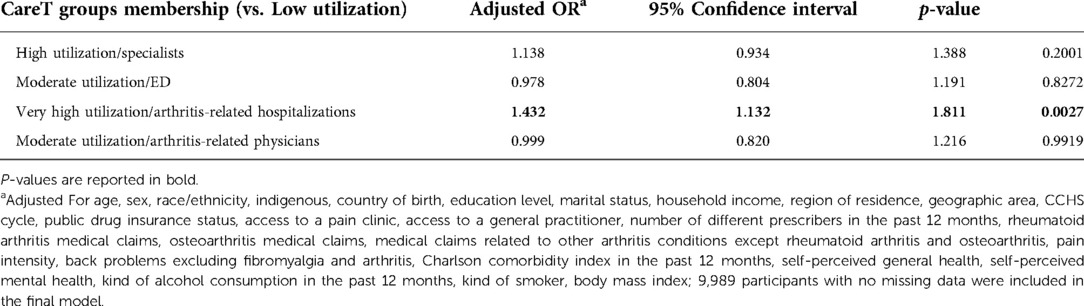
Table 5. Multivariable logistic regression model exploring associations between CareT groups membership and greater pain interference (some/most activities prevented by pain or discomfort).
Multivariable analysis of self-perceived general health
Table 6 provides the main findings of the multivariable model used to evaluate the association between CareT group membership and self-perceived general health. Compared to the participants in the “low utilization” group, membership to all other CareT groups was associated with a higher likelihood of perceiving their general health as poor or fair (“high utilization/specialists”: aOR: 1.6, 95% CI: 1.3–1.8; “moderate utilization/ED”: aOR: 1.2, 95% CI: 1.1–1.5; “very high utilization/arthritis-related hospitalizations”: aOR: 1.8, 95% CI: 1.5–2.2; “moderate utilization/arthritis-related physicians”: aOR: 1.5, 95% CI: 1.3–1.7). The complete results of the multivariable model are presented in Supplementary Digital Content S3.
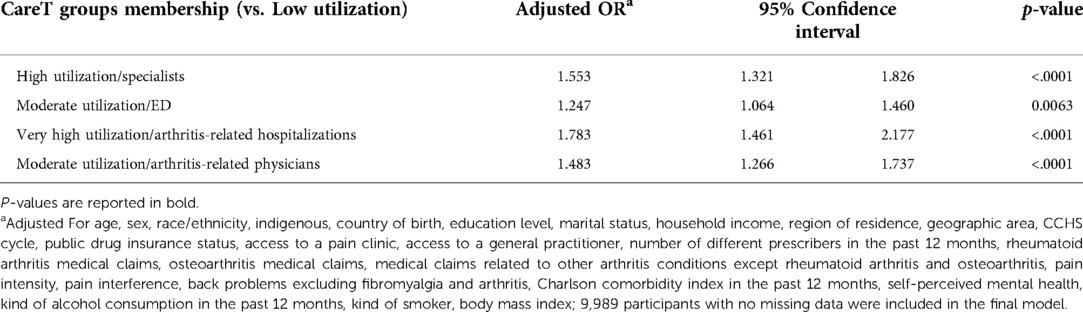
Table 6. Multivariable logistic regression model exploring associations between CareT groups membership and poor/fair self-perceived general health.
Multiple imputation of missing values did not change our main conclusions of the two above-mentioned multivariable analyses (the models are presented in Supplementary Digital Contents S4 and S5).
Discussion
This study aimed to identify CareT among 16,631 people living with arthritis and to explore the associations between CareT group membership and patient-reported outcomes such as pain intensity, pain interference, perceived general health and perceived mental health. State sequence analysis allowed for the identification of five CareT groups that were heterogenous in terms of all-cause health care utilization and arthritis-related visits patterns. Patient-reported outcomes and sociodemographic profiles varied according to CareT trajectory membership.
Several authors studied health care utilization and journeys through the health care system of persons living with arthritis in Canada (5, 27–30). However, individual-centered statistical approaches (22) were rarely used to better capture inter- and intra-individual variability of CareTs in this population. On an international scale, no study to our knowledge has looked at the heterogeneity of CareT profile among persons living with arthritis using state sequence analysis, but some comparisons are possible with longitudinal studies conducted in more specific populations and using other types of individual-centered statistical approaches (e.g., latent class modelling). Mose et al. (8) used latent class growth analysis or group-based trajectory modelling (GBTM) to find five 10-year trajectories (2008 to 2017) of musculoskeletal health care use among adult Danes reporting chronic musculoskeletal pain. Kiadaliri et al. (7) identified four trajectories of physical health care consultations within a Swedish osteoarthritis cohort, using GBTM on monthly health care use over the last 12 months of life. As in our study, they both identified low and a high health care utilization groups. However, these two studies modelled the number of health care contacts but failed to analyze the sequence of health care services, or the type of services used (i.e., arthritis related) both considered important factors in defining a care trajectory (31). Overall, our study brings a unique Canadian universal health care perspective, while in line with previous work underlying the presence of heterogeneity in people care utilization, which underlines the importance of using individual-centered statistical approach in arthritis health service research. In other words, depicting health care utilization using single aggregate measures such as average or median number of visits per year is not appropriate to grasp the reality of arthritis patients. The current study is a first step and proof of concept, but further analyses for specific arthritic conditions will be important.
This study showed that participants of the “very high utilization/arthritis-related hospitalizations” group recorded the worst outcomes in terms of pain intensity, pain interference, and self-perceived general and mental health. This was confirmed by multivariable analyses adjusting for comorbidity and other potential confounders. In line with our results, previous studies reported that in the Canadian universal health coverage context, heavy health care use and greater disability are closely linked among patients suffering from chronic non-cancer pain (32) or the general population (33).
In terms of profiles, the “very high utilization/arthritis-related hospitalizations” group had the highest proportion of females, individuals with medical claims related to osteoarthritis, individuals with no high school diploma, and individuals reporting an annual household income below CAN$20,000. Furthermore, it was made up of older individuals and recorded the highest average Charlson Comorbidity Index. Using Andersen's model, Jacobi et al. (34) showed that need factors and predisposing factors explained most of the differences in the use of health care among patients with rheumatoid arthritis. Our results provide valuable information for clinicians and policymakers to identify early on patients who are likely to have a very high health-care utilization and consequently adapt healthcare services (e.g., increase primary care visits to reduce specialist's visits and hospitalization).
It is interesting to point out that the “low utilization” group showed the best outcomes in terms of pain intensity, pain interference, and self-perceived general and mental health. This group also had a higher proportion of males, individuals with a university diploma, reporting an annual household income above CAN$80,000 or more, and were healthier according to the Charlson Comorbidity Index. Those more privileged individuals did not use the health care system as much as the others. Our assessment of outcomes and profile variations between CareT groups can thus be used for better planning of care pathways, but also to raise awareness of the socioeconomic disparities that are present. Our results are aligned with other studies reporting socioeconomic differences in arthritis-related health care (35). Further research should however focus on understanding the presence disparities vs. inequities in arthritis-related health care. Disparities are not undesirable in itself unless it results in some unfairness and injustice, as compared to inequities that are undesirable, should be subject to moral criticism and implies unfairness and injustice (36, 37). Clinicians and policy makers should develop models of care, care pathways and treatment approaches that allow everyone, regardless of socioeconomic status or privilege, to have the chance of experiencing positive health outcomes.
One out of three of our participants perceived their general health as poor or fair. This study suggests that high use of health care services was associated with high pain interference and poor self-perceived health. These results are similar those of Zhao et al. (38), according to which high health care resource utilization is associated with high pain interference in adults living with osteoarthritis in the United States, and urge the need to find solutions to help arthritis patients optimize their health care utilization (for instance, by improving professional practices, including those of nurses, regarding the management of such patients) and decrease patient disability, which in turn could help lead to a decreased utilization of health care services over the next years.
Additional findings
Our results also show that having osteoarthritis- or other arthritic conditions-related medical claims was associated with a greater risk of seeing some or most activities prevented due to pain or discomfort (Supplementary Digital Content S2). Surprisingly, rheumatoid arthritis medical claims were not associated with pain interference in the multivariable model, although rheumatoid arthritis is known to be debilitating and associated with daily activity limitations (39, 40). In other words, when adjusting for the type of CareT and all relevant potential cofounders, living with rheumatoid arthritis and being supported by health care professionals for its treatment did not appear to be a predictor of greater pain interference. Although those results should be investigated further, a preliminary hypothesis is that patients who use the health care system for rheumatoid arthritis and are cared for with all the recent advances in terms of treatment do not experience severe pain that could interfere with their daily activities. The link between remote region residence and CareTs would also be interesting to investigate further.
Strengths and limitations
The major strength of this study lies in the use of a very large and rich population survey linked to medical administrative claims. Because arthritis cases were not based on medical claims (rather based on self-reports), we were able to include participants who did not visit the health care system thus providing a greater generalizability of our results to persons living with arthritis in the community. In our sample, the proportion of persons reporting arthritis was 16.3%, which is similar to arthritis prevalence in Canada (2). As state sequence analysis includes the steps of choosing a time unit and prioritization of health events, it cannot be excluded that different time unit/prioritization scheme could have led to different results. As participants were not selected according to administrative data, the index date was defined as CCHS completion and not related to a significant event in the CareTs of arthritis patients (e.g., first diagnosis or hospitalization). Consequently, trajectories modelled in this study represent a random picture of a part of the life course of participants and patterns of health care utilization were quite stable over time. Following this first proof of concept, further studies are needed to better understand CareTs after a first arthritis diagnosis, to conduct a proper sex- and gender-based analysis (SGBA) (41–43) and to focus on arthritic subpopulations (e.g., osteoarthritis, rheumatoid arthritis). In fact, CCHS data do not distinguish among different types of arthritis and only half of participants had in their administrative data a medical claim associated with an arthritic condition diagnosis in the two years prior to CCHS completion. Although the TorSaDE Cohort is generic and does not contain the most commonly used self-reported instruments in the field of pain (44), it still allowed to account for pain characteristics and adjusting for expected confounding variables.
Conclusion
This study revealed five CareT groups in a wide sample of arthritis patients in Quebec (Canada) and showed that these CareT groups had heterogeneous profiles in terms of sociodemographic characteristics, comorbidity index and health outcomes. Membership to a very high all-cause health care utilization and most frequent arthritis-related hospitalization group was associated with a greater risk of seeing some or most activities prevented by pain or discomfort and higher likelihood of perceiving general health as poor or fair. Besides informing policies for care and public health, these findings could help improve health outcomes for patients with arthritis and, more generally, achieve the common goal of improving population health outcomes by using a more personalised treatment approach based on the CareT types.
Data availability statement
The data analyzed in this study is subject to the following licenses/restrictions: TorSaDE Cohort data links Statistics Canada's Canadian Community Health Survey (CCHS) and Quebec Health Ministry data and are not publicly available. Access has to be granted by the Institut de la statistique du Québec (ISQ) (data holder) and the Commission d’accès à l’information du Québec. Requests to access these datasets should be directed toc2FkQHN0YXQuZ291di5xYy5jYQ==.
Ethics statement
The studies involving human participants were reviewed and approved by Commission d'accès à l'information du Québec (#1013990) and relevant university Research Ethics Boards (UQAT: #2018–02 –Lacasse, A.; CHUS: #2017–1504). Written informed consent from the participants’ legal guardian/next of kin was not required to participate in this study in accordance with the national legislation and the institutional requirements.
On behalf of
Past and current members of the TorSaDE Cohort Working Group are as follows: Alain Vanasse (outgoing director), Alexandre Lebel, Amélie Quesnel-Vallée, Anaïs Lacasse (incoming director), André Néron, Anne-Marie Cloutier, Annie Giguère, Benoit Lamarche, Bilkis Vissandjee, Catherine Hudon, Danielle St-Laurent, David Buckeridge, Denis Roy, Geneviève Landry, Gillian Bartlett, Guillaume Blanchet, Hermine Lore Nguena Nguefack, Isabelle Leroux, Jaime Borja, Jean-François Ethier, Josiane Courteau, Lucie Blais, Manon Choinière, Marc Dorais, Marc-André Blanchette, Marc-Antoine Côté-Marcil, Marie-Josée Fleury, Marie-Pascale Pomey, Mike Benigeri, Mireille Courteau, Nadia Sourial, Pasquale Roberge, Pier Tremblay, Pierre Cambon, Roxanne Dault, Sonia Jean, Sonia Quirion, Stéphanie Plante, Thomas Poder, Valérie Émond.
Author contributions
AL, AV, MC, and MGP conceptualized the project and secured CIHR funding. MGP, MC, SD, and AL were involved in the expert committee for health care events prioritization. HLNN conducted the statistical analysis and drafted the manuscript under the supervision of AL (with the help of AA-F and M-AB who contributed to the literature review and interpretation of data). All authors contributed to the article and approved the submitted version.
Funding
This study was supported by the Canadian Institutes of Health Research (CIHR) (#PJT 156043 and #PCG155479). The implementation of the TorSaDE Cohort was funded by the Quebec SUPPORT Unit (Support for People and Patient-Oriented Research and Trials), an initiative funded by the CIHR, the Ministry of Health and Social Services of Québec, and the Fonds de recherche du Québec – Santé (FRQS). During the study, MGP and AL were respectively Junior 1 and Junior 2 research scholars from the FRQS while AA-F was a postdoctoral FRQS scholar.
Acknowledgments
We would like to thank members of the TorSaDE Cohort Working Group, whose sharing of methodologies and statistical packages facilitated the application of state sequence analysis. We also thank Emily-Jayn Rubec, who provided linguistic revision services for this paper.
Conflict of interest
The authors declare that the research was conducted in the absence of any commercial or financial relationships that could be construed as a potential conflict of interest.
Publisher's note
All claims expressed in this article are solely those of the authors and do not necessarily represent those of their affiliated organizations, or those of the publisher, the editors and the reviewers. Any product that may be evaluated in this article, or claim that may be made by its manufacturer, is not guaranteed or endorsed by the publisher.
Supplementary material
The Supplementary Material for this article can be found online at: https://www.frontiersin.org/articles/10.3389/fpain.2022.1014793/full#supplementary-material.
References
1. Public Health Agency of Canada. Life with arthritis in Canada: A personal and public health challenge. Ottawa: Public Health Agency of Canada (2010).
2. Badley EM, Goulart CM, Millstone DB, Perruccio AV. An update on arthritis in Canada—national and provincial data regarding the past, present, and future. J Rheumatol. (2019) 46(6):579–86. doi: 10.3899/jrheum.180147
3. Badley E, Wilfong J, Zahid S, Perruccio A. The status of arthritis in Canada: national report. Arthritis Soc. (2019). Available at: https://arthritis.ca/getmedia/13aff08f-f206-4c6e-a709-beb80b97bd51/ACREU_Arthritis-Society_National-Report-2019_final.pdf. Accessed 1st November 2022.
4. Vanasse A, Courteau M, Ethier JF. The ‘6W’ multidimensional model of care trajectories for patients with chronic ambulatory care sensitive conditions and hospital readmissions. Public Health. (2018) 157:53–61. doi: 10.1016/j.puhe.2018.01.007
5. Pelaez I, Infante C, Quintana R. Help-seeking trajectory in patients with rheumatoid arthritis. Clin Rheumatol. (2015) 34(1):17–28. doi: 10.1007/s10067-015-3013-z
6. Ruetsch C, Tkacz J, Kardel PG, Howe A, Pai H, Levitan B. Trajectories of health care service utilization and differences in patient characteristics among adults with specific chronic pain: analysis of health plan member claims. J Pain Res. (2013) 6:137. doi: 10.2147/JPR.S38301
7. Kiadaliri A, Englund M. Variability in end-of-life healthcare use in patients with osteoarthritis: a population-based matched cohort study. Osteoarthritis Cartilage. (2021) 29(10):1418–25. doi: 10.1016/j.joca.2021.07.001
8. Mose S, Kent P, Smith A, Andersen JH, Christiansen DH. Trajectories of musculoskeletal healthcare utilization of people with chronic musculoskeletal pain—a population-based cohort study. Clin Epidemiol. (2021) 13:825–43. doi: 10.2147/CLEP.S323903
9. Uijen AA, Schers HJ, Schellevis FG, van den Bosch WJHM. How unique is continuity of care? A review of continuity and related concepts. Fam Pract. (2011) 29(3):264–71. doi: 10.1093/fampra/cmr104
10. Vanasse A, Chiu YM, Courteau J, Dorais M, Bartlett G, Zawaly K, et al. Cohort profile: the care trajectories—enriched data (TorSaDE) cohort. Int J Epidemiol. (2021) 50(4):1066-h. doi: 10.1093/ije/dyaa167
11. Statistics Canada. Canadian Community health survey (CCHS) annual component. Ottawa: Statistics Canada (2021). Available at: https://www23.statcan.gc.ca/imdb/p2SV.pl?Function=getSurvey&Id=1314175
12. Chung CP, Rohan P, Krishnaswami S, McPheeters ML. A systematic review of validated methods for identifying patients with rheumatoid arthritis using administrative or claims data. Vaccine. (2013) 31:K41–61. doi: 10.1016/j.vaccine.2013.03.075
13. Moores KG, Sathe NA. A systematic review of validated methods for identifying systemic lupus erythematosus (SLE) using administrative or claims data. Vaccine. (2013) 31:K62–73. doi: 10.1016/j.vaccine.2013.06.104
14. Shrestha S, Dave AJ, Losina E, Katz JN. Diagnostic accuracy of administrative data algorithms in the diagnosis of osteoarthritis: a systematic review. BMC Med Inform Decis Mak. (2016) 16(1):1–12. doi: 10.1186/s12911-016-0319-y
15. Widdifield J, Labrecque J, Lix L, Paterson JM, Bernatsky S, Tu K, et al. Systematic review and critical appraisal of validation studies to identify rheumatic diseases in health administrative databases. Arthritis Care Res. (2013) 65(9):1490–503. doi: 10.1002/acr.21993
16. Raina P, Bonnett B, Waltner-Toews D, Woodward C, Abernathy T. How reliable are selected scales from population-based health surveys? An analysis among seniors. Can J Public Health. (1999) 90(1):60–4. doi: 10.1007/BF03404102
17. Andersen RM. Revisiting the behavioral model and access to medical care: does it matter? J Health Soc Behav. (1995) 36(1):1–10. doi: 10.2307/2137284
18. Babitsch B, Gohl D, Von Lengerke T. Re-revisiting Andersen's Behavioral model of health services use: a systematic review of studies from 1998–2011. Psychosoc Med. (2012) 9:Doc11. doi: 10.3205/psm000089
19. Charlson ME, Pompei P, Ales KL, MacKenzie CR. A new method of classifying prognostic comorbidity in longitudinal studies: development and validation. J Chronic Dis. (1987) 40(5):373–83. doi: 10.1016/0021-9681(87)90171-8
20. Needham DM, Scales DC, Laupacis A, Pronovost PJ. A systematic review of the Charlson comorbidity index using Canadian administrative databases: a perspective on risk adjustment in critical care research. J Crit Care. (2005) 20(1):12–9. doi: 10.1016/j.jcrc.2004.09.007
21. Ritschard G, Studer M. Sequence analysis and related approaches: innovative methods and applications. Springer Nature (2018). doi: 10.1007/978-3-319-95420-2
22. Nguefack HLN, Pagé MG, Katz J, Choinière M, Vanasse A, Dorais M, et al. Trajectory modelling techniques useful to epidemiological research: a comparative narrative review of approaches. Clin Epidemiol. (2020) 12:1205. doi: 10.2147/CLEP.S265287
23. Sourial N, Vedel I, Le Berre M, Schuster T. Testing group differences for confounder selection in nonrandomized studies: flawed practice. Can Med Assoc J. (2019) 191(43):E1189–E93. doi: 10.1503/cmaj.190085
24. Wiegand RE. Performance of using multiple stepwise algorithms for variable selection. Stat Med. (2010) 29(15):1647–59. doi: 10.1002/sim.3943
25. Katz MH. Multivariable analysis: a practical guide for clinicians and public health researchers. Cambridge: Cambridge university press (2011). doi: 10.1017/CBO9780511974175
26. Vatcheva KP, Lee M, McCormick JB, Rahbar MH. Multicollinearity in regression analyses conducted in epidemiologic studies. Epidemiology. (2016) 6(2):227. doi: 10.4172/2161-1165.1000227
27. Feldman DE, Bernatsky S, Haggerty J, Leffondre K, Tousignant P, Roy Y, et al. Delay in consultation with specialists for persons with suspected new-onset rheumatoid arthritis: a population-based study. Arthritis Rheum. (2007) 57(8):1419–25. doi: 10.1002/art.23086
28. Badley EM, Canizares M, Gunz AC, Davis AM. Visits to rheumatologists for arthritis: the role of access to primary care physicians, geographic availability of rheumatologists, and socioeconomic status. Arthritis Care Res. (2015) 67(2):230–9. doi: 10.1002/acr.22413
29. Deslauriers S, Roy JS, Bernatsky S, Feldman DE, Pinard AM, Desmeules F, et al. Factors associated with waiting times for persons with rheumatic conditions in multidisciplinary pain treatment facilities. J Pain Res. (2019) 12:2379–90. doi: 10.2147/JPR.S206519
30. Page MG, Tousignant-Laflamme Y, Dorais M, Beaudry H, Fernet M. Characteristics of persons seeking care for moderate to severe pain due to chronic low back pain and osteoarthritis: a cross-sectional study. J Pain Res. (2022) 15:1125–39. doi: 10.2147/JPR.S360314
31. Vanasse A, Courteau J, Courteau M, Benigeri M, Chiu YM, Dufour I, et al. Healthcare utilization after a first hospitalization for COPD: a new approach of state sequence analysis based on the ‘6W’ multidimensional model of care trajectories. BMC Health Serv Res. (2020) 20(1):1–15. doi: 10.1186/s12913-020-5030-0
32. Antaky E, Lalonde L, Schnitzer ME, Martin É, Berbiche D, Perreault S, et al. Identifying heavy health care users among primary care patients with chronic non-cancer pain. Can J Pain. (2017) 1(1):22–36. doi: 10.1080/24740527.2017.1326088
33. Rosella LC, Fitzpatrick T, Wodchis WP, Calzavara A, Manson H, Goel V. High-cost health care users in Ontario, Canada: demographic, socio-economic, and health status characteristics. BMC Health Serv Res. (2014) 14(1):1–13. doi: 10.1186/s12913-014-0532-2
34. Jacobi CE, Triemstra M, Rupp I, Dinant HJ, Van Den Bos GA. Health care utilization among rheumatoid arthritis patients referred to a rheumatology center: unequal needs, unequal care? Arthritis Rheum. (2001) 45(4):324–30. doi: 10.1002/1529-0131(200108)45:4%3C324::AID-ART344%3E3.0.CO;2-1
35. Barnabe C. Disparities in rheumatoid arthritis care and health service solutions to equity. Rheum Dis Clin North Am. (2020) 46(4):685–92. doi: 10.1016/j.rdc.2020.07.005
36. Meghani SH, Gallagher RM. Disparity vs. inequity: toward reconceptualization of pain treatment disparities. Pain Medicine. (2008) 9(5):613–23. doi: 10.1111/j.1526-4637.2007.00344.x
37. Arcaya MC, Arcaya AL, Subramanian SV. Inequalities in health: definitions, concepts, and theories. Glob Health Action. (2015) 8(1):27106. doi: 10.3402/gha.v8.27106
38. Zhao X, Shah D, Gandhi K, Wei W, Dwibedi N, Webster L, et al. The association of pain interference and opioid use with healthcare utilization and costs, and wage loss among adults with osteoarthritis in the United States. J Med Econ. (2019) 22(11):1192–201. doi: 10.1080/13696998.2019.1658590
39. Ahlstrand I, Björk M, Thyberg I, Börsbo B, Falkmer T. Pain and daily activities in rheumatoid arthritis. Disabil Rehabil. (2012) 34(15):1245–53. doi: 10.3109/09638288.2011.638034
40. Strand V, Khanna D. The impact of rheumatoid arthritis and treatment on patients’ lives. Clin Exp Rheumatol. (2010) 28(3 Suppl 59):S32–40.20576223
41. Heidari S, Babor TF, De Castro P, Tort S, Curno M. Sex and gender equity in research: rationale for the SAGER guidelines and recommended use. Res Integr Peer Rev. (2016) 1:2. doi: 10.1186/s41073-016-0007-6
42. Canadian Institutes of Health Research. Online training modules: integrating sex & gender in health research—sex and gender in the analysis of data from human participants. Ottawa: Canadian Institutes of Health Research (CIHR) (2017). Available at: http://www.cihr-irsc.gc.ca/e/49347.html
43. Mena E, Bolte G, Bolte G, Mena E, Rommel A, Saß A-C, et al. Intersectionality-based quantitative health research and sex/gender sensitivity: a scoping review. Int J Equity Health. (2019) 18(1):199. doi: 10.1186/s12939-019-1098-8
Keywords: state sequence analysis, cluster, arthritis, care trajectories, pain, health care utilization, Canadian community health survey
Citation: Nguena Nguefack HL, Pagé MG, Choinière M, Vanasse A, Deslauriers S, Angarita-Fonseca A, Blanchette M-A and Lacasse A (2022) Distinct care trajectories among persons living with arthritic conditions: A two-year state sequence analysis. Front. Pain Res. 3:1014793. doi: 10.3389/fpain.2022.1014793
Received: 8 August 2022; Accepted: 24 October 2022;
Published: 12 November 2022.
Edited by:
William K. Schmidt, NorthStar Consulting, LLC, United StatesReviewed by:
Soham Al Snih, University of Texas Medical Branch at Galveston, United StatesNatasha Gallant, University of Regina, Canada
© 2022 Nguena Nguefack, Pagé, Choiniere, Vanasse, Deslauriers, Angarita-Fonseca, Blanchette and Lacasse. This is an open-access article distributed under the terms of the Creative Commons Attribution License (CC BY). The use, distribution or reproduction in other forums is permitted, provided the original author(s) and the copyright owner(s) are credited and that the original publication in this journal is cited, in accordance with accepted academic practice. No use, distribution or reproduction is permitted which does not comply with these terms.
*Correspondence: Anaïs Lacasse bGFjYXNzZWFAdXFhdC5jYQ==
Specialty Section: This article was submitted to Clinical Trials, Methods, and Evidence Synthesis, a section of the journal Frontiers in Pain Research