 Jiang Zhu1,2
 Min Guo
 Ling Li
 Tingyu Li
- 1Children's Nutrition Research Center, Ministry of Education Key Laboratory of Child Development and Disorders, National Clinical Research Center for Child Health and Disorders, China International Science and Technology Cooperation Base of Child Development and Critical Disorders, Children's Hospital of Chongqing Medical University, Chongqing, China
- 2Chongqing Key Laboratory of Child Health and Nutrition, Chongqing, China
- 3Department of Children Rehabilitation, Hainan Women and Children's Medical Center, Hainan, China
Objective: The study aimed to compare the nutritional status and symptoms of preschool children with autism spectrum disorder (ASD) from two regions of China, and to analyze the association between nutritional status and symptoms of ASD.
Methods: In this cross-sectional study, 738 ASD children and 302 typically developing children (TD) were recruited from Chongqing and Hainan of China. Symptoms of ASD children were evaluated with the Autism Behavior Checklist (ABC), Social Responsiveness Scale (SRS), and Childhood Autism Rating Scale (CARS). Neurodevelopment of ASD children was assessed with the Gesell Developmental Scale (GDS). Nutritional status was evaluated by anthropometric measures, biochemical detection of micronutrients, and providing questionnaire and food frequency questionnaire (FFQ) to caregivers.
Results: Comparing ASD children with local TD children, ASD children consumed fewer whole grains, milk and dairy products, beans and soy products, vegetables, and fruits than local TD children in both regions. The serum concentrations of folate, vitamin B12 (VB12), and vitamin D (VD) were consistently lower in ASD children in both regions. Comparing the ASD children between the two regions, the ASD children in Chongqing had significantly higher mean scores of CARS, SRS, and ABC than those in Hainan. The ASD children in Chongqing consumed fewer whole grains, seafood, and fruits than those in Hainan. The serum concentrations of ferritin, vitamin A (VA), VB12, and VD were reduced in the ASD children of Chongqing than those in Hainan, and the ASD children in Chongqing had higher deficiency rates of zinc, ferritin, VA, and VD than those in Hainan. The serum levels of VA, VD, and folate showed a negative association with symptom scores of ASD children. VD and zinc levels had a positive association with the GDS scores of ASD children.
Conclusions: ASD children exhibit a higher risk of nutrient deficiencies than neurotypical children, and there are regional differences in the nutritional status of ASD children. Micronutrients VA, VD, folate, and zinc levels were correlated with symptoms and development of ASD children. Therefore, it is essential to provide detailed nutrition evaluation and individualized nutrition interventions for ASD children from different backgrounds.
Introduction
Autism spectrum disorders (ASDs) are wide-spectrum neurodevelopmental disorders characterized by early appearing social communication deficits and repetitive sensory motor behaviors (1). The prevalence of ASD has been markedly increasing around the world in recent decades. Statistics estimate that prevalence of ASD global was 1% in 2012 (2), and the prevalence in developed countries was estimated to be 1.5% in 2017 (3). Multiple genetic, environmental (including infection, medication, chemicals, and nutrients), and immunologic factors take part in the pathogenesis of ASD (3).
Studies emphasize that children with ASD are nutritionally vulnerable due to their problematic eating behaviors, gastrointestinal symptoms, food allergies, and metabolic abnormalities (4, 5). Micronutrients play indispensable roles in maintaining the structure and regulating the function of the nervous system. An inadequate intake of some micronutrients could have a harmful impact on neurodevelopment (6). Studies reported decreased dietary intake and serum concentrations likely below the reference range or lower than neurotypical controls of folate (7), vitamin B12 (VB12) (7, 8), vitamin D (VD) (9, 10), vitamin A (11, 12), iron (13), and zinc (12) in children with autism. Nevertheless, there are inconsistent findings. Molloy et al. (14) and Basheer et al. (15) found that VD levels were not different between ASD children and those in the neurotypical group, while children in both groups had a high rate of VD deficiency. Ugur (16) found that serum VD and folate levels of ASD children were not significantly different from those of neurotypical controls. Hope et al. (17) found that patients with neurodevelopmental disorders (including ASD) have a significantly higher serum level of VB12 than neurotypical children. Whether ASD children present malnutrition similarly or more frequently than typical children is inconclusive because the nutritional status of an individual is a consequence of complex mechanisms and interactions, which could be affected by ethnicity, diet, and other factors in different countries or regions. The differences in the measurement methods and status also affect the variations in micronutrient concentrations. In our previous studies, we found that ASD children had a higher risk of malnutrition than control children in Chongqing (11, 18). In the present study, we recruited preschool ASD children and typically developing (TD) children from two regions—Chongqing and Hainan province. It is intended to compare the symptoms and the nutritional status of ASD children from two regions and analyze the nutritional factors associated with the autism symptoms. This study may help in the future management of children with ASD.
Methods
Study Areas
Chongqing is situated in the southwest of China with latitude of 28″10′-32″13′ N. Hainan province is an island situated in extreme southern China with latitude of 18″10′-20″10′ N (Figure Supplement 1, the locations of Chongqing and Hainan province in China). The economic conditions of the two regions are at a comparable level and reflect the middle-class Chinese population. However, Hainan is richly endowed by nature with pleasant tropical weather and sunlight, and abundant natural resources based on its unique geographical condition. Chongqing is known as the mountain city and fog city with extremely long rainy seasons and a high level of fog most of the year.
Participants
A total of 738 ASD children aged 2–6 years were recruited for the study, 445 of which were recruited from the Children's Hospital of Chongqing Medical University and special education school of Chongqing, China, and 293 from the Maternal and Child Care Health Hospital of Hainan Province, China. Inclusion criterion was a diagnosis of ASD, which was made by two developmental pediatricians independently through a series of structured interviews according to the Diagnostic and Statistical Manual of Mental Disorders, Fifth Edition (DSM-5) criteria. The Childhood Autism Rating Scale (CARS) (scores for ASD children should be >30) (19) was used as an assistant in diagnosing. Exclusion criteria included a history of other neurodevelopmental disorders, neurological or psychiatric diseases, known genetic disorders, major physical illness, a recent infection, recent use of special diets, and recent supplement of high-dose vitamins or minerals. Symptoms of ASD children were evaluated with the Autism Behavior Checklist (ABC) (19), Childhood Autism Rating Scale (CARS), and Social Responsiveness Scale (SRS) (20). Higher scores of ABC, SRS, and CARS scores represent more serious autistic symptoms. Neurodevelopment in ASD children was assessed with the revised Gesell Developmental Scale (GDS) (21), which is extensively used in China to evaluate cognitional and behavioral development, and the development quotient (DQ) scores reflect the levels of intellectual and behavioral development. DQ <70 indicates developmental delay, and the lower the DQ score, the more severe the developmental delay.
Additionally, 302 residence- and age-matched typically developing (TD) children were randomly recruited from local nursery schools as control groups, including 201 from Chongqing and 101 from Hainan province, China. These participants are healthy, and they did not have any signs of developmental disorders or psychiatric diseases. Other exclusion criteria were the same as for the ASD group.
Participation in this research was voluntary (Figure Supplement 2, participant flow chart). Parents of all children were willing to let their children participate and signed consent forms. The study protocol was approved by the Institutional Review Board of the Children's Hospital, Chongqing Medical University. This clinical study was also registered in the Chinese Clinical Trial Registry (ChiCTR; registration number: ChiCTR-ROC-14005442).
General Condition Survey and Food Frequency Questionnaire
The caregivers of the ASD and TD children completed a series of questionnaires conducted by in-person interviews between the standardized trained investigators and caregivers. The following data were obtained: the children's general condition (e.g., name, age, gender, ethnicity, family economic status, and parental education level), medical history, eating behavior, gastrointestinal problems, etc. Dietary intake has been assessed by well-trained dieticians using a semiquantitative food frequency questionnaire (FFQ) (22). The original version of the FFQ included 8 food groups and 86 food items that were frequently consumed by the Chinese population, while 11 food groups were adapted into this study. The white meat group was divided into three groups: poultry meats, freshwater fish, and seafood, and the whole grains group was added. For each food item, caregivers were asked to report their children's average consumption frequency over the past month and the estimated portion size and weight.
Anthropometric Measurements
Anthropometric measures were conducted by certified surveyors with a standardized approach (23). Z-scores were calculated for height-for-age (ZHA), weight-for-age (ZWA), body mass index-for-age (ZBMIA), and weight-for-head circumference (ZHCA) with World Health Organization (WHO) Anthro and AnthroPlus software (Anthro for Personal Computers, Version 3.01, WHO, 2009), with the use of the 2005 version of the WHO child growth standard for children aged 0–5 years and the 2007 version for children and adolescents aged 5–19 years.
Detection of the Biochemical Index for Nutritional Levels
Fasted blood samples (3 ml) were obtained from the participants through venipuncture and put into a separation gel coagulation tube and then immediately (within 2 h) transported to a local study center. The blood samples in the separation gel coagulation tubes were centrifuged at 3,500 × g/min for 3 min at room temperature (~21°C), and then the serum was separated for measurements of the zinc, ferritin, folate, VB12, 25-OH VD, and retinol (vitamin A: VA) concentrations. Serum zinc levels were detected by flame atomic absorption spectroscopy (AA6300 C atomic absorption spectrophotometer, Shimadzu, Japan) at 248.3 nm using hollow cathode lamps (Perkin-Elmer). The ferritin, folate, and VB12 levels were measured by chemiluminescence microparticle immunoassay (CMIA) kits (Abbott Ireland Diagnostics Division, Longford, Ireland). Serum concentrations of VD were estimated by an immunoassay method (Abbott, 3L52, USA, and Abbott i2000SR, USA). The quantitative determination of serum VA levels was performed by high-performance liquid chromatography (HPLC) according to previously described methods with an HPLC instrument (DGU-20As; C18; 315 nm; Shimadzu, Japan) (18). Of the sample from Hainan province, the serum was separated and stored at −80 immediately and transferred to Chongqing by cold-chain transportation within 2 days. All biochemical assessments of micronutrients were performed by inspectors at the pediatric laboratory of Chongqing Medical University, China.
The manufacturer-defined deficiency level was below 9.2 μmol/L for zinc, below 4.63 ng/ml for females and 21.8 ng/ml for males for ferritin, below 3.1 ng/ml for folate, and below 87 pg/ml for VB12 (11). According to the global consensus recommendations, the clinical cutoff values for VD were defined as follows: adequate ≥20 ng/ml, inadequate ≥12–20 ng/ml, and deficient <12 ng/ml (24). Besides, according to the WHO criteria, serum retinol concentrations >1.05, 0.7–1.05, and <0.7 μmol/L were defined as VA normal (VAN), marginal VA deficiency (MVAD), and VA deficiency (VAD), respectively (25).
Statistical Analysis
The data were analyzed using the SPSS statistical software (version 19.0, SPSS Inc., USA) (26). The normality test of each dataset was performed by the Kolmogorov–Smirnov goodness-of-fit test. Continuous variables are presented as the means (with SD) or medians (with interquartile ranges). Categorical variables are described as percentages. The one-way ANOVA with the Bonferroni post hoc test, chi-square test, and Fisher's exact test were used to compare variables among groups. Non-parametric statistical analysis was performed with the Kruskal–Wallis H test for abnormal continuous variable comparisons. P-value was adjusted in multiple comparisons by the Bonferroni post hoc test. Associations for micronutrients with symptoms and development levels were assessed with partial correlation analysis. For all analyses, P ≤ 0.05 was recognized as significant.
Results
Characteristics of Participants
There were 738 ASD children and 302 TD children recruited between August 2016 and October 2018. They were assigned to four groups: ASD children in Chongqing (379 boys and 66 girls, aged 4.39 ± 1.25 years), TD children in Chongqing (102 boys and 99 girls, aged 4.44 ± 0.82 years), ASD children in Hainan province (250 boys and 43 girls, aged 4.28 ± 1.37 years), and TD children in Hainan province (50 boys and 51 girls, aged 4.35 ± 1.18 years). The clinical characteristics of the children are shown in Table 1. There were no significant differences in family economic status and parental education levels among the four groups of children. ASD children were more likely to be reported as with severe picky eating in both regions (29.89% in ASD children vs. 8.96% in TD children of Chongqing, adjusted P < 0.001; 25.6% in ASD children vs. 6.93% in TD children of Hainan, adjusted P < 0.001). ASD children were reported to have a higher prevalence of gastrointestinal problems in both regions (57.08% in ASD children vs. 25.87% in TD children of Chongqing, adjusted P < 0.001; 54.95% in ASD children vs. 20.79% in TD children of Hainan, adjusted P < 0.001). There was no statistical difference at prevalence of picky eating or gastrointestinal problems in ASD children of the two regions.
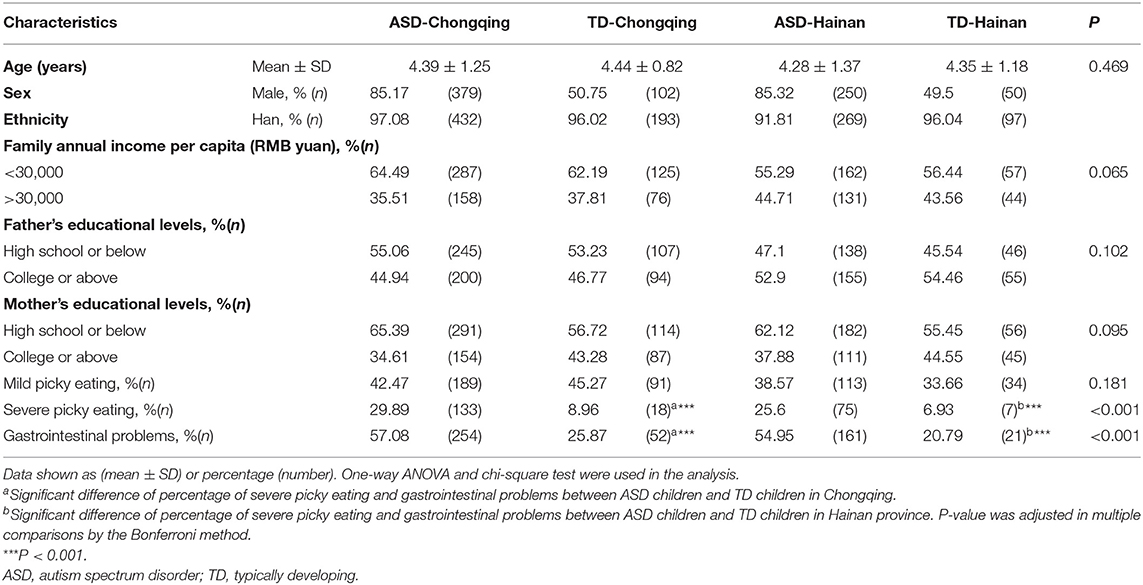
Table 1. Demographic characteristics of autistic and typically developing children in Chongqing and Hainan.
Comparison of Symptom Scores in ASD Children Between Chongqing and Hainan Province
The mean CARS score, SRS score, and ABC score of the ASD children in Chongqing were significantly higher compared to those in Hainan province (P < 0.05, respectively, shown in Table Supplement 1; Figures 1A,C,E). Regarding the ABC subscales, significant differences were found at sensory, social withdrawal, stereotypic behavior, and inappropriate speech, and there is no significant difference at laggard daily living ability (Figure 1D). At the SRS subscales of the social motivation, social communication, and autistic mannerisms, the ASD children in Chongqing had higher scores than those in Hainan province (Figure 1F). When comparing the score of GDS, the autistic children in Chongqing had lower scores at adaptive behavior and language than those in Hainan province (Figure 1B). The data above indicate that the ASD children recruited from Chongqing have severer autistic symptoms and poorer cognitional and behavioral development than those in Hainan province.
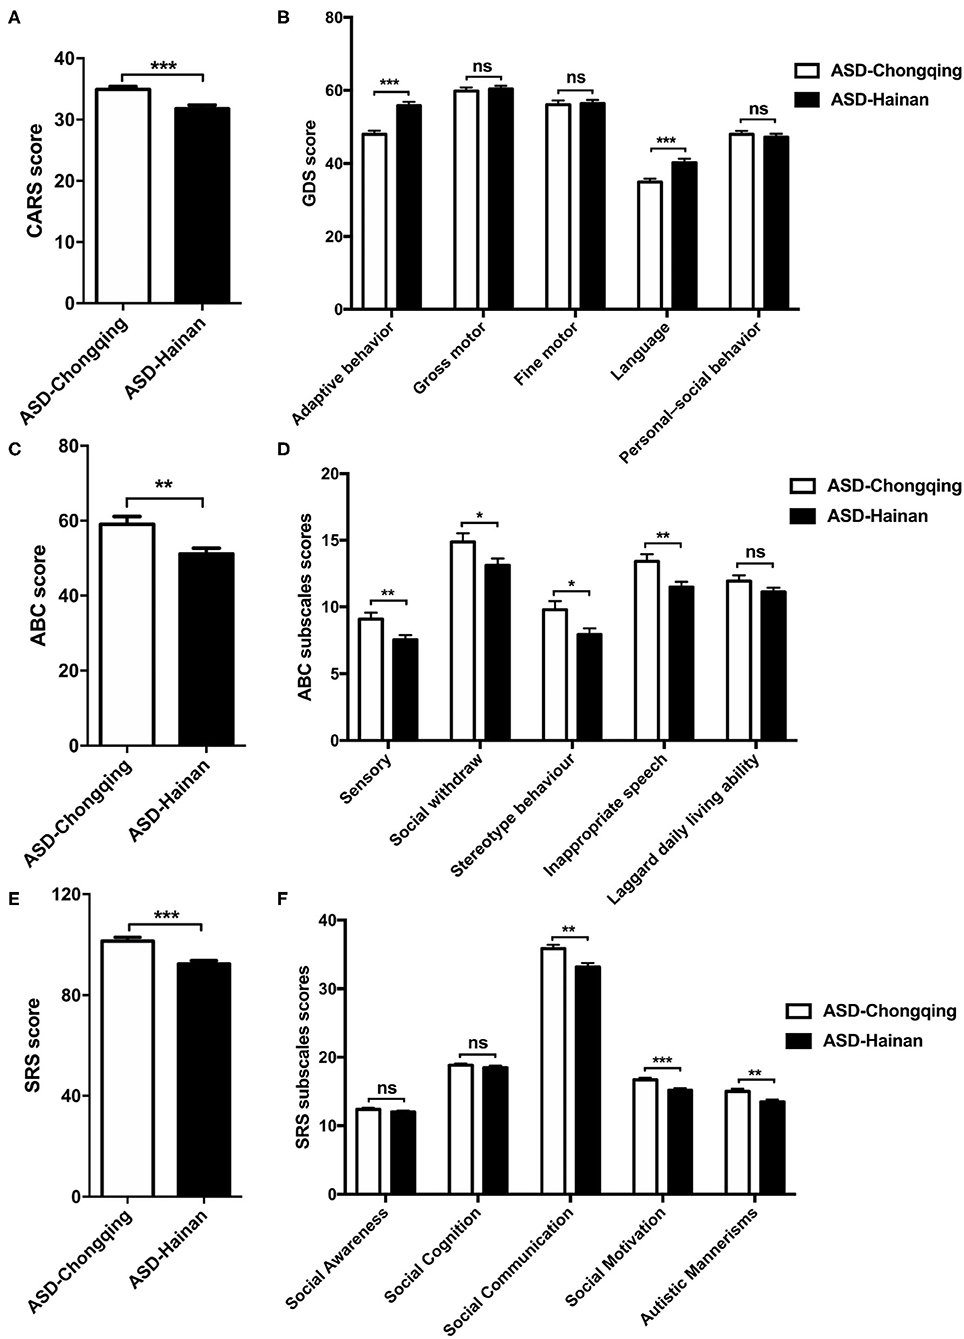
Figure 1. Comparison of CARS, GDS, ABC, and SRS scores in children with autism in Chongqing and Hainan. The CARS (A), GDS (B), ABC (C), SRS (E) scores, subscales scores of ABC (D), and SRS (F) of ASD children in Chongqing (n = 445) and Hainan (n = 293) were compared. The values are the means ± SEMs. The t-test test was used for the comparison; *P < 0.05, **P < 0.01, ***P < 0.001.
Anthropometry
Table 2 summarizes the Z-scores of all participants. No significant differences at the mean ZWA, ZHA, and ZBMIA were observed among the four groups. The mean ZHCA of ASD children were lower than those of local TD children, both in Chongqing and Hainan province (adjusted P = 0.006, 0.009, respectively). Further, the percentages of short stature, wasting, and overweight had no significant differences among the four groups. When compared with local TD children, ASD children had higher percentage of undersized head circumference in both regions (10.34 vs. 3.48% in Chongqing, adjusted P = 0.009; 8.19 vs. 1.98% in Hainan, adjusted P = 0.03). ASD children had a higher percentage of oversized head circumference in Chongqing (6.52 vs. 1%, adjusted P = 0.006).
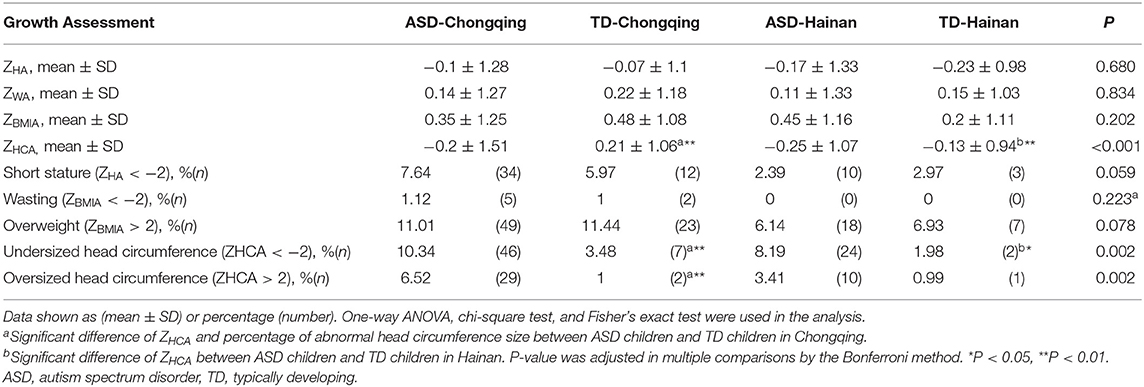
Table 2. Growth assessment of autistic and typically developing children in Chongqing and Hainan.
Diet of Children With ASD in the Two Regions
A total of 611 ASD children (367 in Chongqing, 244 in Hainan) and 289 TD children (193 in Chongqing, 96 in Hainan) completed the FFQ survey. Surveys with incomplete answers or suspected unreal answers were excluded. Table 3 shows the mean intake of food groups (g/day) in children between the two regions.
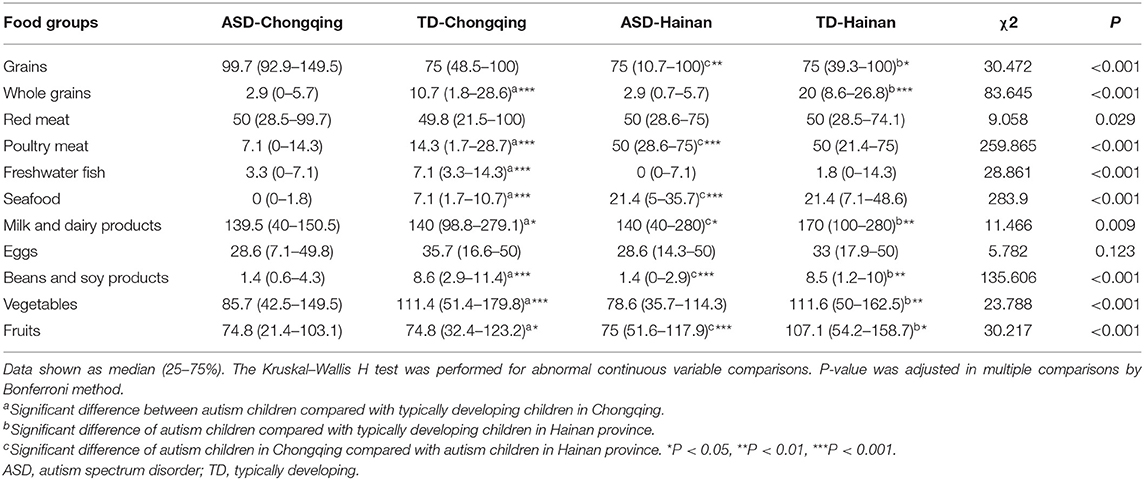
Table 3. Mean intake of food groups (g/day) in ASD children in Chongqing and Hainan.
Compared with local TD children, ASD children consumed fewer whole grains, milk and dairy products, beans and soy products, vegetables, and fruits in both regions (P < 0.05, respectively). The grain and meat consumption of ASD children in both regions can meet the Chinese Dietary Guidelines (2016) for Chinese preschoolers by the Chinese Nutrition Society (27); however, the consumption of egg, milk and dairy products, beans and soy products, vegetables, and fruits has not met the recommendations in both regions.
When comparing the food intake of the ASD children in Chongqing with those in Hainan, the ASD children in Chongqing consumed fewer poultry meat, seafood, milk and dairy products, and fruits compared with those in the ASD children in Hainan, while there was more grain, bean, and soy product consumption.
Table Supplement 2 shows the food groups selectivity of ASD and TD children in two regions. Compared with local TD children, ASD children had higher rates of omitting eggs, milk and dairy products, and fruits in both regions. When comparing food group selectivity of the ASD children in Chongqing with those in Hainan, the ASD children in Chongqing had higher rates of omitting whole grains, seafood, and fruits, and lower rates of omitting grain, freshwater fish, beans, and soy products (P < 0.05, respectively).
Biochemical Determination for Nutritional Levels
Figure 2 shows the comparison of the serum biochemical indices for micronutrient levels. In Chongqing, the mean serum VA, folate, VB12, and VD levels in ASD children were significantly reduced compared to those in local TD children (P < 0.05, respectively). The mean zinc and ferritin levels between the ASD children and local TD children in Chongqing were not statistically different. In Hainan province, ASD children had significantly reduced levels of serum folate, VB12, and VD than local TD children (P < 0.05, respectively). The mean zinc, ferritin, and VA levels between the ASD children and local TD children in Hainan were not statistically different. Comparing ASD children with local TD children, folate, VB12, and VD were consistently lower in both Chongqing and Hainan province.
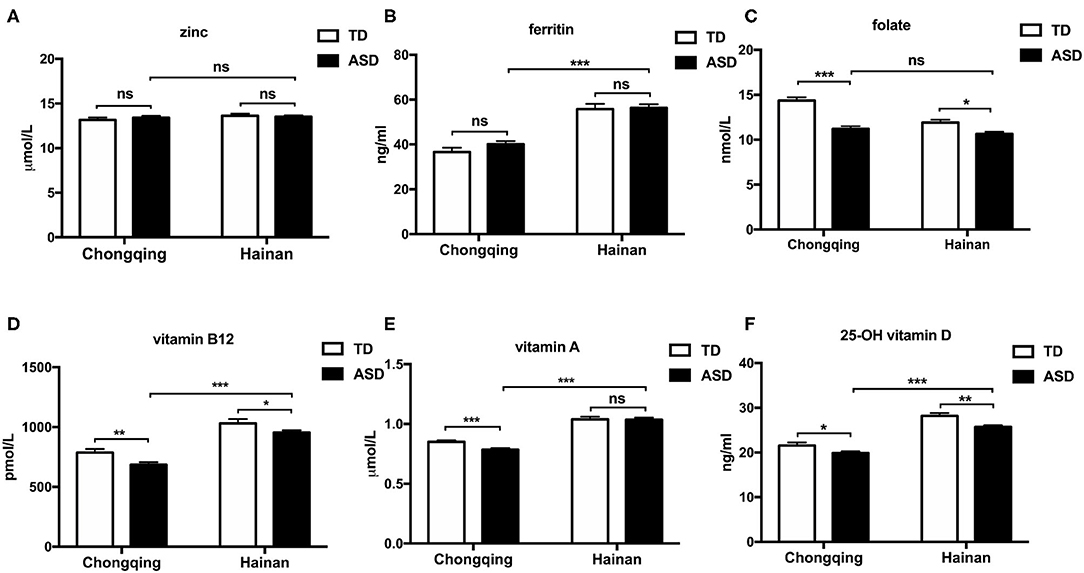
Figure 2. Serum micronutrient levels of ASD and typically developing children in Chongqing and Hainan. Children were assigned to four groups: ASD-Chongqing (n = 445), TD-Chongqing (n = 201), ASD-Hainan (n = 293), and TD-Hainan (n = 101). The serum concentrations of zinc (A), ferritin (B), folate (C), vitamin B12 (D), vitamin D (F), and vitamin A (E) of children were detected and compared. The values are the means ± SEMs. The one-way ANOVA test was used for the comparison, P-value was adjusted in multiple comparisons by the Bonferroni method. *P < 0.05, **P < 0.01, ***P < 0.001. ASD, autism spectrum disorder; TD, typically developing.
When comparing the ASD children in Chongqing with those in Hainan province, the mean serum ferritin, VA, VB12, and VD concentrations were lower in the ASD children in Chongqing. Therefore, it seemed that the ASD children in Hainan province have greater micronutrient status than those in Chongqing.
Micronutrient Deficiency Rates in ASD and TD Children
We compared the micronutrient deficiency rates of all groups, shown in Table 4.
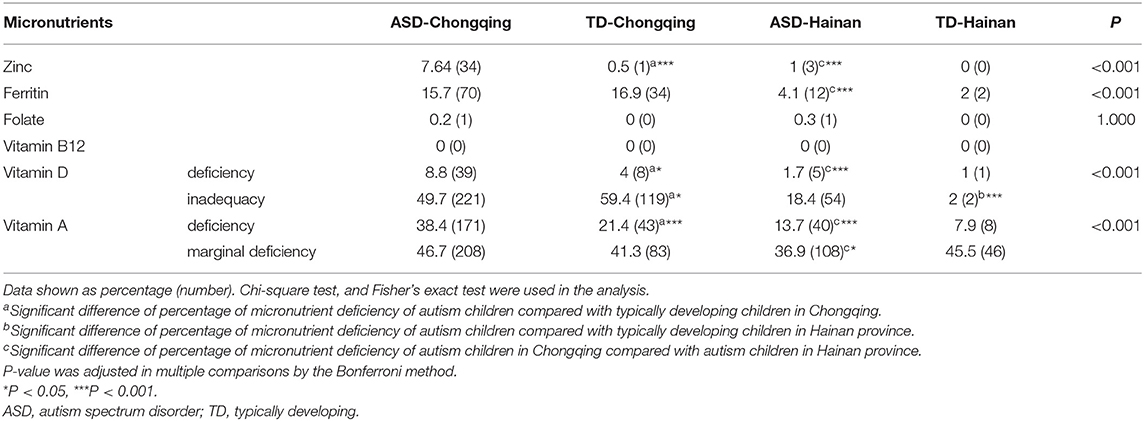
Table 4. Micronutrient deficiency rates in ASD and typically developing children in Chongqing and Hainan.
When compared with the local TD children, the ASD children in Chongqing had higher deficiency rates of zinc, VD, and VA, while there were no significant differences in ferritin, folate, and VB12. The ASD children in Hainan had higher inadequacy rate of VD than the local TD children, but they did not differ in deficiency rates of all the tested micronutrients.
There are no significant differences between ASD and TD children in Hainan province in deficiency rates of all tested micronutrients.
When comparing the deficiency rates of micronutrients of the ASD children in the two regions, the ASD children in Chongqing had higher deficiency rates of zinc, ferritin, VA, and VD than those of the ASD children in Hainan. These results suggest that autistic children in Hainan province have greater micronutrient status than those in Chongqing.
The greatest deficiency in all groups was observed for VA (7.92–38.43%), followed by ferritin (1.98–16.92%). Moreover, the marginal VA deficiency rate was considerable in children of all groups, and inadequacy of VD cannot be ignored either.
Correlation Analysis of the Micronutrient Level for ABC, SRS, CARS, and DQ Scores of Autistic Children
Associations for micronutrients with symptoms and development levels were assessed with partial correlation analysis (Table 5). According to this analysis, there was a negative association between the serum level of VA with ABC (r = −0.211, P = 0.009) and SRS scores (r = −0.186, P = 0.013), and also a negative association between VD levels and SRS scores (r = −0.122, P = 0.037), while folate levels revealed a negative association with CARS scores (r = −0.228, P < 0.001). These results suggest that VA, VD, and folate may be related to symptoms of ASD children. VD (r = 0.24, P < 0.001) and zinc (r = 0.113, P = 0.048) levels revealed a positive association with DQ scores. This finding suggests that VD and zinc may be protective factors of neurodevelopment in ASD children. There were no statistical correlations between VB12 and ferritin with clinical measure scores.
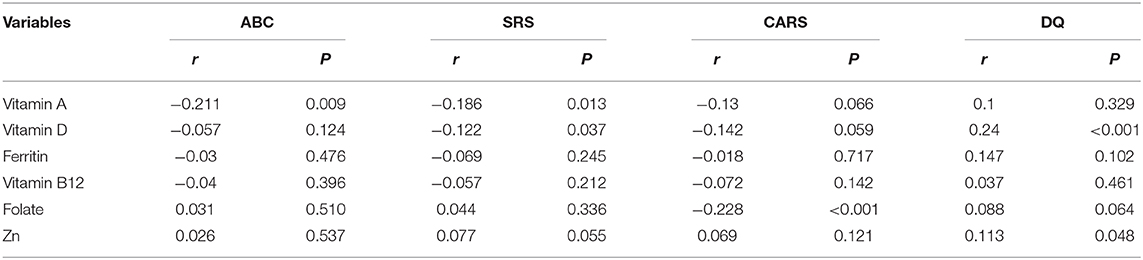
Table 5. Partial correlation analysis of the micronutrient level for ABC, SRS, CARS, and DQ scores of autistic children.
Discussion
In the cross-sectional research, we evaluated the nutritional status of the ASD children in Chongqing and Hainan province, and compared the ASD symptoms between the two different regions, to explore the correlations between the nutritional status and ASD symptoms.
The anthropometry parameter is a vital indicator of an individual's nutritional status. Findings on the anthropometric measurement of ASD children were inconsistent. Some studies showed that children with ASD likely have a higher risk of overweight and obesity (28–30) compared with children without autism, although some studies did not find the difference (31). The inconsistent anthropometric findings could be ascribed to different genetic backgrounds, diet cultural patterns, and economic levels. Sun et al. found that the mean BMI, ZWH, and ZBMIA of the ASD children were higher than those of the TD children in the northeast of China (32). However, no significant differences in the ZWA, ZHA, and ZBMIA were observed between the ASD and the TD children in the two regions of our study. In addition, an increased prevalence of overweight was not shown in ASD children. Our results also corroborated the research suggesting that the eating behavior of ASD is often a problem of dietary variety, not inadequate or excessive volume, and they are not significantly different from neurotypical children on anthropometric measurements.
Multiple studies showed abnormal growth of head circumference and brain size in early infancy of ASD children. A meta-analysis showed that the proportion of macrocephaly in ASD children was largely more than that of the controls (15.7 vs. 3%, respectively) (33). The study of Libero et al. suggested that there may be a subgroup of ASD with disproportionate brain-to-body size in early childhood (34). Suren et al. also found parallel head growth in autistic boys compared with controls, while the autism group had higher variability and prevalence of macrocephaly (35). Our results also showed that the mean head size of ASD children was below than that of local TD children, and ASD children had a higher percentage of abnormal head circumference than TD children. Abnormal brain growth in autism can seemingly stem from several different mechanisms, it is still not entirely clear, and abnormal head circumference may be a prospective indicator to predict the diagnosis of autism (36).
Feeding problems, such as food selectivity, food refusal, and abnormal dietary patterns, are highly prevalent in ASD children (4, 37–41). These dietary problems could cause the development of nutrient deficiency and consequently worsen autistic symptoms. ASD children often prefer snacks, starches, and processed foods, and reject vegetables, fruits, and proteins (4, 37, 39). In our study, we found that ASD children had increased rates of food selectivity, and they consumed fewer whole grains, milk and dairy products, beans and soy products, vegetables, and fruits than local TD children in both regions. When comparing the food intake of ASD children in Chongqing with those in Hainan, the ASD children in Hainan consumed more poultry meats, seafood, milk and dairy products, and fruits compared with the ASD children of Chongqing. It seemed that the ASD children in Hainan have healthier dietary habits. However, the ASD children's consumption of egg, milk and dairy products, beans and soy products, vegetables, and fruits has not met the recommendation in both regions.
Nutrients are a vital role in neurodevelopment during early life (42–44). Malnutrition could have a remarkable adverse effect on neurodevelopment and brain function, and nutrient deficiency is closely correlated with neurodevelopmental problems in children. It is challenging to achieve adequate nutrition intake for ASD children because of their gastrointestinal problems, selective eating pattern, and metabolic abnormalities (45). Multiple studies have demonstrated the inadequacy of various nutrients in ASD children, including vitamins A, C, B6, B12, D, E, K, folate, zinc, calcium, and iron (7, 12, 29, 37, 40). In our study, when comparing autistic children with local typically developing children, folate, VB12, and VD are consistently lower in both Chongqing and Hainan province. The greatest deficiency in all groups was observed for VA, followed by ferritin and VD.
The top food sources of VA and VD are milk, fish, seafood, eggs, and fortified food, and the main natural source of VD comes from exposure to UVB in sunlight. In our study, children with ASD in both regions tend to omit most kinds of food rich in VA and VD. The ASD children in Chongqing had a higher prevalence of omitting fish and seafood than those in Hainan. What is more, Hainan is a tropical island with year-round high solar irradiance, while longer rainy seasons and higher smog levels in Chongqing lead to less solar irradiance exposure. We have reason to believe that the ASD children in Chongqing may have a higher risk of VA and VD deficiency than those in Hainan province.
The role of VD in ASD has attracted increasing interest in recent research (46–48). VD is believed to be closely related to ASD, though the potential mechanisms are not clear yet. Syed and coworkers reviewed published studies from different latitudes to show a correlation between low solar irradiance and ASD (49). A meta-analysis revealed that serum VD levels in ASD children are significantly decreased compared with neurotypical children (9).
In our previous research, the rate of VA deficiency (including marginal deficiency) in ASD children was up to 77.9%, and the VA level was inversely correlated with the CARS score (11). Further, the social interaction of ASD children was improved after VA supplements (50). Our research also proved the considerable prevalence of VA deficiency in ASD children and a negative association between the serum concentrations of VA and VD and the severity of symptoms. As a one-carbon donor, folate is essential for numerous metabolic biochemical processes. Many studies showed the association between genetic and abnormalities of folic acid and the pathogenesis of ASD (51–56). In addition, in our study, there was a negative association between folate and severity of ASD symptom. Notably, the strengths of the correlations between micronutrients and symptoms are not very high, for the causes and mechanisms of autism are complex and uncertain, and nutrition is only one of the numerous factors associated with the occurrence and progress of ASD. Micronutrients are pivotal environmental factors, and their influence on ASD should not be ignored, for malnutrition is more preventable and treatable than other factors.
The present study is not without potential limitations. Even though the two regions may be comparable in terms of economic conditions, we did not take into account bias and equivalence in measurement of the instruments (CARS, ABC, SRS, and GDS) for different local dialects and cultures (57); thus, the possibility that differences of scores of measurement might partly be attributable to bias cannot be excluded. We did not consider differences in other environmental, genetic, and biological factors between the two regions, and it may be different in the extent of factors each contributes to the progress of ASD in different areas and population. Our data do not allow for the distinction causal or confounders of the association between nutrition status and symptoms of ASD. There may be a mutual cause–effect relationship between nutrition status and symptoms of ASD. Owing to unusual eating patterns and some interior genetic and pathological factors, ASD children have a high risk of malnutrition, and nutritional status could influence the development of ASD and aggravate their symptoms in turn. Further research should consider causes, consequences, and remediation.
Conclusion
ASD children exhibit a higher risk of nutrient deficiencies than neurotypical children, and there are regional differences in the nutritional status of ASD children. It seemed that the ASD children in Hainan province have greater micronutrient status and less severe autistic symptoms compared with those in Chongqing. Micronutrients VA, VD, folate, and zinc levels were associated with ASD symptoms and development of ASD children. Therefore, it is essential to provide detailed nutritional evaluation and individualized nutrition interventions for ASD children from different backgrounds.
Data Availability Statement
The datasets generated for this study are available on request to the corresponding author.
Ethics Statement
The studies involving human participants were reviewed and approved by Chinese Clinical Trial Registry (ChiCTR) (registration number: ChiCTR-ROC-14005442). Written informed consent to participate in this study was provided by the participants' legal guardian/next of kin.
Author Contributions
JZ, JC, LL, and TL were involved in designing the research and writing the research protocol, analyzing the data, and writing the manuscript. JC, LL, and TL were also involved in supervising subjects' recruitment, data collection, and drafting the manuscript. JZ, MG, TY, XL, and TT were engaged in questionnaire surveys, data collection and analysis, and revising the paper. LL and TL had primary responsibility for the final content. All authors approved the final version of the manuscript.
Funding
This study is funded by the National Natural Science Foundation of China (No. 81372950) (http://www.nsfc.gov.cn), and Guangdong Province (2018B030335001) and Guangzhou City (202007030002) Key Project.
Conflict of Interest
The authors declare that the research was conducted in the absence of any commercial or financial relationships that could be construed as a potential conflict of interest.
Supplementary Material
The Supplementary Material for this article can be found online at: https://www.frontiersin.org/articles/10.3389/fped.2020.00469/full#supplementary-material
Abbreviations
ABC, Autism Behavior Checklist; ASD, autism spectrum disorder; CARS, Childhood Autism Rating Scale; CMIA, chemiluminescence microparticle immunoassay; DQ, developmental quotient; FFQ, food frequency questionnaire; GDS, Gesell Developmental Scale; HPLC, high-performance liquid chromatography; MTHFR, methylenetetrahydrofolate reductase; SRS, Social Responsiveness Scale; TD, typically developing; VA, vitamin A; VAD, vitamin A deficiency; MVAD, marginal vitamin A deficiency; VAN, vitamin A normal; VB12, vitamin B12; VD 25-OH, vitamin D; ZBMIA, Z-scores of body mass index-for-age; ZHA, Z-scores of height-for-age; ZHCA, Z-scores of weight-for-head circumference; ZWA, Z-scores of weight-for-age.
References
1. Lord C, Elsabbagh M, Baird G, Veenstra-vanderweele J. Autism spectrum disorder. Lancet. (2018) 392:508–20. doi: 10.1016/S0140-6736(18)31129-2
2. Elsabbagh M, Divan G, Koh YJ, Kim YS, Kauchali S, Marcín C, et al. Global prevalence of autism and other pervasive developmental disorders. Autism Res. (2012) 5:160–79. doi: 10.1002/aur.239
3. Lyall K, Croen L, Daniels J, Fallin MD, Ladd-Acosta C, Lee BK, et al. The changing epidemiology of autism spectrum disorders. Annu Rev Public Health. (2017) 38:81–102. doi: 10.1146/annurev-publhealth-031816-044318
4. Emond A, Emmett P, Steer C, Golding J. Feeding symptoms, dietary patterns, and growth in young children with autism spectrum disorders. Pediatrics. (2010) 126:e337–42. doi: 10.1542/peds.2009-2391
5. Wasilewska J, Klukowski M. Gastrointestinal symptoms and autism spectrum disorder: links and risks - a possible new overlap syndrome. Pediatr Heal Med Ther. (2015) 6:153–66. doi: 10.2147/PHMT.S85717
6. Curtis LT, Patel K. Nutritional and environmental approaches to preventing and treating autism and attention deficit hyperactivity disorder (ADHD): a review. J Altern Complement Med. (2008) 14:79–85. doi: 10.1089/acm.2007.0610
7. Al-Farsi YM, Waly MI, Deth RC, Al-Sharbati MM, Al-Shafaee M, Al-Farsi O, et al. Low folate and vitamin B12 nourishment is common in omani children with newly diagnosed autism. Nutrition. (2013) 29:537–41. doi: 10.1016/j.nut.2012.09.014
8. Yektaş Ç, Alpay M, Tufan AE. Comparison of serum B12, folate and homocysteine concentrations in children with autism spectrum disorder or attention deficit hyperactivity disorder and healthy controls. Neuropsychiatr Dis Treat. (2019) 15:2213–19. doi: 10.2147/NDT.S212361
9. Wang T, Shan L, Du L, Feng J, Xu Z, Staal WG, et al. Serum concentration of 25-hydroxyvitamin D in autism spectrum disorder: a systematic review and meta-analysis. Eur Child Adolesc Psychiatry. (2016) 25:341–50. doi: 10.1007/s00787-015-0786-1
10. Alzghoul L, AL-Eitan LN, Aladawi M, Odeh M, Abu Hantash O. The association between serum vitamin D3 levels and autism among jordanian boys. J Autism Dev Disord. (2019) 25:1–6. doi: 10.1007/s10803-019-04017-w
11. Liu X, Liu J, Xiong X, Yang T, Hou N, Liang X, et al. Correlation between nutrition and symptoms: nutritional survey of children with autism spectrum disorder in Chongqing, China. Nutrients. (2016) 8:294. doi: 10.3390/nu8050294
12. Xia W, Zhou Y, Sun C, Wang J, Wu L. A preliminary study on nutritional status and intake in Chinese children with autism. Eur J Pediatr. (2010) 169:1201–6. doi: 10.1007/s00431-010-1203-x
13. Bener A, Khattab AO, Bhugra D HG. Iron and vitamin D levels among autism spectrum disorders children. Ann Afr Med. (2017) 16:186–91. doi: 10.4103/aam.aam_17_17
14. Molloy CA, Kalkwarf HJ, Manning-courtney P, Mills JL, Hediger ML. Plasma 25 (OH) D concentration in children with autism spectrum disorder. Dev Med Child Neurol. (2011) 52:969–71. doi: 10.1111/j.1469-8749.2010.03704.x
15. Basheer S, Natarajan A, van Amelsvoort T, Venkataswamy MM, Ravi V, Srinath S, et al. Vitamin D status of children with autism spectrum disorder: case-control study from India. Asian J Psychiatr. (2017) 30:200–1. doi: 10.1016/j.ajp.2017.10.031
16. Ugur Ç Gurkan CK. Serum vitamin D and folate levels in children with autism spectrum disorders. Res Autism Spectr Dis. (2014) 8:1641–7. doi: 10.1016/j.rasd.2014.09.002
17. Hope S, Nærland T, Høiland AL, Torske T, Malt E, Abrahamsen T, et al. Higher vitamin B12 levels in neurodevelopmental disorders than in healthy controls and schizophrenia: a comparison among participants between 2 and 53 years. FASEB J. (2020) 34:8114–24. doi: 10.1096/fj.201900855RRR
18. Guo M, Zhu J, Yang T, Lai X, Lei Y, Chen J, et al. Vitamin A and vitamin D deficiencies exacerbate symptoms in children with autism spectrum disorders. Nutr Neurosci. (2019) 22:637–47. doi: 10.1080/1028415X.2017.1423268
19. Rellini E, Tortolani D, Trillo S, Carbone S, Montecchi F. Childhood autism rating scale (CARS) and autism behavior checklist (ABC) correspondence and conflicts with DSM-IV criteria in diagnosis of autism. J Autism Dev Disord. (2004) 34:703–8. doi: 10.1007/s10803-004-5290-2
20. Cen CQ, Liang YY, Chen QR, Chen KY, Deng HZ, Chen BY, et al. Investigating the validation of the Chinese Mandarin version of the social responsiveness scale in a Mainland China child population. BMC Psychiatry. (2017) 17:51. doi: 10.1186/s12888-016-1185-y
21. Jin X, Sun Y, Jiang F, Ma J, Morgan C, Shen X. “Care for development” intervention in rural China: a prospective follow-up study. J Dev Behav Pediatr. (2007) 28:213–8. doi: 10.1097/dbp.0b013e31802d410b
22. Xia W, Sun C, Zhang L, Zhang X, Wang J, Wang H, et al. Reproducibility and relative validity of a food frequency questionnaire developed for female adolescents in Suihua, North China. PLoS ONE. (2011) 6:e19656. doi: 10.1371/journal.pone.0019656
23. de Onis M, Onyango AW, Van den Broeck J, Chumlea CW MR. Measurement and standardization protocols for anthropometry used in the construction of a new international growth reference. Food Nutr Bull. (2004) 25 (1 Suppl):S27–36. doi: 10.1177/15648265040251S105
24. Munns CF, Shaw N, Kiely M, Specker BL, Thacher TD, Ozono K, et al. Global consensus recommendations on prevention and management of nutritional rickets. J Clin Endocrinol Metab. (2016) 101:394–415. doi: 10.1210/jc.2015-2175
25. Organization WH. Indicators for Assessing Vitamin A Deficiency and Their Application in Monitoring and Evaluating Intervention Programmes. Geneva: World Health Organization (1996).
26. Wasserstein RL, Lazar NA. The ASA's statement on p-values: context, process, and purpose. Am Stat. (2016) 70:129–33. doi: 10.1080/00031305.2016.1154108
27. Chinese Nutrition Society. Chinese Dietary Guidelines 2016. Beijing People's Medical Publishing House (2010).
28. Egan AM, Dreyer ML, Odar CC, Beckwith M, Garrison CB. Obesity in young children with autism spectrum disorders: prevalence and associated factors. Child Obes. (2013) 9:125–31. doi: 10.1089/chi.2012.0028
29. Hyman SL, Stewart PA, Schmidt B, Cain U, Lemcke N, Foley JT, et al. Nutrient intake from food in children with autism. Pediatrics. (2012) 130 (Suppl. 2):S145–53. doi: 10.1542/peds.2012-0900L
30. Xiong N, Ji C, Li Y, He Z, Bo H, Zhao Y. The physical status of children with autism in China. Res Dev Disabil. (2009) 30:70–6. doi: 10.1016/j.ridd.2007.11.001
31. Curtin C, Bandini LG, Perrin EC, Tybor DJ, Must A. Prevalence of overweight in children and adolescents with attention deficit hyperactivity disorder and autism spectrum disorders: a chart review. BMC Pediatr. (2005) 5:48. doi: 10.1186/1471-2431-5-48
32. Sun C, Xia W, Zhao Y, Li N, Zhao D, Wu L. Nutritional status survey of children with autism and typically developing children aged 4-6 years in heilongjiang province, China. J Nutr Sci. (2013) 2:e16. doi: 10.1017/jns.2013.9
33. Sacco R, Gabriele S, Persico AM. Head circumference and brain size in autism spectrum disorder: a systematic review and meta-analysis. Psychiatry Res Neuroimaging. (2015) 234:239–51. doi: 10.1016/j.pscychresns.2015.08.016
34. Libero LE, Nordahl CW, Li DD, Ferrer E, Rogers SJ, Amaral DG. Persistence of megalencephaly in a subgroup of young boys with autism spectrum disorder. Autism Res. (2016) 9:1169–82. doi: 10.1002/aur.1643
35. Surén P, Stoltenberg C, Bresnahan M, Hirtz D, Lie KK, Lipkin WI, et al. Early growth patterns in children with autism. Epidemiology. (2013) 24:660–70. doi: 10.1097/EDE.0b013e31829e1d45
36. Hazlett HC, Gu H, Munsell BC, Kim SH, Styner M, Wolff JJ, et al. Early brain development in infants at high risk for autism spectrum disorder. Nature. (2017) 542:348–51. doi: 10.1038/nature21369
37. Bandini LG, Anderson SE, Curtin C, Cermak S, Evans EW, Scampini R, et al. Food selectivity in children with autism spectrum disorders and typically developing children. J Pediatr. (2010) 157:259–64. doi: 10.1016/j.jpeds.2010.02.013
38. Bicer AH, Alsaffar AA. Body mass index, dietary intake and feeding problems of turkish children with autism spectrum disorder (ASD). Res Dev Disabil. (2013) 34:3978–87. doi: 10.1016/j.ridd.2013.08.024
39. Evans EW, Must A, Anderson SE, Curtin C, Scampini R, Maslin M, et al. Dietary patterns and body mass index in children with autism and typically developing children. Res Autism Spectr Disord. (2012) 6:399–405. doi: 10.1016/j.rasd.2011.06.014
40. Lockner DW, Crowe TK, Skipper BJ. Dietary intake and parents' perception of mealtime behaviors in preschool-age children with autism spectrum disorder and in typically developing children. J Am Diet Assoc. (2008) 108:1360–3. doi: 10.1016/j.jada.2008.05.003
41. Nadon G, Feldman DE, Dunn W, Gisel E. Mealtime problems in children with Autism spectrum disorder and their typically developing siblings: a comparison study. Autism. (2011) 15:98–113. doi: 10.1177/1362361309348943
42. Georgieff MK. Nutrition and the developing brain: nutrient priorities and measurement. Am J Clin Nutr. (2007) 85:614S−20S. doi: 10.1093/ajcn/85.2.614S
43. Schwarzenberg SJ, Georgieff MK, Nutrition CO. Advocacy for improving nutrition in the first 1000 days to support childhood development and adult health. Pediatrics. (2018) 141:e20173716. doi: 10.1542/peds.2017-3716
44. Wachs TD, Georgieff M, Cusick S, McEwen BS. Issues in the timing of integrated early interventions: contributions from nutrition, neuroscience, and psychological research. Ann N Y Acad Sci. (2014) 1308:89–106. doi: 10.1111/nyas.12314
45. Ranjan S, Nasser J. Nutritional status of individuals with autism spectrum disorders : do we know enough? Adv Nutr. (2015) 5:397–407. doi: 10.3945/an.114.007914
46. DeLuca GC, Kimball SM, Kolasinski J, Ramagopalan SV, Ebers GC. Review: the role of vitamin D in nervous system health and disease. Neuropathol Appl Neurobiol. (2013) 39:458–84. doi: 10.1111/nan.12020
47. Freitag CM, Staal W, Klauck SM, Duketis E, Waltes R. Genetics of autistic disorders: review and clinical implications. Eur Child Adolesc Psychiatry. (2010) 19:169–78. doi: 10.1007/s00787-009-0076-x
48. Neggers YH. Increasing prevalence, changes in diagnostic criteria, and nutritional risk factors for autism spectrum disorders. ISRN Nutr. (2014) 2014:1–14. doi: 10.1155/2014/514026
49. Syed S, Moore KA, March E. A review of prevalence studies of autism spectrum disorder by latitude and solar irradiance impact. Med Hypotheses. (2017) 109:19–24. doi: 10.1016/j.mehy.2017.09.012
50. Guo M, Zhu J, Yang T, Lai X, Liu X, Liu J, et al. Vitamin A improves the symptoms of autism spectrum disorders and decreases 5-hydroxytryptamine (5-HT): A pilot study. Brain Res Bull. (2018) 137:35–40. doi: 10.1016/j.brainresbull.2017.11.001
51. Krsička D, Geryk J, Vlčková M, Havlovicová M, Macek M, Pourová R. Identification of likely associations between cerebral folate deficiency and complex genetic- and metabolic pathogenesis of autism spectrum disorders by utilization of a pilot interaction modeling approach. Autism Res. (2017) 10:1424–35. doi: 10.1002/aur.1780
52. Mahmuda NA, Yokoyama S, Huang JJ, Liu L, Munesue T, Nakatani H, et al. A study of single nucleotide polymorphisms of the SLC19A1/RFC1 gene in subjects with autism spectrum disorder. Int J Mol Sci. (2016) 17:772. doi: 10.3390/ijms17050772
53. Shaik Mohammad N, Sai Shruti P, Bharathi V, Krishna Prasad C, Hussain T, Alrokayan SA, et al. Clinical utility of folate pathway genetic polymorphisms in the diagnosis of autism spectrum disorders. Psychiatr Genet. (2016) 26:281–6. doi: 10.1097/YPG.0000000000000152
54. Raghavan R, Riley AW, Volk H, Caruso D, Hironaka L, Sices L, et al. Maternal multivitamin intake, plasma folate and vitamin B12 levels and autism spectrum disorder risk in offspring. Paediatr Perinat Epidemiol. (2018) 32:100–11. doi: 10.1111/ppe.12414
55. Pu D, Shen Y, Wu J. Association between MTHFR gene polymorphisms and the risk of autism spectrum disorders: a meta-analysis. Autism Res. (2013) 6:384–92. doi: 10.1002/aur.1300
56. Rai V. Association of methylenetetrahydrofolate reductase (MTHFR) gene C677T polymorphism with autism: evidence of genetic susceptibility. Metab Brain Dis. (2016) 31:727–35. doi: 10.1007/s11011-016-9815-0
Keywords: autism spectrum disorders, dietary, nutrition, micronutrients, vitamin, children
Citation: Zhu J, Guo M, Yang T, Lai X, Tang T, Chen J, Li L and Li T (2020) Nutritional Status and Symptoms in Preschool Children With Autism Spectrum Disorder: A Two-Center Comparative Study in Chongqing and Hainan Province, China. Front. Pediatr. 8:469. doi: 10.3389/fped.2020.00469
Received: 05 December 2019; Accepted: 03 July 2020;
Published: 03 September 2020.
Edited by:
David Cohen, Université Pierre et Marie Curie, FranceCopyright © 2020 Zhu, Guo, Yang, Lai, Tang, Chen, Li and Li. This is an open-access article distributed under the terms of the Creative Commons Attribution License (CC BY). The use, distribution or reproduction in other forums is permitted, provided the original author(s) and the copyright owner(s) are credited and that the original publication in this journal is cited, in accordance with accepted academic practice. No use, distribution or reproduction is permitted which does not comply with these terms.
*Correspondence: Ling Li, bGNsMTE1QDE2My5jb20=; Tingyu Li, dHlsaUB2aXAuc2luYS5jb20=