 Sophie E. Claudel1
 Eric J. Shiroma2Tamara B. Harris2Nicolle A. Mode2Chaarushi Ahuja1Alan B. Zonderman2Michele K. Evans2
 Tiffany M. Powell-Wiley1*
- 1Social Determinants of Obesity and Cardiovascular Risk Laboratory, National Heart, Blood, Lung Institute, National Institutes of Health, Bethesda, MD, United States
- 2Laboratory of Epidemiology and Population Science, National Institute on Aging, National Institutes of Health, Bethesda, MD, United States
Background: Little is known about the role of perceived neighborhood environment as a determinant of physical activity (PA) and sedentary time (ST) in understanding obesity-related health behaviors. We focus on a biracial, socioeconomically diverse population using objectively measured ST, which is under-represented in the literature.
Methods: We examined the association between self-reported neighborhood perception (Likert-scale questions), PA using the Baecke questionnaire, and both non-sedentary time and ST using accelerometry from wave 4 of the Healthy Aging in Neighborhoods of Diversity across the Life Span (HANDLS) study (n = 2,167). After applying exclusion criteria, the sample size was n = 1,359 for analyses of self-reported PA and n = 404 for analyses of accelerometry data. Factor analysis identified key neighborhood characteristics to develop a total neighborhood perception score (NPS). Higher NPS indicated less favorable neighborhood perception. Linear regression was used to determine the relationship between NPS, PA, non-sedentary time, and ST.
Results: Complete data were available for n = 1,359 [age 56.6(9.0) years, 59.5% female, 62.2% African American] for whom we identified four neighborhood perception factors: (1) concern about crime, (2) physical environment, (3) location of violent crime, and (4) social environment. Worsening perception of the overall neighborhood [β = −0.13 (SE = 0.03); p = 0.001], the physical environment [−0.11 (0.05); p = 0.03], and the social environment [−0.46 (0.07); p < 0.0001] were associated with decreased PA. Worsening perception of the overall neighborhood [1.14 (0.49); p = 0.02] and neighborhood social environment [3.59 (1.18); p = 0.003] were associated with increased ST over the day. There were no interactions for race, sex, poverty status, or economic index.
Conclusion: Poor overall neighborhood perception, perceived social environment, and perceived neighborhood physical environment are associated with PA and ST in a multi-racial, socioeconomically diverse cohort of urban adults.
Clinical Trial Registration: The HANDLS study is registered at ClinicalTrials.gov as NCT01323322.
Introduction
In the United States, 25% of deaths are attributable to cardiovascular disease, making it the leading cause of death for both men and women (1). Nearly 50% of Americans have a significant risk factor for cardiovascular events, including hypertension, hyperlipidemia, and smoking; yet few are actively addressing these risks with health behavior change (1). Physical activity (PA) has been repeatedly shown to reduce risk of cardiovascular events, decrease overall mortality, and ameliorate health, leading multiple expert panels to recommend increased PA and decreased sedentary time (ST) as important preventive measures (2). Sedentary time is critical for intervention as it is an independent risk factor for cardiometabolic disease (3, 4) and, with accumulating evidence, all-cause mortality (5, 6). However, individual behavior cannot be considered independently of its environmental context, which may be exerting formidable influence on decision-making through perception and opportunity.
The neighborhood environment is undoubtedly a key determinant of cardiovascular health, as it has been repeatedly associated with increasing body mass index (7), cardiovascular events (8), and incident diabetes (9, 10). Neighborhood factors that influence health include crime (6, 7), perceived safety (11), physical attributes (graffiti, lighting, structural damage, etc.) (12), social cohesion (13), and walkability (10). A recent review highlights the constructs underlying neighborhoods and cardiometabolic health (14). Social cohesion refers to the collective efficacy that underlies building shared community values to advance toward common goals (15–17). Neighborhood disorder refers to physical decay and fear that negatively impact the neighborhood environment (15, 18). Walkability is the ability of the physical environment to facilitate outdoor recreational activities, such as active transport (10, 19). The more notable debate regarding these concepts is whether research should emphasize objective or perceived measures of neighborhood condition. Several studies demonstrate resident perception of these factors as more predictive of health outcomes than objective measures (7, 11, 20, 21).
Although many studies have focused on neighborhood barriers to PA, few have looked at factors that promote sedentary behavior (22). Those that have evaluated the relationship between neighborhood factors and ST have reported mixed results, likely due to variable neighborhood measures and inconsistent operational definitions of ST. Use of objective measures of ST is even more rare. Kozo and colleagues investigated accelerometry and self-reported ST to evaluate the relationship between ST and neighborhood walkability, but did not consider other neighborhood characteristics (23). Similarly, Van Dyck and colleagues examined transit-related ST in relation to neighborhood walkability and transportation resources, but did not measure other neighborhood conditions and relied entirely on self-reported ST (24). Despite the discrepancies in measurement and analysis, preliminary findings support the role of neighborhood environment on ST (25, 26) and health outcomes such as blood pressure, resting heart rate, and body mass index (BMI) (21, 25). Further studies are needed to evaluate the role of the neighborhood environment on health behaviors within diverse populations, using objective measures of ST, and considering multiple neighborhood characteristics.
Using data from the Healthy Aging in Neighborhoods of Diversity across the Life Span (HANDLS) study of African American and white, socioeconomically diverse, community-dwelling adults, we explore the neighborhood environment as a key precipitant of CVD risk through its ability to decrease PA and promote ST. This study aims to investigate the cross-sectional relationship between perception of neighborhood environment, PA, and ST, as well as the potential moderating effects of race, sex, and socioeconomic status. We expect that those who perceive a worse neighborhood environment will be less likely to engage in PA and more likely to engage in sedentary behavior.
Methods
HANDLS Study
The HANDLS study is a cohort (n = 3,720) of white and African American socioeconomically diverse individuals in Baltimore City, Maryland 30–64 years old at baseline. The participants are a fixed cohort recruited from 13 neighborhoods selected by area probability sampling. As a longitudinal study, HANDLS collected consecutive waves of data every 4–5 years with interim analyses. Waves 1 through 4 were completed between August 2004 and September 2017, with Wave 4—used here—occurring from September 2013 to September 2017. The study design and methodology have been previously described in detail (27). The National Institute of Environmental Health Sciences institutional review board approved the study and all participants signed written, informed consent.
Secondary data from the HANDLS study were analyzed for this project. Using HANDLS Wave 4 data (n = 2,167), we excluded participants who refused to answer the entire neighborhood questionnaire (n = 591) or entire PA questionnaire (n = 103), as well as those who lacked complete covariate data (n = 208). This resulted in a sample of 1,359 for analysis of PA. A subset of Wave 4 participants were offered the opportunity to participate in the accelerometry. The sample size is limited in these analyses by both the smaller cohort who participated and by missing covariate data. The final analytic sample for the accelerometry cohort was n = 404. HANDLS Wave 4 was the only wave with accompanying accelerometer data, therefore, the analyses were conducted cross-sectionally rather than longitudinally.
Neighborhood Questionnaire
The exposure of interest, neighborhood perception score (NPS), was derived via principal components factor analysis from a neighborhood questionnaire completed by HANDLS participants. Response options were scaled on a 5-point Likert scale. The questionnaire consisted of two questions on neighborhood accessibility, five questions on neighborhood social cohesion, three questions on neighborhood social conscience, 11 questions on neighborhood disorder, and 29 questions on neighborhood crime. Neighborhood social cohesion, social conscience, and disorder were assessed using dimensions suggested by Sampson et al. (15, 28). The remaining neighborhood violence questions were developed by a HANDLS collaborator and expert in the field.
Measures of Physical Activity and Sedentary Time
Self-reported Likert scale responses to the Baecke Physical Activity Questionnaire were reverse coded as needed and summed into individual category scores (Work, Sport, and Leisure) and then summed again for a total PA score. Work, Sport, and Leisure PA are standard indices of the Baecke Questionnaire and are created by summing responses to the questions included in each section of the questionnaire, as described by Baecke et al. (29). Leisure time PA (LTPA) was defined as the sum of Sport and Leisure PA. A higher combined score indicates a greater level of PA. This questionnaire has been repeatedly validated in numerous populations (30–32). However, there is no standard conversion to minutes per week of PA.
ST and non-sedentary time were measured by an ActiGraph GT3X+ accelerometer in a subset of the Wave 4 participants (n = 760). The wrist location of the ActiGraph has been shown to have increased participant adherence for 24-h wear compared to both hip-based locations and the adhesively attached leg of the ActivPAL. Additionally, ActiGraph has a longer battery life. Participants were asked to wear a wrist-worn ActiGraph 24 h per day (except when bathing, showering, or swimming) for 1 week. Accelerometer data were aggregated into 60-s epochs and then screened for non-wear using a standard algorithm to detect sustained periods of non-movement (33). Accelerometer data were considered to be valid if participants had more than 10 h per day of wear on at least 4 days. Accelerometer-assessed sedentary time was defined as the number of minutes when the accelerometer registered <1,853 vector magnitude counts (34). A vector magnitude count is an aggregated measure of acceleration across all three axes. Non-sedentary time was used as a proxy measure for objective PA in these participants. Accelerometer data were further categorized by time of day as total waking hours (5 a.m.−11 p.m.); exploratory analyses were conducted with three additional categories: morning hours (5 a.m.−9 a.m.), working hours (9 a.m.−5 p.m.), and evening hours (5 p.m.−11 p.m.).
Covariates
The covariates used in the analyses were collected during the HANDLS study visit via interview and questionnaire. The categorical covariates include sex (women vs. men), race/ethnicity (African American vs. Non-Hispanic White), poverty status (above vs. below 125% of the federal poverty level), education [less than high school vs. high school/General Educational Development (GED) and above], and length of residence in the neighborhood (<1 year vs. ≥1 year). Continuous covariates include age (years), BMI (kg/m2), and neighborhood economic index based on 2012–2016 American Community Survey data [NEI; see Mode et al. (35)]. Neighborhood economic index was used to provide a measure of objective neighborhood environment in the analysis. Covariates were selected following review of the literature (35–37).
Statistical Analysis
The neighborhood perception score (NPS) was calculated from the neighborhood questionnaire using the following analytic technique. Principal axis factoring was used to identify common themes (factors) from the neighborhood questionnaire. The sample size was assessed to be sufficient for factor analysis based on prior research (38). Promax (oblique) rotation was applied. A loading score of 0.40 was required for inclusion in the factor and the minimum eigenvalue was set at 1. Neighborhood perception scores were computed using only the items that loaded into factors. The numerical value of each Likert-scale response was summed to create a total neighborhood perception score (NPS) and factor-specific NPS. Cronbach's alpha measured the internal consistency of each factor; only those with a value above 0.70 were considered acceptable. A higher NPS represents a worse perception of the neighborhood environment. Analysis of Kurtosis and Skew demonstrated that NPS was normally distributed.
Descriptive statistics of participant characteristics were calculated and evaluated for correlation to total NPS using pairwise correlation coefficients. Since the data are a multilevel structure (i.e., individuals nested within census tracts), an intraclass correlation coefficient (ICC) was calculated for an intercept only model. The ICC was 2.7%, indicating a low proportion of the variability lies within census tracts. Although ICC is not the only available indicator for determining the need for multilevel modeling, it informed the decision to pursue simple regression models instead of multilevel modeling (39–41). Multivariable linear regression modeling evaluated the influence of NPS on PA, LTPA, non-sedentary time, and ST. Models were adjusted for age, BMI, race (referent = white), poverty status (referent = above poverty level), education (referent = below high school/GED), NEI, and length of residence at the same address (referent ≤ 1 year). Multicollinearity of the variables was examined using tolerance and variance inflation factors (VIF), and independent variables (i.e., age, race, sex, BMI, income, education, length of residence, poverty status, NEI) were not found to be collinear (VIF <2.0). After adjustment for covariates, the sample size for the PA and LTPA was n = 1,359 and the sample for ST and non-sedentary time was n = 404, due to missing covariate data. Interaction terms between NPS and race, sex, NEI, and poverty status were evaluated. All analyses were conducted in Stata/IC Version 12.1 (StataCorp, College Station, TX).
Results
Participant socio-demographic, health, and neighborhood characteristics are shown in Table 1. Total NPS ranged from 42 to 140, with a median value of 87. The sample was ~60% female, 62% African American, and had a mean age of 56.1 years (SD 9.0) and mean BMI of 31.0 kg/m2 (SD 7.7). None of the socio-demographic or activity variables were strongly correlated to total NPS, as all correlation coefficients were <0.18 (Table 1). Correlations between the factor scores were also assessed and found to be minimal (data not shown).
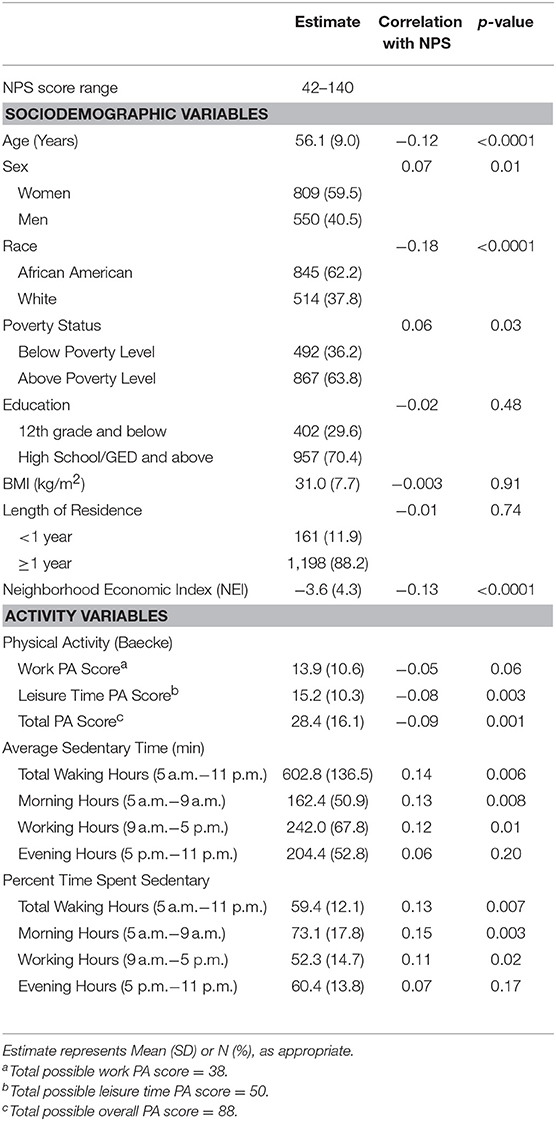
Table 1. Correlations between participant characteristics and total neighborhood perception score for the analytic cohort (n = 1,359).
The results of the principal component factor analysis are shown in Table 2. The analysis yielded four factors that together explained 93.7% of the variance. The four factors were interpreted as: (1) concern about specific types of crime, (2) physical environment, (3) location of violent crime, and (4) social environment, with Cronbach's alpha coefficients of 0.96, 0.93, 0.87, and 0.83, respectively. As shown in Table 2, 13 questions defined worrying about specific types of crime, 11 questions defined perceptions of neighborhood physical environment, five questions defined perceptions of where violent crime occurs, and seven questions defined perceptions of neighborhood social environment.
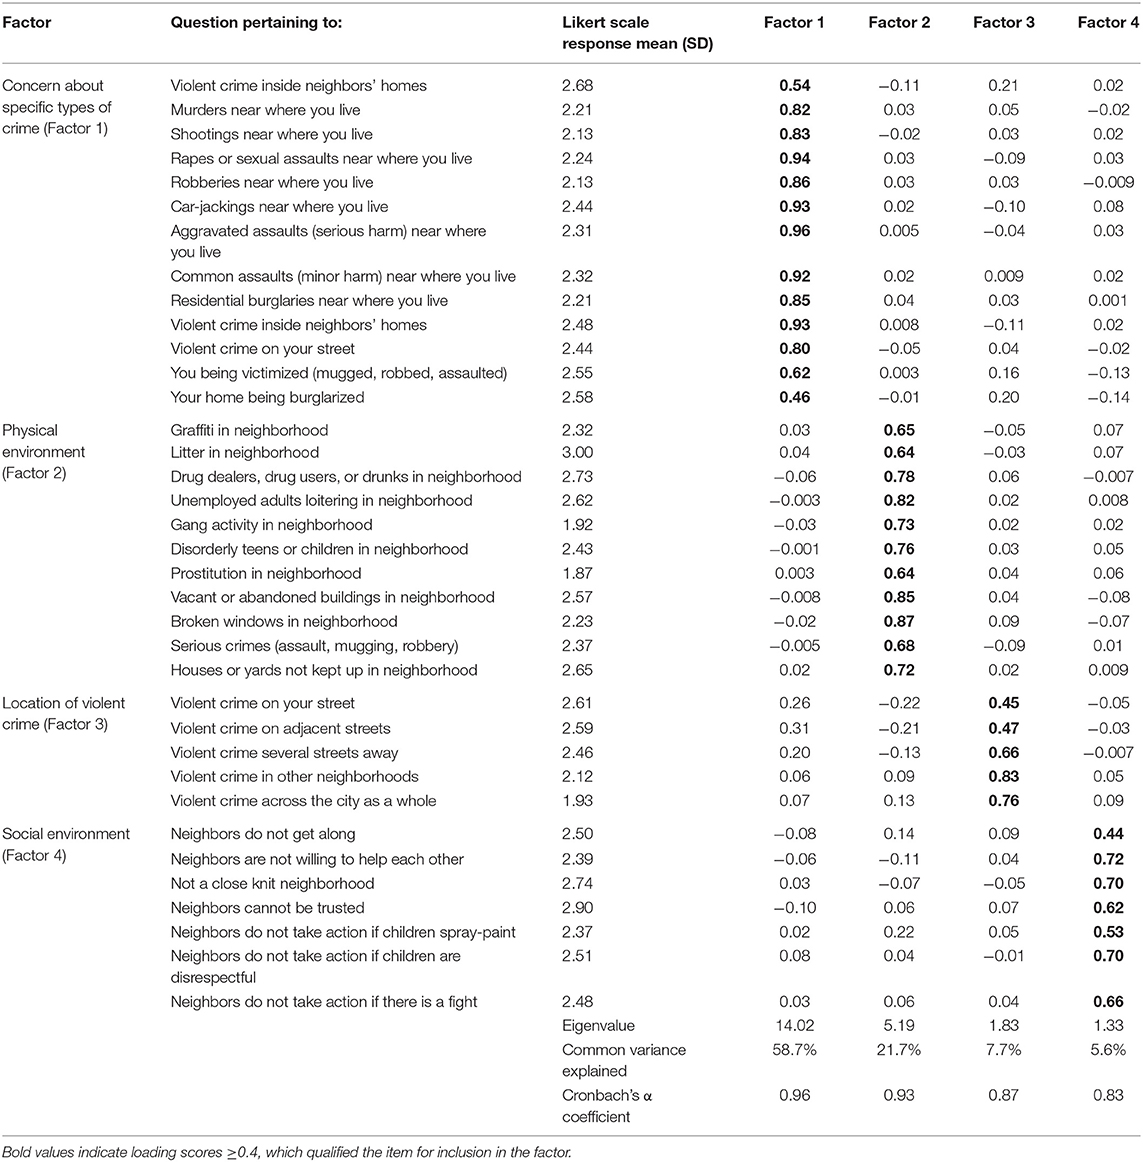
Table 2. Rotated factor loading scores and mean Likert scale response to the questions that loaded into each factor (n = 1,359).
Figure 1 shows the beta coefficients (β) and 95% confidence intervals of the regression results for total and factor-specific NPS on self-reported PA. For total PA, worsening overall neighborhood perception (β = −0.13; SE = 0.03; p = 0.001), perception of the neighborhood physical environment (Factor 2; β = −0.11; SE = 0.05; p = 0.03), and perception of the neighborhood social environment (Factor 4; β = −0.46; SE = 0.07; p < 0.0001) were associated with lower levels of PA. For leisure time PA, worsening overall neighborhood perception (β = −0.06; SE = 0.02; p = 0.001) and perception of the neighborhood social environment (Factor 4; β = −0.32; SE = 0.05; p < 0.0001) were associated with decreased LTPA. There were no significant interactions for sex, race, or socioeconomic status. The regression coefficients for all covariates in each model for PA and LTPA are included in Supplemental Tables 1, 2, respectively.
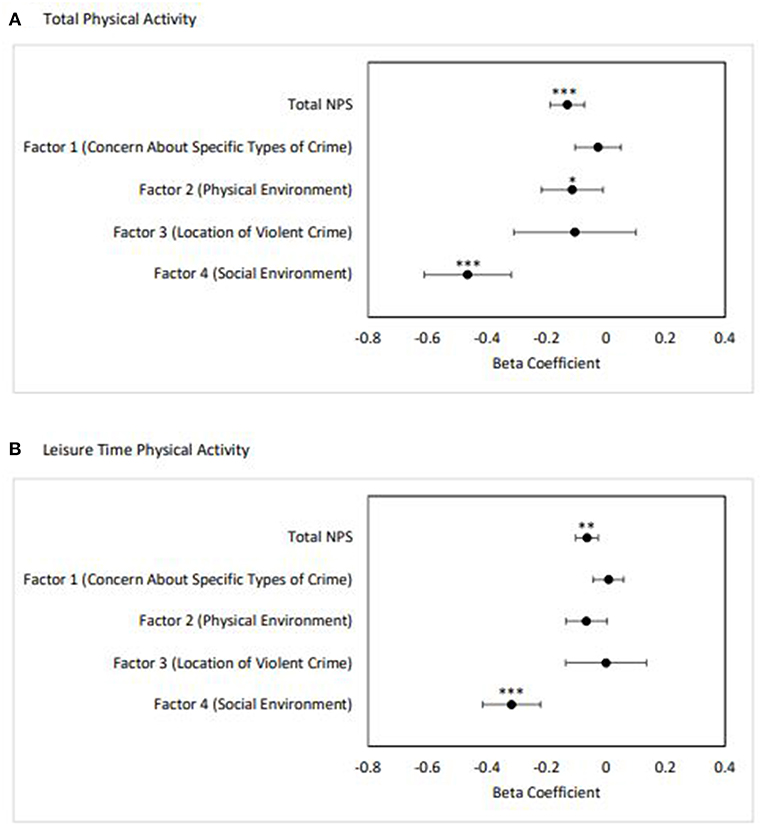
Figure 1. Adjusted linear regression results of total and factor-specific NPS on self-reported physical activity (n = 1,359). (A) Total PA, (B) Leisure time PA. Error bars represent 95% confidence interval. Adjusted for age, BMI, sex, race, poverty status, education, NEI, and length of residence in the neighborhood (*p < 0.05, **p ≤ 0.001, ***p < 0.0001).
Table 3 shows the regression results of total and factor-specific NPS on objectively measured ST. Worsening perception of the overall neighborhood environment was associated with increased ST over the entire waking day (β 1.14; SE 0.49; p = 0.02). Worsening perception of the neighborhood social environment (Factor 4) was associated with increased ST over the entire day (β 3.59; SE 1.18; p = 0.003). There were no significant interactions for sex, race, or socioeconomic status.
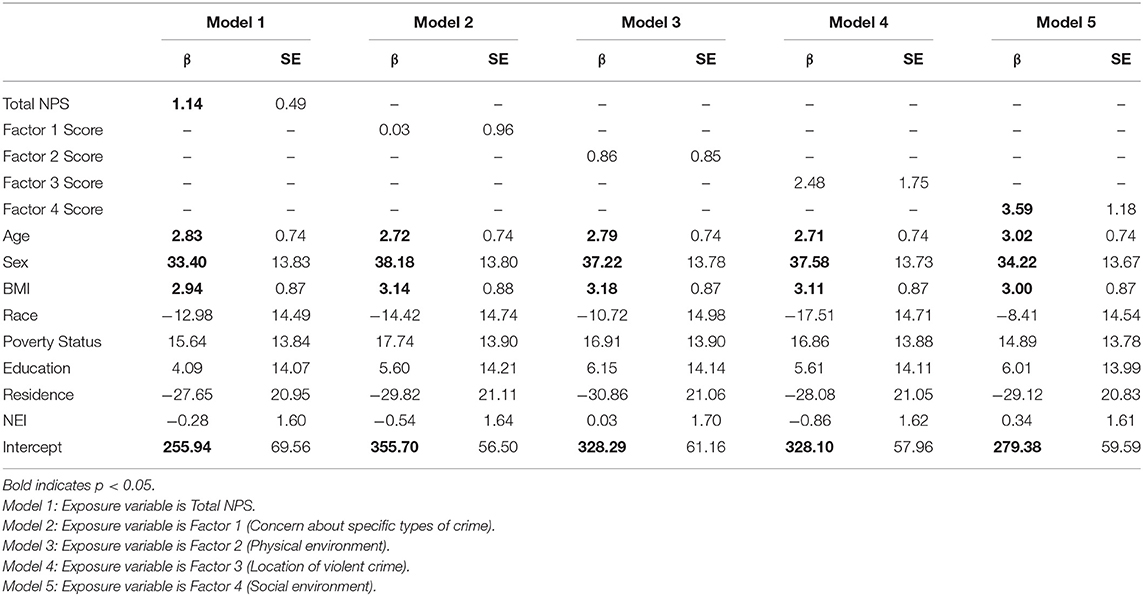
Table 3. Adjusted linear regression results of total and factor-specific NPS on accelerometer-measured sedentary time for the entire waking day (n = 404).
Further exploratory analyses were conducted to evaluate ST during discrete periods of the day (morning hours, working hours, and evening hours). Worsening perception of the overall neighborhood environment was associated with increased ST during morning hours (β 0.47; SE 0.19; p = 0.01). Additionally, worsening perception of the neighborhood social environment (Factor 4) was associated with increased ST during working hours (β 1.75; SE 0.59; p = 0.003). Data for discrete periods of the day are shown in Supplemental Tables 3–5.
Objectively measured non-sedentary time was similarly analyzed. Regression results for total and factor specific NPS for total waking hours and during discrete periods of the day. Results of these analyses were non-significant and are presented in Supplemental Tables 6–9.
Discussion
Based on cross-sectional data from the bi-racial, socioeconomically diverse HANDLS study, neighborhood environment appears to have a potent association with individuals' PA and ST. The literature on neighborhood environment describes differential effects based on gender (42, 43) and race (44). We considered the potential effect modification of race, sex, and socioeconomic status, but found no significant interactions in our models. This is consistent with Bell and colleagues' findings that gender interactions were only significant for objectively measured neighborhood deprivation and not perceived neighborhood deprivation when assessing the association with BMI and waist circumference (43). In our study, ST was pervasive and PA was low, which demonstrates higher risk of future cardiometabolic disease in this population (3). Although the literature has shown that neighborhoods broadly are associated with health behaviors (45), in this study, we sought to identify specific elements of the neighborhood environment that may be dictating individual PA and ST in a bi-racial, socioeconomically diverse population.
This study is unique in describing precise components of perceived crime, rather than relying on a single metric of general crime perception. Understanding the context in which participants decide to be physically active or sedentary by specifically describing individual types and categories of crime has not been previously done in relation to neighborhood environment, physical activity, and sedentary time and may help focus crime-related interventions. Prior work using agent-based model simulations have shown that radial distance from a crime may be influential in the decision-making process to engage in PA (46). Our findings show that neither higher concern regarding specific types of crime nor higher perceived violent crime at the neighborhood level were associated with PA. This was contrary to our expectations, but has been demonstrated previously in the literature. For example, Oh and colleagues found that neither perceived nor objectively measured crime, nor perceived crime-related safety, were associated with adherence to a walking-based PA intervention among African American women (47). The women with both high and low crime environment scores engaged equally in PA. Additionally, cross-sectional associations between neighborhood environment and PA among low-income African American adults in Pittsburgh demonstrated no significant association between objective neighborhood-level crime at moderate-to-vigorous PA (48). It is possible that participants in our study and others decide to engage in PA in areas away from the home and thereby insulate themselves from the perceived crime (49). Due to the survey-based measure of PA used in this study, we were unable to determine the precise location of the PA. Therefore, we recommend use of objective measures of PA to compliment self-report in future studies.
Another unique aspect of this study is the use of objectively measured ST through accelerometry. Few studies have used accelerometers to capture ST and examine the association with neighborhood factors. Use of an accelerometer allowed us to describe ST patterns throughout the day and over several days for each participant. We found that worse perception of the neighborhood social environment was associated with increased ST overall and between 9 a.m. and 5 p.m., specifically. This may suggest that those who perceive a lack of neighborhood social cohesion may experience limited opportunities to engage positively with neighbors or the surrounding social environment and therefore choose to remain sedentary. Further work using objectively measured ST will be necessary to develop a more comprehensive understanding of sedentary behavior among community-dwelling adults and the influence of neighborhood environment.
Contrary to prior research, our findings do not demonstrate a relationship between perceived neighborhood crime and increased ST (50). Although unexpected, this may point to an underlying relationship between the social environment and the influence of perceived crime on health behaviors. It has been previously shown that there is an inverse association between neighborhood violence and social cohesion (28), where greater social support is associated with higher perceived neighborhood safety among low-income, urban residents (51). Elements of the social environment, including resident social interactions and neighborhood diversity, have been associated with increased walking behavior and decreased ST among older adults (52). Therefore, these findings may suggest the possibility that a positive social environment could temper the impact of perceived crime on health behaviors such as PA and ST. Further investigation is needed to understand what drives individuals' behavior in response to perceived threat of crime and how the social environment may mediate the decision-making process.
The prominent relationship between neighborhood social environment and both PA and ST in our study illuminates a crucial yet physically intangible neighborhood influence on behavior. Improved neighborhood social environment has previously been associated with lower incidence of type 2 diabetes mellitus (53), myocardial infarction (54), and stroke mortality (55). Poor neighborhood social cohesion is hypothesized to act on physical health via transmission of negative health behaviors and lack of social support (45). Therefore, it is possible that improving social cohesion could simultaneously increase PA and decrease ST, but solutions are likely to be community-specific, requiring ongoing dialogue with residents through community engagement, including through community based participatory research (17, 56). Emphasis on opportunities for resident interactions has been shown to facilitate improved neighborhood social cohesion (57) and has been associated with higher probability of meeting PA recommendations (58). Providing communal gathering areas, encouraging mixed land use for walkable destinations, increasing transit stops, facilitating group activities, enhancing multi-generational engagement, and reducing perception of crime would likely improve the social environment and thereby reduce ST (57, 59). Determining which community solutions will succeed may be best accomplished through community engagement (60). The need for community engagement in medical research is well-described by Holzer and colleagues, who demonstrate the potential for enhanced trust and participation (61). Fostering the participant-researcher relationship and including participants as co-researchers offers possibility of more direct tailoring of interventions to community needs based on participant-identified community-specific challenges (62). This may both improve the quality of the research and increase the likelihood of implementation of findings following its conclusion.
This study has several limitations. Foremost, it is lacking in objective crime and physical activity data. While objective measures of neighborhood have been shown to be poorly correlated with an individual's perception (47, 63), having both objective and subjective measures for analysis would enhance our understanding of what is driving the relationships. This study also lacks subjective measures of ST, which would potentially elucidate perceptions of “available” time for PA and thus possibly a critical psychological component of an individuals' decision to engage in PA. Additionally, due to the nature of factor analysis, it is not possible to determine whether there were key items and which items within a factor—for example, what component of the social environment—were responsible for the relationships observed. Knowledge of specific characteristics to be modified will be essential to designing successful, targeted interventions in the future. It must be noted that in this analysis, multiple comparisons were computed without adjusting the p-values, therefore the findings should be interpreted with caution. Additionally, the neighborhood violence questions were developed by a HANDLS collaborator and have not been validated as a scale. The questionnaire did not include collision fatalities as an aspect of neighborhood safety, which have been considered as a measure of safety in other studies (64). Finally, due to the cross-sectional nature of the analysis, we are unable to look at health outcomes in this population over time as a result of their exposure to these environmental influences on PA and ST.
Conclusion and Implications for Health Promotion
Neighborhood socioeconomic status (35) and neighborhood perception (7, 9, 65) are known to be strong determinants of health, specifically chronic disease outcomes (53, 66). This study shows that neighborhood social environment may be influencing residents' behavior and decisions, including the probability of engaging in PA or remaining sedentary for adults living in Baltimore, Maryland. This study is novel in individually highlighting specific elements of the social environment, neighborhood-level crime, and physical neighborhood characteristics which may be key mediators between neighborhoods and health. Furthermore, this study specifically identifies risk factors for increased ST, which are understudied in the literature. Our work, in conjunction with existing literature, is most relevant to designing physical activity and obesity interventions in and around Baltimore, MD (46, 60, 67, 68).
Interventions that focus on improving the neighborhood social environment may enhance residents' perception of PA resources and increase their likelihood of engaging in PA while decreasing the likelihood of ST. Therefore, planning public health interventions to promote PA should not be conducted in isolation, rather, consideration of the neighborhood environment is critical. Addressing the neighborhood environment may be best accomplished through community engagement that results in discussion of specific social environmental barriers. These conversations may take place through the formation of a community advisory board by the research team or through participant focus groups. With respect to conducting research on PA and ST in the community setting, we recommend the use of accelerometers to accurately capture participants' activity throughout the day. Additionally, we recommend the consideration of focused measures of crime to adequately characterize the implications of adverse social behaviors on residents' decision making with respect to PA and ST.
Data Availability
The datasets for this manuscript are not publicly available due to confidentiality reasons. Requests to access the datasets should be directed to the corresponding author.
Ethics Statement
The studies involving human participants were reviewed and approved by National Institute of Environmental Health Sciences institutional review board. The patients/participants provided their written informed consent to participate in this study.
Author Contributions
TP-W conceived of the study, participated in its design, data analysis, and writing the manuscript. SC participated in the study design, data analysis, and writing the manuscript. ES and TH participated in data analysis and drafting the manuscript. CA participated in developing the study design and drafting the manuscript. NM, AZ, and ME oversaw primary data collection for the HANDLS cohort, provided feedback on the study analyses, reviewed analyzed data, and assisted in writing the manuscript.
Funding
The TP-W Lab (Grant No. ZIA-HL006148, ZIA-HL006168, and ZIA-HL006225) was funded by the Division of Intramural Research of the National Heart, Lung, and Blood Institute and the Intramural Research Program of the National Institute on Minority Health and Health Disparities. This research was supported in part by the Intramural Research Program of the NIH, National Institute on Aging (Grant No. Z01-AG000194). The views expressed in this manuscript are those of the authors and do not necessarily represent the views of the National Heart, Lung, and Blood Institute; the National Institute on Minority Health and Health Disparities; the National Institute on Aging, the National Institutes of Health; or the U.S. Department of Health and Human Services. SC is also supported by the NIH Medical Research Scholars Program, a public-private partnership supported jointly by the NIH and generous contributions to the Foundation for the NIH from the Doris Duke Charitable Foundation, the American Association for Dental Research, the Colgate-Palmolive Company, Genentech, Elsevier, and other private donors.
Conflict of Interest Statement
The authors declare that the research was conducted in the absence of any commercial or financial relationships that could be construed as a potential conflict of interest.
Supplementary Material
The Supplementary Material for this article can be found online at: https://www.frontiersin.org/articles/10.3389/fpubh.2019.00256/full#supplementary-material
Abbreviations
PA, physical activity; ST, sedentary time; CVD, cardiovascular disease; NPS, neighborhood perception score; HANDLS, Healthy Aging in Neighborhoods of Diversity across the Lifespan.
References
2. Myers J. Exercise and cardiovascular health. Circulation. (2003) 107:e2–5. doi: 10.1161/01.CIR.0000048890.59383.8D
3. Healy GN, Matthews CE, Dunstan DW, Winkler EA, Owen N. Sedentary time and cardio-metabolic biomarkers in US adults: NHANES 2003-06. Eur Heart J. (2011) 32:590–7. doi: 10.1093/eurheartj/ehq451
4. Same RV, Feldman DI, Shah N, Martin SS, Al Rifai M, Blaha MJ, et al. Relationship between sedentary behavior and cardiovascular risk. Curr Cardiol Rep. (2016) 18:6. doi: 10.1007/s11886-015-0678-5
5. Biddle SJH, Bennie JA, Bauman AE, Chau JY, Dunstan D, Owen N, et al. Too much sitting and all-cause mortality: is there a causal link? BMC Public Health. (2016) 16:635. doi: 10.1186/s12889-016-3307-3
6. Matthews CE, Cohen SS, Fowke JH, Han X, Xiao Q, Buchowski MS, et al. Physical activity, sedentary behavior, and cause-specific mortality in black and white adults in the Southern Community Cohort Study. Am J Epidemiol. (2014) 180:394–405. doi: 10.1093/aje/kwu142
7. Powell-Wiley TM, Moore K, Allen N, Block R, Evenson KR, Mujahid M, et al. Associations of neighborhood crime and safety and with changes in body mass index and waist circumference the multi-ethnic study of atherosclerosis. Am J Epidemiol. (2017) 186:280–8. doi: 10.1093/aje/kwx082
8. Chum A, O'Campo P. Cross-sectional associations between residential environmental exposures and cardiovascular diseases. BMC Public Health. (2015) 15:438. doi: 10.1186/s12889-015-1788-0
9. Christine PJ, Auchincloss AH, Bertoni AG, Carnethon MR, Sánchez BN, Moore K, et al. Longitudinal associations between neighborhood physical and social environments and incident type 2 diabetes mellitus: the multi-ethnic study of atherosclerosis (MESA). JAMA Intern Med. (2015) 175:1311–20. doi: 10.1001/jamainternmed.2015.2691
10. Creatore MI, Glazier RH, Moineddin R, Fazli GS, Johns A, Gozdyra P, et al. Association of neighborhood walkability with change in overweight, obesity, and diabetes. JAMA. (2016) 315:2211–20. doi: 10.1001/jama.2016.5898
11. Fish JS, Ettner S, Ang A, Brown AF. Association of perceived neighborhood safety on body mass index. Am J Public Health. (2010) 100:2296–303. doi: 10.2105/AJPH.2009.183293
12. Powell-Wiley TM, Ayers CR, de Lemos JA, Lakoski SG, Vega GL, Grundy S, et al. Relationship between perceptions about neighborhood environment and prevalent obesity: data from the Dallas Heart Study. Obesity (Silver Spring). (2013) 21:e14–21. doi: 10.1002/oby.20012
13. Guilcher SJT, Kaufman-Shriqui V, Hwang J, O'Campo P, Matheson FI, Glazier RH, et al. The association between social cohesion in the neighborhood and body mass index (BMI): An examination of gendered differences among urban-dwelling Canadians. Prev Med. (2017) 99:293–8. doi: 10.1016/j.ypmed.2017.02.022
14. Tamura K, Langerman SD, Ceasar JN, Andrews MR, Agrawal M, Powell-Wiley TM. Neighborhood social environment and cardiovascular risk. Curr Cardiovasc Risk Rep. (2019) 13:13. doi: 10.1007/s12170-019-0601-5
15. Sampson RJ, Raudenbush SW. Seeing disorder: neighborhood stigma and the social construction of “Broken Windows”. Soc Psychol Q. (2004) 67:319–42. doi: 10.1177/019027250406700401
16. Fonseca X, Lukosch S, Brazier F. Social cohesion revisited: a new definition and how to characterize it. Innov Eur J Soc Sci Res. (2019) 32:231–53. doi: 10.1080/13511610.2018.1497480
17. Yuma-Guerrero PJ, Cubbin C, von Sternberg K. Neighborhood social cohesion as a mediator of neighborhood conditions on mothers' engagement in physical activity. Health Educ Behav. (2017) 44:845–56. doi: 10.1177/1090198116687537
18. Franzini L, Caughy MO, Nettles SM, O'Campo P. Perceptions of disorder: contributions of neighborhood characteristics to subjective perceptions of disorder. J Environ Psychol. (2008) 28:83–93. doi: 10.1016/j.jenvp.2007.08.003
19. Paul P, Carlson SA, Fulton JE. Walking and the perception of neighborhood attributes among U.S. adults-2012. J Phys Act Health. (2017) 14:36–44. doi: 10.1123/jpah.2015-0685
20. Lovasi GS, Goh CE, Pearson AL, Breetzke G. The independent associations of recorded crime and perceived safety with physical health in a nationally representative cross-sectional survey of men and women in New Zealand. BMJ Open. (2014) 4:e004058. doi: 10.1136/bmjopen-2013-004058
21. Ahuja C, Ayers C, Hartz J, Adu-Brimpong J, Thomas S, Mitchell V, et al. Examining relationships between perceptions and objective assessments of neighborhood environment and sedentary time: data from the Washington, D.C. cardiovascular health and needs assessment. Prev Med Rep. (2018) 9:42–8. doi: 10.1016/j.pmedr.2017.12.002
22. Koohsari MJ, Sugiyama T, Sahlqvist S, Mavoa S, Hadgraft N, Owen N. Neighborhood environmental attributes and adults' sedentary behaviors: review and research agenda. Prev Med (Baltim). (2015) 77:141–9. doi: 10.1016/j.ypmed.2015.05.027
23. Kozo J, Sallis JF, Conway TL, Kerr J, Cain K, Saelens BE, et al. Sedentary behaviors of adults in relation to neighborhood walkability and income. Health Psychol. (2012) 31:704–13. doi: 10.1037/a0027874
24. Van Dyck D, Cerin E, Conway TL, De Bourdeaudhuij I, Owen N, Kerr J, et al. Associations between perceived neighborhood environmental attributes and adults' sedentary behavior: findings from the USA, Australia and Belgium. Soc Sci Med. (2012) 74:1375–84. doi: 10.1016/j.socscimed.2012.01.018
25. Lee RE, Mama SK, Adamus-Leach HJ. Neighborhood street scale elements, sedentary time and cardiometabolic risk factors in inactive ethnic minority women. PLoS ONE. (2012) 7:e51081. doi: 10.1371/journal.pone.0051081
26. Strong LL, Reitzel LR, Wetter DW, McNeill LH. Associations of perceived neighborhood physical and social environments with physical activity and television viewing in African American men and women. Am J Health Promot. (2013) 27:401–9. doi: 10.4278/ajhp.120306-QUAN-127
27. Evans MK, Lepkowski JM, Powe NR, LaVeist T, Kuczmarski MF, Zonderman AB. Healthy aging in neighborhoods of diversity across the life span (HANDLS): overcoming barriers to implementing a longitudinal, epidemiologic, urban study of health, race, and socioeconomic status. Ethn Dis. (2010) 20:267–275.
28. Sampson RJ, Raudenbush SW, Earls F. Neighborhoods and violent crime: a multilevel study of collective efficacy. Science. (1997) 277:918–24. doi: 10.1126/science.277.5328.918
29. Baecke JA, Burema J, Frijters JE. A short questionnaire for the measurement habitual physical activity in epidemiological studies. Am J Clin Nutr. (1982) 36:936–42. doi: 10.1093/ajcn/36.5.936
30. Philippaerts RM, Westerterp KR, Lefevre J. Doubly labelled water validation of three physical activity questionnaires. Int J Sports Med. (1999) 20:284–9. doi: 10.1055/s-2007-971132
31. Pols MA, Peeters PH, Bueno-De-Mesquita HB, Ocké MC, Wentink CA, Kemper HC, et al. Validity and repeatability of a modified Baecke questionnaire on physical activity. Int J Epidemiol. (1995) 24:381–8. doi: 10.1093/ije/24.2.381
32. Helmerhorst HJ, Brage S, Warren J, Besson H, Ekelund U. A systematic review of reliability and objective criterion-related validity of physical activity questionnaires. Int J Behav Nutr Phys Act. (2012) 9:103. doi: 10.1186/1479-5868-9-103
33. Choi L, Ward SC, Schnelle JF, Buchowski MS. Assessment of wear/nonwear time classification algorithms for triaxial accelerometer. Med Sci Sports Exerc. (2012) 44:2009–16. doi: 10.1249/MSS.0b013e318258cb36
34. Koster A, Shiroma EJ, Caserotti P, Matthews CE, Chen KY, Glynn NW, et al. Comparison of sedentary estimates between activPAL and hip- and wrist-worn ActiGraph. Med Sci Sports Exerc. (2016) 48:1514–22. doi: 10.1249/MSS.0000000000000924
35. Mode NA, Evans MK, Zonderman AB. Race, neighborhood economic status, income inequality and mortality. PLoS ONE. (2016) 11:e0154535. doi: 10.1371/journal.pone.0154535
36. Unger E, Diez-Roux AV, Lloyd-Jones DMM, Mujahid MS, Nettleton JA, Bertoni A, et al. Association of neighborhood characteristics with cardiovascular health in the multi-ethnic study of atherosclerosis (MESA). Circ Cardiovasc Qual Outcomes. (2014) 7:524–31. doi: 10.1161/CIRCOUTCOMES.113.000698
37. Mujahid MS, Diez-Roux AV, Morenoff JD, Raghunathan TE, Cooper RS, Ni H, et al. Neighborhood characteristics and hypertension. Epidemiology. (2008) 19:590–8. doi: 10.1097/EDE.0b013e3181772cb2
38. Osborne JW, Costello AB. Sample size and subject to item ratio in principal components analysis. Pract Assess Res Eval. (2004) 9:1–9.
39. Li F, Fisher KJ, Bauman A, Ory MG, Chodzko-Zajko W, Harmer P, et al. Neighborhood influences on physical activity in middle-aged and older adults: a multilevel perspective. J Aging Phys Act. (2005) 13:87–114. doi: 10.1123/japa.13.1.87
40. Musca SC, Kamiejski R, Nugier A, Méot A, Er-Rafiy A, Brauer M. Data with hierarchical structure: impact of intraclass correlation and sample size on type-I error. Front Psychol. (2011) 2:74. doi: 10.3389/fpsyg.2011.00074
41. Diez-Roux AV. Multilevel analysis in public health research. Annu Rev Public Health. (2000) 21:171–92. doi: 10.1146/annurev.publhealth.21.1.171
42. Snedker KA. Neighborhood conditions and fear of crime: a reconsideration of sex differences. Crime Delinq. (2015) 61:45–70. doi: 10.1177/0011128710389587
43. Bell JA, Hamer M, Shankar A. Gender-specific associations of objective and perceived neighborhood characteristics with body mass index and waist circumference among older adults in the English longitudinal study of ageing. Am J Public Health. (2014) 104:1279–86. doi: 10.2105/AJPH.2014.301947
44. Wong MS, Chan KS, Jones-Smith JC, Colantuoni E, Thorpe RJ, Bleich SN. The neighborhood environment and obesity: understanding variation by race/ethnicity. Prev Med. (2017) 111:371–7. doi: 10.1016/j.ypmed.2017.11.029
45. Diez Roux AV, Mair C. Neighborhoods and health. Ann N Y Acad Sci. (2010) 1186:125–45. doi: 10.1111/j.1749-6632.2009.05333.x
46. Powell-Wiley TM, Wong MS, Adu-Brimpong J, Brown ST, Hertenstein DL, Zenkov E, et al. Simulating the impact of crime on African American women's physical activity and obesity. Obesity. (2017) 25:2149–55. doi: 10.1002/oby.22040
47. Oh AY, Zenk SN, Wilbur J, Block R, McDevitt J, Wang E. Effects of perceived and objective neighborhood crime on walking frequency among midlife African American women in a home-based walking intervention. J Phys Act Health. (2010) 7:432–41. doi: 10.1123/jpah.7.4.432
48. Richardson AS, Troxel WM, Ghosh-Dastidar MB, Beckman R, Hunter GP, DeSantis AS, et al. One size doesn't fit all: cross-sectional associations between neighborhood walkability, crime and physical activity depends on age and sex of residents. BMC Public Health. (2017) 17:97. doi: 10.1186/s12889-016-3959-z
49. Giles-Corti B, Timperio A, Bull F, Pikora T. Understanding physical activity environmental correlates: increased specificity for ecological models. Exerc Sport Sci Rev. (2005) 33:175–81. doi: 10.1097/00003677-200510000-00005
50. Shaw RJ, Cukić I, Deary IJ, Gale CR, Chastin SFM, Dall PM, et al. The influence of neighbourhoods and the social environment on sedentary behaviour in older adults in three prospective cohorts. Int J Environ Res Public Health. (2017) 14:1–21. doi: 10.3390/ijerph14060557
51. De Jesus M, Puleo E, Shelton RC, Emmons KM. Associations between perceived social environment and neighborhood safety: health implications. Health Place. (2010) 16:1007–13. doi: 10.1016/j.healthplace.2010.06.005
52. Van Holle V, Van Cauwenberg J, De Bourdeaudhuij I, Deforche B, Van de Weghe N, Van Dyck D. Interactions between neighborhood social environment and walkability to explain belgian older adults' physical activity and sedentary time. Int J Environ Res Public Health. (2016) 13:E569. doi: 10.3390/ijerph13060569
53. Gebreab SY, Hickson DA, Sims M, Wyatt SB, Davis SK, Correa A, et al. Neighborhood social and physical environments and type 2 diabetes mellitus in African Americans: the jackson heart study. Health Place. (2017) 43:128–37. doi: 10.1016/j.healthplace.2016.12.001
54. Chaix B, Lindström M, Rosvall M, Merlo J. Neighbourhood social interactions and risk of acute myocardial infarction. J Epidemiol Community Health. (2008) 62:62–8. doi: 10.1136/jech.2006.056960
55. Kim ES, Park N, Peterson C. Perceived neighborhood social cohesion and stroke. Soc Sci Med. (2013) 97:49–55. doi: 10.1016/j.socscimed.2013.08.001
56. Suminski RR, Petosa RL, Poston CW, Neighborhoods on the Move Partnership. Neighborhoods on the move: a community-based participatory research approach to promoting physical activity. Prog Community Health Partnersh. (2009) 3:5. doi: 10.1353/cpr.0.0059
57. Child ST, Schoffman DE, Kaczynski AT, Forthofer M, Wilcox S, Baruth M. Neighborhood attributes associated with the social environment. Am J Health Promot. (2016) 30:634–7. doi: 10.4278/ajhp.140307-ARB-99
58. Ball K, Cleland VJ, Timperio AF, Salmon J, Giles-Corti B, Crawford DA. Love thy neighbour? Associations of social capital and crime with physical activity amongst women. Soc Sci Med. (2010) 71:807–14. doi: 10.1016/j.socscimed.2010.04.041
59. Suglia SF, Shelton RC, Hsiao A, Wang YC, Rundle A, Link BG. Why the neighborhood social environment is critical in obesity prevention. J Urban Health. (2016) 93:206–12. doi: 10.1007/s11524-015-0017-6
60. Mui Y, Ballard E, Lopatin E, Thornton RLJ, Pollack Porter KM, Gittelsohn J. A community-based system dynamics approach suggests solutions for improving healthy food access in a low-income urban environment. PLoS ONE. (2019) 14:1–13. doi: 10.1371/journal.pone.0216985
61. Holzer JK, Ellis L, Merritt MW. Why we need community engagement in medical research. J Investig Med. (2014) 62:851–5. doi: 10.1097/JIM.0000000000000097
62. Dresser R. A deep dive into community engagement. Narrat Inq Bioeth. (2017) 7:41–5. doi: 10.1353/nib.2017.0014
63. Foster S, Giles-Corti B. The built environment, neighborhood crime and constrained physical activity: an exploration of inconsistent findings. Prev Med. (2008) 47:241–51. doi: 10.1016/j.ypmed.2008.03.017
64. Kim E, Muennig P, Rosen Z. Vision zero: a toolkit for road safety in the modern era. Inj Epidemiol. (2017) 4:1–9. doi: 10.1186/s40621-016-0098-z
65. Barrington WE, Stafford M, Hamer M, Beresford SA, Koepsell T, Steptoe A. Socioeconomic deprivation, perceived neighborhood factors, and cortisol responses to induced stress among healthy adults. Health Place. (2014) 27:120–6. doi: 10.1016/j.healthplace.2014.02.001
66. Diez-Roux AV, Mujahid MS, Hirsch JA, Moore K, Moore LV. The impact of neighborhoods on cardiovascular risk: the MESA Neighborhood Study. Glob Heart. (2016) 11:353–63. doi: 10.1016/j.gheart.2016.08.002
67. Casagrande SS, Gittelsohn J, Zonderman AB, Evans MK, Gary-Webb TL. Association of walkability with obesity in Baltimore City, Maryland. Am J Public Health. (2011) 101(Suppl. 1):318–241. doi: 10.2105/AJPH.2009.187492
68. Healthy Baltimore (2020). Available online at: https://health.baltimorecity.gov/news/press-releases/2016-08-30-baltimore-city-health-departmentlaunches-“healthy-baltimore-2020” (accessed March 7, 2019).
Keywords: physical activity, sedentary time, racial/ethnic disparities, neighborhood, perceived crime, HANDLS
Citation: Claudel SE, Shiroma EJ, Harris TB, Mode NA, Ahuja C, Zonderman AB, Evans MK and Powell-Wiley TM (2019) Cross-Sectional Associations of Neighborhood Perception, Physical Activity, and Sedentary Time in Community-Dwelling, Socioeconomically Diverse Adults. Front. Public Health 7:256. doi: 10.3389/fpubh.2019.00256
Received: 23 May 2019; Accepted: 22 August 2019;
Published: 13 September 2019.
Edited by:
Maciej S. Buchowski, Vanderbilt University, United StatesReviewed by:
Tony Kuo, Fielding School of Public Health, United StatesMinJae Lee, University of Texas, United States
Copyright © 2019 Claudel, Shiroma, Harris, Mode, Ahuja, Zonderman, Evans and Powell-Wiley. This is an open-access article distributed under the terms of the Creative Commons Attribution License (CC BY). The use, distribution or reproduction in other forums is permitted, provided the original author(s) and the copyright owner(s) are credited and that the original publication in this journal is cited, in accordance with accepted academic practice. No use, distribution or reproduction is permitted which does not comply with these terms.
*Correspondence: Tiffany M. Powell-Wiley, dGlmZmFueS5wb3dlbGxAbmloLmdvdg==