 Carlos Villalobos
- Escuela de Ingeniería Comercial, Centro de Investigación en Economía Aplicada, Facultad de Economía y Negocios, Universidad de Talca, Talca, Chile
This paper provides an estimation of the accumulated detection rates and the accumulated number of infected individuals by the novel severe acute respiratory syndrome coronavirus 2 (SARS-CoV-2). Worldwide, on July 20, it has been estimated above 160 million individuals infected by SARS-CoV-2. Moreover, it is found that only about 1 out of 11 infected individuals are detected. In an information context in which population-based seroepidemiological studies are not frequently available, this study shows a parsimonious alternative to provide estimates of the number of SARS-CoV-2 infected individuals. By comparing our estimates with those provided by the population-based seroepidemiological ENE-COVID study in Spain, we confirm the utility of our approach. Then, using a cross-country regression, we investigated if differences in detection rates are associated with differences in the cumulative number of deaths. The hypothesis investigated in this study is that higher levels of detection of SARS-CoV-2 infections can reduce the risk exposure of the susceptible population with a relatively higher risk of death. Our results show that, on average, detecting 5 instead of 35 percent of the infections is associated with multiplying the number of deaths by a factor of about 6. Using this result, we estimated that 120 days after the pandemic outbreak, if the US would have tested with the same intensity as South Korea, about 85,000 out of their 126,000 reported deaths could have been avoided.
Introduction
Governments and policymakers dealing with the COVID-19 pandemic will fail in their objectives if their actions are guided by misleading data or subsequent misinformation. The authorities should have reliable estimations of the number of SARS-CoV-2 infected individuals. However, there are few attempts to estimate the total amount of infections (1–5). Consequently, health systems face enormous challenges since an unknown and probably a high proportion of all SARS-CoV-2 infections remains undetected. Moreover, data suggest that infected individuals can be highly contagious before the onset of symptoms and SARS-CoV-2 can be also highly contagious in individuals who will never develop any symptoms (6–10).
Undetected infections are dangerous because infectious individuals spread the coronavirus in unpredictable ways. Undetected infections consist of non-PCR-tested individuals with symptoms and asymptomatic individuals (non-COVID-19 patients) that are likely to remain undetected over all phases of the infection. However, non-PCR-tested individuals with symptoms would tend to auto-select themselves, depending on the severity of their symptoms (from mild to severe), toward treatment and late detection. For this reason, it is important to know the proportion of the infected population which is asymptomatic or has such mild symptoms that self-select them into the group of non-PCR-tested individuals (11–15). Here, regarding the estimation of the number of infections, and for purposes of public health, I advocate the view by Amartya Sen and Martha Nussbaum that is preferable to be vaguely right than precisely wrong.
The public health problem is that undetected asymptomatic individuals, as well as late-detected SARS-CoV-2 infected individuals, increase the risk for vulnerable groups1. Since there is a transmission channel between the level of detection and the number of deaths, the early detection of asymptomatic infections, pre-symptomatic, and mild COVID-19 cases is a public health concern.
Moreover, undetected cases also are responsible for the collapse of the health system by numerous aggravated and sometimes unexpected COVID-19 patients requiring treatment in a short period. Overwhelmed health care systems reduce the recovery prospects of patients by the lack of treatment, undertreatment, increased risk of mistreatment of all patients, including those with COVID-19, and also put at unnecessarily risk the health workforce (21, 22).
The problem is that many governments formulate their strategies and responses to the pandemic based on figures that they can control. This problem of reverse causality produces contra-productive incentives for governments since public opinion tends to negatively react to the report of the cumulative and the marginal numbers of detected (reported) cases. The contradiction is that something good, such as the increase in the testing efforts by governments can be perceived by the public opinion as something bad (due to the increase in detections). Worldwide, the media communicates confirmed cases and deaths as the relevant parameters to take into consideration when assessing the evolution of the pandemic. This is a mistake since this emphasis discourages governments from decidedly pushing for mass testing with the obvious consequence of an increased number of detected cases (although, as shown in this paper, there is a theoretical mechanism relating more testing with saving lives). More sophisticated observers would use the crude and adjusted case fatality ratios to assess the pandemic evolution. However, international comparisons show that crude and adjusted case fatality ratios are highly heterogeneous and their use can be misleading (23, 24). For instance, the simple division of the cumulative number of deaths by the cumulative number of confirmed cases underestimated the true case fatality ratio in past epidemics (24, 25). Although nowadays many case fatality ratios have been estimated in this pandemic correcting many of the observed past biases (26–28), they are still depending on testing efforts made by countries.
The problem with heterogeneous case fatality ratios (different proportions of all cases that will end in death due to methodological differences on the denominator) is that they are not anchored at any exogenous information that allows researchers to perform international or territorial comparisons based on credible, and transparent assumptions. Consequently, to rely on the number of confirmed cases makes international comparations impossible since governments have shown to implement highly heterogeneous SARS-CoV-2 testing strategies ending up in different levels of location-based under-ascertainment.
In an attempt to solve the mentioned problem, we anchor our analysis in the cumulative number of deaths, which is a statistic much more difficult to alter, in free societies, than the number of SARS-CoV-2 tests2.
We use this information together with the newest and sound estimates of the age-stratified infection fatality ratios (IFRs) provided in the recent SARS-CoV-2 related literature. In particular, we base our analysis on the IFR of 0.657% reported in Verity et al. (26). This IFR is very close to the 0.75% reported in a meta-analysis of 13 IFR estimates from a wide range of countries, and that were published between February and April of 2020 (30). We also assume orthogonal attack rates of the infection which is also supported by recent literature (16). By weighting the age-stratified IFRs by the country population age-groups shares in each country, it is possible to obtain country-specific IFRs.
The relevance of this study is 3-fold: Firstly, the estimation of the true number of infections includes not only confirmed cases but COVID-19 undetected cases, as well as SARS-CoV-2-infected individuals without the disease, or in a pre-symptomatic stage. Therefore, to provide an estimation of the true number of SARS-CoV-2 infections is of more utility than to be only informed about the number of confirmed infections. This is because confirmed cases depend on the testing efforts that can be altered or even manipulated by governments. Moreover, one can compare the true estimate of infections with the number of COVID-19 patients that require hospitalization. Such ratios can contribute to predicting, with exogenous-to-government information, shortages of the health systems. Secondly, the estimation of the true number of SARS-CoV-2 infections allows us to estimate the detection rate of the infection, which is a measure of the performance of health systems and governments while facing the pandemic. One can expect that higher levels of detection of SARS-CoV-2 infections, which includes asymptomatic population, and those in their early stages of the infection (which are more infectious) can reduce the risk exposure of the susceptible population with relatively a high risk of death, that is, the elderly and those individuals with preexisting conditions (17). Accordingly, a highly neglected statistic, such as the detection rate should be considered highly relevant from the public health point of view. Thirdly, in this paper, we test the hypothesis that higher detection rates can save lives while providing a measure of this impact (having in mind that is preferable to be vaguely right than precisely wrong). Thus, this study aims to quantify the importance of testing while providing empirical support to the utility of implementing massive SARS-CoV-2 tests.
Overall, this study argues that it is crucial to compute the evolution of the cumulative number of estimated SARS-CoV-2 infected individuals, and subsequently, the cumulative detection rates. This information would provide public health managers and governments the incentives to improve detection rates, rather than to the opposite. Moreover, the identification strategy can be used at lower levels of aggregation, such as regions, provinces, and municipalities to improve responses to the pandemic, including the planning of selective lockdowns or spatial-selective enhancements of the installed critical care units.
In summary, this study proposes a baseline estimation of the number of SARS-CoV-2 infections and detection rates based on current information and transparent assumptions. However, the assumptions discussed later in this paper can be later modified to match the current scientific available evidence and country-specific developments and contexts.
Data and Methods
Data
For this research, we use the cumulative number of deaths and confirmed cases in the world and by country, published by OurWorldInData.org, a project of the Global Change Data Lab with the collaboration of the Oxford Martin Programme on Global Development at the University of Oxford3. Age-stratified demographic proportions of the population were obtained from the UN population data4. The age-stratified IFRs are those reported in Verity et al. (26)5. Our method also requires to know the distribution of the number of days between infection and death. Since this number is unknown, we approach to this number using the sum of the median incubation period as reported in Lauer et al. (31), and the mean number of days between the onset of symptoms and death as reported in Verity et al. (26). For our empirical exercise, we rely on World Development data by the World Bank (GDP per capita and health expenditure as a share of the GDP)6 and in World Health Organization data for BCG vaccination7.
In this study, our regression analysis relies on data for 91 countries covering above 86% of the world population. The remaining countries were excluded because they either do not have significant mortality figures (for instance Uruguay, Monaco, Bermuda, etc.), or full data.
Methods
Estimation Strategy
In this study, we rely on a very simple rationale. At a given point in time, the cumulative number of deaths should be a proportion of the cumulative number of infections somewhat in the past. But how many days in the past? The answer lies in the sum of the number of days of incubation and the number of days between the onset of symptoms and death. This rationale follows a report focusing on the 40 most-affected countries by the pandemic in the world (32). However, in this paper, we deviated from the mentioned report by using the key parameters in a different way, which translated into a different estimation of the number of infected individuals.
On average, deaths occur ~18 days (17.8 days with 95% credible interval [CrI] 16.9–19.2) after the onset of COVID-19 symptoms (26), while the incubation period of COVID-19 has been estimated in about 5 days (5.1 days with 95% CI, 4.5–5.8) as reported in Lauer et al. (31). Thus, by comparing the cumulative number of deaths at time t in country i (cdeaths(i, t)) with the country-specific infection fatality ratio (ifri), which is assumed constant over time, it is possible to obtain a rough approximation of the cumulative number of SARS-CoV-2 infections 23 days (18 days + 5 days) in the past (cinfected(i,t−23))8.
Additionally, we use the ratio between the cumulative number confirmed (detected) cases at time t−23 in country i (cconfirmed(i,t−23)) and the cumulative number of infected individuals (cinfected(i,t−23)) at time t−23 in country i as a rough measure of the cumulative rate of detection of SARS-CoV-2 infections at time t−23.
Infection Fatality Ratio
In order to estimate the country-specific infection fatality ratio for country i used in equation 1, we weight the age-stratified infection fatality ratios reported in Verity et al. (26), by the age-group population shares of country i. The calculation of the age-stratified infection fatality ratios relies on two assumptions that can be modified when producing point estimates of the number of individuals affected by a SARS-CoV-2 infection. Firstly, it assumes that there are no cross-country differences in the average overall health status of the population, comorbidity, or in the soundness of the different health systems. In absence of standardized country-specific information of these variables, this assumption is convenient although, at first sight, it can be considered a restrictive one. However, it is quite the opposite since, in richer countries with higher proportions of elderly populations, the estimated infection mortality ratios are likely to be overestimated. If so, our estimates of the infected population represent a lower limit of the true number of infections. The second assumption is that the attack rate of the coronavirus is unrelated to the age and sex of susceptible individuals. This is in concordance with the evidence in respiratory infections in previous pandemic processes (26, 33). Then, the distribution of IFRs across countries reflects the “fixed” lethality of the virus associated to a varying demographic structure of the population across the world.
Figure 1 presents the calculated infection fatality ratios for the world, and for 50 countries in which the lethality of the pandemic has been more significant.
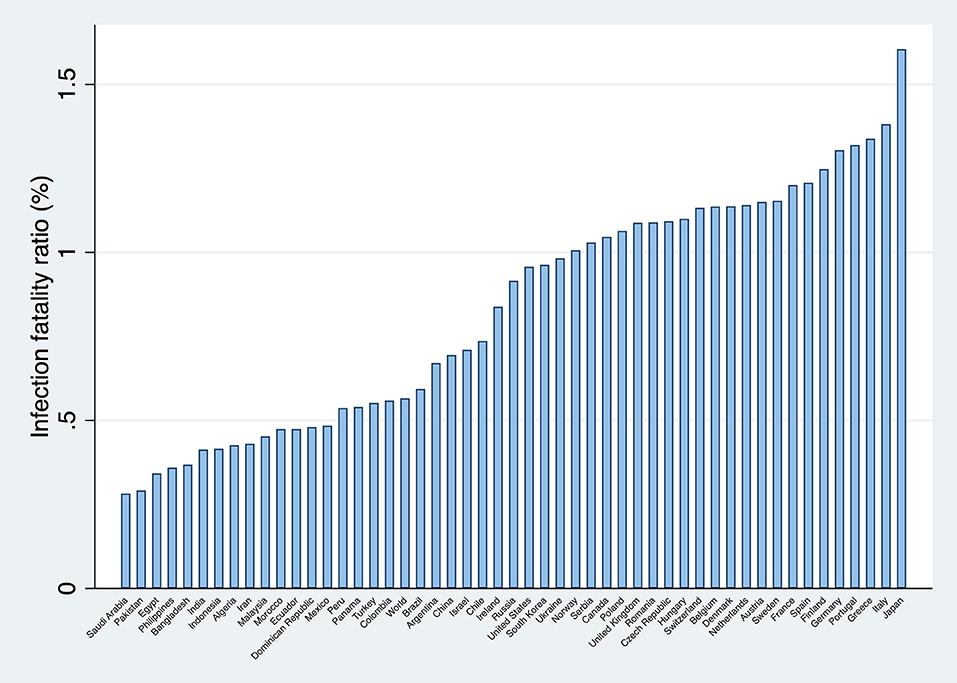
Figure 1. Infection fatality ratios (selected countries, in percentage). Source: Own elaboration.
Recently, a cross-sectional epidemiological study with a super-spreading event in the county of Heinsberg in Germany offered the opportunity to estimate the infection fatality ratio in the community (34). The estimated infection fatality ratio was 0.36%. Although this number is surprisingly low when compared with other estimations, for instance, the used in this study for Germany (1.3%), it is not evident that the true infection fatality ratio is closer to 0.36% rather than 1.3%. This is because there can be local factors that explain the discrepancy as pointed out in the Heinsberg study. Amongst these factors, it might be mentioned comorbidity gaps, ethnic differences, the quality and coverage of the health systems, climatic differences, immunization levels, etc.9.
Consequently, it might be necessary to assess the consequences of using an overestimated infection fatality ratio (that is, an IFR closer to the one reported in the Heinsberg study, or others inferred from seroprevalence data (36). The answer is that the number of infections would be underestimated, and that detection rates would be overestimated (since the infection fatality ratio is on the denominator). An overestimation of the detection rates reduces the validity of international rankings based on this figure. However, from the public health point of view, this would be irrelevant since, as discussed later, all countries should increase their detection rates of SARS-CoV-2 infections as much as possible.
Regression Analysis
To investigate whether improving the detection rates of SARS-CoV-2 infections is potentially associated to save lives, we use a parsimonious synchronic cross-country multiple linear regression10. That is, we use the information reported 15, 60, and 105 days after the confirmation of the first 100 SARS-CoV-2 infections, which corresponds to the pandemic outbreak (PO). At a given pandemic phase, we regress the natural logarithm of the cumulative number of deaths in country i, ln(deathsi), on their estimated detection rates (DRi) and its squared to assess whether there is a non-linear relationship of this conditional correlation11.
The four parsimonious regressions have a demographic control that corresponds to the estimated country-specific infection fatality ratio (ifri). This is a non-endogenous control since it only captures the impact of demography (population shares by age-groups) on the number of deaths and not the reverse. The regressions control for the population size of the country i in its natural logarithmic form ln(popi). This control is necessary because the share of the susceptible population remains persistently at relatively higher levels in more populated countries when compared with the less populated ones. We also include the natural logarithm of the number of confirmed SARS-CoV-2 infections in each country ln(confirmedi). This is a measure of the persistence of the mortality process while controlling for cross-country differences in their absolute testing performances. The regressions also control for the economic performance of a country by means of the natural logarithm of the per capita gross domestic product ln(gdppci)12. We also include the current health expenditure as share of GDP in 2017 (healthsharei). This control is needed to account for relative resource-dependent differences in the coverage/quality of the health systems around the globe. Finally, we use available data to explore a possible association between BCG vaccination and aggravated cases of COVID-19, and deaths [a relationship which is being investigated in some clinical trials (37)]13. The evidence is still inconclusive because the argued existence of uncontrolled confounders (38–42). However, if these confounders exist, they can bias the relationship between SARS-CoV-2 detections rates and the cumulative number of deaths. Based on this argument, we include a raw of dummies capturing the degree of BCG vaccination coverage as follows: BGC group 1: no mandatory vaccination (up to 49.9% coverage), BGC group 2: 50 to 79.9% coverage, BGC group 3: 80 to 89.9%, BGC group 4: 90 to 98.9%, and BGC group 5: 99 to 100%. The reference category is BCG group 1.
Robustness
An alternative approach is used to indirectly investigate the conditional association between detection rates and SARS-CoV-2 related deaths. Instead of using the detection rates and its square, we use the natural logarithm of the estimated number of infections ln(infectionsi) while dropping from the equation the natural logarithm of the number of confirmed (detected) SARS-CoV-2 infections as follows:
Regarding the statistical inference, significance tests rely on a heteroscedasticity consistent covariance matrix (HCCM) type HC3 which is suitable when the number of observations is small (43). Although in the presence of heteroscedasticity of unknown form, Ordinary Least Square estimates are unbiased, the inference can be misleading due to the fact that the usual tests of significance are generally inappropriate (43).
Additionally, we estimate the same set of equations (the main specification and the robustness specification 15, 60, and 105 days after the pandemic outbreak) using robust regressions. We do this because we have the concern that parameter estimates may be biased if, in some countries (outliers), the report of the cumulative number of deaths has been involuntarily altered or even manipulated. Robust regression resists the effect of such outliers, providing better than OLS efficiency when heavy-tailored error distributions exist as it can be likely the case (44).
Results
Descriptive Analysis
On July 20, the estimated infected population reaches about 160 million individuals (Figure 2A). This number is about 19 times larger than the reported number of confirmed cases (about 8.6 million represented by the dashed line). Note that the number of infections is estimated based on detection rates calculated 23 days in the past. Thus, for the period t−23 to t, the number of SARS-CoV-2 infected individuals are estimated using the estimation rate as in t−23. Therefore, the estimation of SARS-CoV-2 infected individuals can be biased if detection rates deteriorate or improve considerably within this time span.
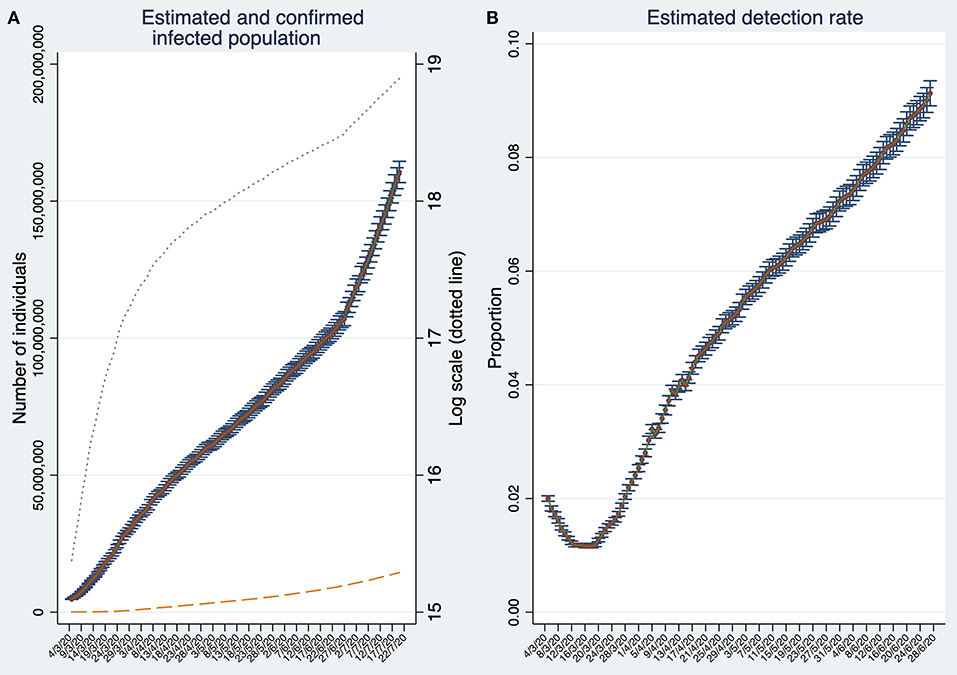
Figure 2. Estimates of the number of SARS-CoV-2 infections and the estimated detection rate in the World. (A) Estimated and confirmed infected population. (B) Estimated Global detection rate. Note that (B) depicts the detection rates until t−23. Both panels display 95% confidence intervals. Source: Own elaboration.
The accuracy of our estimations can be assessed by contrasting them against to those provided by population-based seroepidemiological studies. There are some studies of this type focusing on restricted geographical areas, for instance, in Germany and Switzerland (34, 45). However, to the best of our knowledge, there is only one country level and large scale population-based seroepidemiological study performed in Spain (46). The ENE-COVID study in Spain finds that, on 11 May, 5% of the population would test IgG positive against SARS-CoV-2. It implies that about 2.35 million individuals were infected by SARS-CoV-2. Similarly, in our study we estimated on 11 May an infected population of about 2.25 million individuals. This evidence suggests that our method can be a suitable alternative when population-based seroepidemiological studies are not available, which is frequently the case. Here, it is important to recognize that, from the public health point of view, it is preferable to be vaguely right than precisely wrong. On 11 May, Spain confirmed only 246,504 cases (about 10% of all estimated infections). At that time, it would have been convenient that public health authorities and the public opinion would have the information that, for each confirmed case, there were significantly much more individuals spreading the infection in unpredictable ways.
Back to the global estimates, by comparing the cumulative number of estimated infections with the cumulative number of confirmed (detected) cases, we obtain, at the end of June 2020, a global detection rate of about 9% (Figure 2B). The global detection rate curve shows an U-shape with a minimum at the beginning of the third week of March reaching only 1.1%. The last data suggest that detection rates are steadily increasing. Moreover, the semi-logarithmic plot in Figure 2A suggests that the infection stopped spreading at its maximum pace approximately during the third week of March, but unfortunately, it increased its speed again around the last week of June.
The world distribution of the number of deaths, the estimated number of SARS-CoV-2 infections, and the detection rates of SARS-CoV-2 infections across the world are displayed in Figures 3–5, respectively.
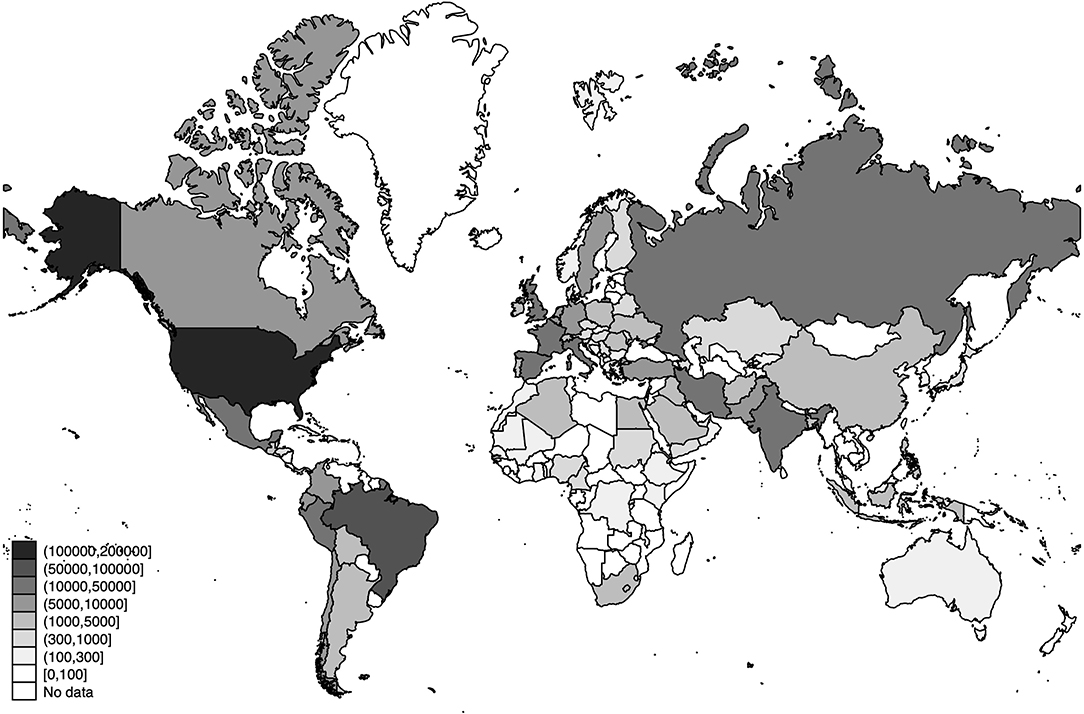
Figure 3. World distribution of deaths as of 20 July 2020. Source: Own Elaboration.
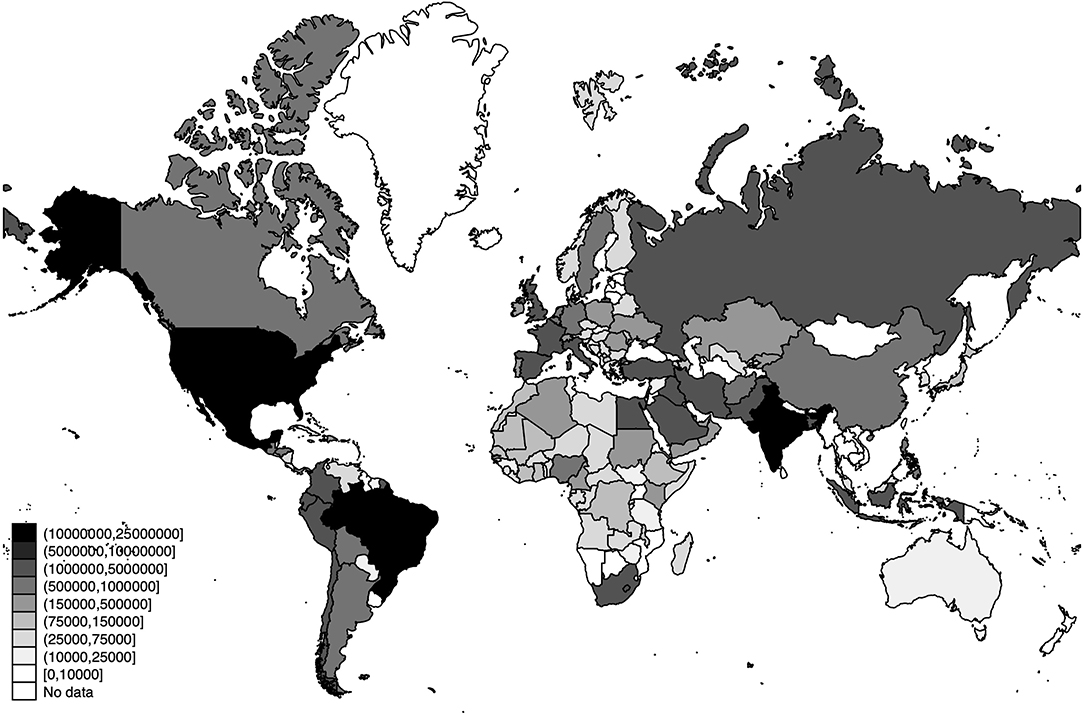
Figure 4. World distribution of the estimated number of SARS-CoV-2 infections as of 20 July 2020. Source: Own Elaboration.
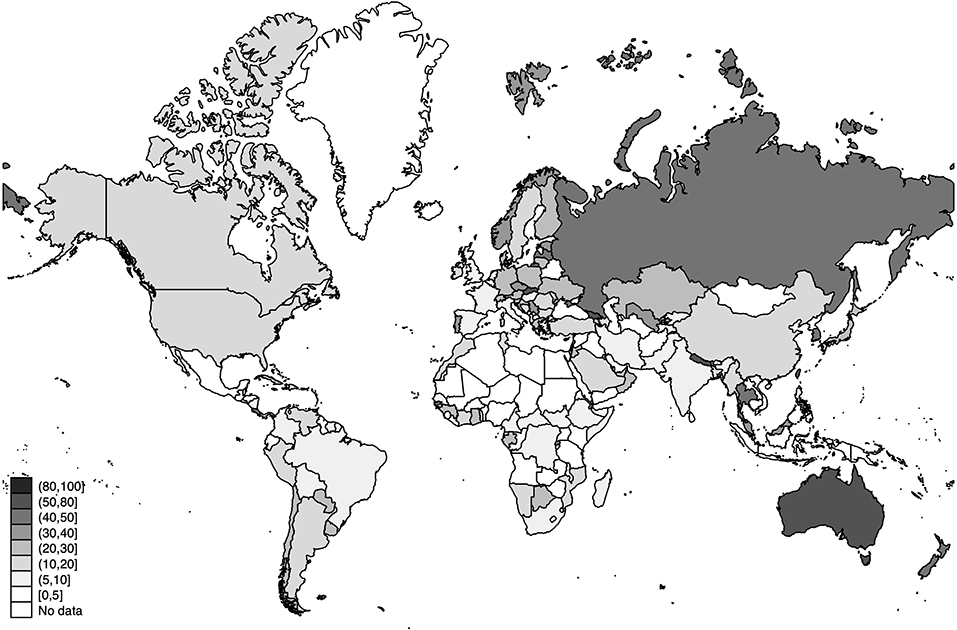
Figure 5. World distribution of the estimated detection rates of SARS-CoV-2 infections as of 20 July 2020 (in percentage). Source: Own Elaboration.
Since the global estimates are no more than an aggregation of the trajectories made by the different countries in the world, we investigate how heterogeneous the detection rates across countries are. Table 1 presents this information in a synchronic way. The rankings compare countries in the same phase of their respective pandemic processes, that is after 15, 30, 45, 60, 75, and 90 days after the confirmation of the first 100 SARS-CoV-2 infections (pandemic outbreak). This approach allows us to perform such an international comparison.
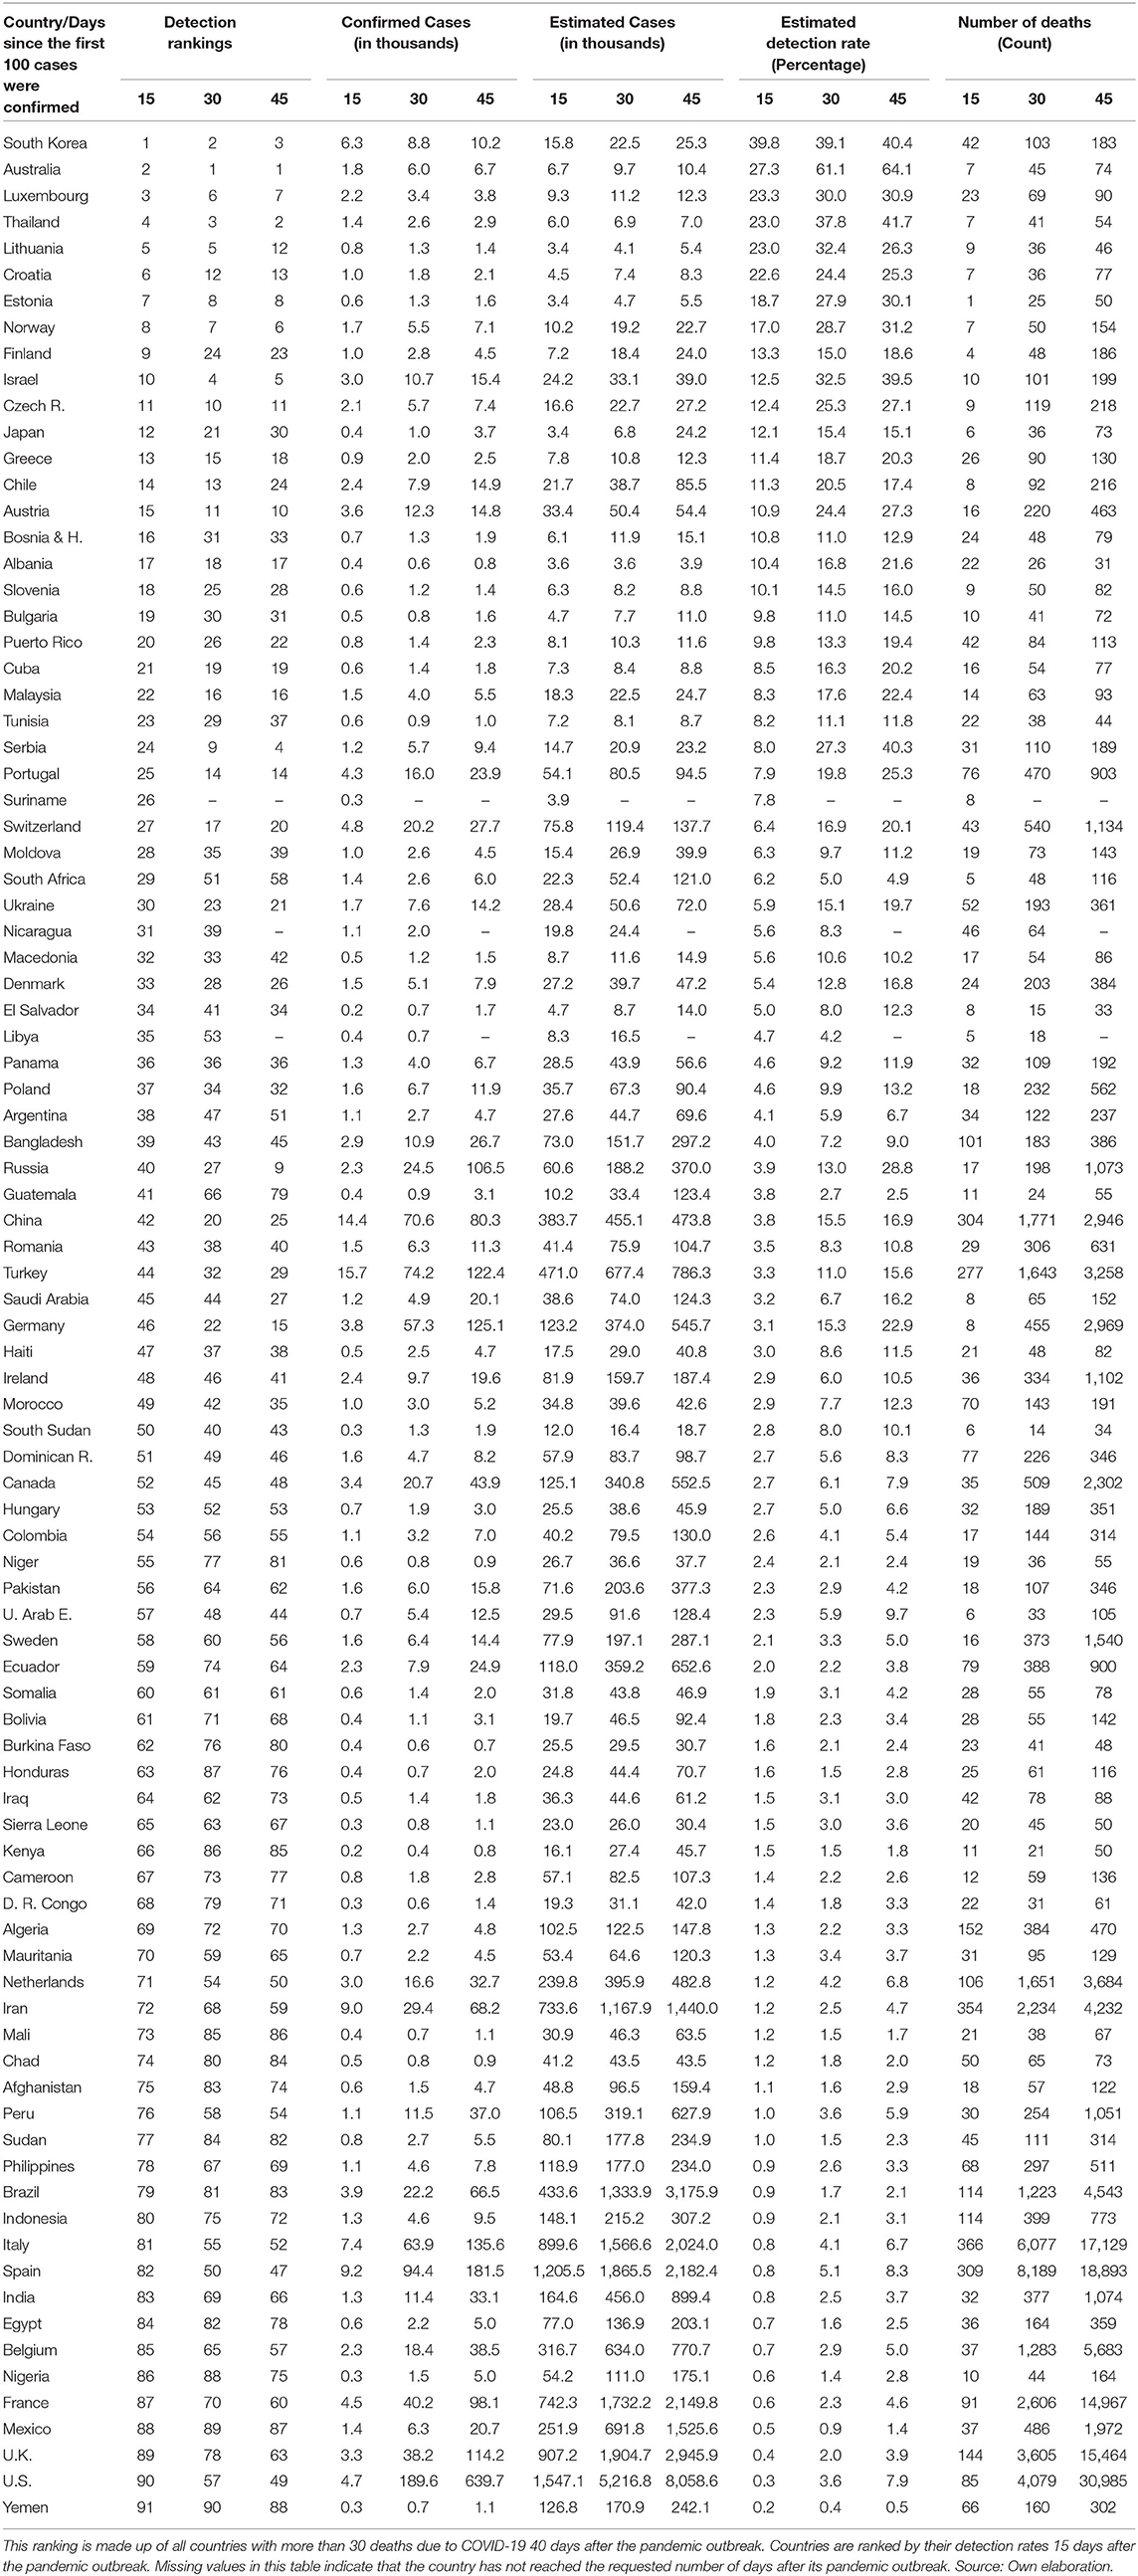
Table 1A. Synchronic descriptive statistics (15, 30, and 45 days after the pandemic outbreak).
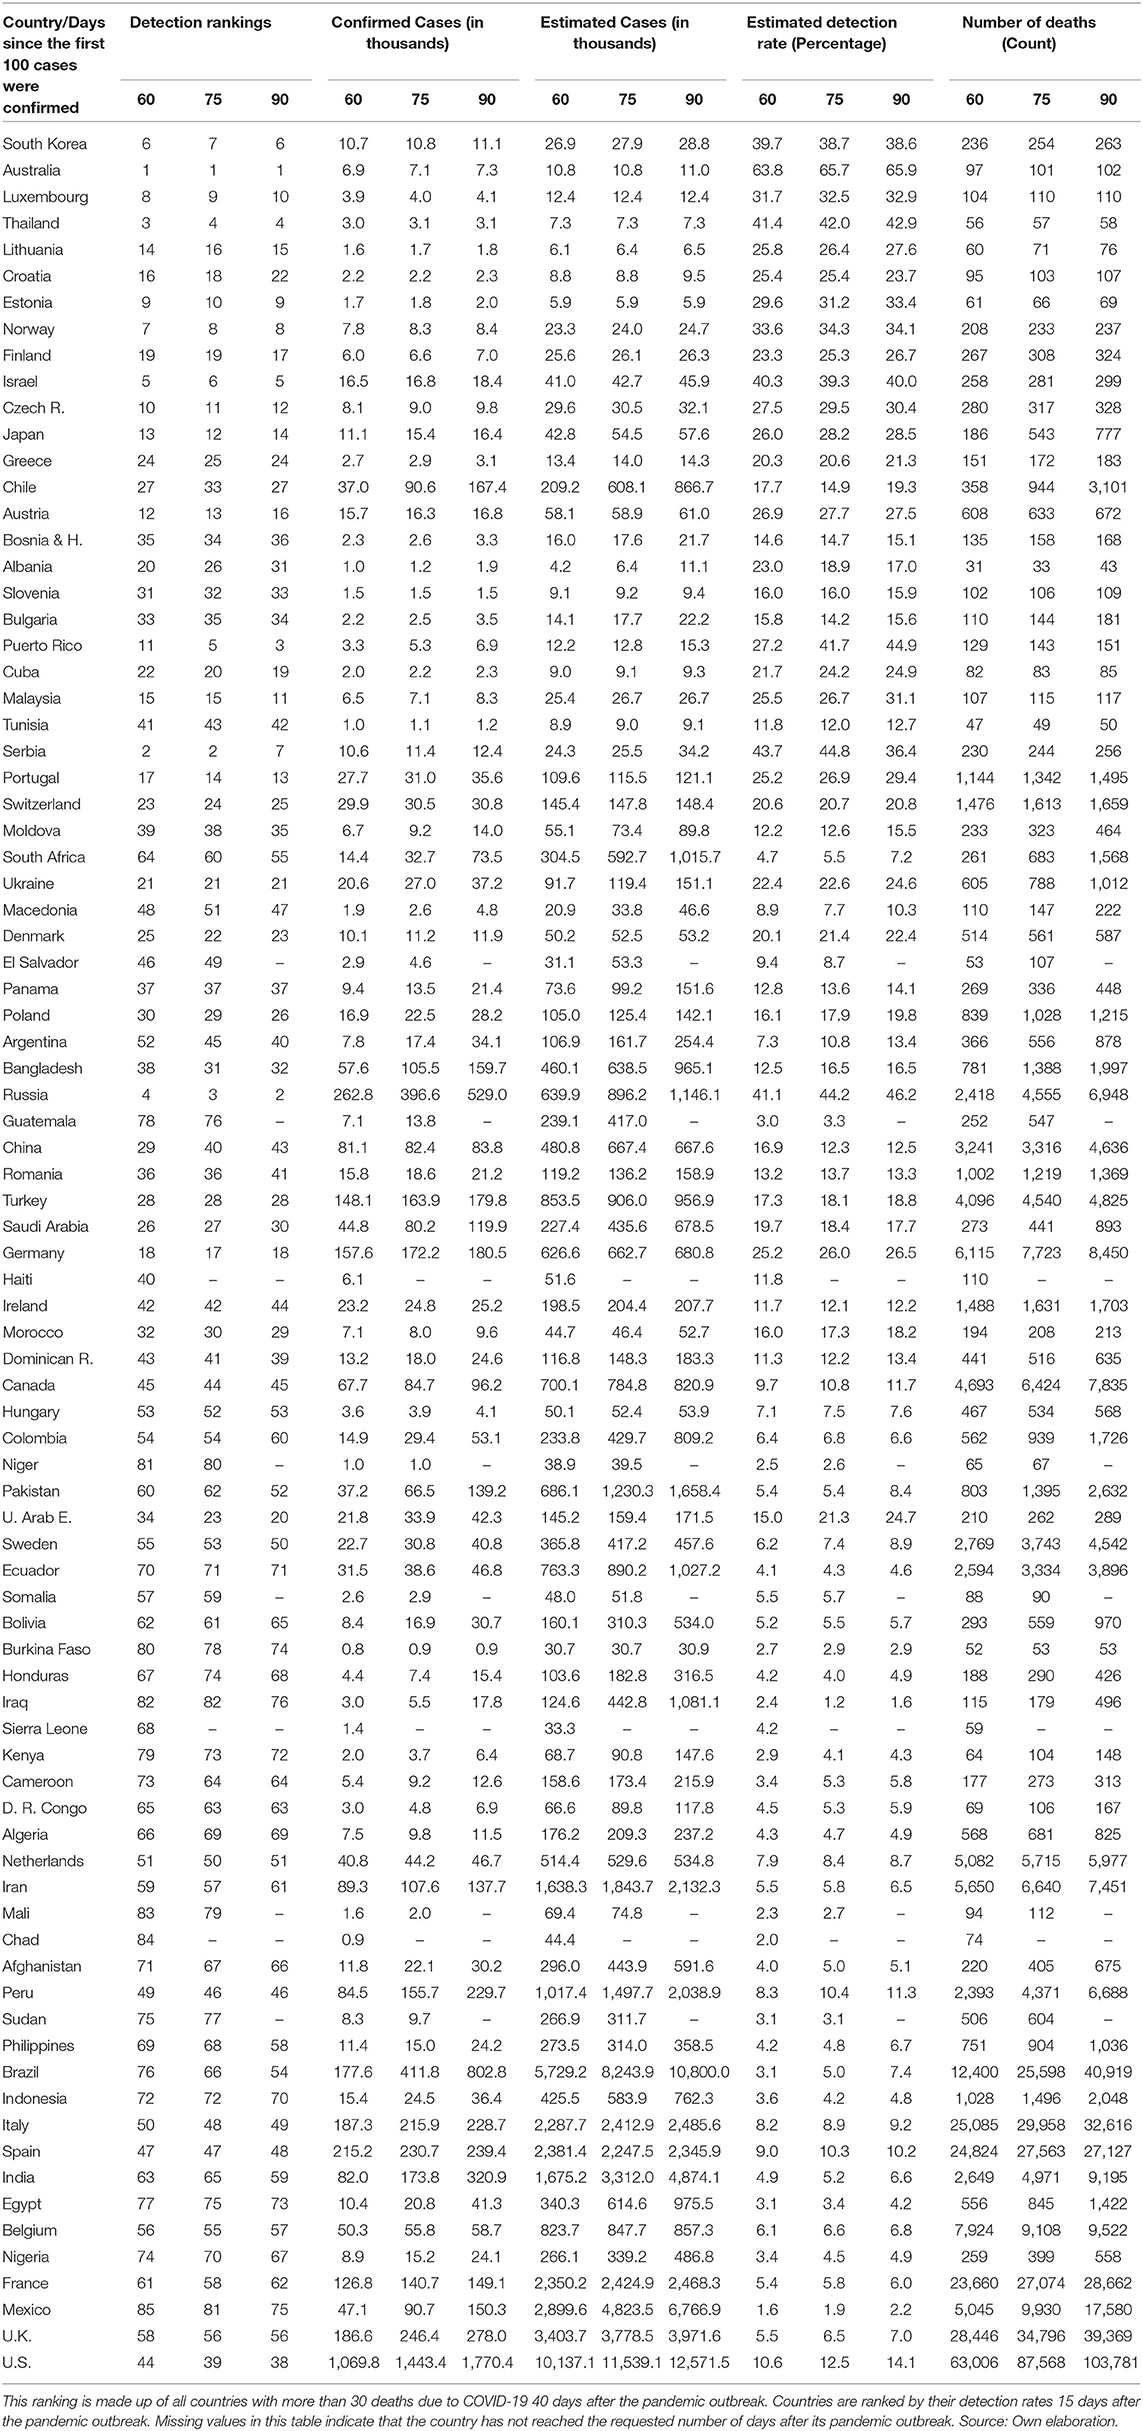
Table 1B. Synchronic descriptive statistics (60, 75, and 90 days after the pandemic outbreak).
At a first sight, it is noteworthy the fact that each of the first 24 countries ranked on the top by the initial detection rate (15 days after the beginning of the pandemic outbreak) does not accumulate more than 500 deaths 45 days after initiating their pandemic processes. Thus, it seems to exist a strong correlation between detection rates and the cumulative number of deaths for a given stage of the pandemic process. Countries with high counts of deaths ranked very badly in their initial detection rates. For example, the US, Spain, Italy, UK, France, and Belgium ranked in place 90, 82, 81, 89, 87, and 85, out of 91 countries listed in the ranking.
A second conclusion is that the relative improvement of detection rates over time, that is, 30, 45, 60, 75, and 90 days after the beginning of the pandemic processes, does not alter the fact that those countries are still ranked the worst in terms of deaths. That is, improving detection over time has declining returns to scale when comes to save lives.
The depicted relationship between detection rates and the cumulative number of deaths remains almost unchanged when using non-synchronic data as of 20 May in Table 2. This table mixes information of countries at different stages from their pandemic processes. So, it must be interpreted with caution. Although efforts to increase detection have been significative in the above-mentioned countries, none of them is still ranked on the top part of the ranking with 91 countries for which we have full data (US in ranking 36, Spain 45, Italy 46, Belgium 55, UK 56, and France in place 58). Similarly, in this non-synchronic ranking, with the exception of Russia, none of the first 10 countries accumulated more than 500 deaths on May 20.
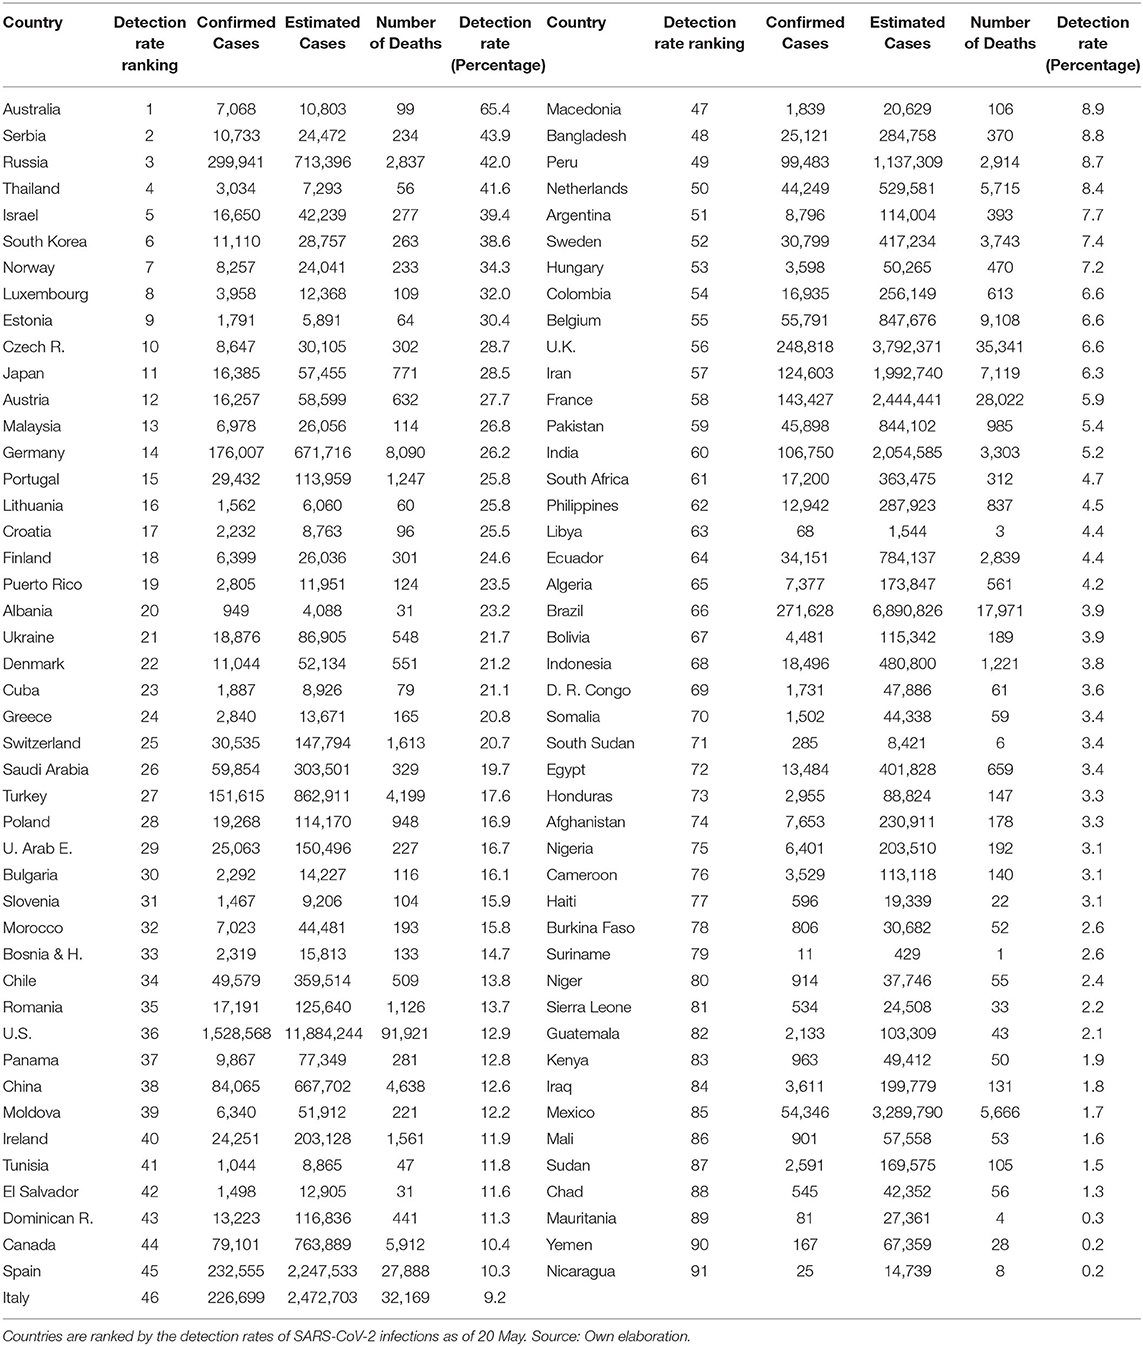
Table 2. Non-synchronic descriptive statistics as of 20 May.
In Table 3, we present the non-synchronic ranking as of 22 June. The US is in place 35, Spain 49, Italy 53, Belgium 63, UK 61, and France 67. It is noteworthy that, except for Russia, none of the first 16 countries in this ranking have accumulated more than 2,000 fatalities on 22 June. More importantly and despite the incredible efforts to increase the tests amongst the more developed countries, none of them were able to detect more than 16% of the estimated infections (the US detected 15.7% on 22 June). It implies that testing efforts need to be deployed at the first stages of the pandemic process due to its cumulative nature. Tables 2, 3 show that moving over time from relatively low to relatively high cumulative detection rates is unlikely and probably very expensive. This is due to the over proportional efforts needed to expand testing relative to the exponentially growing infections at the early stages of the pandemic. Consequently, from the public health point of view, it is much more advantageous, technically, and economically feasible, to implement mass testing from the very beginning of the pandemic process. To achieve this goal, health authorities and governments would require understanding the linkages between the cumulative detection rates and the minimization of the pandemic related fatalities and economic damage.
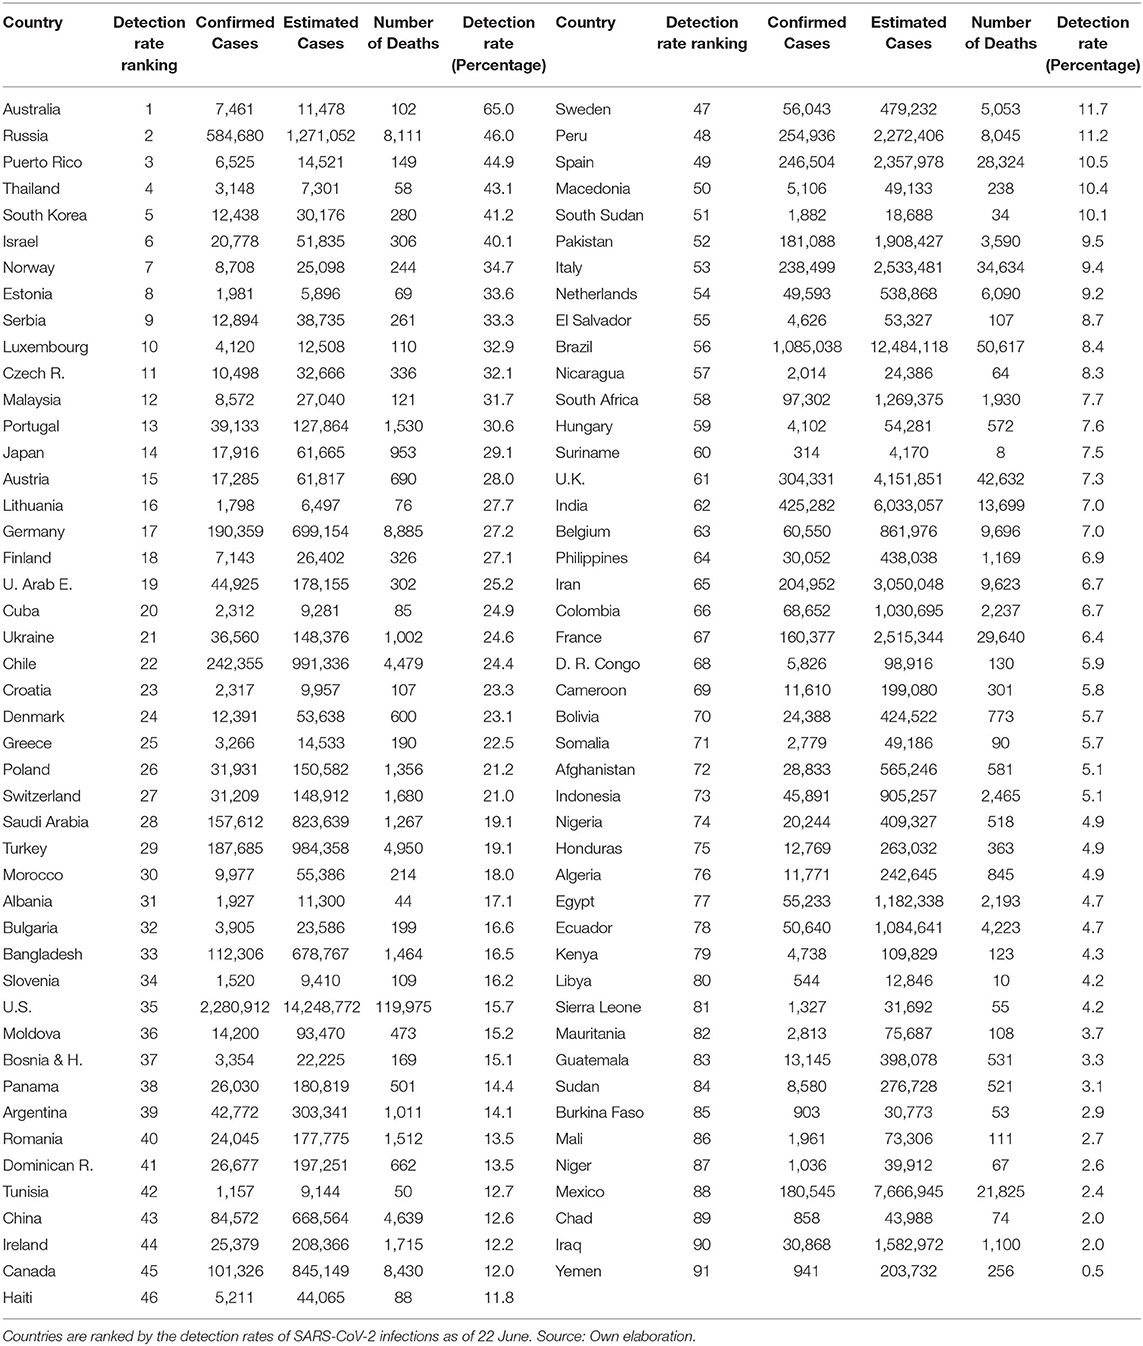
Table 3. Non-synchronic descriptive statistics as of 22 June.
Unconditional Analysis
In this analysis, we show the unconditional relationship between detection rates and deaths. The fitted lines in Figure 6 are obtained after regressing the natural logarithm of the cumulative number of deaths in the country i on their estimated cumulative detection rates (DRi). The results strongly suggest a negative relationship between detection rates and the cumulative number of deaths. This strong negative slope is in concordance with the hypothesis that, by detecting a higher proportion of the SARS-CoV-2 infected population, many lives can be saved, in particular, the lives of the elderly and those individuals with preexisting conditions.
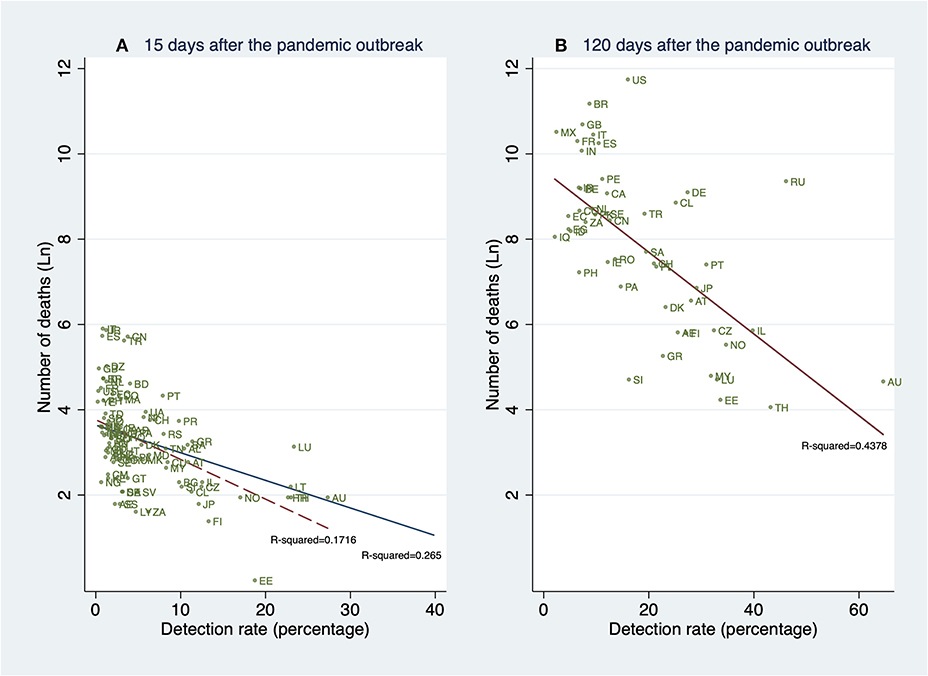
Figure 6. Linear prediction for the natural logarithm of the cumulative number of deaths from a linear regression of ln(deathsi) on the detection rates (DRi) 15 and 120 days after the pandemic outbreak (PO). (A) Detection rates and deaths 15 days after the PO. (B) Detection rates and deaths 120 days after the PO. (A) contains all 91 countries (in Table 1A). (B) contains all 61 countries (in Table 1A) whose pandemic processes have more than 120 days since the PO. The dashed fitted line excludes South Korea (KR). Source: Own elaboration.
The strong association between the number of deaths and the estimated cumulative detection rates remains significant 15, and 120 days after the PO. These associations are shown in Figures 6A,B, respectively.
Figure 7 shows the relationship between detection rates (15 and 120 days after the PO) and deaths 120 days after the PO. This descriptive result is of interest since it suggests that, unconditionally, early detection is associated with death outcomes 120 days after the PO to a greater extent than the contemporary detection rates, that is, 120 days after the PO.
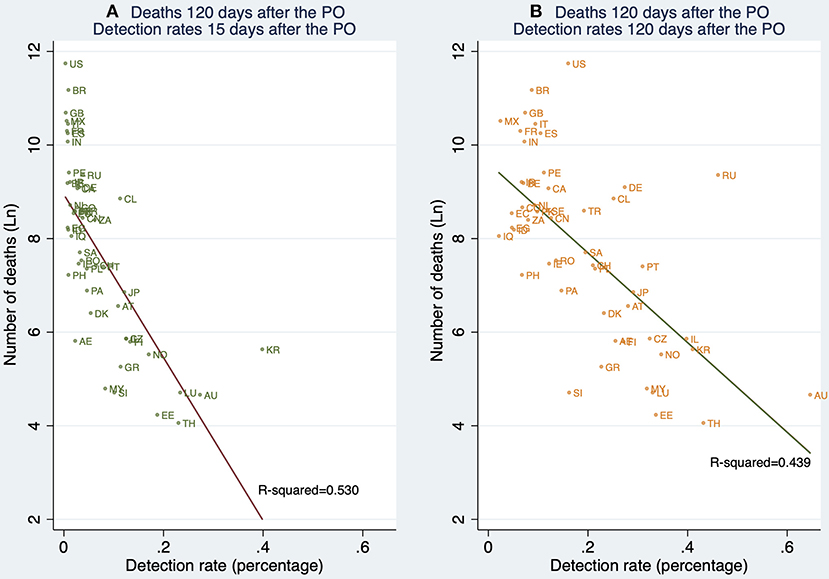
Figure 7. Linear prediction for the natural logarithm of the cumulative number of deaths 120 days after the pandemic outbreak (PO) from a linear regression of ln(deathsi) on the detection rates (DRi) 15 and 120 days after the PO. (A) Deaths reported 120 days after the PO, and detection rates estimated 15 days after the PO. (B) Deaths reported 120 days after the PO, and detection rates 120 days after the PO. Note: This figure contains all 61 countries (in Table 1A) whose pandemic processes have more than 120 days since the pandemic outbreak. Source: Own elaboration.
Although this information suggests the existence of a strong relationship between detection rates and the cumulative number of deaths, this slope may be confounded by the variables mentioned before. Thus, in the next section, we show the results of our conditional analysis as described earlier.
Multivariate Regression Analysis
Our results in Table 4 show that higher detection rates are associated with a reduction in the number of deaths after controlling for demography (age-structure of the population and population size), economic performance (GDP per capita), and the relative resources that the economies devote to their health systems. Over time, the cross-sectional regressions increase in explanatory power, from a R-squared of 0.71 in model 2 to 0.95 in model 8.
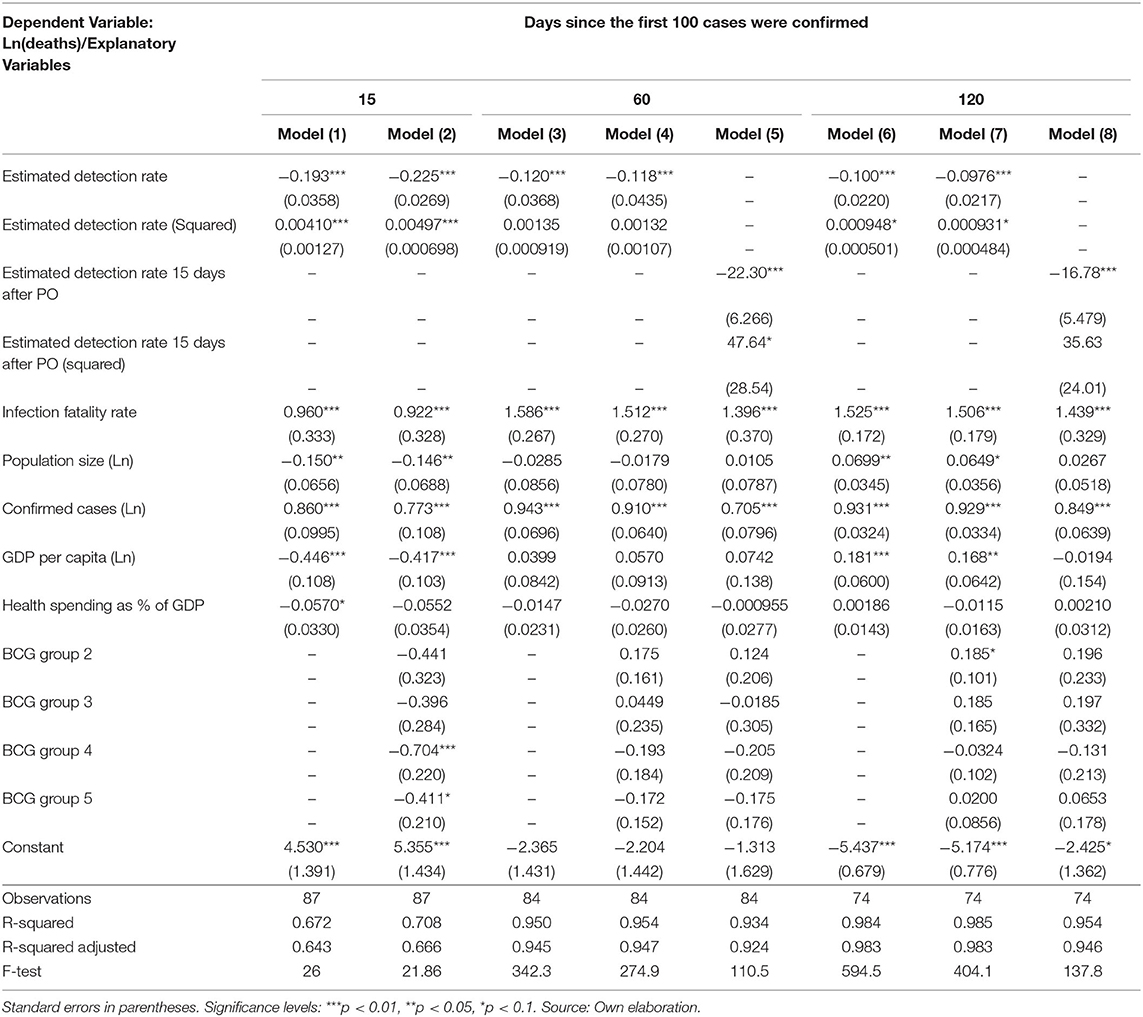
Table 4. Synchronic multiple linear regression of the natural logarithm of the cumulative number of deaths on the estimated detections rates.
Based on these results, Figure 8 shows a strong conditional gradient between detection rates and the cumulative number of deaths. For instance, for a hypothetical country with average and constant endowments, the cost in terms of deaths of detecting 5% vs. 35% is about 1.81 natural logarithm points which corresponds to exp1.81 = 6.13. That is, the average country detecting 5% is associated with a number of deaths about 6.1 times higher when compared with the same country detecting 35% of all SARS-CoV-2 infections.
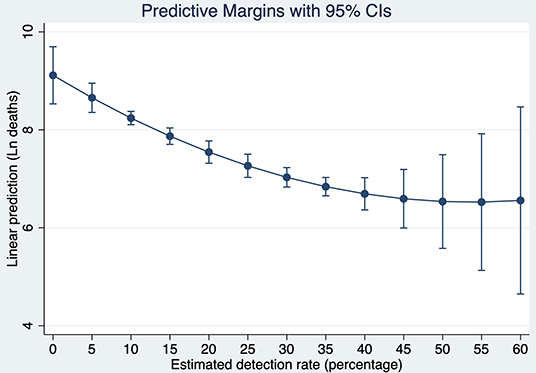
Figure 8. Predictive Margins of the cumulative number of deaths at different detection rates of SARS-CoV-2 infections after 120 days of the pandemic outbreak. Source: Own elaboration.
To put this result in perspective, let us simulate what would be the number of deaths in the U.S., if instead of detecting 16.02% 120 days after the pandemic outbreak, the country would have detected with the same intensity as South Korea (41.01%). Evaluating the number of deaths at the endowments of the U.S, the country would have fewer deaths by 1.14 natural logarithm points. It means that the current U.S deaths are now 3.13 times higher than they would be if the country would have tested with similar intensity as South Korea. Since the number of deaths 120 days after the pandemic outbreak reached 126,140, detecting at the rate of South Korea would have saved about 85,794 lives in the U.S. at that time.
Finally, looking at the regression coefficients in Table 3, it is noteworthy the fact that during the pandemic outbreak, a 1% higher detection rate is associated with more lives saved than a 1% increase in the health expenditure over the GDP. Our results also suggest that the number of deaths, rather than depending on the relative solvency of the health system, could depend in a greater extent on the size and opportunity of the testing efforts.
The conclusion is the more tests the better. Although in this study we employed an economics inspired approach to figure out the importance of testing, our findings are also endorsed by recent medical literature on coronavirus as well as by another economics inspired models providing support to a causal relationship between detection and saving lives (47–50).
Robustness of the Results
Robust regressions provide estimates that are close to the ones reported in Table 4. Consequently, it is unlikely that the results reported in this study are outlier driven. Additionally, results are robust to heteroscedasticity of unknown form for small samples. Nevertheless, results should be interpreted with caution. The few observations available for the regressions and lack of data does not allow to rule out the possibility that there are omitted variables that have the potential to bias the results.
It is important to keep in mind that results can be biased if omitted variable problem exists. That is, there are variables that are correlated with the explained outcome but at the same time they are also correlated with the explanatory variables of interest. For instance, one can think in countries implementing lockdowns because lower detection rates (Argentina), or relaxed social distancing rules because higher detection rates (Australia). Nevertheless, these non-observed variables yield to an underestimation of the true association between detection rates and the cumulative number of deaths. Thus, detection matters.
Discussion
In this study, we have proposed a method to estimate the number of SARS-CoV-2 infections for the globe and also for all 91 major countries covering more than 86% of the world population. On June 22, we find that, worldwide, about 160 million individuals have been infected by SARS-CoV-2. Moreover, only about 1 out of 11 these infections have been detected. We find that detection rates are very unequally distributed across the globe and that they also increased over time from about 1% during the second and third weeks of March to about 9% on June 22. In an information context in which population-based seroepidemiological studies are not available, this study shows a parsimonious alternative to provide estimates of the number of SARS-CoV-2 infected individuals. By comparing our estimates with those provided by the ENE-COVID study in Spain, we confirm the utility of our approach keeping in mind that from the public health point of view, it is preferable to be vaguely right than precisely wrong.
In order to provide reliable estimates of the number of SARS-CoV-2 infections and of the cumulative detection rates, it is necessary that governments provide real-time information about the number of COVID-19 deaths. This study supports the view that an accurate communication of the fatality cases can have consequences on the development of the pandemic itself. Thus, it is also a call for allowing international comparison following WHO international norms and standards for medical certificates of COVID-19 cause of death and International Classification of Diseases (ICD) mortality coding.
Additionally, in our empirical analysis, we have presented parsimonious evidence, that higher detection rates are associated with saving lives. Our conditional analysis shows, for example, that if the US would have had the same detection rate trajectory as South Korea, about two-thirds of the reported deaths could have been avoided (about 85,000 lives).
We find that detection rates at the very early stages of the pandemic seem to explain the great divergence in terms of deaths between countries. Moreover, we showed evidence that moving from relatively low to high cumulative detection rates (and thus saving lives) is unlikely and difficult. This is probably due to the high level of efforts needed to expand testing relative to the exponentially growing infections at the early and middle stages of the pandemic. Thus, from the public health point of view, it is better to deploy testing efforts at the first stages of the pandemic process. To do this would be much more advantageous, in terms of saved lives, but also it would be technically, and economically feasible.
Already, many developed countries with well-developed health sectors were not able to avoid unnecessary deaths by their inaction in terms of promoting mass testing to counter the pandemic outbreak at early stages.
To achieve the goal of implementing mass testing from the very beginning of the pandemic outbreak, governments need to understand the consequences of not doing that. Thus, the evidence presented in this paper offers a rigorous macro-level linkage between detection rates and the cumulative number of deaths which may be useful in future pandemics. This evidence also supports the implementation of mass testing in the likely coming secondary pandemic outbreak (so-called second waves).
Further research should be devoted to understanding why the detection capacity in many advanced countries was too weak, late, and also so weakly correlated (if correlated) with the income levels. In this paper, we claim that governments have incentives against test because the public opinion tends to primarily react to the report of the cumulative and the marginal numbers of detected (reported) cases. The contradiction is that something good, such as the increase in the testing efforts by governments, can be perceived by the general public as something negative (due to the increase in detections). In consequence, are low detection rates in developed countries simply a management failure, or are there long-run incentives that promoted this behavior among many rich countries? It is clear that during the ongoing pandemic, improving detection rates is a race against time, but are there institutional and/or technological constraints that hamper detection improvements that can save lives? All these questions are relevant for this and future pandemics. This study claims that all countries in the world should be able to respond to a pandemic outbreak with massive testing in the very short run. This would be an efficient approach since it is also likely that higher detection rates are also associated with a lesser impact of the pandemic on the economy.
Data Availability Statement
The raw data supporting the conclusions of this article will be made available by the authors, without undue reservation.
Author Contributions
CV conceived this research, performed the background work, collected the data, performed all statistical analyses, and wrote the paper.
Conflict of Interest
The author declares that the research was conducted in the absence of any commercial or financial relationships that could be construed as a potential conflict of interest.
Acknowledgments
The author would like to thank and acknowledge Dr. Carlos Chavez for comments of a very early version of this paper. I would also like to thank M.Sc. Andrea Torres for their comments on the implications of this research. The author also would like to recognize the suggestions and comments provided by the participants at the Doctoral Seminar at Facultad de Economía y Negocios, Universidad de Talca.
Supplementary Material
The Supplementary Material for this article can be found online at: https://www.frontiersin.org/articles/10.3389/fpubh.2020.00489/full#supplementary-material
Supplementary Set of Figures. Estimated number of SARS-CoV-2 infections by country.
Supplementary Table 1. Synchronic multiple linear regression of the natural logarithm of the cumulative number of deaths on the estimated detections rates (linear specification).
Supplementary Table 2. Synchronic multiple linear regression of the natural logarithm of the cumulative number of deaths on the estimated number of SARS-CoV-2 infections.
Supplementary Table 3. Synchronic robust multiple linear regression of the natural logarithm of the cumulative number of deaths on the estimated detections rates (linear specification).
Supplementary Table 4. Synchronic robust multiple linear regression of the natural logarithm of the cumulative number of deaths on the estimated detections rates (non-linear specification).
Supplementary Table 5. Synchronic multiple linear regression of the natural logarithm of the cumulative number of deaths on the estimated number of SARS-CoV-2 infections.
Footnotes
1. ^Some evidence has been found claiming that elderly and male individuals are in higher relative risk since the consequences of COVID-19 are more severe amongst them (16–20).
2. ^Death-related statistics are nor free of problems. It is recognized that not all deaths due to COVID-19 in all countries are reported following WHO international norms and standards for medical certificates of COVID-19 cause of death and International Classification of Diseases (ICD) mortality coding (29). Moreover, in many countries, there is controversy over whether the COVID-19 death figures are reliable or not (for instance in Spain, Chile, and the UK), especially when these figures are compared against those from the number of excess deaths during the pandemic. More generally, it is a matter of concern that the official accumulated death figures show significant breaks responding probably to counting issues rather than to real deaths' dynamics. In our data, these breaks can be found in Spain, Chile, China, Ecuador, the Philippines, and the United Kingdom.
3. ^Available online at: https://ourworldindata.org/coronavirus-source-data
4. ^United Nations, Department of Economic and Social Affairs, Population Division. World Population Prospects 2019, Online Edition. Rev. 1. United Nations (2020). Available online at: https://population.un.org/wpp/Download/Standard/Population/ (accessed April 19, 2020).
5. ^Following Verity et al. (26), the estimated IFRs correct for many types of bias. The infection fatality ratios were obtained after combining adjusted case fatality ratios with data on infection prevalence amongst individuals returning home from Wuhan in repatriation flights.
6. ^https://data.worldbank.org/indicator/ (accessed April 24, 2020).
7. ^https://apps.who.int/gho/data/node.main.A830?lang=en (accessed April 24, 2020).
8. ^Differently to Bommer and Vollmer (32), we include the incubation period while avoiding the subtraction of the number of days between the onset of symptoms and detection to the relevant lag period. These differences explain the discrepancies between both set of estimates. Moreover, by combining the cumulative distribution function of the SARS-CoV-2 incubation period as reported in Lauer et al. (31) and an approximation of the Gamma distribution with correction for epidemic growth of the days between the onset of symptoms to death as reported in Verity et al. (26), one can calculate a vector of probabilities to weight the cumulative number of deaths required in equation 1. The weighting vector goes from t−2 (representing the proportion of deaths of those who experienced 1 day between infection and the onset of symptoms, plus one day from the onset of symptoms to death) to t−72 (representing the proportion of deaths of those who experienced 12 days between infection and the onset of symptoms and 60 days between the onset of symptoms to death). The smoothed approach produces almost an identical estimation of the cumulative number of infected individuals. Given that and for the sake of simplicity, we prefer to use the non-smoothing approach.
9. ^For instance, the reported IFRs for a group of 9,496 Danish blood donors with no comorbidity aged 17–69 reached 0.082% (35).
10. ^In the context of the pandemic, a synchronic estimation refers to the use of information of countries in the same pandemic phase, that is, after the same number of days since the pandemic outbreak. On the contrary, a non-synchronic estimation neglects the pandemic phases but considers as reference period the calendar day.
11. ^Output tables without the square of the detection rates are available in the Supplementary Material.
12. ^In constant 2017 international dollars with the same purchase power.
13. ^https://apps.who.int/gho/data/node.main.A830?lang=en (accessed April 24, 2020).
References
1. Li R, Pei S, Chen B, Song Y, Zhang T, Yang W, et al. Substantial undocumented infection facilitates the rapid dissemination of novel coronavirus (SARS-CoV2). Science. (2020) 493:489–93. doi: 10.1126/science.abb3221
2. Jombart T, van Zandvoort K, Russell T, Jarvis C, Gimma A, Abbott S, et al. Inferring the number of COVID-19 cases from recently reported deaths. Wellcome Open Res. (2020) 5:78. doi: 10.12688/wellcomeopenres.15786.1
3. Lourenco J, Paton R, Ghafari M, Kraemer M, Thompson C, Simmonds P, et al. Fundamental principles of epidemic spread highlight the immediate need for large-scale serological surveys to assess the stage of the SARS-CoV-2 epidemic. medRxiv. (2020) 2020.03.24.20042291. doi: 10.1101/2020.03.24.20042291
4. Thorpe DG, Lyberger K. Estimating the number of SARS-CoV-2 infections in the United States. medRxiv. (2020) 2020:04.13.20064519. doi: 10.1101/2020.04.13.20064519
5. Flaxman S, Mishra S, Gandy A, Unwin HJT, Mellan TA, Coupland H, et al. Estimating the effects of non-pharmaceutical interventions on COVID-19 in Europe. Nature. (2020) 584:257–61. doi: 10.1038/s41586-020-2405-7
6. Xu J, Li Y, Gan F, Du Y, Yao Y. Salivary glands: potential reservoirs for COVID-19 asymptomatic infection. J Dent Res. (2020) 99:989. doi: 10.1177/0022034520918518
7. Zou L, Ruan F, Huang M, Liang L, Huang H, Hong Z, et al. SARS-CoV-2 viral load in upper respiratory specimens of infected patients. N Engl J Med. (2020) 382:1177–9. doi: 10.1056/NEJMc2001737
8. Aguilar JB, Faust JS, Westafer LM, Gutierrez JB. Investigating the impact of asymptomatic carriers on COVID-19 transmission. medRxiv. (2020) doi: 10.1101/2020.03.18.20037994
9. Nishiura H, Linton NM, Akhmetzhanov AR. Serial interval of novel coronavirus (COVID-19) infections. Int J Infect Dis. (2020) 93:284–6. doi: 10.1016/j.ijid.2020.02.060
10. Day M. Covid-19: identifying and isolating asymptomatic people helped eliminate virus in Italian village. BMJ. (2020) 368:m1165. doi: 10.1136/bmj.m1165
11. Bai Y, Yao L, Wei T, Tian F, Jin DY, Chen L, et al. Presumed asymptomatic carrier transmission of COVID-19. JAMA. (2020) 323:1406–7. doi: 10.1001/jama.2020.2565
12. Hu Z, Song C, Xu C, Jin G, Chen Y, Xu X, et al. Clinical characteristics of 24 asymptomatic infections with COVID-19 screened among close contacts in Nanjing, China. Sci China Life Sci. (2020) 63:706–11. doi: 10.1007/s11427-020-1661-4
13. Tian S, Hu N, Lou J, Chen K, Kang X, Xiang Z, et al. Characteristics of COVID-19 infection in Beijing. J Infect. (2020) 80:401–6. doi: 10.1016/j.jinf.2020.02.018
14. Lin C, Ding Y, Xie B, Sun Z, Li X, Chen Z, et al. Asymptomatic novel coronavirus pneumonia patient outside Wuhan: the value of CT images in the course of the disease. Clin Imaging. (2020) 63:7–9. doi: 10.1016/j.clinimag.2020.02.008
15. Lai CC, Liu YH, Wang CY, Wang YH, Hsueh SC, Yen MY, et al. Asymptomatic carrier state, acute respiratory disease, and pneumonia due to severe acute respiratory syndrome coronavirus 2 (SARS-CoV-2): facts and myths. J Microbiol Immunol Infect. (2020) 53:404–12. doi: 10.1016/j.jmii.2020.02.012
16. Jin J-M, Bai P, He W, Wu F, Liu X-F, Han D-M, et al. Gender differences in patients with COVID-19: focus on severity and mortality. Front Public Health. (2020) 8:152. doi: 10.1101/2020.02.23.20026864
17. Chen Y, Li L. SARS-CoV-2: virus dynamics and host response. Lancet Infect Dis. (2020) 20:15–6. doi: 10.1016/S1473-3099(20)30235-8
18. Guo YR, Cao QD, Hong ZS, Tan YY, Chen SD, Jin HJ, et al. The origin, transmission and clinical therapies on coronavirus disease 2019 (COVID-19) outbreak- an update on the status. Military Med Res. (2020) 7:11. doi: 10.1186/s40779-020-00240-0
19. Guan WJ, Ni ZY, Hu Y, Liang WH, Ou CQ, He JX, et al. Clinical characteristics of coronavirus disease 2019 in China. N Engl J Med. (2020) 7:11. doi: 10.1101/2020.02.06.20020974
20. Jiang F, Deng L, Zhang L, Cai Y, Cheung CW, Xia Z. Review of the clinical characteristics of coronavirus disease 2019 (COVID-19). J Gen Intern Med. (2020) 35:1545–9. doi: 10.1007/s11606-020-05762-w
21. Wax RS, Christian MD. Practical recommendations for critical care and anesthesiology teams caring for novel coronavirus (2019-nCoV) patients. Can J Anesth. (2020) 67:568–76. doi: 10.1007/s12630-020-01591-x
22. The Lancet. COVID-19: protecting health-care workers. Lancet. (2020) 395:922. doi: 10.1016/S0140-6736(20)30644-9
23. Lipsitch M, Donnelly CA, Fraser C, Blake IM, Cori A, Dorigatti I, et al. Potential biases in estimating absolute and relative case-fatality risks during outbreaks. PLoS Negl Trop Dis. (2015) 9:e0003846. doi: 10.1371/journal.pntd.0003846
24. Garske T, Legrand J, Donnelly CA, Ward H, Cauchemez S, Fraser C, et al. Assessing the severity of the novel influenza A/H1N1 pandemic. BMJ. (2009) 339:b2840. doi: 10.1136/bmj.b2840
25. Donnelly CA, Ghani AC, Leung GM, Hedley AJ, Fraser C, Riley S, et al. Epidemiological determinants of spread of causal agent of severe acute respiratory syndrome in Hong Kong. Lancet. (2003) 361:1761–6. doi: 10.1016/S0140-6736(03)13410-1
26. Verity R, Okell LC, Dorigatti I, Winskill P, Whittaker C, Imai N, et al. Estimates of the severity of coronavirus disease 2019: a model-based analysis. Lancet Infect Dis. (2020) 3099:1–9. doi: 10.1016/s1473-3099(20)30243-7
27. Jung S, Akhmetzhanov AR, Hayashi K, Linton NM, Yang Y, Yuan B, et al. Real-time estimation of the risk of death from novel coronavirus (COVID-19) infection: inference using exported cases. J Clin Med. (2020) 9:523. doi: 10.3390/jcm9020523
28. Wu P, Hao X, Lau EHY, Wong JY, Leung KSM, Wu JT, et al. Real-time tentative assessment of the epidemiological characteristics of novel coronavirus infections in Wuhan, China, as at 22 January (2020). Eurosurveillance. (2020) 25:20000444. doi: 10.2807/1560-7917.ES.2020.25.3.2000044
29. World Health Organization. Medical Certification, ICD Mortality Coding, and Reporting Mortality Associated With COVID-19. Tech Note. (2020). p. 1–13. Available online at: https://www.who.int/publications/i/item/WHO-2019-nCoV-mortality-reporting-2020-1
30. Meyerowitz-Katz G, Merone L. A systematic review and meta-analysis of published research data on COVID-19 infection-fatality rates. MedRxiv. (2020) 2020:05.03.20089854. doi: 10.1101/2020.05.03.20089854
31. Lauer SA, Grantz KH, Bi Q, Jones FK, Zheng Q, Meredith HR, et al. The incubation period of coronavirus disease 2019. (COVID-19) from publicly reported confirmed cases: estimation and application. Ann Intern Med. (2020). 172:577–82. doi: 10.7326/M20-0504
32. Bommer C, Vollmer S. Average Detection Rate of SARS-CoV-2 Infections Is Estimated Around Nine Percent. University of Goettingen (2020). Available online at: http://www.uni-goettingen.de/en/606540.html
33. Jing Q-L, Liu M-J, Yuan J, Zhang Z-B, Zhang A-R, Dean NE, et al. Household secondary attack rate of COVID-19 and associated determinants. medRxiv. (2020) 2020:04.11.20056010. doi: 10.1016/S1473-3099(20)30471-0
34. Streeck H, Schulte B, Kuemmerer B, Richter E, Hoeller T, Fuhrmann C, et al. Infection fatality rate of SARS-CoV-2 infection in a German community with a super-spreading event. medRxiv. (2020) 2020:05.04.20090076. doi: 10.1101/2020.05.04.20090076
35. Erikstrup C, Hother CE, Pedersen OBV, Mølbak K, Skov RL, Holm DK, et al. Estimation of SARS-CoV-2 infection fatality rate by real-time antibody screening of blood donors. medRxiv. (2020) doi: 10.1101/2020.04.24.20075291
36. Ioannidis J. The infection fatality rate of COVID-19 inferred from seroprevalence data. medRxiv. (2020) 2020:05.13.20101253. doi: 10.1101/2020.05.13.20101253
37. World Health Organization. Bacille Calmette-Guérin (BCG) vaccination and COVID-19. Sci Br. (2020). 36:2019–20. doi: 10.15557/PiMR.2020.0025
38. Singh S. BCG vaccines may not reduce COVID-19 mortality rates. medRxiv. (2020) 2020:04.11.20062232. doi: 10.1101/2020.04.11.20062232
39. Bodova K, Boza V, Brejova B, Kollar R, Mikusova K, Vinar T. Time-adjusted analysis shows weak associations between BCG vaccination policy and COVID-19 disease progression. medRxiv. (2020) 2020:05.01.20087809. doi: 10.1101/2020.05.01.20087809
40. Klinger D, Blass I, Rappoport N, Linial M. Significantly improved COVID-19 outcomes in countries with higher BCG vaccination coverage: a multivariable analysis. Vaccines. (2020) 8:378. doi: 10.3390/vaccines8030378
41. Szigeti R, Kellermayer D, Kellermayer R. BCG protects against COVID-19? A word of caution. medRxiv. (2020) 2020:04.09.20056903. doi: 10.1101/2020.04.09.20056903
42. Paredes Mogica JA, Nava V, Torres J. COVID-19 related mortality: is the BCG vaccine truly effective? medRxiv. (2020) 2020:05.01.20087411. doi: 10.1101/2020.05.01.20087411
43. Long JS, Ervin LH. Using heteroscedasticity consistent standard errors in the linear regression model. Am Stat. (2010) 54:217–24. doi: 10.1080/00031305.2000.10474549
45. Stringhini S, Wisniak A, Piumatti G, Azman AS, Lauer SA, Baysson H, et al. Seroprevalence of anti-SARS-CoV-2 IgG antibodies in Geneva, Switzerland (SEROCoV-POP): a population-based study. Lancet. (2020) 396:P313–19. doi: 10.1016/S0140-6736(20)31304-0
46. Pollán M, Pérez-Gómez B, Pastor-Barriuso R, Oteo J, Hernán MA, Pérez-Olmeda M, et al. Prevalence of SARS-CoV-2 in Spain (ENE-COVID): a nationwide, population-based seroepidemiological study. Lancet. (2020) 6736:1–11. doi: 10.1016/S0140-6736(20)31483-5
47. Huff HV, Singh A. Asymptomatic transmission during the COVID-19 pandemic and implications for public health strategies. Clin Infect Dis. (2020) ciaa654. doi: 10.1093/cid/ciaa654
48. Baggett TP, Keyes H, Sporn N, Gaeta JM. Prevalence of SARS-CoV-2 infection in residents of a large homeless shelter in Boston. JAMA. (2020) 323:2191–2. doi: 10.1001/jama.2020.6887
49. Marcel S, Christian AL, Richard N, Silvia S, Emma H, Jacques F, et al. COVID-19 epidemic in Switzerland: on the importance of testing, contact tracing and isolation. Swiss Med Wkly. (2020) 150:12–5. doi: 10.4414/smw.2020.20225
50. Brotherhood L, Kircher P, Santos C, Tertilt M. An economic model of the Covid-19 epidemic: the importance of testing and age-specific policies. CRC TR 224 Discussion Paper Series crctr224_2020_175. University of Bonn and University of Mannheim (2020). Available online at: https://www.iza.org/publications/dp/13265/an-economic-model-of-the-covid-19-epidemic-the-importance-of-testing-and-age-specific-policies
Keywords: infection fatality ratio, infection detection ratio, estimates of SARS-CoV-2 infections, asymptomatic SARS-CoV-2 population, multiple linear regression
Citation: Villalobos C (2020) SARS-CoV-2 Infections in the World: An Estimation of the Infected Population and a Measure of How Higher Detection Rates Save Lives. Front. Public Health 8:489. doi: 10.3389/fpubh.2020.00489
Received: 09 May 2020; Accepted: 31 July 2020;
Published: 25 September 2020.
Edited by:
Zisis Kozlakidis, International Agency For Research On Cancer (IARC), FranceReviewed by:
Haiyan Fu, Dali University, ChinaPaulin Sonon, Aggeu Magalhães Institute (IAM), Brazil
Copyright © 2020 Villalobos. This is an open-access article distributed under the terms of the Creative Commons Attribution License (CC BY). The use, distribution or reproduction in other forums is permitted, provided the original author(s) and the copyright owner(s) are credited and that the original publication in this journal is cited, in accordance with accepted academic practice. No use, distribution or reproduction is permitted which does not comply with these terms.
*Correspondence: Carlos Villalobos, Y3ZpbGxhbEB1bmktZ29ldHRpbmdlbi5kZQ==; Y3ZpbGxhbG9ib3NAdXRhbGNhLmNs