 Mathieu Nacher1,2*
 Cyril Rousseau3Tiphanie Succo3Audrey Andrieu3Mélanie Gaillet4
 Céline Michaud4Véronique Servas4Maylis Douine1Roxane Schaub1Antoine Adenis1
 Magalie Demar5,6Philippe Abboud7Loïc Epelboin7Félix Djossou2,6,7
- 1Centre d'Investigation Clinique Antilles Guyane, INSERM 1424, Centre Hospitalier de Cayenne, Cayenne, French Guiana
- 2Département Formation Recherche (DFR) Santé, Université de Guyane, Cayenne, French Guiana
- 3Santé Publique France, Cayenne, French Guiana
- 4Centres Délocalisés de Prévention et de Soins, Centre Hospitalier de Cayenne, Cayenne, French Guiana
- 5Laboratory, Centre Hospitalier de Cayenne, Cayenne, French Guiana
- 6Unité Mixte de Recherche Tropical Biome et Immuno-Pathologie (UMR TBIP), Université de Guyane, Cayenne, French Guiana
- 7Service des Maladies Infectieuses et Tropicales, Centre Hospitalier de Cayenne, Cayenne, French Guiana
Background: The COVID 19 epidemic submerged many health systems in the Amazon. The objective of the present study was to focus on the epidemic curves of the COVID 19 epidemic in different centers, and to look at testing and mortality data.
Methods: Publicly available datasets were used. The log10 of the daily cumulated number of cases starting from the day the territory reached 100 cumulated cases was plotted to compare the magnitude, shape and slope of the different curves. The maximum daily testing efforts were plotted for each territory in relation to the maximum daily number of diagnoses. The case fatality rate was computed by dividing the number of COVID 19 deaths by the number of confirmed cases.
Results: In the Amazonian regions in general the speed of growth was generally lower than in Europe or the USA, or Southern Brazil. Whereas, countries like South Korea or New Zealand “broke” the curve relatively rapidly the log linear trajectory seemed much longer with signs of a decline in growth rate as of early July 2020. After a very slow start, French Guiana had the lowest slope when compared to other Amazonian territories with significant epidemics. The Amazonian states of Roraima, Amazonas, Parà, and Amapà had among the highest number of cases and deaths per million inhabitants in the world. French Guiana had significantly fewer deaths relative to its number of confirmed cases than other Amazonian territories. French Guiana had a late epidemic surge with intense testing scale-up often exceeding 4,000 persons tested daily per million inhabitants. Brazil was an outlier with low daily testing levels in relation to the number of daily diagnoses.
Conclusions: There were marked heterogeneities mortality rates suggesting that socioeconomic, political factors, and perhaps ethnic vulnerability led to striking outcome differences in this Amazonian context.
Introduction
South America was affected by the COVID 19 epidemic after Asia, Europe, and North America, but the epidemic eventually caught up and overwhelmed the health system (1). This was perhaps best epitomized by the news images of the tragedy unfolding in Manaus, in the heart of the Amazon, as well as Guayaquil in Ecuador, or several cities in Peru (2, 3). Early in the epidemic, researchers studied the relation with climatic variables, and as for influenza (4–6), humidity and temperature were shown to have some impact on the reproductive number of COVID 19 (7–15). It has also been suggested that ultraviolet A and B radiation were associated with a reduction of the mortality of COVID 19 (16–18). Young populations, which is the case for the Amazonian region, are described as much less at risk of severe complications than older age groups (19). It was therefore somewhat unexpected to discover that Northern Brazil, with its hot and humid equatorial climate was one of the most affected regions in the world for COVID 19 (20). The Amazon basin and the Guiana shield are covered by a dense primary forest, roadways are therefore scarce and river or air travel are the main connecting routes between many villages and cities. Apart from the major cities, population density is very low, and poverty widespread notably in the favelas where the local population density is high and social distancing is difficult to implement in practice (21). The density of health professionals and hospital beds is also lower than in other parts of South America (22–24). Although, there are geographic commonalities, there are also differences in health expenditure per capita, differences in the organization of prevention testing and care, and differences in political leadership in confronting the crisis. Despite unprecedented research efforts and discoveries, the present pandemic is still incompletely understood, and its future uncertain. Describing and comparing trends and indicators between regions often yields instructive insights. In the present study, the objective was hence to focus on the dynamics of the COVID 19 epidemic in a singular region, the Amazon and the Guiana Shield, more specifically the Brazilian states of Amapa, Para, Roraima, and Amazonas, and in French Guiana and Suriname. A secondary objective was then to compare the Amazon and the Guiana shield to other regions of the world.
Methods
Data Sources
Data sets were downloaded from https://ourworldindata.org/coronavirus (1), which updates global data on COVID 19 (notably countries from continental Europe, North America, South America, East Asia, South East Asia…). Because the greater Amazonian area includes different countries or regions of countries, we use other data sources to obtain more detail, notably from the Brazilian ministry of health website (20), which entails state data. For French Guiana, a French overseas territory located on the Guiana shield, between Surinam an the Brazilian State of Amapá, the data was obtained from Santé Publique France (25), the French centers for disease control. The cumulated testing data was obtained from https://www.worldometers.info/coronavirus/ (26).
Comparisons
In order to compare the epidemic growth, we plotted the log10 of the daily cumulated number of cases starting from the day the territory reached 100 cumulated cases. This allowed to compare the magnitude, shape and slope of the different curves. The median Rt values were computed for Amazonian territories.
The magnitude of the maximum daily testing efforts in relation to the maximum daily number of diagnoses were also compared. Cumulated number of tests were also plotted in relation to the total number of COVID 19 deaths.
The case fatality rate was computed by dividing the number of COVID 19 deaths by the number of confirmed cases.
Data Analysis
Data was analyzed with STATA 15. In order to track the epidemic dynamics, we computed the effective reproduction number, which is the average number of new infections caused by a single infected individual at time t in the partially susceptible population. Indeed varying proportions of the population are immune to any given disease at any given time and social distancing may vary over time. The Rt values were calculated using the R EpiEstim package which computes R from daily new cases of COVID 19. Median values for each territory were plotted on a single graph.
Regulatory and Ethical Considerations
The study used public anonymous aggregated data and did not require any ethical review according to French Authorities.
Results
Comparison of Cumulated Case Numbers
Figure 1 shows the chronological growth of the number of cases and deaths in Amapa, Amazonas, Para, Roraima, French Guiana, Guyana, and Suriname. At the normal scale the Guiana shield territories are hardly visible given the disproportionately higher case and death numbers in Brazil. The much larger population in Brazil relative to the Guiana shield mostly concerns Amazonas (3,874,000) and Para (8,074,000) whereas Amapa (751,000) and Roraima (496,936) were closer in scale to the population of the Guiana Shield [French Guiana (290,000), Guyana (779,004), and Suriname (575,991)], yet there were still much greater numbers of COVID 19 cases and deaths.
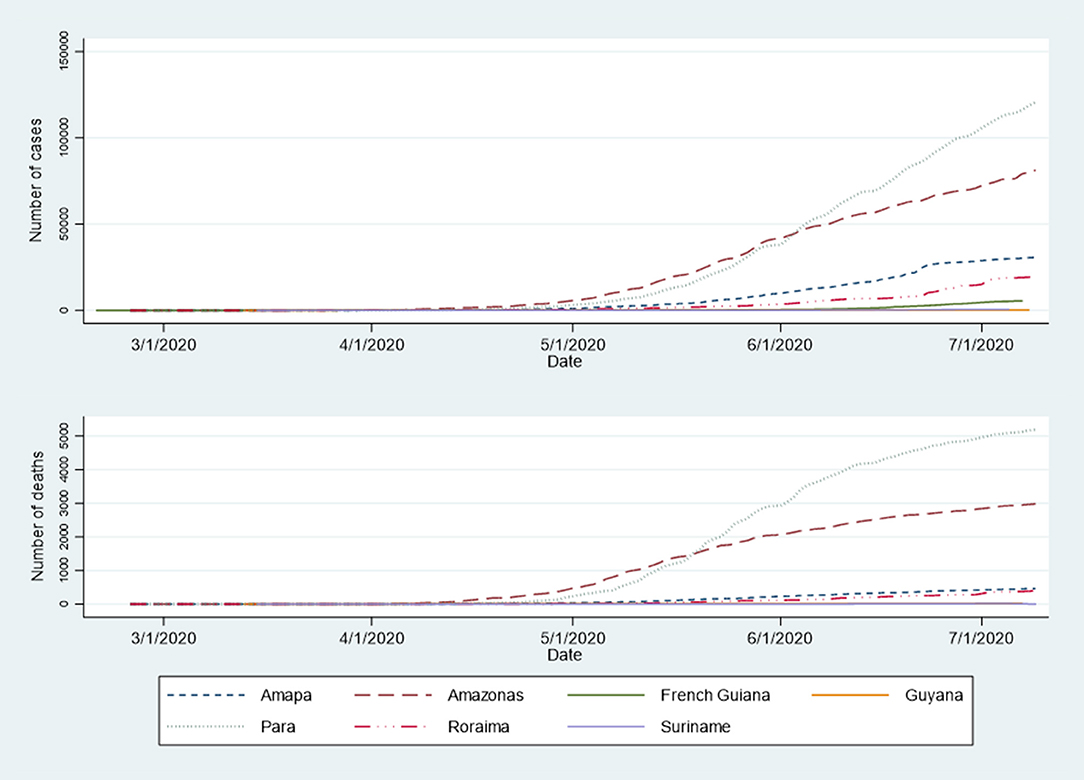
Figure 1. Evolution of the number of COVID-19 cases and deaths in Amazonian territories.
Figure 2 shows the evolution of the log10 of the number of COVID-19 cases in selected countries. Regarding the Amazonian regions in general, the speed of growth was generally lower than in Continental Europe or the USA, or Southern Brazil. The slope was somewhat parallel to that of Japan. Whereas, countries like South Korea or New Zealand “broke” the curve relatively rapidly the loglinear trajectory seemed much longer with signs of a decline in growth rate as of early July 2020. After a very slow start, French Guiana had the lowest slope when compared to other Amazonian territories with significant epidemics (Guyana only declared 284 cases so far and was not plotted).
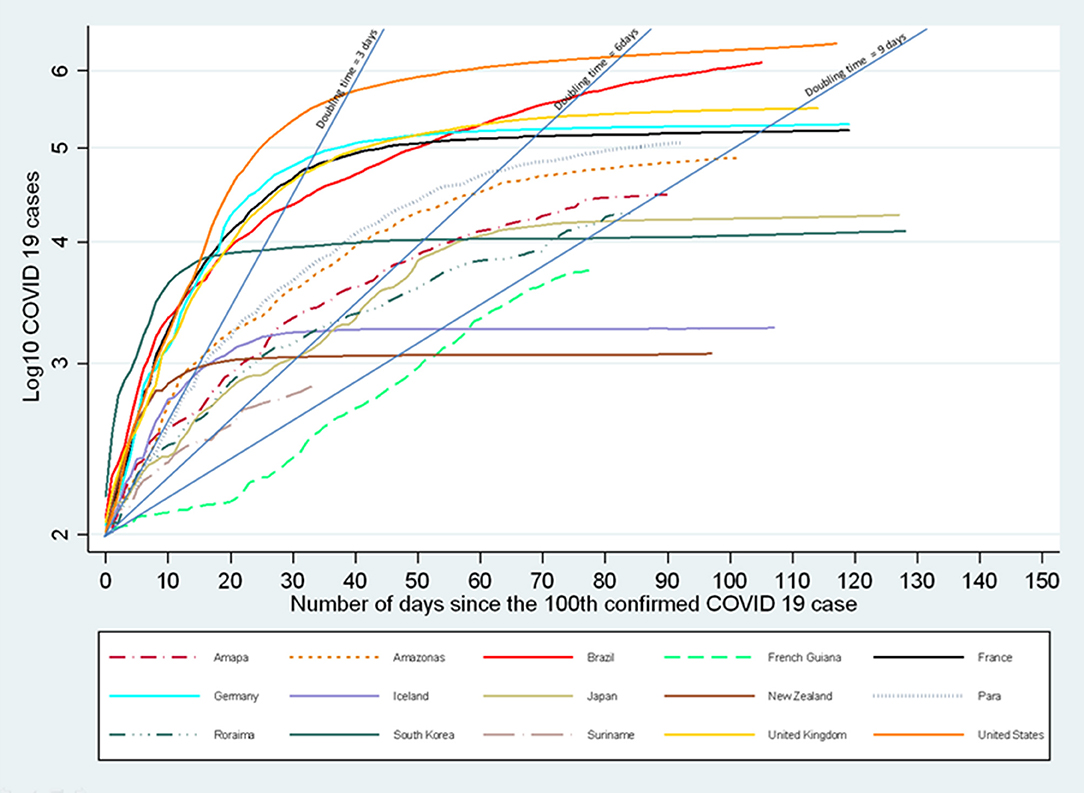
Figure 2. Evolution of the number of COVID-19 cases in selected countries and Amazonian territories.
Plotting Number of Deaths and Cases per Territory
Figure 3 shows a scatterplot of the log10 of the number of deaths per million inhabitants and the log10 of the number of cases per million inhabitants. This shows the loose positive correlation of the number of deaths and the number of cases, and more importantly it shows that countries on the lower right side of the scatterplot have markedly less deaths that those on the upper left part of the plot. Hence among Amazonian territories Figure 3 shows that the Amazonian states of Roraima, Amazonas, Pará, and Amapá had among the highest number of cases and deaths per million inhabitants in the world. Other states with Amazonian territories (Colombia, Ecuador, Bolivia, Venezuela) are represented with pooled country data which does not allow to disaggregate the Amazonian population segment. Guyana despite a low number of confirmed cases had significant mortality and Suriname was in an intermediary position. French Guiana had significantly fewer deaths relative to its number of confirmed cases than other Amazonian territories. Supplementary Figure 1 shows the relation between median age and case-fatality rate showing the relative youth of French Guiana and Amazonian territories.
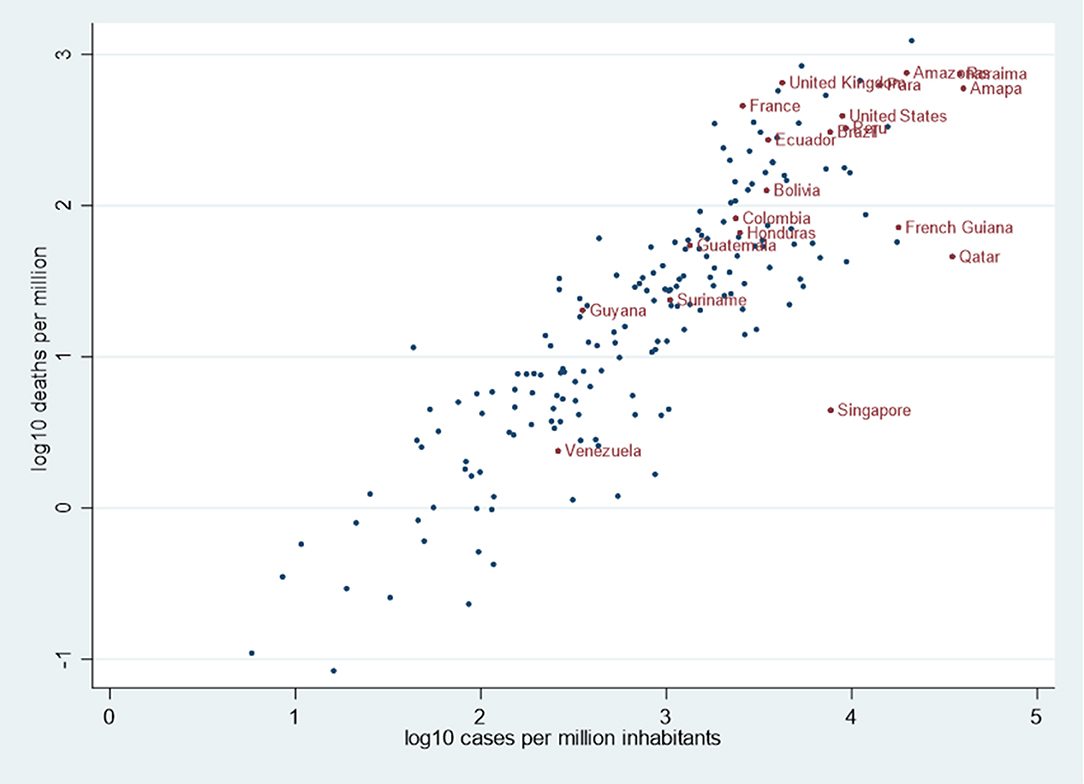
Figure 3. Scatterplot of the log10 of the number of deaths and the log10 of the number of cases per million inhabitants in selected countries and Amazonian territories.
Proportion of Confirmed Cases That Died
Table 1 represents the detailed data on July 7th and shows that the proportion of deaths per case ranged from 0.4% In French Guiana to 7.7% in Ecuador, with among Amazonian territories Guyana with 5.7% mortality despite a low number of cases.
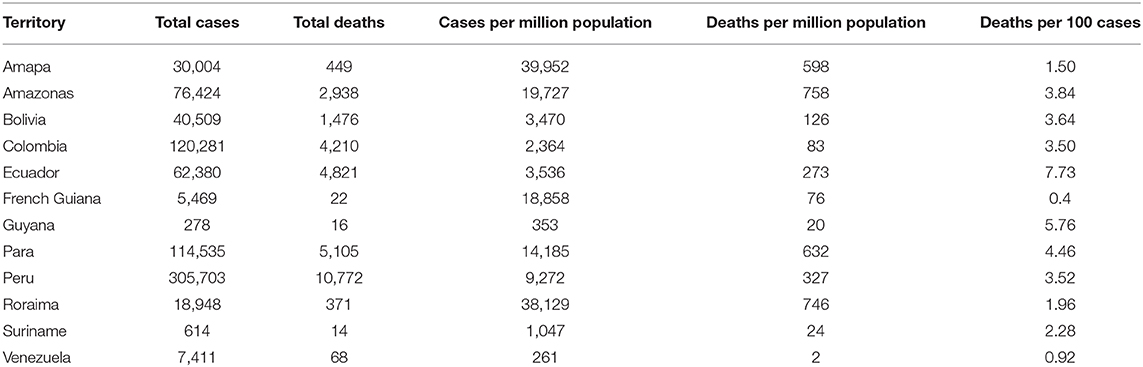
Table 1. Comparison of total number of COVID-19 cases and deaths, per million inhabitants and respective proportion of deaths/cases (July 7th 2020).
Cumulated Test Numbers and Deaths
Figure 4 does not include details on the total number of persons tested for Brazilian Amazonian states; it shows that in some countries the large number of cumulated tests was associated with a large number of deaths; in other countries the large number of tests was associated with few deaths, presumably reflecting different strategies. Brazil and continental France for example had relatively few tests but large numbers of deaths, whereas Iceland and Israel had intense testing with low mortality.
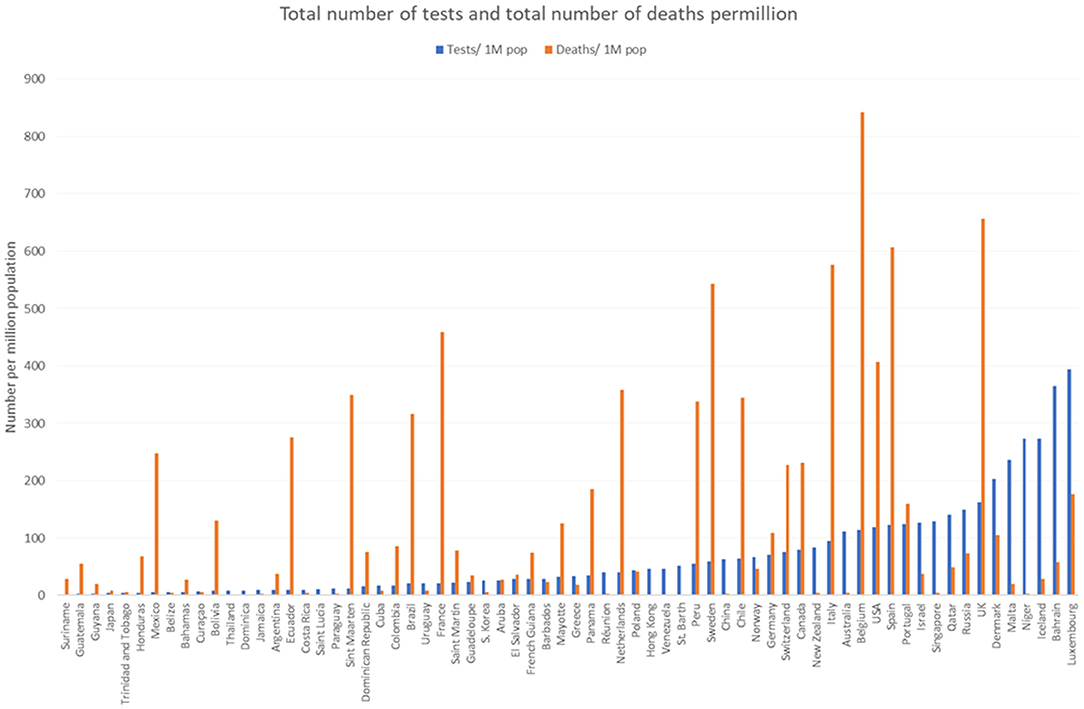
Figure 4. Comparison of the total number of diagnostic tests and deaths per million inhabitants.
Maximum Number of Daily Tests and Diagnoses
Suriname and Guyana had relatively few cases and the cumulated number of tests was low; French Guiana had a late epidemic surge (passed the 100th case threshold on April 24th) with intense testing scale-up in May and June 2020 often exceeding 4,000 persons tested daily per million inhabitants, levels only surpassed by Bahrain, Iceland, and Luxembourg (Figure 5). Figure 5 also shows that for countries with Amazonian territories with available daily testing data (Brazil, Peru, Bolivia, Colombia, and Ecuador) the maximum daily number of tests at the whole country level was low compared to the maximum number of cases, notably Brazil which was an outlier.
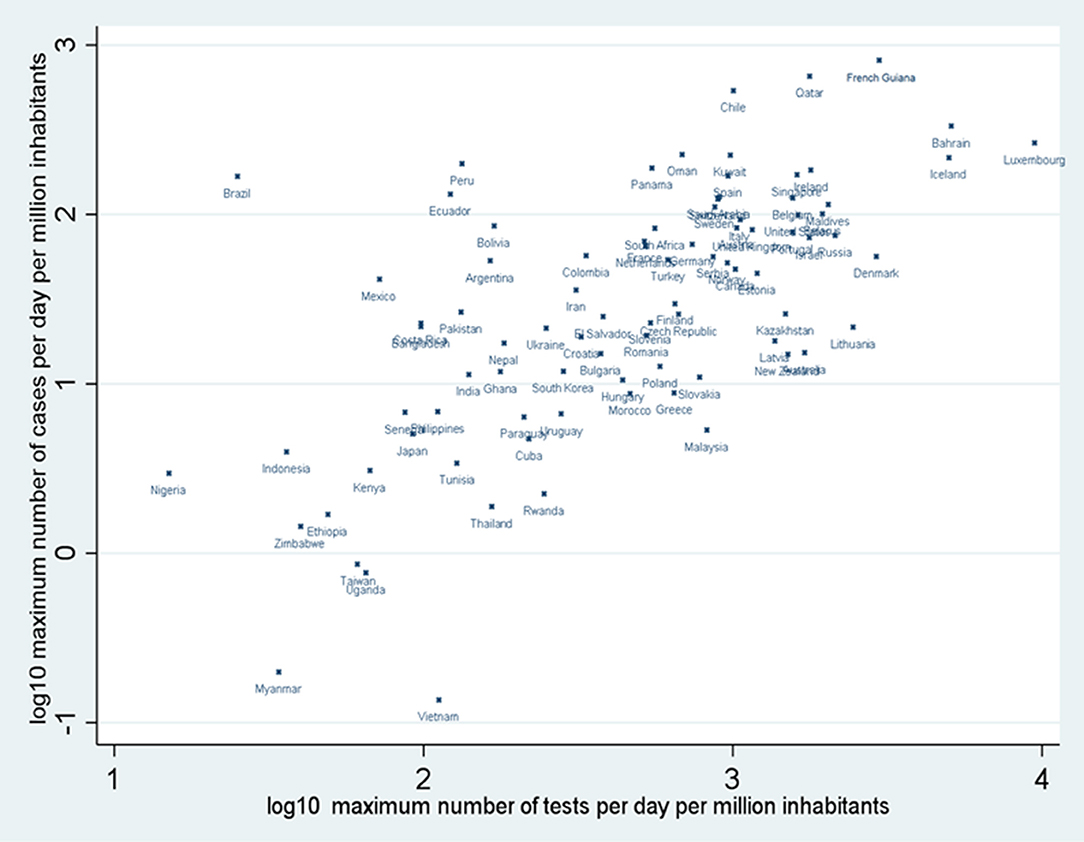
Figure 5. Scatter plot of the log10 or the maximum number of cases per day per million inhabitants and the log10 of the number of persons tested per day millions inhabitants in selected countries and Amazonian territories.
Median Daily Rt Values Over Time
Figure 6 shows the median daily Rt values for French Guiana, Amapá, Amazonas, Pará, and Roraima. Generally, apart from large daily fluctuation, the median values were between 1 and 1.5 and in their latest estimation were below 1.
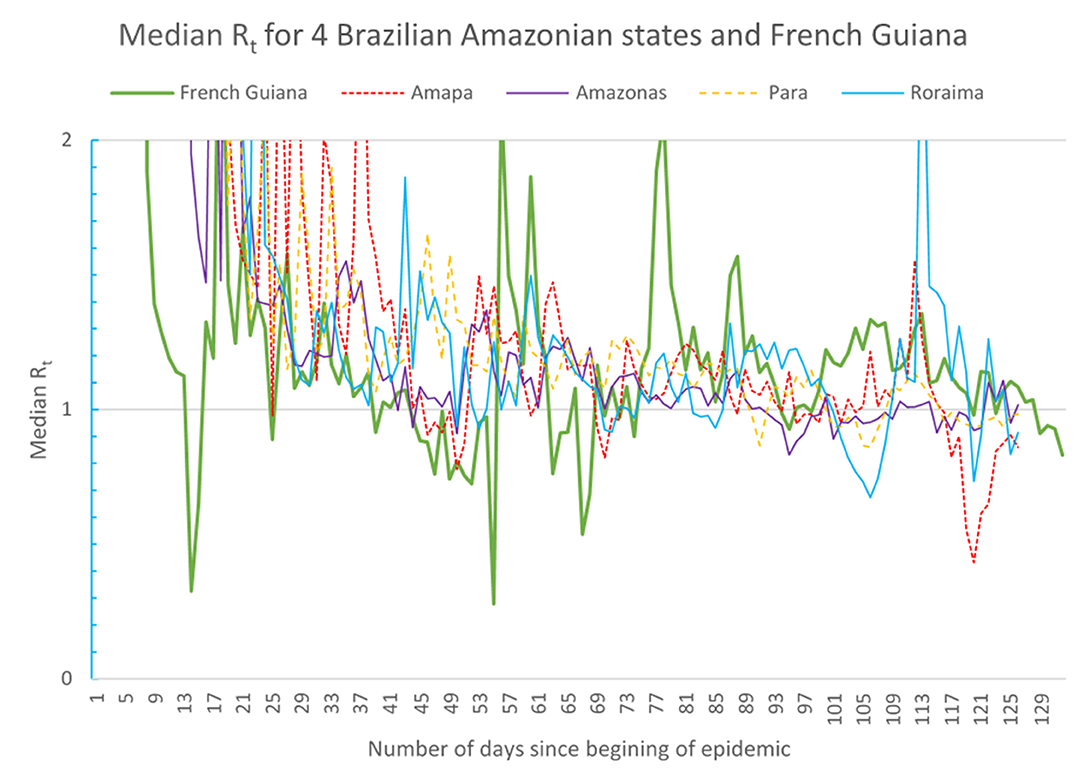
Figure 6. Evolution of the median Rt in Amazon territories.
Discussion
The present results show that the spread of the COVID 19 epidemic in the Amazon was slower that in Europe, North America or Southern Brazil. Despite daily fluctuations median Rt values for territories with available data were generally slightly above 1 falling recently below 1. Amapa, the neighboring state with French Guiana seemed to be leading the trends observed in French Guiana. Perhaps lower population densities, scarce transport infrastructure, climatic factors, and perhaps the benefit of the knowledge of what had just happened in Asia and Europe slowed transmission. Nevertheless, transmission did occur and the curves seemed to take a longer time to “break” perhaps reflecting its gradual spread from community to community along the ramifications of social networks, often by boat (27–29). The heterogeneity between Amazonian territories is also a remarkable feature that reflects the scarce transport infrastructure, the very early lockdown of borders in early March, and obvious political commitment levels to tackle the problem. For Guyana, Suriname, and French Guiana, territories with few hospital and ICU beds the perspective of an overwhelming surge led early on to a lock down with interruption of air traffic, border closure, social distancing, confinement, quarantine, and isolation of patients. For Brazil, daily airline connection with major cities in southern Brazil presumably rapidly fueled the local epidemic in the North. In addition, there has been a great confusion between Federal, State and municipal levels reflected by the resignation of 2 health ministers, and the current absence of one to this date. It is very likely that the polarized political context has had a significant impact in the very high number of cases and deaths in the Amazonian States of Brazil, and beyond. For French Guiana and Suriname, after a first “phony war” period with very few cases imported from Europe which were easily controlled, the epidemic in the Amazonian states permeated across the border and with the lift of confinement, and perhaps the belief that there would be no epidemic after all, it gradually spread mostly across the most precarious communities, reaching all ethnic groups, despite uninterrupted contact tracing, and intensive community mobilization and testing.
Regarding the number of deaths, there was great heterogeneity. Studies have suggested that high ultraviolet radiation was associated with lower COVID 19 mortality (16–18) and that vitamin D deficiency (30), a frequent feature in Latin America, was associated with greater mortality. Although these factors may marginally affect mortality, it seems the explanation for such heterogeneity lies elsewhere. First despite the young age of the populations in the North, the magnitude of the number of cases in the Northern Brazilian states may have simply overwhelmed the health system and led to suboptimal care; Although the statistical plots between confirmed cases and deaths suffers from the imprecision of not reflecting testing efforts, and testing seemed relatively low in Brazil. Presumably the real number of COVID 19 cases was much greater that the number of confirmed cases (31). However, the raw numbers of deaths and the sights of mass graves reported in much of the press demonstrate how massive the influx of severe patients was. Among of the particularities of the Northern states are the high levels of social deprivation, and its ethnic makeup which perhaps leads to greater levels of acquisition and mortality (32–39). The picture in French Guiana, however, was quite singular. There is a large poor immigrant population, many vulnerable ethnic groups, high levels of comorbidities such as diabetes, obesity, and hypertension, which were expected to increase the risk of severe forms and deaths (40). However, to this day the levels of mortality are very low. Among the potential explanations, we can cite the youth of the population (median 22 years), but it is of note that it is the same as that of Amapá, where case numbers per million were 2.1 times greater than in French Guiana and mortality per million was 7.8 times greater than in French Guiana. The intense scaling up of testing and contact tracing presumably led to a denominator that is close to the real number of cases in French Guiana. The surge of cases in French Guiana occurred between June and July and presumably care of patients benefitted from knowledge accumulated since the beginning of the epidemic: hence telemedicine for patients remaining at home and the aggressive search for any sign of silent hypoxia, anticoagulation, the use of steroids when pneumonia worsens, progress in ICU ventilation methods (such as nasal high flow therapy, prone position in intubated but also non-intubated COVID-19 patients), and early massive organizational efforts to expand hospital and ICU beds for COVID patients (41) all combined to reduce mortality in French Guiana.
The limitations of this study are that it relies of aggregated data from different information systems, with incomplete knowledge of policies, dates of implementation at different locations. Causal inferences are impossible with such data. Nevertheless, the strength of this study is that it attempts to focus on the Amazon basin and to compare between territories within the region and other countries with very different context, showing instructive contrasts.
In conclusion, despite a number of factors that were expected to slow down the spread of the virus, the epidemic spread widely in the Amazonian regions, and led to considerable mortality in Northern Brazil. Widespread poverty, low access to care in remote areas, ethnic factors, comorbidities, and political denial of the health crisis may have explained the tragic situation. By contrast French Guiana, which aggressively tackled the crisis early on observed a delayed epidemic with low mortality, showing as elsewhere that despite a number of challenges it is possible to significantly impact transmission and mortality and reduce the impact of an uncontrolled surge in severe COVID 19 infections. The present analysis also suggests that an integrated data analysis is possible at the regional level and that learning from comparing territories in this complex Amazonian context may help health authorities optimize the response to the massive crisis caused by this novel pathogen (42).
Data Availability Statement
Publicly available datasets were analyzed in this study. This data can be found at: https://ourworldindata.org/, https://covid.saude.gov.br/.
Author Contributions
MN analyzed data, wrote first draft, and validated final manuscript. CR, TS, and AAn collected data and edited manuscript. MG, CM, VS, MDo, RS, AAd, MDe, PA, LE, and FD data interpretation and manuscript edition.
Conflict of Interest
The authors declare that the research was conducted in the absence of any commercial or financial relationships that could be construed as a potential conflict of interest.
Supplementary Material
The Supplementary Material for this article can be found online at: https://www.frontiersin.org/articles/10.3389/fpubh.2021.586299/full#supplementary-material
References
1. Roser M, Ritchie H, Ortiz-Ospina E, Hasell J. Coronavirus Pandemic (COVID-19). Our World in Data. (2020). Available online at: https://ourworldindata.org/coronavirus (accessed July 8, 2020).
2. The New York Times. Coronavirus Outbreak in Latin America Now Rivals Europe's. But Its Options Are Worse. The New York Times. (2020). Available online at: https://www.nytimes.com/2020/05/12/world/americas/latin-america-virus-death.html (accessed July 8, 2020).
3. Kirby T. South America prepares for the impact of COVID-19. Lancet Respir Med. (2020) 8:551–2. doi: 10.1016/S2213-2600(20)30218-6
4. Barreca AI, Shimshack JP. Absolute humidity, temperature, and influenza mortality: 30 years of county-level evidence from the United States. Am J Epidemiol. (2012) 176:S114–22. doi: 10.1093/aje/kws259
5. Lowen AC, Mubareka S, Steel J, Palese P. Influenza virus transmission is dependent on relative humidity and temperature. PLoS Pathog. (2007) 3:1470–6. doi: 10.1371/journal.ppat.0030151
6. McDevitt J, Rudnick S, First M, Spengler J. Role of absolute humidity in the inactivation of influenza viruses on stainless steel surfaces at elevated temperatures. Appl Environ Microbiol. (2010) 76:3943–7. doi: 10.1128/AEM.02674-09
7. Luo W, Majumder M, Liu D, Poirier C, Mandl K, Lipsitch M, et al. The role of absolute humidity on transmission rates of the COVID-19 outbreak. medRXiv. (2020). doi: 10.1101/2020.02.12.20022467
8. Ma Y, Zhao Y, Liu J, He X, Wang B, Fu S, et al. Effects of temperature variation and humidity on the death of COVID-19 in Wuhan, China. Sci Total Environ. (2020) 724:138226. doi: 10.1016/j.scitotenv.2020.138226
9. Mellan TA, Hoeltgebaum HH, Mishra S, Whittaker C, Schnekenberg RP, Gandy A, et al. Report 21: estimating COVID-19 cases and reproduction number in Brazil. medRxiv. (2020). doi: 10.1101/2020.05.09.20096701
10. Oliveiros B, Caramelo L, Ferreira NC, Caramelo F. Role of temperature and humidity in the modulation of the doubling time of COVID-19 cases. medRxiv. (2020). doi: 10.1101/2020.03.05.20031872
11. Prata DN, Rodrigues W, Bermejo PH. Temperature significantly changes COVID-19 transmission in (sub) tropical cities of Brazil. Sci. Total Environ. (2020) 729:138862. doi: 10.1016/j.scitotenv.2020.138862
12. Qi H, Xiao S, Shi R, Ward MP, Chen Y, Tu W, et al. COVID-19 transmission in Mainland China is associated with temperature and humidity: a time-series analysis. Sci. Total Environ. (2020) 728:138778. doi: 10.1016/j.scitotenv.2020.138778
13. Sajadi MM, Habibzadeh P, Vintzileos A, Shokouhi S, Miralles-Wilhelm F, Amoroso A. Temperature and latitude analysis to predict potential spread and seasonality for COVID-19. JAMA Netw Open. (2020) 3:e2011834. doi: 10.1001/jamanetworkopen.2020.11834
14. Wang J, Tang K, Feng K, Lin X, Lv W, Chen K, et al. Impact of temperature and relative humidity on the transmission of COVID-19: a modeling study in China and the United States. BMJ Open. (2020) (Forthcoming). doi: 10.2139/ssrn.3551767
15. Zhu Y, Xie J. Association between ambient temperature and COVID-19 infection in 122 cities from China. Sci. Total Environ. (2020) 724:138201. doi: 10.1016/j.scitotenv.2020.138201
16. Rhodes J, Dunstan F, Laird E, Subramanian S, Kenny RA. COVID-19 mortality increases with northerly latitude after adjustment for age suggesting a link with ultraviolet and vitamin D. BMJ Nutr Prev Health. (2020) 3:118–20. doi: 10.1136/bmjnph-2020-000110
17. Kalippurayil Moozhipurath R, Kraft L, Skiera B. Evidence of protective role of ultraviolet-B (UVB) radiation in reducing COVID-19 deaths. Sci Rep. (2020) 10:17705. doi: 10.1038/s41598-020-74825-z
18. Kalippurayil Moozhipurath R, Kraft L, Skiera B. Evidence of protective role of Ultraviolet-B (UVB) radiation in reducing COVID-19 deaths (April 1, 2020). Sci Rep. (2020) 10:17705. doi: 10.2139/ssrn.3586555
19. Jordan RE, Adab P, Cheng KK. Covid-19: risk factors for severe disease and death. BMJ. (2020) 368:m1198. doi: 10.1136/bmj.m1198
20. Coronavírus, Brasil,. Available online at: https://covid.saude.gov.br/ (accessed July 8, 2020).
21. Reddit. Population Density in South America (2383x3154) : MapPorn. Available online at: https://www.reddit.com/r/MapPorn/comments/5da39u/population_density_in_south_america2383x3154/ (accessed July 8, 2020).
22. World Bank. Hospital Beds (per 1,000 People). Data. Available online at: https://data.worldbank.org/indicator/SH.MED.BEDS.ZS (accessed July 8, 2020).
23. Insee. Professionnels de Santé au 1er Janvier 2018. Insee. Available online at: https://www.insee.fr/fr/statistiques/2012677 (accessed July 8, 2020).
24. CIA. Field Listing: Physicians Density—The World Factbook. Central Intelligence Agency. Available online at: https://www.cia.gov/library/publications/the-world-factbook/fields/359.html (accessed July 8, 2020).
25. ARS. Point Epidémio Régional Hebdomadaire “Spécial COVID-19.” Available online at: https://www.guyane.ars.sante.fr/point-epidemio-regional-hebdomadaire-special-covid-19 (accessed July 8, 2020).
26. Worldometer. Coronavirus Update (Live): 12,084,468 Cases and 549,623 Deaths From COVID-19 Virus Pandemic. Worldometer. Available online at: https://www.worldometers.info/coronavirus/ (accessed July 9, 2020)
27. Aleixo NCR, Neto JCA, da S, Pereira H, dos S, Barbosa DES, Lorenzi BC. Pelos caminhos das águas: a mobilidade e evolução da COVID-19 no estado do Amazonas. Conf. Revue Franco Brésil Géograph. (2020) 45. doi: 10.4000/confins.30072
28. Point, Epidemiologique Hebdomadaire Gran Santi Covid,. Recherche Google. Available online at: https://www.google.com/search?q=point+epidemiologique+hebdomadaire+gran+santi+covid&rlz=1C1GCEU_frGF822GF822&oq=point+epidemiologique+hebdomadaire+gran+santi+covid&aqs=chrome.69i57j33.20436j0j8&sourceid=chrome&ie=UTF-8 (accessed July 9, 2020).
29. Bilan_campagne_StGeorges_VF.pdf. Available online at: https://www.guyane.ars.sante.fr/system/files/2020-06/Bilan_campagne_StGeorges_VF.pdf (accessed July 9, 2020).
30. Marik PE, Kory P, Varon J. Does vitamin D status impact mortality from SARS-CoV-2 infection? Med Drug Discov. (2020) 6:100041. doi: 10.1016/j.medidd.2020.100041
31. Ribeiro LC, Bernardes AT. Estimate of Underreporting of COVID-19 in Brazil by Acute Respiratory Syndrome Hospitalization Reports. Notas Técnicas Cedeplar-UFMG 010. Cedeplar: Universidade Federal de Minas Gerais (2020).
33. Ferrante L, Fearnside PM. Protect indigenous peoples from COVID-19. Science. (2020) 368:251. doi: 10.1126/science.abc0073
34. Borges T, Branford S. First COVID-19 Case Among Indigenous People Confirmed in Brazilian Amazon. Menlo Park, CA: Mongabay. (2020).
35. Pareek M, Bangash MN, Pareek N, Pan D, Sze S, Minhas JS, et al. Ethnicity and COVID-19: an urgent public health research priority. Lancet. (2020) 395:1421–2. doi: 10.1016/S0140-6736(20)30922-3
36. Laurencin CT, McClinton A. The COVID-19 pandemic: a call to action to identify and address racial and ethnic disparities. J Racial Ethn Health Disparities. (2020) 7:398–402. doi: 10.1007/s40615-020-00756-0
37. Hooper MW, Nápoles AM, Pérez-Stable EJ. COVID-19 and racial/ethnic disparities. JAMA. (2020) 323:2466–7. doi: 10.1001/jama.2020.8598
38. Aldridge RW, Lewer D, Katikireddi SV, Mathur R, Pathak N, Burns R, et al. Black, Asian and minority ethnic groups in England are at increased risk of death from COVID-19: indirect standardisation of NHS mortality data. Wellcome Open Res. (2020) 5:88. doi: 10.12688/wellcomeopenres.15922.2
39. Ji Y, Ma Z, Peppelenbosch MP, Pan Q. Potential association between COVID-19 mortality and health-care resource availability. Lancet Glob Health. (2020) 8:e480. doi: 10.1016/S2214-109X(20)30068-1
40. Bulletin, Épidémiologique Hebdomadaire,. Available online at: http://beh.santepubliquefrance.fr/beh/2020/2-3/2020_2-3_1.html (accessed July 9, 2020).
41. Agence Régionale De Santé Guyane. Guyane. Available online at: https://www.guyane.ars.sante.fr/ (accessed July 9, 2020).
Keywords: COVID 19, epidemiology, testing, mortality, Amazon, Guiana shield, vulnerable populations
Citation: Nacher M, Rousseau C, Succo T, Andrieu A, Gaillet M, Michaud C, Servas V, Douine M, Schaub R, Adenis A, Demar M, Abboud P, Epelboin L and Djossou F (2021) The Epidemiology of COVID 19 in the Amazon and the Guianas: Similarities, Differences, and International Comparisons. Front. Public Health 9:586299. doi: 10.3389/fpubh.2021.586299
Received: 22 July 2020; Accepted: 16 February 2021;
Published: 11 March 2021.
Edited by:
Marco Iosa, Sapienza University of Rome, ItalyReviewed by:
Angela Palomba, University of Campania Luigi Vanvitelli, ItalyMoustapha Dramé, University Hospital of Martinique, Martinique
Copyright © 2021 Nacher, Rousseau, Succo, Andrieu, Gaillet, Michaud, Servas, Douine, Schaub, Adenis, Demar, Abboud, Epelboin and Djossou. This is an open-access article distributed under the terms of the Creative Commons Attribution License (CC BY). The use, distribution or reproduction in other forums is permitted, provided the original author(s) and the copyright owner(s) are credited and that the original publication in this journal is cited, in accordance with accepted academic practice. No use, distribution or reproduction is permitted which does not comply with these terms.
*Correspondence: Mathieu Nacher, bWF0aGlldS5uYWNoZXI2NkBnbWFpbC5jb20=