 Qi-Xiang Song1†
 Zhichao Jin2†
 Weilin Fang1Chenxu Zhang2Chi Peng2Min Chen3
 Xu Zhuang4
 Wei Zhai1Jun Wang5
 Min Cao6Shun Wei7
 Xia Cai8Lei Pan9Qingrong Xu10
 Junhua Zheng1*
- 1Department of Urology, Ren Ji Hospital, Shanghai Jiao Tong University School of Medicine, Shanghai, China
- 2Department of Health Statistics, Naval Medical University, Shanghai, China
- 3Department of Nursing, Ren Ji Hospital, Shanghai Jiao Tong University School of Medicine, Shanghai, China
- 4Department of Obstetrics and Gynecology, Ren Ji Hospital, Shanghai Jiao Tong University School of Medicine, Shanghai, China
- 5Department of Interventional Oncology, Ren Ji Hospital, Shanghai Jiao Tong University School of Medicine, Shanghai, China
- 6Department of Emergency, Longhua Hospital Affiliated to Shanghai University of Traditional Chinese Medicine, Shanghai, China
- 7Department of Information Center, Ren Ji Hospital, Shanghai Jiao Tong University School of Medicine, Shanghai, China
- 8BSL-3 Laboratory of Fudan University, Shanghai, China
- 9Department of Rheumatology, Ren Ji Hospital, Shanghai Jiao Tong University School of Medicine, Shanghai, China
- 10Department of Orthopedics, Ren Ji Hospital, Shanghai Jiao Tong University School of Medicine, Shanghai, China
Background: SARS-CoV-2 patients re-experiencing positive nucleic acid test results after recovery is a concerning phenomenon. Current pandemic prevention strategy demands the quarantine of all recurrently positive patients. This study provided evidence on whether quarantine is required in those patients, and predictive algorithms to detect subjects with infectious possibility.
Methods: This observational study recruited recurrently positive patients who were admitted to our shelter hospital between May 12 and June 10, 2022. The demographic and epidemiologic data was collected, and nucleic acid tests were performed daily. virus isolation was done in randomly selected cases. The group-based trajectory model was developed based on the cycle threshold (Ct) value variations. Machine learning models were validated for prediction accuracy.
Results: Among the 494 subjects, 72.04% were asymptomatic, and 23.08% had a Ct value under 30 at recurrence. Two trajectories were identified with either rapid (92.24%) or delayed (7.76%) recovery of Ct values. The latter had significantly higher incidence of comorbidities; lower Ct value at recurrence; more persistent cough; and more frequently reported close contacts infection compared with those recovered rapidly. However, negative virus isolation was reported in all selected samples. Our predictive model can efficiently discriminate those with delayed Ct value recovery and infectious potentials.
Conclusion: Quarantine seems to be unnecessary for the majority of re-positive patients who may have low transmission risks. Our predictive algorithm can screen out the suspiciously infectious individuals for quarantine. These findings may assist the enaction of SARS-CoV-2 pandemic prevention strategies regarding recurrently positive patients in the future.
Introduction
Since the late February 2022, an outbreak of severe acute respiratory syndrome coronavirus 2 (SARS-CoV-2) infection have swept Shanghai. It is estimated that from March 1 to June 10, 626,948 cases were identified, consisting 58,052 (9.26%) symptomatic cases and 588 (0.09%) death due to SARS-CoV-2 infection, according to the report from Shanghai Municipal Health Commission.
The government has initiated a series of strict and comprehensive pandemic control strategies, including the lockdown of the whole city; home-based surveillance for viral nucleic acid and antigen; and the establishment of temporary shelter hospitals for the quarantine of infected individuals, just to name a few (1). Undoubtedly, these drastic actions effectively cut off the transmission route and reduced the emerging infected cases. However, starting from May 2022, the phenomenon of an increasing number of people with recurrently positive cycle threshold (Ct) values on real-time reverse transcriptase-polymerase chain reaction (RT-PCR) assays have brought to our attention.
According to a systematic review, the incidence of recurrent SARS-CoV-2 positivity was 14.8% (2). Note that, this number is highly variable across studies, due to the different sampling approaches, hospital discharge criteria, definitions of positive nucleic acid tests and durations between hospital discharge to recurrence (2–11). Several studies have investigated the incidence rate, clinical characteristics, potential reasons and risk factors of detecting recurrently positive nucleic acid test (4–10, 12). Although most of these studies indicated that re-positive individuals are usually mildly symptomatic, with a low viral load and little risk of transmission, contradictory findings on a few recurrently cases with culturable virus have been reported (13–16). To this end, a series of concerning public health issues remain, i.e., do those patients really should be quarantined; who may pose a threat to infect the others; and who should be safe on self-monitoring?
Due to the lack of authenticated response to the above-mentioned concerns, the current pandemic prevention policy requires that anyone with recurrently positive nucleic acid test (Ct value<35) should all be readmitted to the shelter hospital for quarantine, regardless of their clinical symptoms, chest imaging manifestations and infectious potentials. While this action may indeed prevent the virus from further transmission, it considerably changes the living environment and lifestyle of both patients and their families, raising potentially psychological conditions, including sleep disorders, anxiety and depression etc. (17, 18).
We hypothesize that a predominant number of patients with recurrently positive findings on nucleic acid tests are likely to be noninfectious, and therefore, may not need mandatory quarantine. To substantiate our theory, we conducted comprehensive investigations of recurrently positive patients, including the demographic and epidemiologic features, clinical presentations, laboratory test parameters, dynamic viral RNA level variations and virus isolation. We also provided machine learning models to discern individuals who would be safe on self-monitoring, in order to avoid unnecessary quarantine.
Participants and methods
Study design and participants
We conducted a prospective observational study in a shelter hospital temporarily built at the Shanghai New International Expo Center, investigating patients with recurrently positive RT-PCR results after recuperated from the initial SARS-CoV-2 infection. With a capacity of over 14 thousand beds, our shelter hospital is designated by the government to admit recurrently positive patients across all areas of Shanghai, as well as those came from the neighboring cities. Free food, daily necessities, medical supplies and disease consultant were available to all of our patients.
On each day between May 12 through June 10, 2022, we carefully screened for patients, aged between 16 and 80, who have recovered (defines as at least two consecutive negative RT-PCR results with a 24-hour interval; no fever for 3 continuous days; and with no or mild respiratory symptoms) from the previous SARS-CoV-2 infection, but with recurrently positive RT-PCR findings several days after discharge. For each subject, nasopharyngeal swab sample was achieved with standard technique, and a positive reading was defined as the Ct value less than 35 during RT-PCR assay. Upon the detection of re-positivity, the patients were sent to our shelter hospital on the next day for quarantine. Instead of taking any antiviral agents or steroids, all patients were routinely prescribed Chinese medicine (Lianhuaqingwen granules, 6 g, thrice daily), with the purpose of regulating immune function. We excluded patients with severe symptoms and critical conditions, including dyspnea, hypoxemia, septic shock, acute respiratory distress syndrome, multiple organ dysfunction syndrome, cardiovascular and cerebrovascular accident etc. Those who refused to sign the informed consent, or failed to provide reliable epidemiologic and demographic information was deemed ineligible to participate.
This study has been approved by the ethics committee boards of Ren Ji Hospital (approval number: KY2022-114-B). The principles of the Declaration of Helsinki and Good Clinical Practice were complied with. This study was subjected to the STROBE reporting guidelines. All patients were required to sign the informed consent prior to recruitment.
Data collection
At the time of admission, the demographic and epidemiologic data was collected by well-trained healthcare professionals using a unified registration form and consolidated standard. We also elaborately investigated the possible risk of viral transmission due to recurrence and the status of patients' close contacts, by asking: “where did you live after the previous hospital discharge?”, “was there anyone close to you just turned positive during the period staying together?”. It should be mentioned that the whole city was under lockdown and all citizens were restricted in their accommodations during the studying period. Therefore, if a close contact newly turned positive, it could be probable that the infection was attributed to the recurrent subjects.
Nucleic acid tests
Nasopharyngeal swab specimens were acquired from all participants by trained nurses, staring from day 1 after admission and then each following day until criteria of recovery was reached. To detect the amount of SARS-CoV-2 RNA, RT-PCR analysis was performed by a sole clinical laboratory (Shanghai ZJ Bio-Tech Co., Ltd.) using a commercially available kit (Zhi Jiang, Shanghai, China) which is approved by the China Food and Drug Administration. The determination of positive is the Ct value less than 35 on either open reading frame (ORF) and/or nucleocapsid protein (N) genes.
Laboratory tests
Upon approval from the patients, blood tests were done on the first day morning after admission, and hematological parameters were analyzed to reflect the features of blood cells (whole blood count); liver and kidney functions; infection and immune status (lymphocyte subpopulation and procalcitonin); and metabolism and nutrition condition (albumin, glucose, 25-hydroxyvitamin D and parathyroid hormone) based on several previous publications (19–25). All serum samples were analyzed by the clinical laboratory of Ren Ji Hospital.
Virus isolation
Twenty-two subjects were randomly selected using computer generated randomization list, and a separate nasopharyngeal swab specimen was taken from each of them on day 1 after admission for the purpose of virus isolation. All samples were transferred to the BSL-3 laboratory of Fudan University (Shanghai, China) at 4°C within 6 h. The culture medium for vero-E6 cells contains 500 ml of Dulbecco's modified eagle medium, 100 U/ml of penicillin, 100 ug/ml of streptomycin and 10% fetal bovine serum (the concentration was 2% for maintenance medium for cell culture). All cells were tested to exclude contamination and were confirmed by morphological evaluation under microscopy. Similar to the previously described protocol for virus isolation, vero-E6 cells were plated to 80% confluency in 96-well plates (26). The specimens were seeded with cells and cultured at 37°C for 1 h. After washed with Hank's solution for 1–2 times, 3 ml of maintenance medium was added to each well. The cells were incubated at 37°C for 24h, followed by the observation of cytopathogenic effects each day. After 6 consecutive days, the cell suspension was harvested for quantitative RT-PCR to detect the RNA level of SARS-CoV-2.
Statistical analysis
The group-based trajectory model (GBTM) was used to identify Ct value trajectories of the included patients (27). The Ct value at each timepoint was defined as the lower one between ORF and N gene during nucleic acid test. The longitudinal Ct values were fitted by a censored normal model with polynomial function of time. To identify the optimal model, 2–6 number of groups with up to three polynomial order were considered as the alternative models. All possible combinations of the alternative models were checked. The Bayesian information criterion and Akaike information criterion were used to judge the optimal model. Some other indicators were used to determine the groups of GBTM during statistical process, including the average posterior probability (>0.7), odds of correct classification (>5), the consistency between proportion assigned to group and probability of group membership, the minimum group size (>5%) and P-value of the highest polynomial coefficient within each group (<0.05) (27).
For the prediction models, records of included patients were divided at random, with 75% for training and 25% for testing. Recursive feature elimination (RFE) was used to select the most relevant features. We employed three machine learning algorithms to develop models, including logistic regression (LR), naive Bayes (NB) and neural network (NNET). Initially, we conducted internal validation on the development sets to quantify optimism in the predictive performance and evaluate stability of the prediction model. Cross-validation resampling technique with 100 iterations was used to evaluate the internal validity for each model. All the models were assessed in multiple dimensions regarding their model performance. The median and 95% confidence intervals of area under the curve (AUC) were calculated, where an AUC value of 1.0 means perfect discrimination and 0.5 represents no discrimination. The comparisons of epidemiologic, demographic and laboratory data were made using Chi-square test for categorical variables, and t-tests or Wilcoxon rank sum tests for continuous variables. The GBTM was performed by SAS 9.4 and Stata/SE 15.1 (28, 29). The prediction models were implemented by the R caret package.
Results
From May 12 through June 10, 2022, we admitted a total of 6,611 patients to our shelter hospital (Figure 1). During the epidemiological surveys, 585 patients with recurrently positive nucleic acid test results were identified. Among them, we excluded 91 subjects, including 9 refused to participate; 10 children under 16; 3 with severe symptoms and critical systematic conditions; and 69 with incomplete documentation. Subsequently, 494 subjects were enrolled for the analysis.
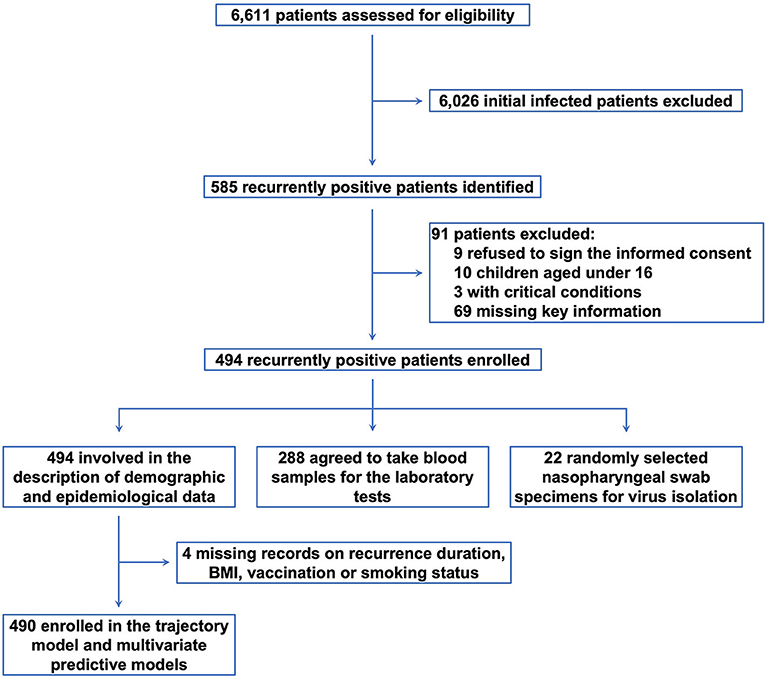
Figure 1. The study diagram. From May 12 through June 10, 2022, we identified 6,611 patients with SARS-CoV-2. After excluding 6,026 patients with initial infection and 91 ineligible participants, 494 subjects were enrolled for the analysis.
The demographic and epidemiologic characteristics
We suggested that there were 62.75% of patients aged below 50, with male took up 64.37% of the total recruitment, 46.56% reported overweight or obese, and 32.99% current smokers (Table 1). The majority were vaccinated and 83.91% had taken at least 2 injections of vaccines. About 24.49% reported systematic comorbidities, there into, hypertension was the most prevalent, followed by diabetes and basic respiratory diseases.
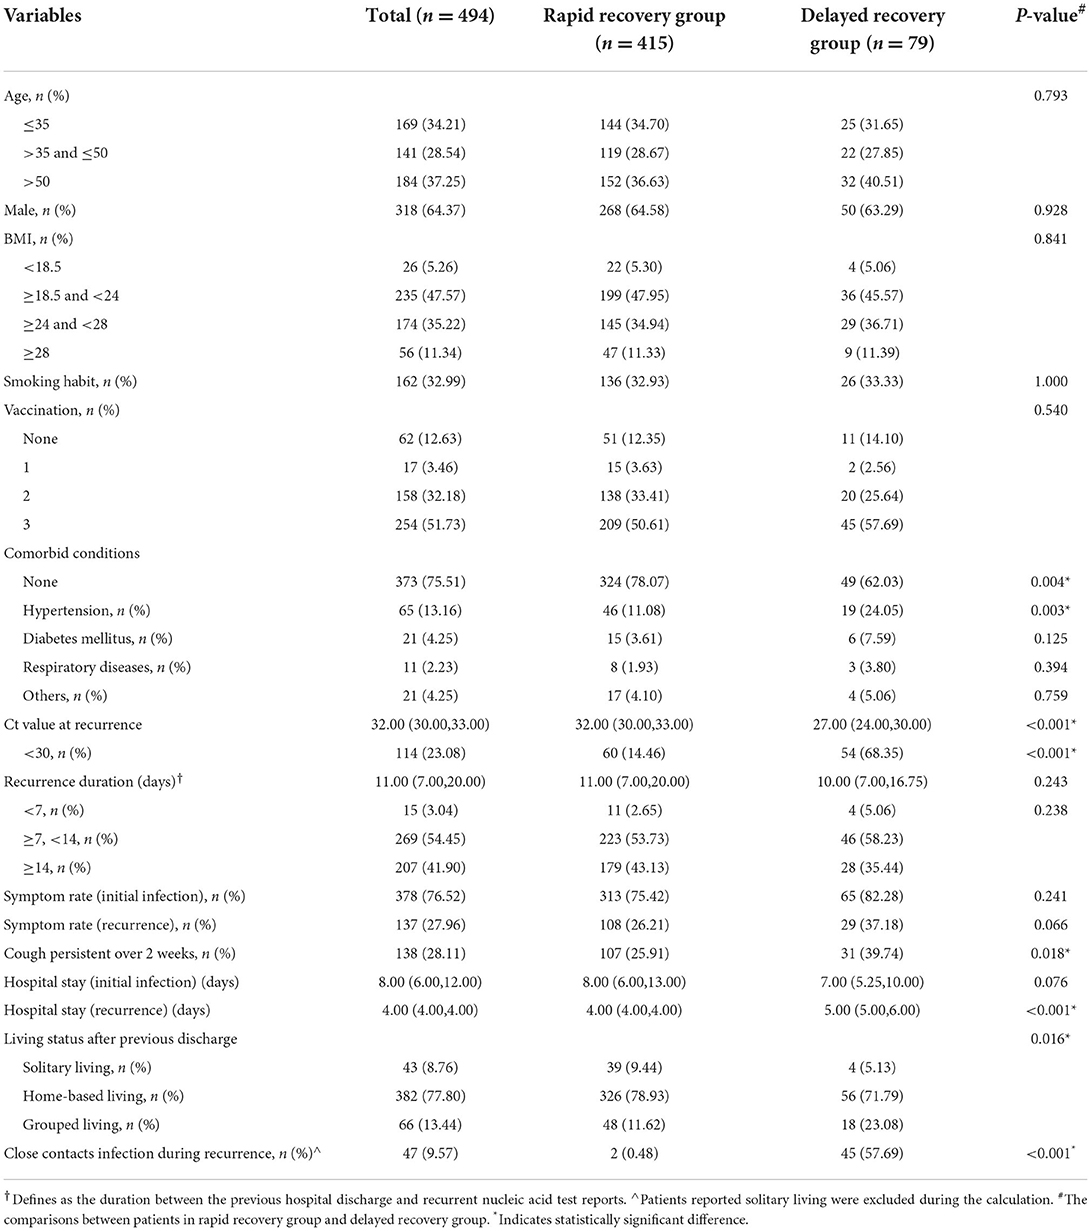
Table 1. Demographic and epidemiologic characteristics.
The median duration between the previous hospital discharge and recurrent nucleic acid test reports was 11 days (96.35% had an at least 7-day interval), and the median Ct value at recurrence was 32 (with 23.08% below 30). Note that, the hospitalization period was dramatically reduced during the second admission due to recurrence. Besides, comparing with the clinical presentations during initial infection, the proportions of overall symptomatic individuals and each detailed symptom category were remarkably lower at recurrence (Supplementary Figure 1). The investigations on subjects living with their families at home (77.80%) or in group dormitories (13.44%), uncovered a possible infection rate of (9.57%) in their close contacts during the period living together.
The comparisons between the two groups with distinct Ct value recovery pattern
Noteworthily, as high as 84.01% of the recurrently positive subjects achieved two consecutive negative results on the first and second nucleic acid tests after admission (rapid recovery group). In contrast, 15.99% presented sluggish or fluctuated Ct value with at least one positive result during the first two tests in the hospital (delayed recovery group). The comparisons between these two groups demonstrated that the subjects in delayed recovery group had significantly higher incidence of comorbidities, particularly hypertension (P = 0.004 and 0.003, respectively); lower Ct value at recurrence (P < 0.001); more likely to have persistent cough symptom (P < 0.018); and more frequently reported close contacts infection (P < 0.001) compared with that in rapid recovery group.
The group-based trajectory model analysis
Two trajectories were distinguished by the GBTM analysis (Figure 2), i.e. group 1 (92.2% [452 of 490]) demonstrates a higher baseline Ct value (31.93[30.28, 33.08]) which promptly and persistently returns to negative at day 1 after admission (resembles the rapid recovery group); and group 2 (7.8% [38 of 490]) demonstrates a lower baseline Ct value (25.21[22.30, 27.63]) which steadily and wavily climbs back to normal after day 3 (resembles the delayed recovery group). Echoing the comparisons between the rapid and delayed recovery group, patients in group 2 demonstrated significantly higher incidence of overall comorbidities (P = 0.007), hypertension (P < 0.001) and diabetes mellitus (P = 0.017); more symptoms, especially persistent cough (P = 0.043 and 0.047, respectively); longer hospitalization (P < 0.001); and more frequently reported close contacts infection (P < 0.001) in contrast with that in group 1 (Table 2). In addition, the abnormal rate of each laboratory test parameter between the two groups was compared (Supplementary Table 1), suggesting little notably difference, except for more frequent abnormal outcomes on percentage of monocyte (P < 0.001), C-reaction protein (P = 0.036) and serum amyloid A (P = 0.011) in group 2, possibly reflecting a more pronounced immune response in patients with delayed recovery of Ct value.
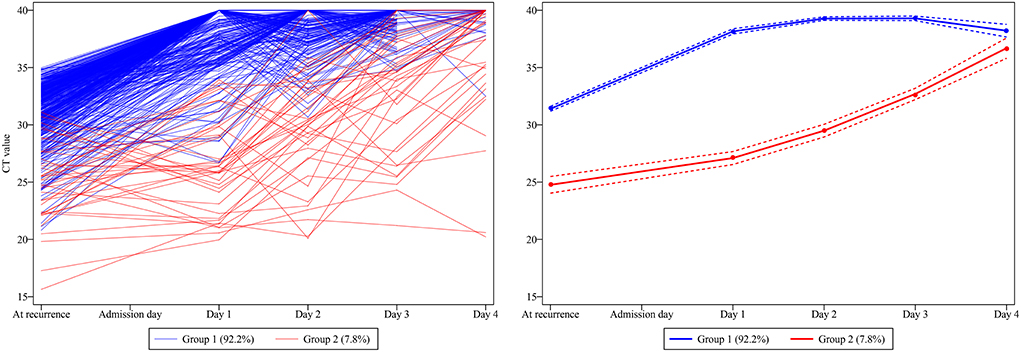
Figure 2. The development of trajectory groups based on the dynamic Ct value traces. Two Ct value trajectories were distinguished, namely group 1 (92.2% [452 of 490]), demonstrates a higher baseline Ct value which promptly and persistently turns to negative from day 1 after admission; and group 2 (7.8% [38 of 490]), demonstrates a lower baseline Ct value which steadily and wavily climbs back to normal after day 3.
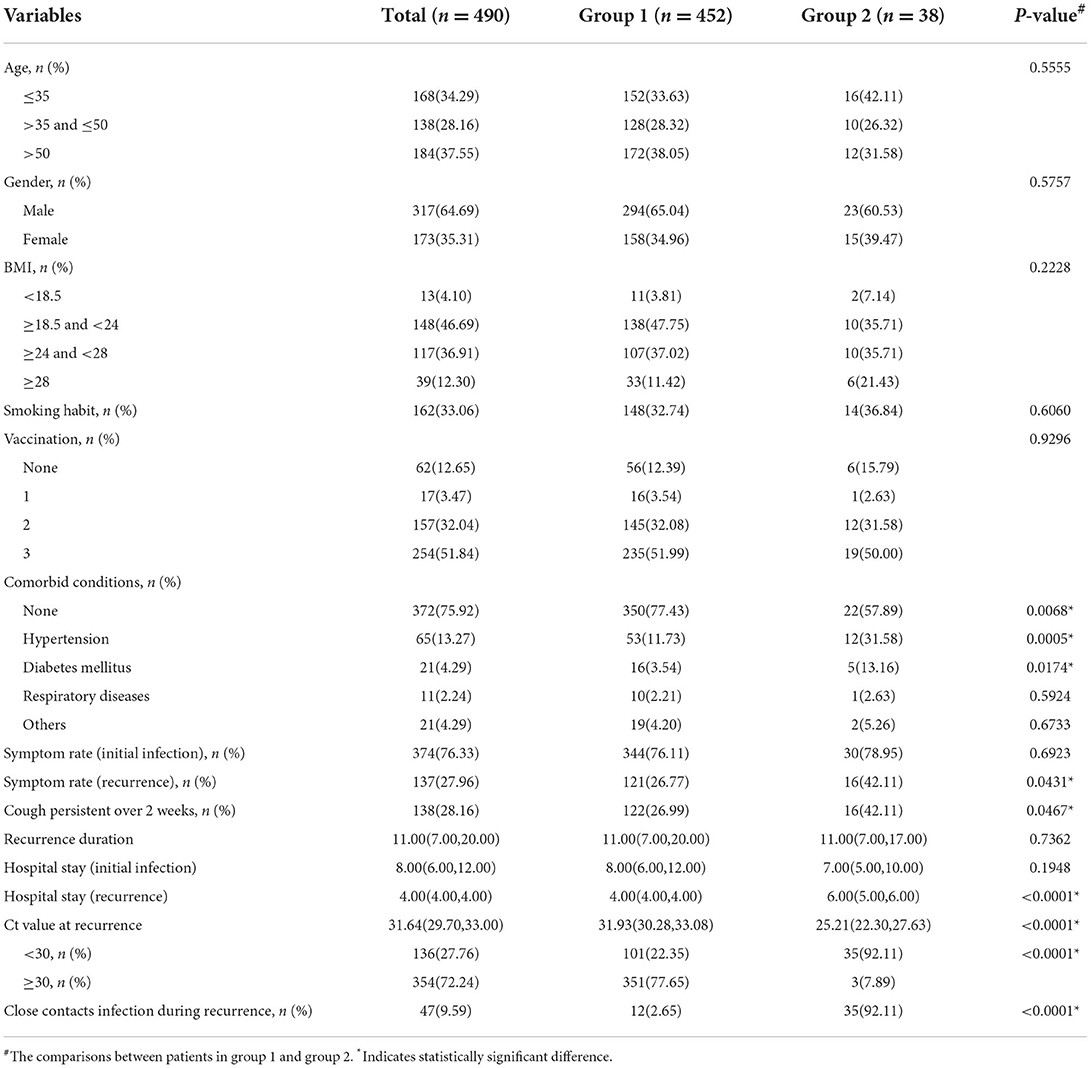
Table 2. The comparisons between the two trajectory groups.
The development and validation of machine learning model
Machine learning models were developed and validated to predict the presentation of two consecutive negative nucleic acid test results immediately after admission (represents the rapid recovery feature). Fifteen predictors were extracted from the database, and 5 most important predictors (Ct value at recurrence, recurrence duration, hypertension, vaccination status and persistent cough over 2 weeks) were eventually selected using the RFE algorithm. Within the training set, the LR, NB, NNET and RAW (consisting Ct values at recurrence only) models were trained. The testing set obtained AUCs of 0.844, 0.876, 0.815, and 0.829, respectively (Figure 3A and Supplementary Table 2). Comparatively, the NB model shows the highest predictive performance among these models (AUC 0.876, 95% CI: 0.805–0.929). The calibration curves (Figures 3B–D) showed that all models performed quite well (p > 0.05). Additionally, a visualized and publicly accessible online calculator based on the NNET model was built (https://pengchi2009.shinyapps.io/Predict_negative/). The web server can generate an estimated negative probability by entering the covariates of the prediction model. Patients with a probability over 0.5 may demonstrate rapid Ct value recovery feature and little transmission risk, so that quarantine might be avoided.
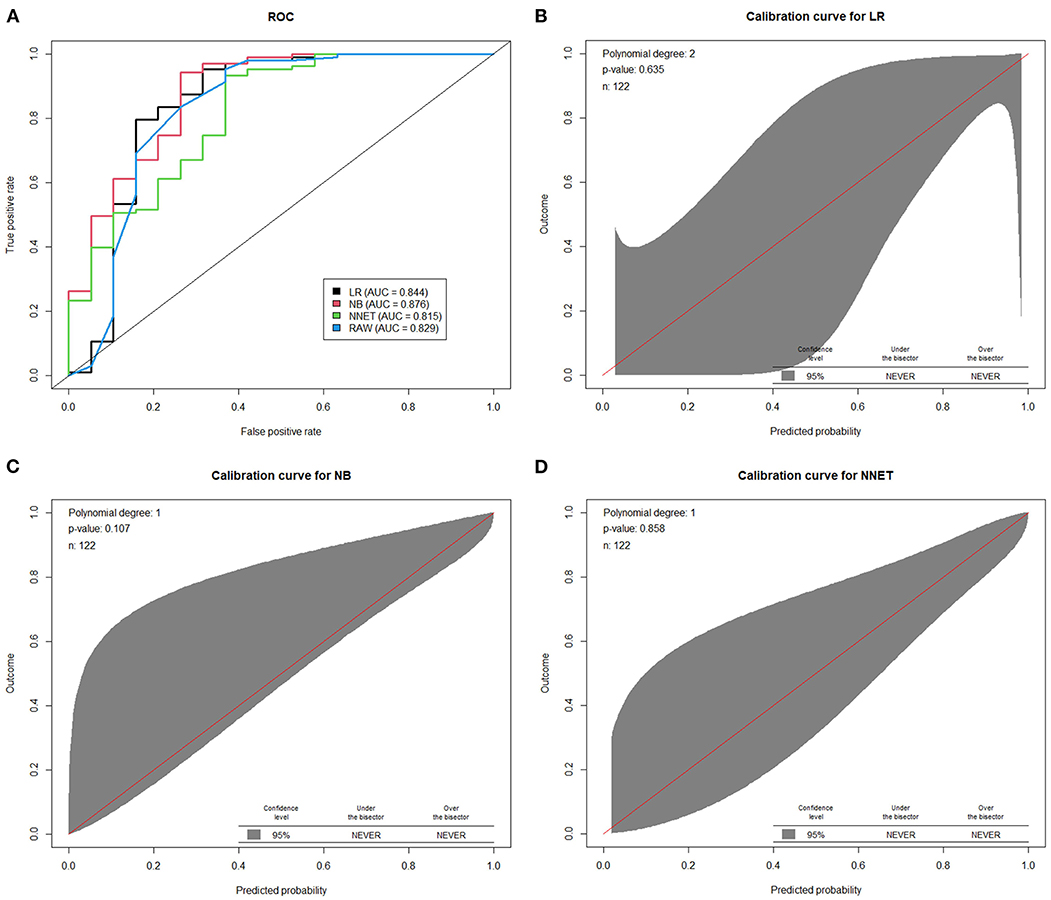
Figure 3. The performance of machine learning models in the validation cohort. (A) Area under the curve of receiver operating characteristic curve by prediction models in the validation cohort. The calibration curves of logistic regression model (B) random forest model (C) and artificial neural network model (D) were presented. LR, logistic regression; BN, naive Bayes; NNET, artificial neural network; RAW, only Ct value at recurrence was included in the model.
The virus isolation
To further evaluate the infectivity of the recurrently positive patients, virus isolation was performed on specimens from 22 randomly selected subjects, whose Ct value was ranged from 26 to 34 (Table 3). No cytopathogenic effect was observed during cell culture. Negative virus isolation results were f ound in all samples, as corroborated by testing SARS-CoV-2 RNA in the culture supernatants.
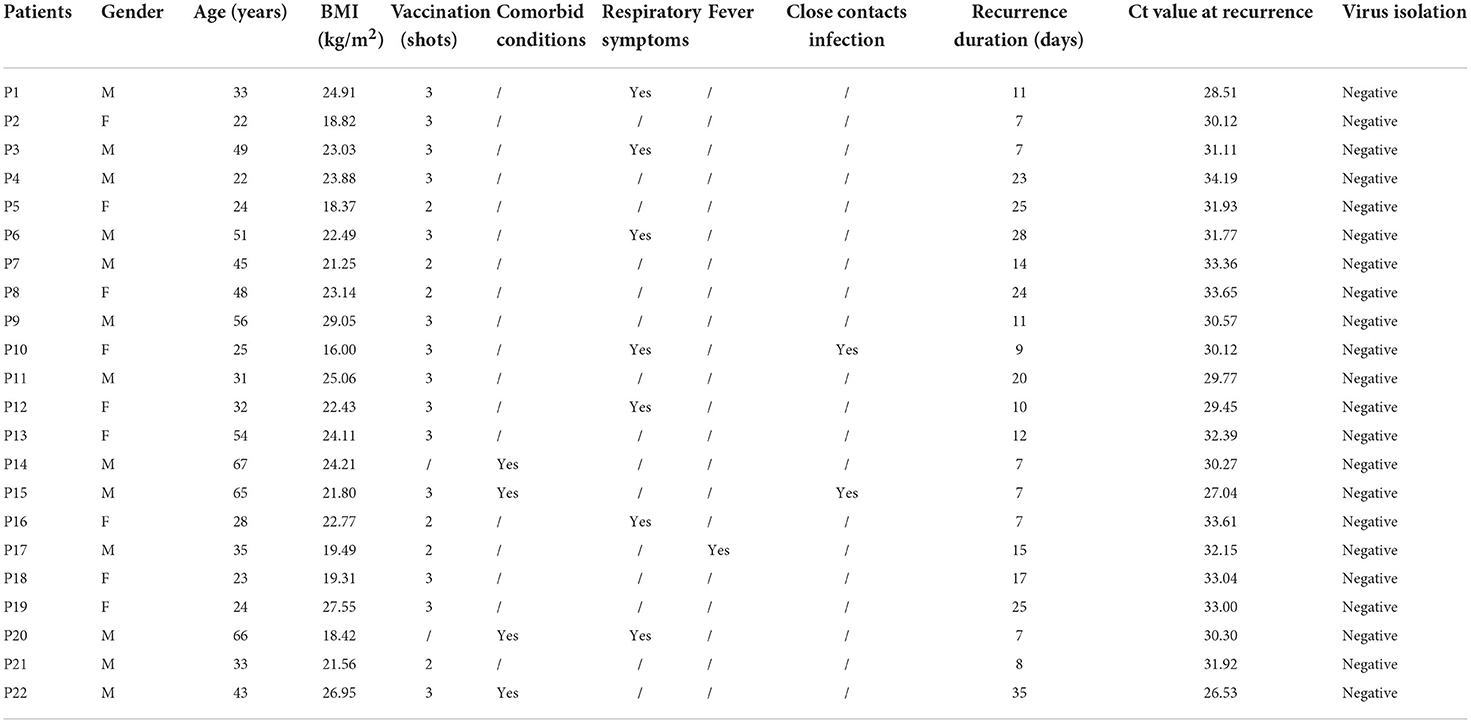
Table 3. Characteristics of randomly selected patients for virus isolation.
Discussion
As an imperative public health issue, the phenomenon of recurrently positive nucleic acid test in patients with SARS-CoV-2 has raised considerations of researchers, residents and policy makers worldwide (12, 15, 16). However, “recurrently positive” is a rather vague term, and its causes still remain to be elucidated. Beyond doubt, de novo reinfection is one of the plausible explanations, as evidenced by the detection of phylogenetically distinct genomic sequence in the first and second infection episodes in one symptomatic RT-PCR re-positive case (13). Debatably, Young et al. argued that the recurrently positive patients only contains non-infectious virus genomic fragments, which may intermittently or continuously secret low-level of viral RNA, leading to fluctuated RT-PCR results (30). Some others believe that the hospital discharge based on false negative readings may be another cause of seemingly re-positivity at later timepoints, including but not limited to the undetected virus in the lung by regular sampling means; insufficient amount of specimen; non-standard sample transportation and laboratory errors (31, 32). Therefore, this study was intended to address the unmet needs of this multifactorial phenomenon, providing evidence on whether patients re-experiencing positive nucleic acid test could have infectious potentials and need to be quarantined. We also strived to propose machine learning algorithms to screen out subjects who would be safe on self-monitoring.
The major characteristics of the recruited subjects were mostly young to middle-aged, mildly symptomatic and well vaccinated. We demonstrated that a multitude of recruited subjects promptly reached negative results on the first two nucleic acid tests after admission, suggesting quarantine may be redundant in these patients. However, we did aware that a small proportion demonstrated delayed and labile Ct value restoration, simultaneously with the more frequent report of close contacts infection during recurrence, indicating that these subjects may need quarantine.
In conformity with the grouping based on the first two Ct values after admission, the two trajectories identified by the GBTM analysis perfectly resembled the features of the rapid and delayed recovery groups, confirming that the latter has a significantly lower Ct value at recurrence, with more symptoms and comorbidities, and could pose a threat to infect the others according to our epidemiological survey. In order to pick out those with delayed recovery features for quarantine, we developed machine learning algorithms, using only five simple indices, to predict the Ct value recovery patterns after recurrence with high performance. With the proposed calculator, healthcare-professionals are able to efficiently and feasibly differentiate individuals who needs to quarantine and who can be put on self-monitoring.
Unfortunately, negative virus isolation was reported for all selected samples, even in those two reported close contacts infection. Exiting evidence suggests that a positive RT-PCR test result does not necessarily translate to infectivity, as it fails to distinguish viral replication from non-infectious nucleic acid residues. When the viral RNA concentration under 5.4 log10 copies/ml, there only less than 5% successful rate in viral isolation (33). Yang et al. revealed that 96% of recurrently positive patients had a maximum viral concentration of <5 log10 copies/ml (30). As a result, consistently, several studies have reported negative outcomes in virus isolation in recurrently positive patients, indicating that the rebound Ct values is likely to be the amplification of dead virus remaining during RT-PCT, rather than reinfection or reactivation of virus (30, 34, 35). Together, these evidence further support our hypothesis that most of the patients with re-positivity have a low transmission risk and quarantine can only be reserved for the suspicious cases as discriminated by the predictive model.
There are some limitations to consider when interpreting the results. To begin with, as a single-centered study, our analysis could be subjected to potential bias, even with a robust sample size. However, it should be noted that ours was the biggest shelter hospital in Shanghai during the studying period, and was the main designated hospital to treat recurrently positive patients from all areas of the city. Secondly, this study primarily centered on subjects aged between 16 and 80, without severe symptoms. Thus, the analysis and proposed predictive model may not be applied to children and those with recurrently critical SARS-CoV-2 infection. Furthermore, virus isolation was only done at a single timepoint in randomly selected subjects. Plus, the success rate could be compromised by several uncertainties during transportation, preservation and sample handling. Although with standard technique and seasoned experience in virologic studies, the negative outcomes in virus isolation should still be interpreted with caution, as sporadic recurrently cases with culturable virus have been reported (13, 14). Herewith, these ambiguities highlight the usefulness of applying our predictive model to discriminate the suspiciously contagious individuals to quarantine.
In conclusion, quarantine in shelter hospitals seems to be unnecessary for a substantial proportion of patients experiencing recurrently positive nucleic acid test after initial recovery from SARS-CoV-2 infection, as evidenced by their mild symptoms, rapid Ct value recovery and negative virus isolation results. However, attentions must be paid to those with delayed Ct value restoring trace, who tend to have comorbidities, persistent cough symptoms, and are likely to be infectious based on the epidemiological investigations, even though affirmative virologic evidence is lacking at the present stage. To assist the selection of the suspiciously infectious individuals for quarantine, we further proposed machine learning models using 5 simple indices, and achieved high predictive performance. The outcomes from this study may provide useful evidence for the enaction of SARS-CoV-2 pandemic prevention strategies regarding recurrently positive patients in the future.
Data availability statement
The raw data supporting the conclusions of this article will be made available by the authors, without undue reservation.
Ethics statement
The studies involving human participants were reviewed and approved by the Ethics Committee Boards of Ren Ji Hospital. The patients/participants provided their written informed consent to participate in this study.
Author contributions
Q-XS and JZ designed the study, vouch for the integrity, and accuracy of the data. ZJ and WF assisted the revision of the study protocol. Q-XS, WF, CZ, CP, MCh, XZ, WZ, JW, MCa, SW, and LP participated in the assessment, sampling, and data collection. ZJ, CZ, and CP conducted the statistical analysis and developed the predictive algorithms. XC performed the virus isolation experiments. Q-XS and ZJ interpreted the results and drafted the manuscript. QX and JZ critically revised the manuscript. All authors have approved the final version of the manuscript.
Acknowledgments
The authors would like to extent our sincere gratitude to all the frontline doctors, nurses and caregivers who have marched along our side in this battle against the SARS-CoV-2. During the those arduous months, we gave up so much on our beloved ones, we fought against all odds to save lives, and we worked without taking a single day off in despite of great probability of infection. Just as Mahatma Gandhi said, Bravery on the battlefield is impossible for us, bravery of the soul still remains open to us. WE ARE THE TRUE HEROS OF THE SHANGHAI CITY!
Conflict of interest
The authors declare that the research was conducted in the absence of any commercial or financial relationships that could be construed as a potential conflict of interest.
Publisher's note
All claims expressed in this article are solely those of the authors and do not necessarily represent those of their affiliated organizations, or those of the publisher, the editors and the reviewers. Any product that may be evaluated in this article, or claim that may be made by its manufacturer, is not guaranteed or endorsed by the publisher.
Supplementary material
The Supplementary Material for this article can be found online at: https://www.frontiersin.org/articles/10.3389/fpubh.2022.1011277/full#supplementary-material
Supplementary Figure 1. The percentage of overall and each detailed symptom during the initial infection and at recurrence.
Supplementary Table 1. Comparisons of abnormal rate of each laboratory test parameter in patients between the two trajectory groups. #The comparisons between patients in group 1 and group 2. *Indicates statistically significant difference.
Supplementary Table 2. Detailed parameters of the machine learning models. AUC, area under the curve; CI, confidence interval; LR, logistic regression; NNET, neural network; NPV, negative predictive value; PPV, positive predictive value; RAW, the predictive model using cycle threshold value at recurrence only; RF, random forest regression.
References
1. Zhang X, Zhang W, Chen S. Shanghai's life-saving efforts against the current omicron wave of the COVID-19 pandemic. Lancet. (2022) 399:2011–2. doi: 10.1016/S0140-6736(22)00838-8
2. Azam M, Sulistiana R, Ratnawati M, Fibriana AI, Bahrudin U, Widyaningrum D, et al. Recurrent SARS-CoV-2 RNA positivity after COVID-19: a systematic review and meta-analysis. Sci Rep. (2020) 10:20692. doi: 10.1038/s41598-020-77739-y
3. Gao C, Zhu L, Jin CC, Tong YX, Xiao AT, Zhang S, et al. Prevalence and impact factors of recurrent positive SARS-CoV-2 detection in 599 hospitalized COVID-19 patients. Clin Microbiol Infect. (2021) 27:7851–e1. doi: 10.1016/j.cmi.2021.01.028
4. Zou Y, Wang BR, Sun L, Xu S, Kong YG, Shen LJ, et al. The issue of recurrently positive patients who recovered from COVID-19 according to the current discharge criteria: investigation of patients from multiple medical institutions in Wuhan, China. J Infect Dis. (2020) 222:1784–8. doi: 10.1093/infdis/jiaa301
5. Chen Z, Xie W, Ge Z, Wang Y, Zhao H, Wang J, et al. Reactivation of SARS-CoV-2 infection following recovery from COVID-19. J Infect Public Health. (2021) 14:620–7. doi: 10.1016/j.jiph.2021.02.002
6. Hu R, Jiang Z, Gao H, Huang D, Jiang D, Chen F, et al. Transcriptase-polymerase chain reaction results for coronavirus disease 2019 in patients discharged from a hospital in China. JAMA Netw Open. (2020) 3:e2010475. doi: 10.1001/jamanetworkopen.2020.10475
7. Shui TJ, Li C, Liu HB, Chen X, Zhang BK. Characteristics of recovered COVID-19 patients with recurrent positive RT-PCR findings in Wuhan, China: a retrospective study. BMC Infect Dis. (2020) 20:749. doi: 10.1186/s12879-020-05463-z
8. Yuan J, Kou S, Liang Y, Zeng J, Pan Y, Liu L, et al. Polymerase chain reaction assays reverted to positive in 25 discharged patients with COVID-19. Clin Infect Dis. (2020) 71:2230–2. doi: 10.1093/cid/ciaa398
9. Zhao H, Zhang C, Chen XX, Zhu Q, Huang WX, Zeng YL, et al. The relationship between SARS-CoV-2 RNA positive duration and the risk of recurrent positive. Infect Dis Poverty. (2021) 10:45. doi: 10.1186/s40249-021-00831-6
10. Zheng J, Zhou R, Chen F, Tang G, Wu K, Li F, et al. Incidence, clinical course and risk factor for recurrent PCR positivity in discharged COVID-19 patients in Guangzhou, China: a prospective cohort study. PLoS Negl Trop Dis. (2020) 14:e0008648. doi: 10.1371/journal.pntd.0008648
11. Vancsa S, Dembrovszky F, Farkas N, Szako L, Teutsch B, Bunduc S, et al. Repeated SARS-CoV-2 positivity: analysis of 123 cases. Viruses. (2021) 13:512. doi: 10.3390/v13030512
12. Lan L, Xu D, Ye G, Xia C, Wang S, Li Y, et al. Positive RT-PCR test results in patients recovered from COVID-19. JAMA. (2020) 323:1502–3. doi: 10.1001/jama.2020.2783
13. Adrielle Dos Santos L, Filho PGG, Silva AMF, Santos JVG, Santos DS, et al. (2021). Recurrent COVID-19 including evidence of reinfection and enhanced severity in thirty Brazilian healthcare workers. J Infect. 82, 399–406. doi: 10.1016/j.jinf.2021.01.020
14. Li Q, Zheng XS, Shen XR, Si HR, Wang X, Wang Q, et al. Prolonged shedding of severe acute respiratory syndrome coronavirus 2 in patients with COVID-19. Emerg Microbes Infect. (2020) 9:2571–7. doi: 10.1080/22221751.2020.1852058
15. Li Y, Ji D, Cai W, Hu Y, Bai Y, Wu J, et al. Clinical characteristics, cause analysis and infectivity of COVID-19 nucleic acid repositive patients: a literature review. J Med Virol. (2021) 93:1288–95. doi: 10.1002/jmv.26491
16. Song KH, Kim DM, Lee H, Ham SY, Oh SM, Jeong H, et al. Dynamics of viral load and anti-SARS-CoV-2 antibodies in patients with positive RT-PCR results after recovery from COVID-19. Korean J Intern Med. (2021) 36:11–4. doi: 10.3904/kjim.2020.325
17. Gu Y, Zhu Y, Xu F, Xi J, Xu G. Factors associated with mental health outcomes among patients with COVID-19 treated in the Fangcang shelter hospital in China. Asia Pac Psychiatry. (2021) 13:e12443. doi: 10.1111/appy.12443
18. Zhang GY, Liu Q, Lin JY, Yan L, Shen L, Mental SiTM, et al. health outcomes among patients from Fangcang shelter hospitals exposed to coronavirus disease 2019: An observational cross-sectional study. Chronic Dis Transl Med. (2021) 7:57–64. doi: 10.1016/j.cdtm.2020.12.001
19. Djakpo DK, Wang Z, Zhang R, Chen X, Chen P, Antoine M, et al. Blood routine test in mild and common 2019 coronavirus (COVID-19) patients. Biosci Rep. (2020) 40:8. doi: 10.1042/BSR20200817
20. Lee JJ, Montazerin SM, Jamil A, Jamil U, Marszalek J, Chuang ML, et al. Association between red blood cell distribution width and mortality and severity among patients with COVID-19: a systematic review and meta-analysis. J Med Virol. (2021) 93:2513–22. doi: 10.1002/jmv.26797
21. Mao J, Dai R, Du RC, Zhu Y, Shui LP, Luo XH, et al. Hematologic changes predict clinical outcome in recovered patients with COVID-19. Ann Hematol. (2021) 100:675–89. doi: 10.1007/s00277-021-04426-x
22. Giron-Perez DA, Benitez-Trinidad AB, Ruiz-Manzano RA, Toledo-Ibarra GA, Ventura-Ramon GH, Covantes-Rosales CE, et al. Correlation of hematological parameters and cycle threshold in ambulatory patients with SARS-CoV-2 infection. Int J Lab Hematol. (2021) 43:873–80. doi: 10.1111/ijlh.13606
23. Ouyang SM, Zhu HQ, Xie YN, Zou ZS, Zuo HM, Rao YW, et al. Temporal changes in laboratory markers of survivors and non-survivors of adult inpatients with COVID-19. BMC Infect Dis. (2020) 20:952. doi: 10.1186/s12879-020-05678-0
24. Murdaca G, Di Gioacchino M, Greco M, Borro M, Paladin F, Petrarca C, et al. Basophils and mast cells in COVID-19 pathogenesis. Cells. (2021) 10:2754. doi: 10.3390/cells10102754
25. Azab SM, Zytoon AA, Kasemy ZAA, Omar SF, Ewida SF, Sakr KA, et al. Learning from pathophysiological aspects of COVID-19 clinical, laboratory, and high-resolution CT features: a retrospective analysis of 128 cases by disease severity. Emerg Radiol. (2021) 28:453–67. doi: 10.1007/s10140-020-01875-1
26. Zhou P, Yang XL, Wang XG, Hu B, Zhang L, Zhang W, et al. pneumonia outbreak associated with a new coronavirus of probable bat origin. Nature. (2020) 579:270–3. doi: 10.1038/s41586-020-2012-7
28. Jones B, Nagin D, Roeder KASAS. Procedure based on mixture models for estimating developmental trajectories. Sociol Methods Res. (2001) 29:374–93. doi: 10.1177/0049124101029003005
29. Bobby L, Daniel SA. Note on a stata plugin for estimating group-based trajectory models. Soc Methods Res. (2013) 42:608–13. doi: 10.1177/0049124113503141
30. Yang C, Jiang M, Wang X, Tang X, Fang S, Li H, et al. (2020). Viral RNA level, serum antibody responses, and transmission risk in recovered COVID-19 patients with recurrent positive SARS-CoV-2 RNA test results: a population-based observational cohort study. Emerg Microbes Infect. 9, 2368–2378. doi: 10.1080/22221751.2020.1837018
31. Yao XH, He ZC, Li TY, Zhang HR, Wang Y, Mou H, et al. Pathological evidence for residual SARS-CoV-2 in pulmonary tissues of a ready-for-discharge patient. Cell Res. (2020) 30:541–3. doi: 10.1038/s41422-020-0318-5
32. Li Y, Yao L, Li J, Chen L, Song Y, Cai Z, et al. Stability issues of RT-PCR testing of SARS-CoV-2 for hospitalized patients clinically diagnosed with COVID-19. J Med Virol. (2020) 92:903–8. doi: 10.1002/jmv.25786
33. Wolfel R, Corman VM, Guggemos W, Seilmaier M, Zange S, Muller MA, et al. Virological assessment of hospitalized patients with COVID-2019. Nature. (2020) 581:465–9. doi: 10.1038/s41586-020-2196-x
34. Kang YJ. South Korea's COVID-19 infection status: from the perspective of re-positive test results after viral clearance evidenced by negative test results. Disaster Med Public Health Prep. (2020) 14:762–4. doi: 10.1017/dmp.2020.168
Keywords: SARS-CoV-2, recurrently positive, nucleic acid test, viral load, virus isolation, infectivity
Citation: Song Q-X, Jin Z, Fang W, Zhang C, Peng C, Chen M, Zhuang X, Zhai W, Wang J, Cao M, Wei S, Cai X, Pan L, Xu Q and Zheng J (2022) The machine learning model based on trajectory analysis of ribonucleic acid test results predicts the necessity of quarantine in recurrently positive patients with SARS-CoV-2 infection. Front. Public Health 10:1011277. doi: 10.3389/fpubh.2022.1011277
Received: 04 August 2022; Accepted: 20 September 2022;
Published: 17 November 2022.
Edited by:
Jian Wu, Suzhou Municipal Hospital, ChinaReviewed by:
Ze Xiang, Zhejiang University, ChinaYuzhu Dai, The 903th Hospital of the People's Liberation Army, China
Copyright © 2022 Song, Jin, Fang, Zhang, Peng, Chen, Zhuang, Zhai, Wang, Cao, Wei, Cai, Pan, Xu and Zheng. This is an open-access article distributed under the terms of the Creative Commons Attribution License (CC BY). The use, distribution or reproduction in other forums is permitted, provided the original author(s) and the copyright owner(s) are credited and that the original publication in this journal is cited, in accordance with accepted academic practice. No use, distribution or reproduction is permitted which does not comply with these terms.
*Correspondence: Junhua Zheng, emhlbmdqaDA0NzFAc2luYS5jb20=
†These authors have contributed equally to this work