 Weikang Wu1,2†
 Xiaojie Yuan1†
 Weilu Zhang1†
 Haowei Zhou1
 Xiangyu Kong1Zhen He1
 Ting Fu1Wenhua Zhang3Wenling Jia3Chunhui Liang3Haitao Tang3Fengmei Wang3Yancheng Ye4*
 Zhongjun Shao1*
 Zhaohua Ji1*
- 1Ministry of Education Key Lab of Hazard Assessment and Control in Special Operational Environment, Department of Epidemiology, School of Public Health, Air Force Medical University, Xi'an, China
- 2Gansu University of Chinese Medicine, Lanzhou, China
- 3Hepatobiliary Center, Wuwei Cancer Hospital of Gansu Province, Wuwei, China
- 4Clinical Drug Experiment Institution, Wuwei Cancer Hospital of Gansu Province, Wuwei, China
Background and aim: Chronic hepatitis B (CHB) can be divided into immune tolerance (IT), immune clearance (IC), hepatitis B e antigen (HBeAg)-negative inactive/quiescent carrier (ENQ), and HBeAg-negative hepatitis (ENH) phases. The conventional biomarkers used to distinguish these phases have limitations. We examined the clinical significance of hepatitis B virus (HBV) RNA and hepatitis B core-related antigen (HBcrAg) as novel biomarkers.
Methods: One hundred eighty-nine patients without treatment currently were categorized by CHB phase (IT = 46, IC = 45, ENQ = 49, ENH = 49). The associations of HBV RNA and HBcrAg with HBV DNA and alanine transaminase (ALT) were analyzed. The decision tree model was used to distinguish the four phases in the natural course of CHB.
Results: The concentrations of HBV RNA and HBcrAg were highest in the IT and IC phases (P < 0.01). Serum HBV RNA was similar to HBcrAg in treatment-naïve patients. HBV RNA and HBcrAg correlated with HBV DNA in the HBeAg+ and HBeAg− status (HBV RNA: e+ r = 0.51, e− r = 0.62; HBcrAg: e+ r = 0.51, e− r = 0.71), but their association with HBV DNA differed among phases. The accuracy, sensitivity, and specificity of HBcrAg with ALT in distinguishing the CHB phases were 95.65%, 95.83%, and 95.55%, respectively.
Conclusion: Serum HBV RNA and HBcrAg may be useful to monitor CHB progression.
Introduction
Chronic hepatitis B (CHB) is such a global health burden that influenced 296 million people worldwide in 2019, with 1.5 million new infections annually (1). Accurate identification of the phases of CHB is important for providing prognostic advice, monitoring disease activity, and determining treatment requirements (2). According to guidelines CHB can be classified into four phases: immune tolerance (IT), immune clearance (IC), hepatitis B e antigen (HBeAg)-negative inactive/quiescent carrier (ENQ), and HBeAg-negative hepatitis (ENH) was based on (hepatitis B surface antigen [HBsAg] and HBeAg), HBV DNA, biochemical tests (alanine transaminase [ALT], and liver biopsy) (3–5).
However, these methods are limited in their ability to distinguish between the phases of CHB. Firstly, to increase the distinction accuracy, serum HBV DNA and ALT are repeatedly monitored; however, this may result in patients not being treated in time (6, 7). Secondly, for HBeAg-negative patients with a normal ALT concentration, a liver biopsy is required to determine the degree of fibrosis or necrotizing inflammation (8, 9), however, liver biopsy is not acceptable for patients without obvious symptoms. Thirdly, although an increasing number of studies have reported that the HBsAg concentration varies significantly among the phases of CHB and provide insight into the HBV life cycle, effective diagnostic parameters to evaluate the clinical application of HBsAg are still lacking (7, 8). In addition, according to previous guidelines, five indicators of HBsAg, HBeAg, HBV DNA, ALT and liver disease or even a combination of eight indicators are required to distinguish the four phases of chronic hepatitis B (5, 10). Therefore, a more applicable and simpler predictive model is needed.
Many studies have shown that two novel HBV biomarkers, including HBV RNA and HBcrAg, these biomarkers are closely related to other conventional markers, and they may be useful to distinguish the natural course of CHB and monitor disease progression (11–13). A recent study suggested that HBV RNA in serum represents pregenome RNA (pgRNA), which is partially reverse transcribed and encapsulated in virus-like particles (14). Given that pgRNA is transcribed directly from covalently closed circular DNA (cccDNA), the HBV RNA concentration may serve as a surrogate marker for transcriptionally active cccDNA (15). HBcrAg is a composite biomarker that incorporates several viral antigens expressed from the HBV pre-core/core gene, including the hepatitis B core antigen (HBcAg), HBeAg, and p22 core-related antigen. In a previous study, HBcrAg was positively correlated with the intrahepatic cccDNA concentration and the serum HBV DNA concentration (16). Some studies, as well as clinical guidelines for the treatment of CHB, have suggested that the concentrations of serum HBV RNA and HBcrAg should be used to monitor the course of CHB and to determine prognosis (10, 17, 18), but there is no exact cutoff value to distinguish the CHB phases.
In this study, we aimed to examine the distribution of serum HBV RNA and HBcrAg concentrations in CHB patients without treatment currently in different phases to explore the clinical significance of these two novel HBV biomarkers and their predictive value in distinguishing the four phases of CHB.
Materials and methods
Patients
A total of 189 CHB patients without treatment currently were enrolled from a cohort of 3,962 participants with CHB in Wuwei from 2018 to 2021. Four phases of CHB were distinguished according to HBV DNA and serum alanine aminotransferase (ALT), together with the HBeAg/hepatitis B e antibody status (5, 10). HBeAg-positive (e+) participants were categorized as immune-tolerant (IT [e+]) if the HBV DNA concentration was ≥2 × 10⁷ log10 IU/mL and the ALT concentration was normal, or as HBeAg-positive active immune hepatitis (IC [e+]) if the HBV DNA concentration was >2 × 10⁴ log10 IU/mL and the ALT concentration was elevated. HBeAg-negative (e−) participants were categorized as having inactive CHB (ENQ [e−]) if the HBV DNA concentration was ≤2 × 10³ log10 IU/mL and the ALT concentration was normal, and as HBeAg-negative reactive hepatitis (ENH [e−]) if the HBV DNA concentration was ≥2 × 10³ log10 IU/mL and the ALT concentration was elevated. The exclusion criteria were as follows: alcoholic liver disease; liver damage caused by drugs or alcohol; infection with hepatitis A virus, hepatitis C virus (HCV), hepatitis D virus (HDV), human immunodeficiency virus (HIV); and patients with CHB who had undergone treatment.
Serum HBV pgRNA quantification
HBV RNA was detected using the RNA simultaneous amplification testing method based on real-time fluorescence detection of RNA transcription-mediated nucleic acid amplification (Shengxiang Biotechnology, Changsha, China). The LLOD of HBV RNA was 100 copies/mL. The non-detected HBV RNA level was set to 0 copies/mL. The results are presented as log10 copies/mL. HBV RNA concentrations were further categorized as ≤2, 2 to ≤4, 4 to ≤6, or >6 log10 copies/mL.
Serum HBcrAg quantification
Serum HBcrAg was measured using the Lumipulse G HBcrAg chemiluminescent enzyme immunoassay (Fujirebio, Tokyo, Japan). The linear measurement range of the assay is 2–7 log10 U/mL. Samples with an HBcrAg concentration of >7 log10 U/mL were diluted with a specific dilution reagent and retested to quantify the HBcrAg concentration. The results are presented as log10 U/mL. HBcrAg concentrations were further categorized as <3, 3 to <4, 4 to 6.8, or ≥6.8 log10 U/mL.
Conventional assays
Other conventional assays were examined in Gansu Wuwei Tumor Hospital and collected by an investigator. The serum HBV DNA concentration was measured using a hybrid capture assay (Daan Gene, Guangzhou, China) before 2019, followed by a PCR fluorescence probing assay (Abbott, USA). The LLOD of HBV DNA was 100 IU/mL. The non-detected HBV DNA level was set to 0 IU/mL. The results are presented as log10 IU/mL.
Liver function, alpha-fetoprotein (AFP), anti-HCV, abdominal ultrasonography, and liver stiffness measurements, as well as qualitative serological assays for HBV, were conducted at Gansu Wuwei Tumor Hospital. Liver function measurements, including measurements of aspartate aminotransferase (AST), alanine aminotransferase (ALT), total bilirubin (TBIL), gamma-glutamyl transpeptidase (GGT), and albumin (ALB) concentrations, were measured using standard laboratory procedures. A chemiluminescence analysis reagent (Roche, Manheim, Germany) was used to assess AFP. Enzyme-linked immunosorbent assay reagents (KHB, Shanghai, China) were used for the initial qualitative testing of HBsAg, HBeAg, anti-HBs, anti-HBe, anti-HBc, and anti-HCV. Abdominal ultrasonography was performed by an experienced doctor using the ACUSON S1000 Ultrasound System (Siemens Healthneers, USA). A one-dimensional transient elastography technique applied with the Fibroscan System (Echosens, Paris, France) was used to measure liver stiffness.
Statistical analysis
The data are presented as the median and interquartile range for continuous variables and as numbers (percentage) for categorical variables. The characteristics were compared across the CHB phases using the Kruskal–Wallis test, chi-square test, or Fisher's exact test, as appropriate. Associations were tested with Spearman's rank correlation (r). A series of multinomial logistic regression models were used to test the odds of a higher ALT category vs. the lowest category by HBV RNA, HBcrAg, and HBV DNA, respectively.
Receiver operating characteristic (ROC) curves were drawn to determine the performance of each biomarker in determining the CHB phase. The biomarker with the highest area under the ROC (AUROC) curve value was further examined to identify the Youden's index according to the following equation to determine the cut-off value: sensitivity + specificity – 1. Samples are divided into the test and training sets and the decision tree model is performed using “caret” and “rpart” packages (19–21). SAS version 9.4 (SAS Institute, Cary, NC, USA) and R, version 4.1.3 (R Foundation for Statistical Computing, Vienna, Austria) was used for statistical analysis. A two-sided P-value of <0.05 was considered statistically significant.
Results
Characteristics of patients in different phases of CHB
A total of 189 CHB patients without treatment currently were divided into four phase: IT (n = 46), IC (n = 45), ENQ (n = 49), and ENH (n = 49). Of these, 91 patients (48.14%) in the IT and IC phases were HBeAg-positive, and 98 patients (51.86%) in the ENQ and ENH phases were HBeAg-negative. Patients' baseline characteristics are presented in Table 1. Significant differences existed among the different phases of CHB based on the included staging criteria. Patients in the HBeAg-positive phase were younger than those in the HBeAg-negative phase. The median ALT, AST, GGT, CAP, and TBIL concentrations were higher in the IC and ENH phases than in the IT and ENQ phases.

Table 1. Clinical characteristics of the patients in this study.
Serum HBV RNA and HBcrAg concentrations across different CHB phases
The differences in HBV RNA concentration among the four phases are depicted in Figure 1. Except for the IT phase and the IC phase, the HBV RNA concentration varied significantly between each phase of CHB infection (Figure 1A). IT (6.73, 6.46–6.96) and IC (6.63, 5.90–7.02) have a similar concentration of HBV RNA, followed by ENH (2.67, 1.23–3.47) and ENQ (0.00, 0.00–1.14). When dividing the HBV RNA into ≤2, 2 to ≤4, 4 to ≤6, >6, 84.8% in the IT phase and 71.1% in the IC phase had a concentration of >6 log10 copies/mL. While 85.7% in the IT phase and 40.8% in the IC phase had a concentration of ≤2 log10 copies/mL (Figure 1C). The HBcrAg concentration distribution in the four phases was similar to that of HBV RNA (Figures 1B,D).
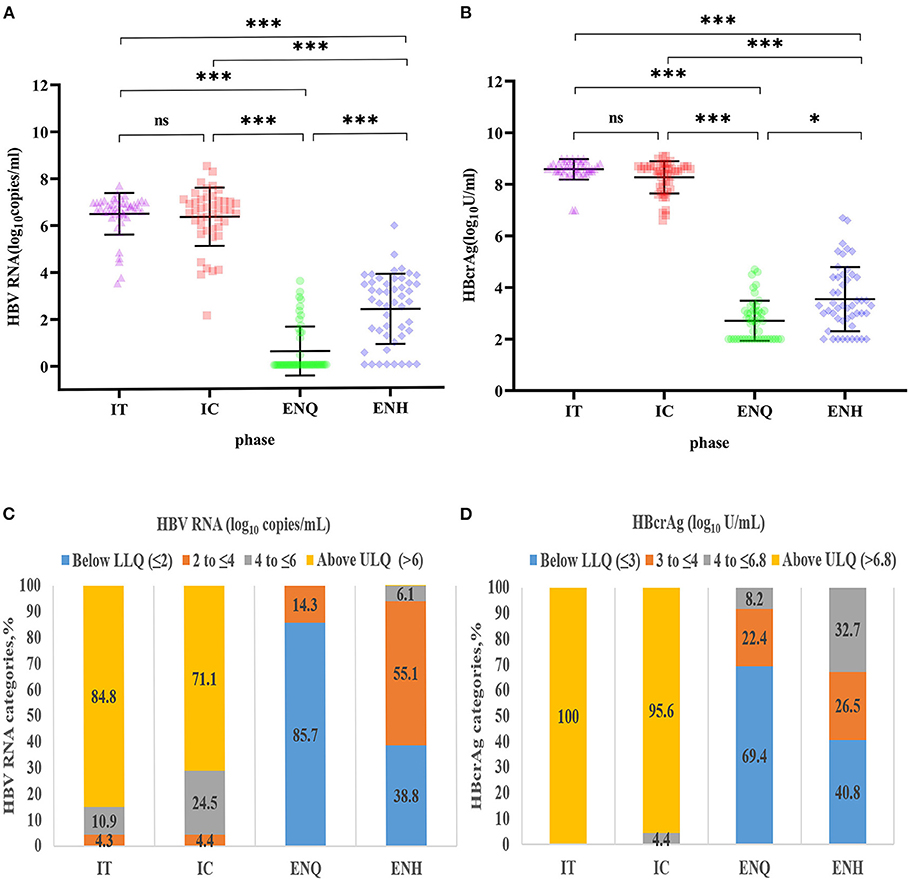
Figure 1. Distribution of HBV RNA and HBcrAg concentrations during the natural course of CHB infection. (A) HBV RNA concentration distribution during the natural course of CHB infection. ***p < 0.001; *p < 0.05; ns, no statistical significance. (B) HBcrAg concentration distribution during the natural course of CHB infection. ***p < 0.001; *p < 0.05; ns, no statistical significance. (C) HBV RNA (log10 copies/mL) category distribution during the natural course of CHB infection. (D) HBcrAg (log10 IU/mL) category distribution during the natural course of CHB infection. IT, immune tolerance; IC, immune clearance; ENQ, hepatitis B e antigen-negative inactive/quiescent carrier phase; ENH, hepatitis B e antigen-negative hepatitis; HBV, hepatitis B virus; HBcrAg, hepatitis B core-related antigen; CHB, chronic hepatitis B.
Associations of HBV RNA and HBcrAg concentrations with ALT and HBV DNA
The heatmap shows a strong correlation between HBcrAg, and HBV RNA, as well as between the ALT and HBV DNA concentrations (Supplementary Figure 1). The median HBV DNA concentration was consistently 1–2 logs higher than the HBV RNA concentration throughout the natural course of CHB infection (Supplementary Figure 2). The association between HBV RNA and HBV DNA was different in patients with HBeAg-positive patients (r = 0.51) and HBeAg-negative patients (r = 0.62) (Figure 2A). When further divided into four phases, the pattern of association varied significantly. A strong relationship between concentrations was observed in the IC and ENH phases (r = 0.67, and r = 0.43, respectively) (Figures 2C,E), but not in the IT and ENQ phases (r = −0.03, and r = 0.08, respectively) (Figures 2B,D). The HBcrAg and HBV RNA concentrations were similarly associated with HBV DNA, but unlike HBV RNA, HBcrAg was more strongly associated with HBV DNA in the ENH phase (r = 0.85, P < 0.01) (Supplementary Figures 3A–E).
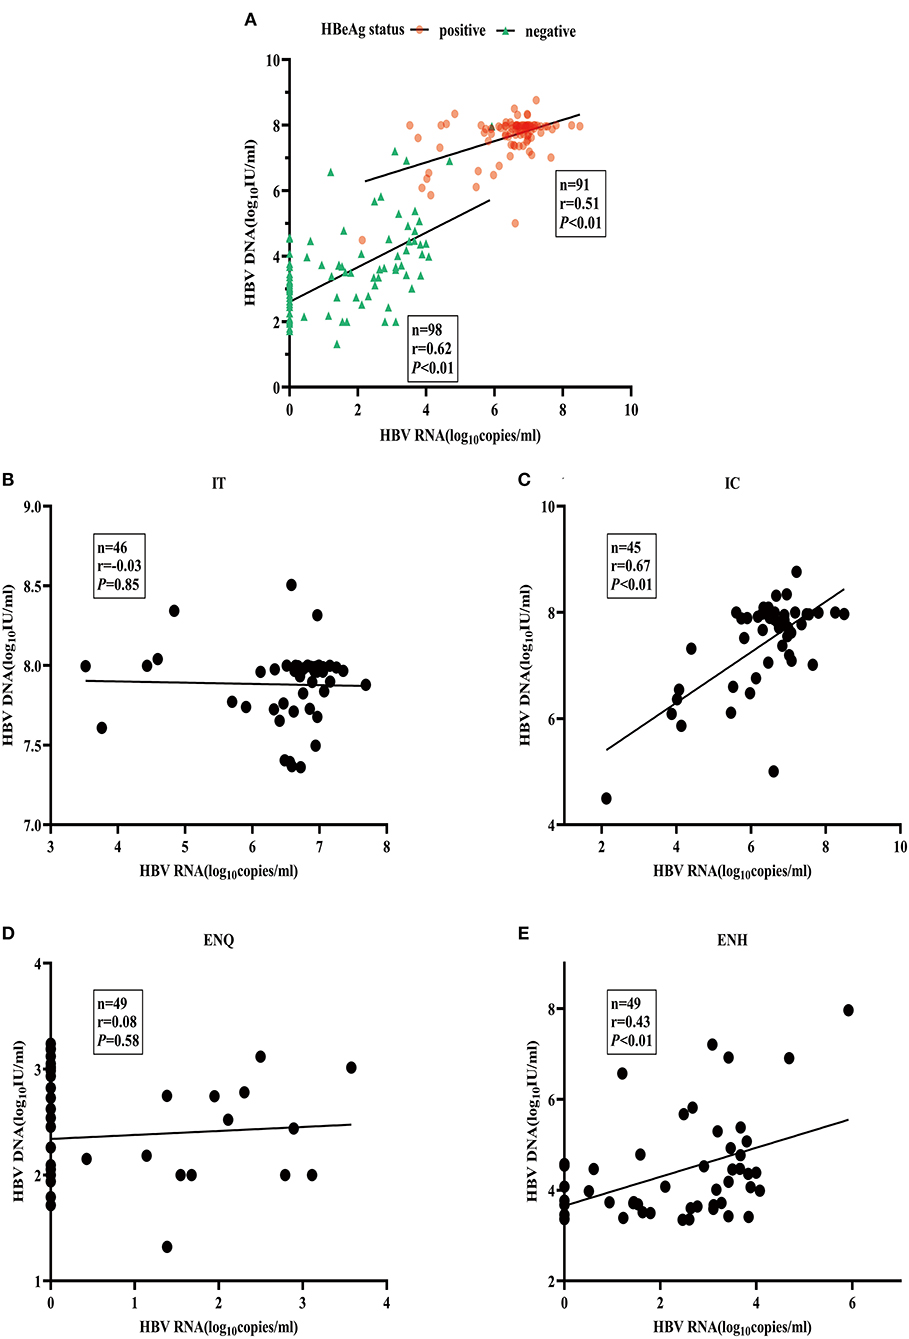
Figure 2. Association between serum HBV RNA and HBV DNA. (A) HBV RNA and HBV DNA by HBeAg status. (B) HBV RNA and HBV DNA in the IT phase. (C) HBV RNA and HBV DNA in the IC phase. (D) HBV RNA and HBV DNA in the ENQ phase. (E) HBV RNA and HBV DNA in the ENH phase.
We stratified ALT using the upper limit of normal (40 IU/L) as the standard and the sum of the test values and 40 as the ratio of ≤1, 1 to 2, and >2, respectively. Among HBeAg-negative patients, HBV RNA, HBcrAg, and HBV DNA concentrations were significantly associated with the ALT category (P < 0.01) (Supplementary Figures 4A–C). In HBeAg-positive patients, the HBV RNA concentration was not associated with ALT and the ALT categories (P = 0.39) (Supplementary Figure 4A), and the HBcrAg concentration was not associated with the ALT category (P = 0.99) (Supplementary Figure 4D). There was a weak positive association (P = 0.02) between the HBV DNA concentration and the ALT category (Supplementary Figure 4B). All P values are presented in Supplementary Tables 1, 2.
The serum HBV RNA concentration and the RNA/DNA ratio in HBeAg-positive patients were significantly higher than in HBeAg-negative patients (Supplementary Figure 5A). The stratified analysis showed that the ENQ phase had the lowest serum HBV RNA concentration and the lowest RNA/DNA ratio (IT = 0.85, IC = 0.86, ENQ = 0.00, ENH = 0.60), which were only significantly lower than in the IT and IC phases (Supplementary Figure 5B).
Predictive value of HBV RNA and HBcrAg for distinguishing the phases of CHB
To evaluate the efficacy of HBV RNA and HBcrAg concentrations in distinguishing the HBeAg status, we employed the ROC curve analysis to calculate the AUROC curve values for distinguishing the HBeAg(+) and HBeAg(−) status was 0.991 and 1.000. The combination shows a better predictive value of 1.000. The AUROC curve values for HBV RNA and HBcrAg at cutoff values of 6.32 log10 copies/mL and 7.50 log10 IU/mL, respectively (Figure 3, Table 2).
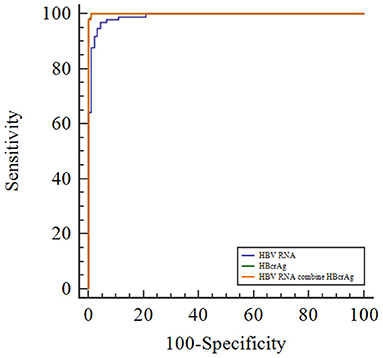
Figure 3. Receiver operating characteristic curve showing the diagnostic value of serum HBV RNA and HBcrAg concentrations in HBeAg-positive patients with CHB infection.
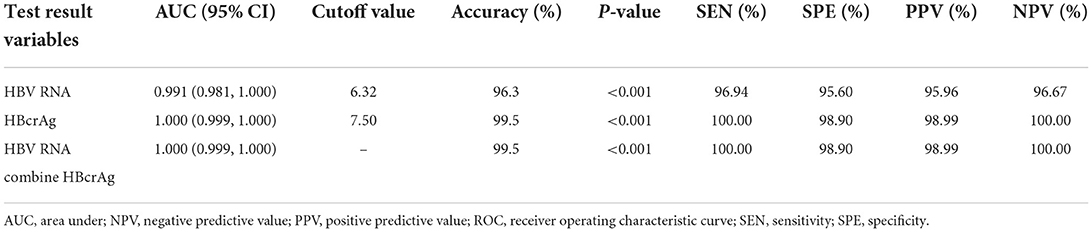
Table 2. Receiver operating characteristic curve showing the diagnostic value of serum HBV RNA and HBcrAg level for HBeAg-positive status in chronic HBV infection.
Although HBV RNA and HBcrAg concentrations tended to decrease during progression to the ENQ and ENH phases of CHB, the concentrations increased when HBV was reactivated. We observed significant differences in the serum HBV RNA and HBcrAg concentrations in HBeAg-negative status in previous studies. But the above results suggest that the ability of these novel HBV biomarkers to distinguish ENQ and ENH independently or jointly was not outstanding. We examined the value of serum HBV RNA and HBcrAg in identifying the ENQ and ENH phases of CHB. With cutoff values of 4.01 log10 U/mL and 4.50 log10 IU/mL, the AUROC curve values for HBV RNA and HBcrAg were 0.825 and 0.709 for distinguishing the ENQ and ENH phases, respectively. The AUROC curve value for the combination of HBV RNA and HBcrAg to distinguish the ENQ and ENH phases was 0.836 (Supplementary Figure 6, Supplementary Table 3). Therefore, we examined whether these novel biomarkers can distinguish between the ENQ and ENH phases, or even between the whole natural course of CHB when used in combination with conventional markers.
The samples were divided into the training set (75%) and the test set (25%). The important parameters for use in the decision tree model were identified; ALT and HBV DNA were the most important factors (Figure 4A). The decision tree model with a criterion of ALT < 40 IU/L and HBcrAg ≥ 5.9 log10 IU/mL or HBcrAg ≥ 6.8 log10 IU/mL. We observed the prediction accuracy of the decision tree model based on ALT with HBcrAg in the four phases was the best, at 95.65%, and ALT with HBV RNA was 93.55% (Figure 4B, Supplementary Figure 7, Supplementary Table 4).
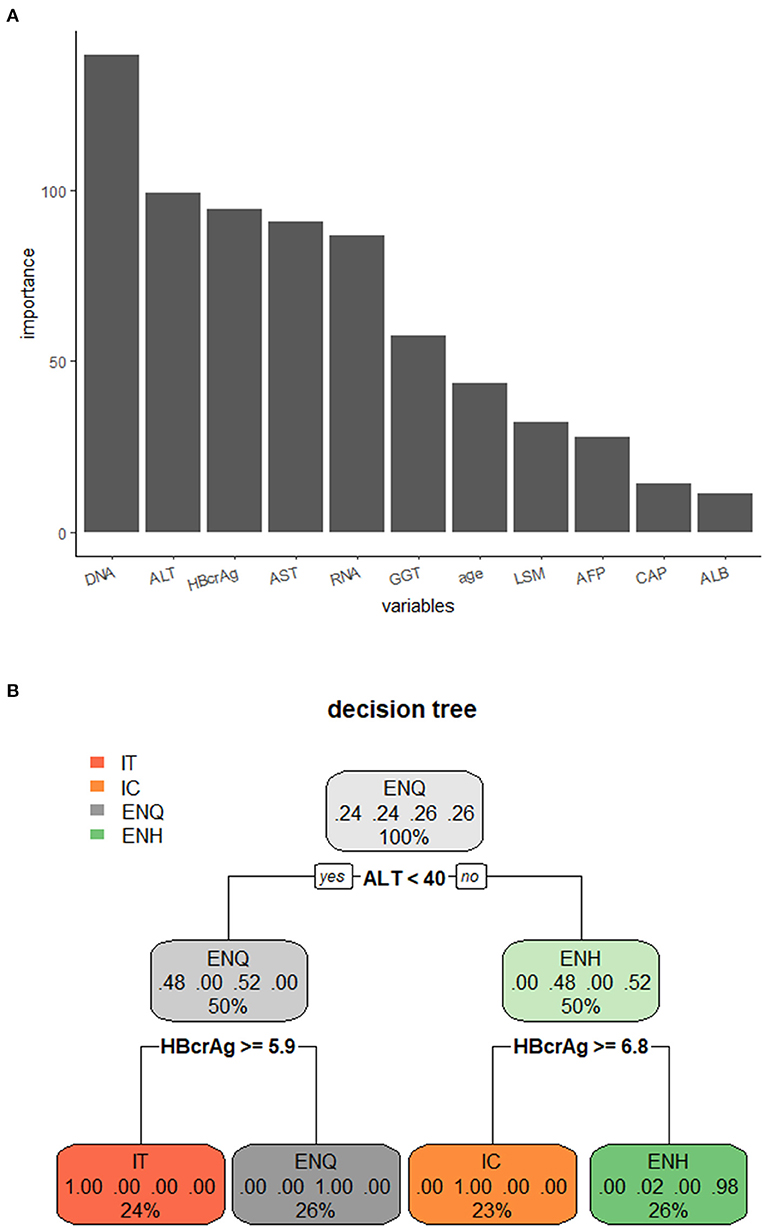
Figure 4. Decision tree model for distinguishing the phases of the natural course of CHB infection. (A) Importance of the variables in the decision tree model. (B) Decision tree model for distinguishing the phases of the natural course of CHB infection using ALT combined with HBcrAg. IT, immune tolerance; IC, immune clearance; ENQ, hepatitis B e antigen-negative inactive/quiescent carrier phase; ENH, hepatitis B e antigen-negative hepatitis.
Discussion
In this study of 189 CHB patients without treatment currently from Northwest China, we investigated the concentrations of HBV RNA and HBcrAg were highest in the IT and IC phases. HBV RNA and HBcrAg correlated with HBV DNA in the HBeAg+ and HBeAg− status, but their association with HBV DNA differed among phases. The decision tree model using a combination of HBcrAg and ALT is the best combination to differentiate the four phases.
The present study demonstrated that HBV RNA and HBcrAg concentrations displayed a wide distribution, with a higher concentration in the HBeAg-positive status than in the HBeAg-negative status. HBV RNA and HBcrAg concentrations varied significantly among the natural phases of CHB infection. The concentrations were highest in the IT phase, followed by the IC, ENH, and ENQ phases successively. These findings are in line with previous reports (17, 18, 22).
Regardless of the phase of CHB, the median HBV DNA concentration was consistently 1–2 log10 higher than the HBV RNA concentration throughout the natural course of CHB infection (12, 22–24). However, other studies have shown that the median HBV DNA concentration in patients with CHB after antiviral therapy is higher than the concentration of HBV RNA. Moreover, when HBV DNA is below the detection limit, HBV RNA can still be detected in some patients (25, 26). Regardless of the status of HBeAg negativity, the HBV DNA concentration was significantly associated with the ALT concentration. However, the HBV RNA and HBcrAg concentrations were associated with the ALT concentration only in HBeAg-negative patients, suggesting that changes in HBV RNA and HBcrAg concentrations were inconsistent with changes in the HBV DNA concentration in the setting of ALT changes (11). These results indicate that HBV DNA is sensitive to antiviral drugs, and HBV DNA may fall below the detection limit after administration, preventing the natural course of CHB from being distinguished. Compared with HBV DNA, the HBV RNA and HBcrAg may be irreplaceable in distinguishing the natural course of CHB, but further research is needed to prove this speculation.
During the natural history of chronic HBV infection, the serum HBV RNA concentration and the HBV RNA to DNA ratio changed significantly. The serum HBV RNA concentration and the ratio of RNA to DNA were higher in HBeAg-positive patients than in HBeAg-negative patients. The stratified analysis revealed that the serum HBV RNA concentration and the ratio of RNA to DNA in the ENQ phase were lower than in the other three phases. This finding is similar to that of a recently published study showing a significantly higher proportion of HBeAg-negative ENH phases than HBeAg-negative ENQ phases (1.04 vs. 0.85; P = 0.01) (22). The lower limit of detection (LLOD) for serum HBV DNA and RNA in this study was 500 and 100 copies/mL, respectively. However, a previously published study observed contradicting results, in which the ratio in the HBeAg-negative ENH phase was remarkably similar to that in the HBeAg-negative ENQ phase (0.53 vs. 0.53; P = 0.71) (12). The LLOD of HBV RNA was 1.65 log10 U/mL, and that of HBV-DNA was 1 log10 IU/ mL. In the present study, the LLOD of HBV RNA was 0 copies/mL, and the HBV DNA was 100 IU/mL. These results demonstrate that the virus exhibited different replication levels over the natural course of CHB infection. Previous studies on the changing patterns of HBsAg, which is another alternative biomarker of intrahepatic cccDNA transcription activity, over the natural course of CHB infection, also indicated that HBV exhibited different replication levels throughout the natural course of CHB infection (27, 28). However, the difference in the LLOD of HBV RNA and HBV DNA in these studies will affect the calculated HBV RNA to DNA ratio, so these studies cannot be directly compared, which highlights the importance of developing standardized test methods in the future.
In this study, we documented a strong overall association of HBV RNA and HBcrAg with HBV DNA, suggesting that quantitative HBV RNA and HBcrAg may partly reflect viral replication. This was most evident in the IC and ENH phases, which are active states of HBV replication. However, we did not observe an association between the IT and ENQ phases for HBV RNA, HBcrAg, or HBV DNA, which is not consistent with one Asian and one European study (17, 18). This may be due to the different genotypes of the patients studied. In our previous study, we found that the main HBV genotype in the Wuwei region was (C/D) (29), while the genotypes in two other studies were primarily (B/C) and (A/D) (17, 18). Therefore, we need to further explore the relationship between novel biomarkers and conventional markers in different genotypes in different phases of the natural history of chronic HBV infection.
In this study, HBV RNA and HBcrAg, both alone and in combination, demonstrated high predictive value for distinguishing HBeAg(+) and HBeAg(–) status. However, the predictive value was lower for distinguishing ENQ and ENH phases, with an AUROC curve value of 0.825 for HBV RNA, 0.709 for HBcrAg, and 0.836 for combination. This is similar to the AUROC (0.833) of HBV RNA in a previous study, but another reported a much higher AUROC (0.931) of HBcrAg than ours (22, 30). One possible reason for this difference may be that the number of patients in the ENQ phase in our study was small, resulting in a decrease in the discrimination ability.
In this study, the decision tree prediction model based on the combination of novel HBV biomarkers and conventional markers could accurately distinguish the natural course of CHB, and the accuracy of HBV RNA and HBcrAg combined with ALT to distinguish the four phases of chronic HBV infection was 93.48% and 95.65%, respectively. However, when used in combination with HBV DNA, the predictive effect did not increase significantly, which may have been because HBV RNA and HBcrAg can replace the predictive value of HBV DNA in the four phases of CHB infection. In previous studies, the decision tree model has been used to distinguish CHB, cirrhosis, and hepatocellular carcinoma (31). These results suggest that novel HBV biomarkers can accurately differentiate the four phases of CHB infection in place of HBV DNA. This study has two main limitations that should be noted. First, given the shortcomings of retrospective studies, further prospective studies are needed to validate the prospective use of HBV RNA and HBcrAg for distinguishing the history of CHB infection in clinical practice. Second, it is necessary to recruit more patients or to obtain multi-center data to support our findings.
Conclusion
In conclusion, this study demonstrated the concentrations of HBV RNA and HBcrAg were highest in the IT and IC phases. HBV RNA and HBcrAg were positively related to conventional markers, but the relationship was varied among four phases These novel biomarkers combined with conventional biomarkers could accurately distinguish the different phases of the natural course of CHB infection. Thus, they might be useful as serological markers to detect potential HBV infection. Further elucidation of the clinical significance of serum HBV RNA and HBcrAg concentrations will contribute greatly to the clinical management of patients with HBV infection in the future.
Data availability statement
The raw data supporting the conclusions of this article will be made available by the authors, without undue reservation.
Ethics statement
The studies involving human participants were reviewed and approved by Air Force Medical University Ethics Committee. The patients/participants provided their written informed consent to participate in this study.
Author contributions
ZJ, ZS, and YY designed the study and reviewed and revised the manuscript. WW and XY coded and analyzed the data. WW, XY, and WeiZ wrote the manuscript. HZ, XK, ZH, and TF collected data. WenZ, WJ, CL, HT, and FW helped interpret the data. All authors read and approved the final manuscript.
Funding
This study was supported by the China Special Grant for the Prevention and Control of Infection Diseases (no. 2017ZX10105011).
Conflict of interest
The authors declare that the research was conducted in the absence of any commercial or financial relationships that could be construed as a potential conflict of interest.
Publisher's note
All claims expressed in this article are solely those of the authors and do not necessarily represent those of their affiliated organizations, or those of the publisher, the editors and the reviewers. Any product that may be evaluated in this article, or claim that may be made by its manufacturer, is not guaranteed or endorsed by the publisher.
Supplementary material
The Supplementary Material for this article can be found online at: https://www.frontiersin.org/articles/10.3389/fpubh.2022.1037508/full#supplementary-material
Abbreviations
AUROC, area under the receiver operating characteristic curve; cccDNA, covalently closed circular DNA; CHB, chronic hepatitis B virus infection; ENQ, hepatitis B e antigen-negative inactive/quiescent carrier phase; ENH, hepatitis B e antigen-negative hepatitis; HBcrAg, hepatitis B core-related anti-gen; HBeAg, hepatitis B e antigen; HBsAg, hepatitis B surface antigen; HBV, hepatitis B virus; HCC, hepatocellular carcinoma; HCV, hepatitis C virus; HDV, hepatitis D virus; HIV, human immunodeficiency virus; IT, immune tolerance; IC, immune clearance; PCR, polymerase chain reaction; WHO, World Health Organization.
References
1. World Health Organization. Hepatitis B. World Health Organization (2022). Available online at: https://www.who.int/news-room/fact-sheets/detail/hepatitis-b (accessed July 24, 2022).
2. Terrault NA, Lok ASF, Mcmahon BJ, Chang KM, Hwang JP, Jonas MM, et al. Update on prevention, diagnosis, and treatment of chronic hepatitis B: AASLD 2018 hepatitis B guidance. Hepatology. (2018) 67:1560–99. doi: 10.1002/hep.29800
3. Terrault NA, Bzowej NH, Chang KM, Hwang JP, Jonas MM, Murad MH. AASLD guidelines for treatment of chronic hepatitis B. Hepatology. (2016) 63:261–83. doi: 10.1002/hep.28156
4. Sarin SK, Kumar M, Lau GK, Abbas Z, Chan HL, Chen CJ, et al. Asian-Pacific clinical practice guidelines on the management of hepatitis B: a 2015 update. Hepatol Int. (2016) 10:1–98. doi: 10.1007/s12072-015-9675-4
5. Wang G, Duan Z. Guidelines for Prevention and Treatment of Chronic Hepatitis B. J Clin Transl Hepatol. (2021) 9:769–91. doi: 10.14218/JCTH.2021.00209
6. Di Bisceglie AM, Lombardero M, Teckman J, Roberts L, Janssen HL, Belle SH, et al. Determination of hepatitis B phenotype using biochemical and serological markers. J Viral Hepat. (2017) 24:320–9. doi: 10.1111/jvh.12643
7. Liaw YF, Kao JH, Piratvisuth T, Chan HL, Chien RN, Liu CJ, et al. Asian-Pacific consensus statement on the management of chronic hepatitis B: a 2012 update. Hepatol Int. (2012) 6:531–61. doi: 10.1007/s12072-012-9365-4
8. Liao B, Wang Z, Lin S, Xu Y, Yi J, Xu M, et al. Significant fibrosis is not rare in Chinese chronic hepatitis B patients with persistent normal ALT. PLoS ONE. (2013) 8:e78672. doi: 10.1371/journal.pone.0078672
9. Gui HL, Wang H, Yang YH, Wu YW, Zhou HJ, Guo SM, et al. Significant histopathology in Chinese chronic hepatitis B patients with persistently high-normal alanine aminotransferase. J Viral Hepat. (2010) 17 Suppl 1:44–50. doi: 10.1111/j.1365-2893.2010.01270.x
10. European Association for the Study of the Liver. EASL 2017 Clinical Practice Guidelines on the management of hepatitis B virus infection. J Hepatol. (2017) 67:370–98. doi: 10.1016/j.jhep.2017.03.021
11. Ghany MG, King WC, Lisker-Melman M, Lok ASF, Terrault N, Janssen HLA, et al. Comparison of HBV RNA and Hepatitis B core related antigen with conventional HBV markers among untreated adults with chronic hepatitis B in North America. Hepatology. (2021) 74:2395–409. doi: 10.1002/hep.32018
12. Mak LY, Cloherty G, Wong DK, Gersch J, Seto WK, Fung J, et al. HBV RNA profiles in patients with chronic hepatitis b under different disease phases and antiviral therapy. Hepatology. (2021) 73:2167–79. doi: 10.1002/hep.31616
13. Ma G, Lou B, Lv F, Zhao D, Zhang Z, Chen Y. HBcrAg and pg RNA and the therapeutic effect in HBeAg-positive patients receiving anti-viral therapy, baseline serum HBV-RNA is a powerful predictor of response. J Viral Hepat. (2020) 27:837–46. doi: 10.1111/jvh.13299
14. Wang J, Shen T, Huang X, Kumar GR, Chen X, Zeng Z, et al. Serum hepatitis B virus RNA is encapsidated pregenome RNA that may be associated with persistence of viral infection and rebound. J Hepatol. (2016) 65:700–10. doi: 10.1016/j.jhep.2016.05.029
15. Liu S, Zhou B, Valdes JD, Sun J, Guo H. Serum hepatitis B virus RNA: a new potential biomarker for chronic hepatitis B virus infection. Hepatology. (2019) 69:1816–27. doi: 10.1002/hep.30325
16. Wong DK, Seto WK, Cheung KS, Chong CK, Huang FY, Fung J, et al. Hepatitis B virus core-related antigen as a surrogate marker for covalently closed circular DNA. Liver Int. (2017) 37:995–1001. doi: 10.1111/liv.13346
17. Maasoumy B, Wiegand SB, Jaroszewicz J, Bremer B, Lehmann P, Deterding K, et al. Hepatitis B core-related antigen (HBcrAg) levels in the natural history of hepatitis B virus infection in a large European cohort predominantly infected with genotypes A and D. Clin Microbiol Infect. (2015) 21:606.e1–10. doi: 10.1016/j.cmi.2015.02.010
18. Seto WK, Wong DK, Fung J, Huang FY, Liu KS, Lai CL, et al. Linearized hepatitis B surface antigen and hepatitis B core-related antigen in the natural history of chronic hepatitis B. Clin Microbiol Infect. (2014) 20:1173–80. doi: 10.1111/1469-0691.12739
19. Kuhn M, Wing J, Weston S, Williams A, Keefer C, Engelhardt A, et al. Caret: Classification Regression Training. (2022). Available online at: https://github.com/topepo/caret (accessed August 20, 2022).
20. Therneau T, Ripley B. rpart: Recursive Partitioning Regression Trees. (2022). Available online at: https://github.com/bethatkinson/rpart (accessed August 18, 2022).
21. Milborrow S. rpart.plot: Plot ‘rpart' Models: An Enhanced Version of ‘plot.rpart'. (2022). Available online at: http://www.milbo.org/rpart-plot/index.html (accessed August 10, 2022).
22. Liu Y, Jiang M, Xue J, Yan H, Liang X. Serum HBV RNA quantification: useful for monitoring natural history of chronic hepatitis B infection. BMC Gastroenterol. (2019) 19:53. doi: 10.1186/s12876-019-0966-4
23. Wang J, Yu Y, Li G, Shen C, Li J, Chen S, et al. Natural history of serum HBV-RNA in chronic HBV infection. J Viral Hepat. (2018) 25:1038–47. doi: 10.1111/jvh.12908
24. Prakash K, Rydell GE, Larsson SB, Andersson M, Norkrans G, Norder H, et al. High serum levels of pregenomic RNA reflect frequently failing reverse transcription in hepatitis B virus particles. Virol J. (2018) 15:86. doi: 10.1186/s12985-018-0994-7
25. Carey I, Gersch J, Wang B, Moigboi C, Kuhns M, Cloherty G, et al. Pregenomic HBV RNA and hepatitis B core-related antigen predict outcomes in hepatitis B e antigen-negative chronic hepatitis b patients suppressed on Nucleos(T)ide analogue therapy. Hepatology. (2020) 72:42–57. doi: 10.1002/hep.31026
26. Butler EK, Gersch J, Mcnamara A, Luk KC, Holzmayer V, De Medina M, et al. Hepatitis B virus serum DNA andRNA levels in Nucleos(t)ide analog-treated or untreated patients during chronic and acute infection. Hepatology. (2018) 68:2106–17. doi: 10.1002/hep.30082
27. Janssen HL, Sonneveld MJ, Brunetto MR. Quantification of serum hepatitis B surface antigen: is it useful for the management of chronic hepatitis B? Gut. (2012) 61:641–5. doi: 10.1136/gutjnl-2011-301096
28. Martinot-Peignoux M, Asselah T, Marcellin P. HBsAg quantification to predict natural history and treatment outcome in chronic hepatitis B patients. Clin Liver Dis. (2013) 17:399–412. doi: 10.1016/j.cld.2013.05.006
29. Wen X, Su H, Wang Y, Pu Z, Gao J, Ji Z, et al. Prevalence and natural course of occult hepatitis B virus infection in residents of 2 communities of Wuwei City, Gansu Province, China. J Viral Hepat. (2018) 25:281–8. doi: 10.1111/jvh.12805
30. Gou Y, Zhao Y, Rao C, Feng S, Wang T, Li D, et al. Predictive value of hepatitis B core-related antigen (HBcrAg) during the natural history of hepatitis B virus infection. Clin Lab. (2017) 63:1063–70. doi: 10.7754/Clin.Lab.2017.161034
Keywords: hepatitis B, novel biomarkers, phase, HBV RNA, HBcrAg, HBV DNA
Citation: Wu W, Yuan X, Zhang W, Zhou H, Kong X, He Z, Fu T, Zhang W, Jia W, Liang C, Tang H, Wang F, Ye Y, Shao Z and Ji Z (2022) Clinical significance of novel biomarkers to predict the natural course of hepatitis B infection. Front. Public Health 10:1037508. doi: 10.3389/fpubh.2022.1037508
Received: 06 September 2022; Accepted: 12 October 2022;
Published: 28 October 2022.
Edited by:
Krzysztof Tomasiewicz, Medical University of Lublin, PolandReviewed by:
Jun Cheng, The 903th Hospital of the People's Liberation Army, ChinaXiaolin Wang, Shanghai Jiao Tong University, China
Copyright © 2022 Wu, Yuan, Zhang, Zhou, Kong, He, Fu, Zhang, Jia, Liang, Tang, Wang, Ye, Shao and Ji. This is an open-access article distributed under the terms of the Creative Commons Attribution License (CC BY). The use, distribution or reproduction in other forums is permitted, provided the original author(s) and the copyright owner(s) are credited and that the original publication in this journal is cited, in accordance with accepted academic practice. No use, distribution or reproduction is permitted which does not comply with these terms.
*Correspondence: Zhaohua Ji, aGVsbG9qemhAbXNuLmNvbQ==; Zhongjun Shao, MTM3NTk5ODE3ODNAMTYzLmNvbQ==; Yancheng Ye, emx5eXl5Y0AxNjMuY29t
†These authors have contributed equally to this work