 Jiayuan Wang
 Ya Wang
 Mallikarjuna Korivi
 Xi Chen
 Rong Zhu
- 1Second Clinical Medical College, Wenzhou Medical University, Wenzhou, China
- 2School of Innovation and Entrepreneurship, Wenzhou Medical University, Wenzhou, China
- 3Exercise Metabolism and Research Center, College of Physical Education and Health Sciences, Zhejiang Normal University, Jinhua, China
- 4School of Sports Science, Wenzhou Medical University, Wenzhou, China
Background : The urbanization process may affect the lifestyle of rural residents in China. Limited information exists on the extent of sedentarism and physical activity (PA) level of rural residents in middle-income countries. This is the first survey on sedentary time (ST) and PA among rural residents in eastern China.
Methods: This cross-sectional observational study randomly samples rural adults from Zhejiang Province in eastern China (n = 1,320). Participants' ST and PA levels were determined from the International Physical Activity Questionnaire Short Form through face-to-face interviews, and the influencing factors of PA levels were assessed through multi-class logistic regression analysis.
Results: The findings showed that the daily ST of the participants ranged from 30 to 660 min, with a median of 240 min (P25, P75:120, 240 min), and 54.6% of participants were sedentary for 240 min or above. The daily ST in men, people aged 18 to 44 years, people with bachelors' degree and above, people working for government agencies or institutions, people with unmarried status, and people with an average income of < 2,000 Yuan was longer than that of other respective groups (p < 0.01). In contrast, the daily ST of people with hypertension or with patients with osteoporosis or osteopenia was less than that of normal people (p < 0.01). Additionally, 69.4% of participants generally had a low level of PA (LPA). Compared with those living in northern Zhejiang, people living in southern Zhejiang who were aged 18–44 years, had bachelor's degree or above, were farmers, and had household incomes below 10,000 Yuan per month were more likely to engage in LPA compared to people > 60 years, with high school or technical education levels or with junior college degrees, working in government agencies and institutions, and with household income above 10,000 Yuan per month (p < 0.05). Furthermore, there was no correlation between ST and PA levels.
Conclusion: Most rural residents in the Zhejiang Province of eastern China had longer daily ST and a LPA. This was predominant in men, young people, highly educated people, unmarried people, and middle to high-income people. Health education programs should be targeted toward specific population groups to decrease the ST and increase PA.
Introduction
Consistent with other countries, urbanization of rural areas in China has had a significant impact on the lifestyle of residents living in those areas (1). Developing rural areas from traditional agricultural societies to modern technology-dependent societies has not only led to changes in infrastructure and basic services (optimization and development of health and education), but also has led to changes in the living environment. Additionally, it has caused redistribution of time in life and has caused changes in the workstyles (e.g., from labor-intensive to sedentary work) (2). Due to the increased availability and use of modernized and automated agriculture machinery, rural residents and/or farmers are now free from having to perform manual labor (3). In addition, individual's sedentary behavior (SB) continues to increase due to an excessive use of multiple mobile electronic devices and playing computer games (4). People have lost their interest in participating in exercise programs, which results in a significant reduction in physical activity (PA) levels (5, 6). Several decades of economic reform and urbanization in China brought some unintended health consequences across Chinese society such as increased prevalence of overweight and obesity in adults, which was accompanied by decreased PA (7).
Currently, insufficient PA is a major risk factor for developing non-communicable diseases (NCDs), which has become the fourth leading cause of death in the world (8). PA helps in preventing overweight and obesity, alleviating stress, regulating mood, and improving mental health (9). Further, an adequate amount of PA is beneficial in preventing and treating NCDs, such as cardiovascular disease, stroke, diabetes, hypertension, and cancer (10). PA guidelines for Americans recommended that adults aged between 19 and 64 years should engage in 150 min of moderate-vigorous PA (MVPA) per week, which is commonly divided into five 30-min exercise sessions per week (11). Despite fulfilling this recommendation, some people still exhibit elevated cardiometabolic risk factors. In this case, such elevation might be associated with their SB rather than the amount of MVPA (12). Various strategies that can increase PA and reduce sitting behavior are considerable public health approaches to promote population health and wellbeing (13). The Chinese government publishes a national fitness plan every 5 years. The latest national fitness plan (2021–2025) promulgated in August 2021, which emphasizes the significance of regular PA in improving the health and quality of life of the population (14).
Zhejiang Province, located in the eastern coastal area of China, is one of the most developed provinces in China with rapid rural urbanization. Nevertheless, the SB and PA levels of rural residents in this province have not been elucidated. Thus, we explored the sociodemographic characteristics, ST, PA level, and chronic diseases of the rural residents in Zhejiang Province. The factors that could influence the PA level of individuals were further analyzed to aid in formulating health promotion policies.
Methods
Study Population and Sampling Design
This cross-sectional, observational study was conducted from November 2020 to January 2021 in Zhejiang Province. The representative samples were selected by a stratified, multi-stage, random cluster sampling strategy. In the first stage, all rural areas were identified from the statistical database of China's economic and social development (15). In the second stage, a total of 11 cities in Zhejiang Province were divided into the south (6 cities) and the north (5 cities) regions based on the geographic location and rural per capita disposable income. In the third stage, two cities each were randomly selected from the south and north regions. Then, 8 out of 40 counties were randomly selected from those 4 cities. In the next step, 14 out of 140 villages were randomly selected from those 8 counties. Approximately 100 residents were randomly selected from every village and conducted a face-to-face interview by the pre-trained investigators. Finally, a total of 1,351 respondents were considered, and the response rate was 97.7% (1,320/1,351).
Measures
Participant's Characteristics
The survey questionnaire collected data on sociodemographic variables, which include age (18–44-, 45–59-, and ≥60-year groups) (16), gender (male or female), ethnicity (Han ethnicity or other), marital status (unmarried, married, divorced, widowed), education level (illiterate, primary school, junior high school, high school/technical, junior college, bachelor degree, and above), occupation (staff of agencies and institutions, corporate employees, commercial and service industry personnel, farmer, unemployed, retired personnel, and others), and average monthly household income (unclear, below 2,000, 2,000–4,999, 5,000–9,999, and more than 10,000 Yuan).
Assessment of ST and PA Level
Participants were asked to report their daily ST and PA levels in the past 7 days. The International Physical Activity Questionnaire Short Form (IPAQ-SF)—Chinese version with a test–retest reliability coefficient reaching 0.71–0.93 was used to obtain the data (17, 18). SB includes specific behaviors such as sitting or reclining or lying for reading, studying and watching television, and sitting at school or in public transportation (19). In IPAQ-SF, metabolic equivalents (METs) were used to measure the intensity. One MET is defined as the amount of oxygen consumed while sitting and resting. According to the criteria provided by the IPAQ scoring scheme, walking is set at 3.3 METs, moderate-intensity PA is set at 4 METs, and vigorous PA is set at 8 METs (20). The weekly level of an individual engaging in a certain intensity PA was the corresponding MET value of the PA × daily time (min/d) × weekly frequency (d/w).
The weekly MET value is calculated using the following formula:
Totally, three PA levels are classified according to the weekly PA frequency, intensity, and METs of the participants (20).
High-level PA (HPA) needs to satisfy either of the following two criteria:
Physical activity consisted of three intensities, 7 days per week, and the overall weekly PA is greater than or equal to 3,000 MET-min/week. HPA totals more than 3 days, and the weekly overall PA level is greater than or equal to 1,500 MET-min/week.
Moderate-level PA (MPA) needs to meet any one of the following three criteria:
At least 20 min of high-intensity PA per day for a total of more than 3 days; at least 30 min of moderate-intensity PA and/or walking per day for a total of more than 5 days; the three intensities of PA more than 5 days, and the weekly overall PA level is greater than or equal to 600 MET-min/week.
Low-level PA (LPA):
Physical activities of the participants that do not satisfy the above two levels (HPA or MPA) are considered as low-level PA and included in LPA.
Body Adiposity
The height (m) and weight (kg) of the participants were measured to calculate the body mass index (BMI, kg/m2). In China, the underweight was defined as BMI <18.5 kg/m2, the normal weight was defined as 18.5 kg/m2 ≤ BMI <24kg/m2, the overweight was defined as BMI ≥ 24 kg/m2, and obesity was defined as BMI ≥ 28 kg/m2, which were slightly different from the international standards (21, 22).
Hypertension
A well-trained medical doctor measured the participants' blood pressure three times while at rest. According to the hypertension standard guidelines, people who reported elevated blood pressures (SBP ≥ 140 mmHg and/or DBP ≥ 90 mmHg) or using antihypertensive drugs were considered as hypertensive patients (23). Then, all participants were divided into the hypertension group and the normal blood pressure group.
Osteoporosis
The calcaneal bone mineral density of the participants was measured by the portable bone densitometer (OsteoPro UBD 2002A). According to the World Health Organization's definition of osteoporosis, we categorized the participants into three groups, which include osteoporosis group (T value ≤ 2.5), osteopenia group (T value range from −2.5 to −1), and normal bone quality group (T value ≥ −1) (24).
Statistical Analysis
All data collected were recorded two times in Epidata 3.1 to ensure its authenticity and accuracy. Descriptive statistics that includes counts, percentages, median (quartile), and 95% confidence intervals (CI) was used to describe the sample. Pearson's chi-square test and Fisher's exact test were used to assess the differences between the categorical variables. Kolmogorov–Smirnov test (K-S test) was used to verify whether a continuous variable satisfies a normal distribution, and data that did not satisfy a normal distribution were described by the median (quartile). The Mann–Whitney U or Kruskal–Wallis test was used to assess the differences among continuous variables. Multi-class logistic regression analysis was used to identify factors influencing the population's PA level and to verify whether the inclusion of independent variables was statistically significant. Using a two-sided test, statistical significance was set at the conventional level of p < 0.05, and all statistical analyses were performed using IBM SPSS Statistics for Windows, Version 25.0 (IBM, Armonk, NY, USA).
Ethics Approval
All the procedures used in this study were reviewed and approved by the Wenzhou Medical University Human Research Ethics Committee (2021-010). All respondents were provided with a written informed consent form, which included the purposes of the study, medical items, and confidentiality agreements for personal information, before participating in the study.
Results
Sociodemographic Characteristics and Lifestyle of Participants
A total of 1,320 participants aged between 18 and 88 years (M = 52.3; SD = 14.2) participated in this study. Of those, 382 participants (28.9%) were aged between 18–44 years, 481 (36.4%) were aged 45–59 years, and 457 (34.6%) were aged 60 years and above. Most of the participants were of Han ethnicity (98.8%) and married (88.1%). More than half of the participants were women (62.8%) and farmers (55.0%), had junior high school and below education (65.3%), and had low PA levels (69.4%). The average income of the participants was below 5,000 Yuan (60.1%). The 50.5% and 49.5% of participants lived in northern Zhejiang and southern Zhejiang, respectively. Meanwhile, onsite measurements of height and weight, blood pressure, and bone mineral density were obtained from 1,275, 1,274, and 1,234 participants, respectively. Among them, 47.9% of participants were overweight and obese, 47.6% of participants had hypertension, and 29.9% had osteoporosis. Full details of participants' characteristics are presented in Table 1.
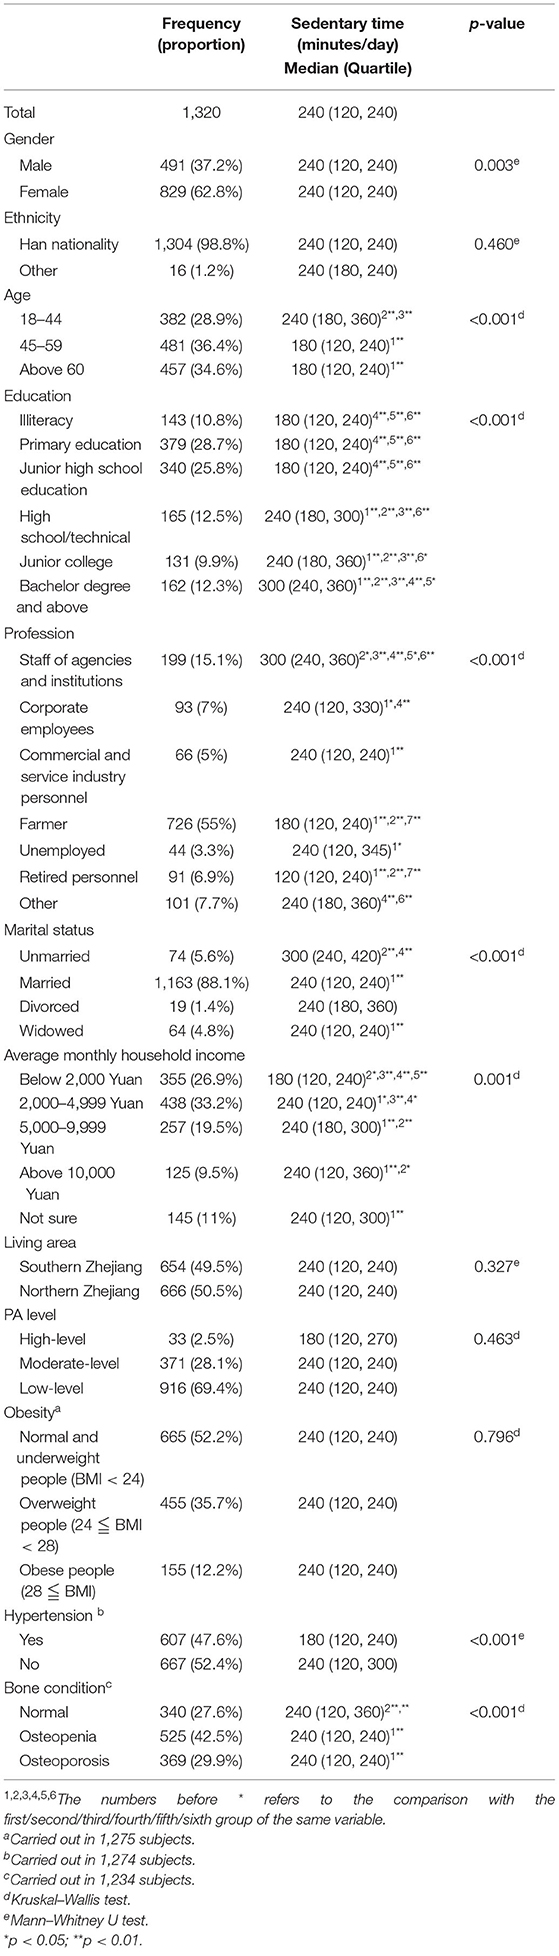
Table 1. Basic conditions of social demography and physique (n = 1,320), characteristics of daily ST.
Sedentary Time of Participants
The daily ST of the participants ranged from 30 to 660 min with a median of 240 min (P25, P75:120 min, 240 min), and 54.6% of people were sedentary for ≥240 min. However, the daily ST of men was longer than the daily ST of women (p = 0.003), as men's ST distribution was more concentrated at 240 min (35.6%) when compared to women's ST distribution (30.4%) (Figure 1A). The association between ST and age revealed that the daily ST of participants in the 18–44-year age group was longer than the ST of participants in other age groups (p < 0.01). The median of the 18–44-year group was 240 min (p25, p75:180 min, 360 min), the median of 45–59-year group and above 60-year group was 180 min (p25, p75:180 min, 240 min) (Figure 1B).
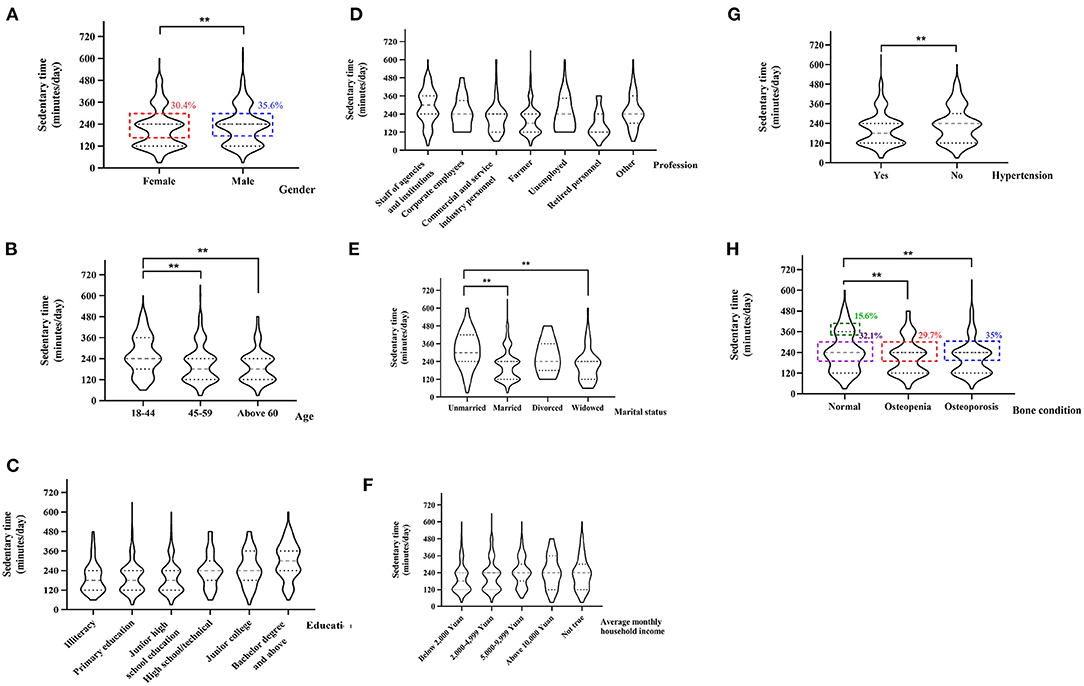
Figure 1. Violin diagram of the distribution of the ST of participants different in genders (A), ages (B), educations (C), professions (D), marital status (E), average monthly household incomes (F), blood pressure status (G), and bone conditions (H). **p < 0.01.
In addition, the length of the daily ST significantly differed among people with different education levels, occupations, marital status, and household monthly incomes (all p < 0.01). Longer daily ST was found among people with higher educational qualifications. To be specific, people with bachelor's degree and above had the longest daily ST (median: 300 min) compared to the other education levels (p < 0.01) (Figure 1C). The participants working for government agencies and institutions had the longest daily ST (median: 300 min) when compared to participants with other occupations (p < 0.01). Besides, farmers and unemployed people had lower daily ST (median: 180 and 120 min) when compared to participants of other occupation groups (p < 0.01) (Figure 1D). As shown in Figure 1E, unmarried people had longer daily ST (median: 300 min) when compared to married people (p < 0.01). Further, residents with lower household incomes had lower levels of daily ST. Specifically, residents with an average income of <2,000 Yuan (median: 180 min) had significantly lower ST than residents in other income groups (median: 240 min) (Figure 1F).
It is interesting to note that the daily ST of people with hypertension (median: 180 min) was shorter than that of people without hypertension (median: 240 min) (p < 0.01, Figure 1G). Furthermore, the daily ST of people with osteoporosis or osteopenia (35%/29.7% focused on 240 min) was shorter than that of people with normal bone density (32.1% focused on 240 min and 15.6% focused on 360 min) (p < 0.01, Figure 1H). Additionally, we found no difference in ST among different PA levels (p = 0.463 > 0.05) (Table 1).
Among various SBs, screen time (watching TV, using computers, mobile phones, and other electronic devices) was exhibited by the greatest percentage of participants (83.3%) followed by communication or chatting with neighbors and friends (36.2%). Only 17.1% of participants were involved in recreational activities, such as playing mah-jong and playing cards (Table 2).
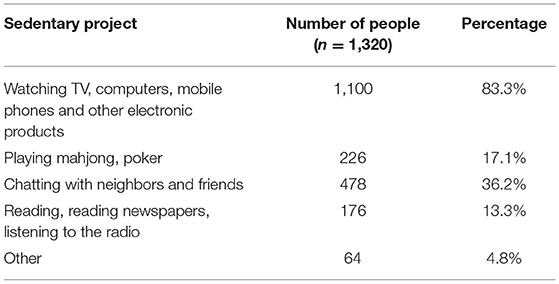
Table 2. Daily SBs of rural residents.
PA Level of Participants
Physical activity levels of participants are shown in Table 3. Our findings revealed that majority of participants (69.4%) had low levels of PA, and only 30.6% of participants achieved moderate-to-high level PA. The three PA levels were significantly different among age groups (χ2 = 28.89, p < 0.001), education levels (χ2 = 33.78, p < 0.001), profession (χ2 = 35.40, p < 0.001), household income (χ2 = 31.73, p < 0.001), and living area (χ2 = 51.54, p < 0.001). These differences were analyzed by multi-class logistic regression (Table 4).

Table 3. Analysis of the PA level of residents in rural areas of Zhejiang Province.
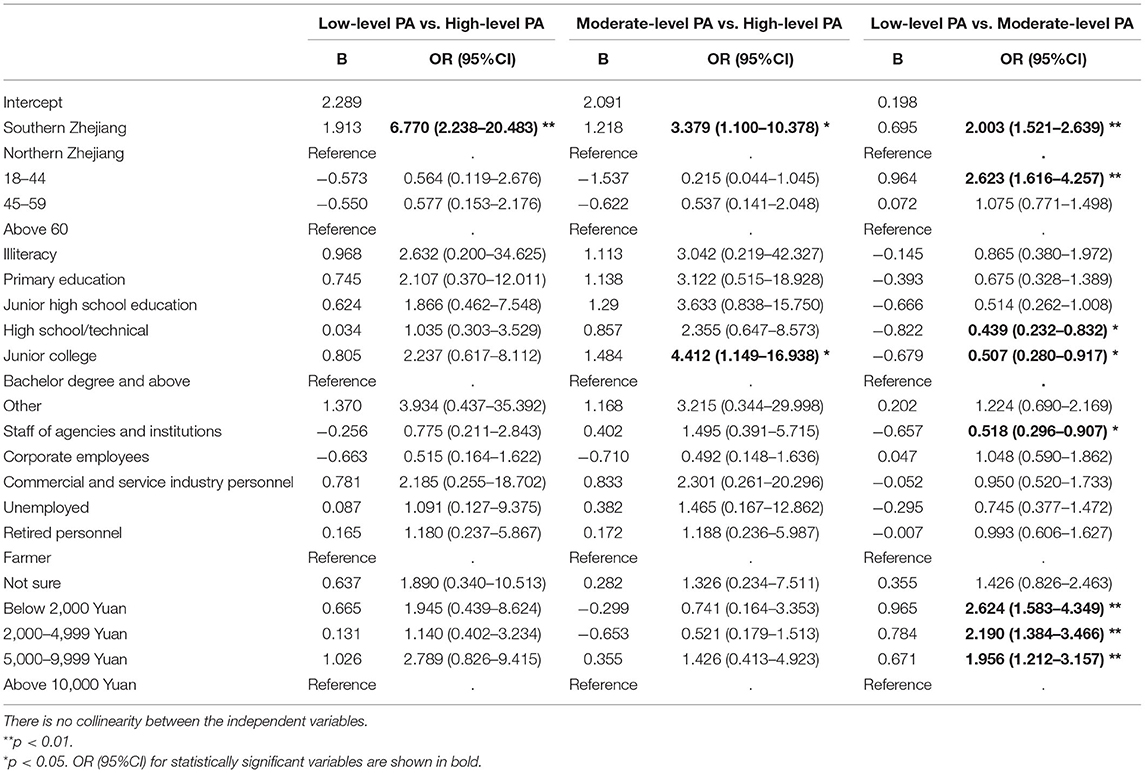
Table 4. Multivariate logistic regression analysis of factors affecting the level of PA of rural residents.
By considering HPA as the control group, the southern Zhejiang residents were 6 times more likely to engage in LPA (OR: 6.77, 95%CI: 2.238–20.483, p < 0.01) and 3 times more likely to engage in MPA (3.379, 1.100–10.378, p < 0.05) when compared to the northern Zhejiang residents. In addition, people with a junior college degree were 4 times more likely to engage in MPA than those with a bachelor's degree or above (4.412, 1.149–16.938, p < 0.05).
Considering MPA as the control group, residents of southern Zhejiang were only 2 times likely to engage in LPA compared to the northern Zhejiang residents (2.003, 1.521–2.639, p < 0.01). People aged between 18 and 44 years were 2 times more likely to engage in LPA compared with people over 60 years old (2.623, 1.616–4.257, p < 0.01).
Compared to the participants with bachelor college degree or above, participants with high school or technical education levels are only 43.9% likely to engage in LPA (0.439, CI = 0.232–0.832, p < 0.05), while 50.7% junior college degree holder are likely to engage in LPA (0.507, CI = 0.280–0.917, p < 0.05). On the other hand, 51.8% of staff working for government agencies and institutions are more likely to engage in LPA than farmers (0.518, CI = 0.296–0.907, p < 0.01). Noteworthy, participants with household income below 2,000 Yuan, 2,000–4,999 Yuan, and 5,000–9,999 Yuan per month are 2 times more likely to engage in LPA when compared to the participants with household income above 10,000 Yuan per month (Table 4).
These findings indicate that the major obstacles for PA are the lack of time (61.1%), the lack of interest (18.3%), the lack of fitness for PA (11.7%), less economic income (4.8%), fear of ridicule (2%), and other reasons (15.1%) (Table 5).
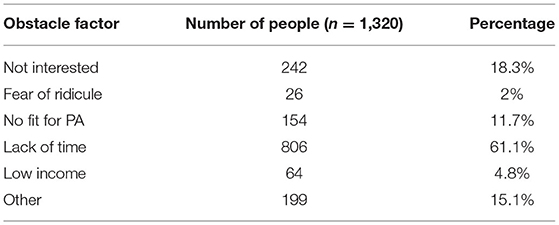
Table 5. Barriers to participation in physical activities by rural residents.
Discussion
Our findings identified the levels of ST and PA of rural residents of Zhejiang province and demonstrated the key variables responsible for the longer SB and shorter PA. It has been suggested that SB should be recorded using SB frequency, interruptions in SB, duration of each SB, and type of SB; this is similar to the measurement of PA using frequency, intensity, time, and type (25). The duration of each SB used in our study indicates the time spent in SB lasted for half an hour or above without changing the posture. In our study, the ST of participants in Zhejiang province is almost 4 h, which is similar to the ST (3.91 ± 2.06 h) of people in four counties of Shanxi and Chongqing provinces in China (26), while the ST of rural residents in other countries, such as Southern Brazil, Poland, and America (Texas), is generally 4–6 h (6, 27, 28).
To improve health and fitness, the Canadian's 24-h Movement Guidelines (29) and Physical Activity Guidelines for Americans (PAG) (30) recommended that the adult population should reduce their ST (sit less) throughout the day (8 h or less), include no more than 2–3 h of screen time, and break up long periods of sitting. Consistent with the previous studies from Henan rural residents in China, rural adults covering 31 provinces across China, and a review study with 10 countries over the world (31–33), men sit longer than women implying that rural women bear more housekeeping responsibilities than men, while men spent more time playing mah-jong and poker. Older people, especially those aged above 60 years, tend to be more sedentary than younger people in the previous studies (34–36). However, adults aged between 18 and 44 years had significantly longer ST than the other age groups in our study, which may be related to the Chinese traditional habit of people above 45 years of age willing to do more housework duties to take care of their posterity.
Longer ST of participants in our study was associated with the level of education, which is similar to earlier reports (37–40). People working for government agencies or institutions also had longer daily ST than those with other occupations including farming, unemployment, and corporate or commercial service industry occupations, who had low education levels, low socioeconomic status, the lack of use of electronic equipment (41), and tendency to engage in more active or less sedentary jobs (40). In addition, there was a negative correlation between rural residents' educational level and age. Precisely, 75.9% of people below primary school education were aged above 60 years, and 72% of people below the junior high school level were aged above 45 years, which may be the reason why the daily ST of adults aged ≥45 years was less than that of adults aged ≥18–44 years. We found that people with low education levels spent ST watching TV, talking with friends, playing mah-jong and poker, reading, listening, and other activities, which was consistent with the previous studies conducted on the general population (36, 42). Our study showed that unmarried people spend more ST than other groups, which was similar to the findings of the previous research on SB (43, 44). One possible reason was that marriage can act as a protective factor against unhealthy behaviors, as unmarried people tend to be sedentary for long periods, mainly the impact of not having a partner to hold them accountable for their unhealthy behavioral habits (45). This suggested that a marriage or long-term relationship contributes significantly to an individual's quality of life (44). We found that the average household income level was also a factor affecting the SB of rural residents, and the residents with higher income levels tended to have higher levels of SB (6, 46, 47). The possible reason for this is that rural residents of wealthy households are less likely to engage in strenuous work and daily household chores, which increases the risk of being sedentary. The lower-income families, especially peasant families, are often engaged in some labor involved job which seldom allow for these groups sit for long periods.
Although the previous research showed that SB was associated with an increased risk of hypertension (48), we found that the participants with hypertension or osteopenia or osteoporosis spent less daily ST than the participants with normal blood pressure or normal bones mass. The actual causes of hypertension are multifactorial and include genetical, behavioral, and environmental factors (49). On the other hand, there is no literature to show that patients with hypertension have less ST than people with normal blood pressure. Participants with hypertension may be aware of the risk of hypertension and are actively taking actions to reduce ST. In addition, the increase of blood pressure and the decrease of bone mass are related to the increase of age (50), while in our study, older people had less ST than younger people. Consistent with the previous studies (51), we found that there was no difference in ST among rural residents with different BMI. The available evidence does not fully support an association between SB and obesity in the adult population, as there is not strong enough evidence that elevated levels of ST cause longitudinal increases in BMI.
There is a relationship between the socioeconomic status of a country and levels of PA. Wang et al. (52) clearly stated that people tend to engage in more PA in economically advanced regions in China. Therefore, even in the same country with the same governance and healthcare system, there are geographical differences in the level of PA among different groups of people (53). We observed that the residents in the southern part of Zhejiang are more inclined to engage in LPA rather than HPA and MPA when compared to residents in the northern part of Zhejiang. Such occurrence might be due to the higher economic level, public sports service facility, and national health publicity in Northern Zhejiang. This finding may help researchers to further explore rural residents' awareness of PA in different living areas, as well as develop culturally adapted public health recommendations and intervention measures.
With an increase in age, it is inevitable that the decline of human physical function leads to decreased PA levels, and it is difficult for the elderly to achieve higher PA levels (26, 54). However, we observed that when compared to those aged above 60 years, adults aged 18–44 years were more inclined to engage in LPA rather than MPA in the rural areas. These findings agree with a previous study that the PA level of older adults was not necessarily lower than that of young adults (55), and the PA of older adults increased with increasing age (56–58). These results imply that young people may spend more time on their work and less time on PA. We observed that a group fitness activity in rural, such as square dancing, usually attracts older adults, more specifically older women who like to walk and dance together (59) and may be a considerable reason why women in rural areas spent less sitting time than men.
In rural areas of Zhejiang Province, compared with farmers, people working in public institutions were more inclined to engage in MPA rather than LPA. This is because government organizations and institutions responded to the national fitness plan issued by the state. Although the staff of government agencies and public institutions spend 1/3 of their day on sedentary work, the work unit could actively carry out the sports activities and encourage people to participate in sports competitions. To pass the national physical fitness test, some institutions not only implemented national fitness education but also provided a suitable environment to promote employees exercising (60). Farmers tended to do LPA, such as repeatedly standing upright and bending the waist to harvest crops. Farmers did not engage in enough PA to maintain their health and ability in agricultural activities (6), which is not a healthy practice of physical exercise (61). Therefore, it is necessary to encourage rural residents to engage in PA regularly.
In agreement with our findings, Zhao et al. also reported that education level and average monthly income are the key factors that affect physical exercise (26). However, we observed that people with high school or technical education or junior college are more inclined to engage in MPA than those with bachelor's degree and above. The possible reason is that people with a high school or technical or junior college education are more likely to be older than people with a bachelor's degree or above. Furthermore, people with an average monthly income of <4,999 Yuan are more likely to engage in LPA, which means that people with different economic incomes will participate in different levels of PA (9). Therefore, the government should pay attention to low-income rural residents and intervene by publicizing health awareness and sports literacy to improve people's positive understanding of the importance of participating in sports activities.
In this study, we found no correlation between ST and the intensity of PA participation in rural residents. Although sufficient moderate-to-vigorous intensity PA may only compensate the health risks of high ST to a certain degree (62), the association between PA and ST and health outcomes are independent of each other. Even if an individual's PA level reaches a moderate level or the recommended index, sitting for a long time can increase the risk of chronic diseases (63, 64). SB and lack of PA have been identified as independent health risk factors for the development of NCDs, including metabolic syndrome, overweight or obesity, hypertension, and cognitive impairment (65, 66).
The health status of residents in rural areas in Zhejiang cannot be ignored and will be improved by interventions that promote increasing the level of PA and reducing ST. Despite the rapid progress of rural urbanization, rural economic development was still backward compared with cities (31), which made rural residents more vulnerable to risks due to lack of PA and long-term ST (3, 6, 31). At present, Chinese residents have realized that PA can improve health, but they still do not understand the health risks caused by SB (67). Therefore, it is an urgent need to promote a healthy lifestyle to rural residents (68). Most rural residents in Zhejiang Province admitted that they have no spare time to participate in PA, which reminds us that time management should also be considered when providing exercise advice to them.
Limitations and Strengths
First, as this is a cross-sectional study design, causality between influencing factors and PA level or SB could not be assessed. Second, it was somewhat difficult to assess the PA and ST precisely due to self-measurement of ST and PA. Third, potential confounding factors in multivariate analysis and unmeasured factors may affect our findings. In addition, despite the same wording, questions on PA and SB may be understood or interpreted differently according to a person's culture, gender, or social background. Nonetheless, our findings have been useful for designing effective PA programs in rural communities. This study has various strengths such as the use of objective instruments to measure hypertension and bone mineral density, which offers more accurate data than other self-reported tools. An important strength is the relatively large sample size collected from different rural areas of Zhejiang Province. Moreover, in response to the scarcity of studies of this type in the Chinese rural population, this study offers new insight to better understand ST and PA levels.
Conclusion
This is the first population-based cross-sectional study that investigated the ST and PA levels of rural residents in eastern China. The findings revealed that most Chinese, especially men, young people, highly educated people, unmarried people, and middle and high-income people, had longer daily ST and a low level of PA (LPA). Nevertheless, the ST of patients with hypertension or osteopenia or osteoporosis was less than normal people. Therefore, we suggest that health education programs should accurately target different populations to improve the effectiveness of PA and reduce the SB in rural residents.
Data Availability Statement
The original contributions presented in the study are included in the article/Supplementary Material, further inquiries can be directed to the corresponding author/s.
Ethics Statement
The studies involving human participants were reviewed and approved by Wenzhou Medical University Human Research Ethics Committee (2021-010). The patients/participants provided their written informed consent to participate in this study.
Author Contributions
JW, RZ, and YW: data collection. JW and RZ: data analysis and original draft preparation. JW, RZ, MK, YW, and XC: review and editing. RZ: funding acquisition. All authors have read and agreed to the published version of the manuscript.
Funding
This study was supported by the National Social Science Fund of China (18BTY105).
Conflict of Interest
The authors declare that the research was conducted in the absence of any commercial or financial relationships that could be construed as a potential conflict of interest.
Publisher's Note
All claims expressed in this article are solely those of the authors and do not necessarily represent those of their affiliated organizations, or those of the publisher, the editors and the reviewers. Any product that may be evaluated in this article, or claim that may be made by its manufacturer, is not guaranteed or endorsed by the publisher.
Supplementary Material
The Supplementary Material for this article can be found online at: https://www.frontiersin.org/articles/10.3389/fpubh.2022.838226/full#supplementary-material
References
1. Li Y, Jia L, Wu W, Yan J, Liu Y. Urbanization for rural sustainability—rethinking China's urbanization strategy. J Clean Prod. (2018) 178:580–6. doi: 10.1016/j.jclepro.2017.12.273
2. Winichagoon P. Transition of maternal and child nutrition in Asia: implications for public health. Curr Opin Clin Nutr Metab Care. (2015) 18:312–7. doi: 10.1097/MCO.0000000000000158
3. Ding D, Sallis JF, Hovell MF, Du J, Zheng M, He H, et al. Physical activity and sedentary behaviours among rural adults in Suixi, China: a cross-sectional study. Int J Behav Nutr Phys Act. (2011) 8:37. doi: 10.1186/1479-5868-8-37
4. Tan SL, Jetzke M, Vergeld V, Müller C. Independent and combined associations of physical activity, sedentary time, and activity intensities with perceived stress among university students: internet-based cross-sectional study. JMIR Public Health Surv. (2020) 6:e20119. doi: 10.2196/20119
5. Wilcox S, Castro C, King AC, Housemann R, Brownson RC. Determinants of leisure time physical activity in rural compared with urban older and ethnically diverse women in the United States. J Epidemiol Commun Health. (2000) 54:667–72. doi: 10.1136/jech.54.9.667
6. Biernat E, Piatkowska M, Mynarski W. Prevalence and socioeconomic determinants of leisure time physical activity among Polish farmers. Ann Agric Environ Med AAEM. (2018) 25:151–6. doi: 10.26444/aaem/75927
7. Li F, Liu Y, Zhu W, Harmer P. China's challenges in promoting physical activity and fitness. Lancet. (2016) 388:1278–9. doi: 10.1016/S0140-6736(16)31672-5
8. World Health Organization. Physical Activity Fact Sheet. Geneva: World Health Organization, (2021) 2021. Report No.: Contract No.: WHO/HEP/HPR/RUN/2021.2.
9. World Health Organization. Global Action Plan on Physical Activity 2018–2030: More Active People for a Healthier World. Geneva: World Health Organization (2018).
10. Pedersen BK, Saltin B. Exercise as medicine—evidence for prescribing exercise as therapy in 26 different chronic diseases. Scand J Med Sci Sports. (2015) 25:1–72. doi: 10.1111/sms.12581
11. Piercy KL, Troiano RP, Ballard RM, Carlson SA, Fulton JE, Galuska DA, et al. The physical activity guidelines for Americans. JAMA. (2018) 320:2020–8. doi: 10.1001/jama.2018.14854
12. Healy GN, Dunstan DW, Salmon J, Shaw JE, Zimmet PZ, Owen N. Television time and continuous metabolic risk in physically active adults. Med Sci Sports Exerc. (2008) 40:639–45. doi: 10.1249/MSS.0b013e3181607421
13. Stamatakis E, Chau JY, Pedisic Z, Bauman A, Macniven R, Coombs N, et al. Are sitting occupations associated with increased all-cause, cancer, and cardiovascular disease mortality risk? A pooled analysis of seven british population cohorts. PLoS ONE. (2013) 8:e73753. doi: 10.1371/journal.pone.0073753
14. The National Fitness Plan (2021–2025) (2021). Available online at: http://www.gov.cn/zhengce/content/2021-08/03/content_5629218.htm?ivk_sa = 1023197a (accessed December 21, 2021).
15. China's Economic Social Development. (2019). Available from: https://data.cnki.net/HomeNew/Index (accessed July 10, 2020).
16. El-Menyar A, Latifi R, AbdulRahman H, Zarour A, Tuma M, Parchani A, et al. Age and traumatic chest injury: a 3-year observational study. Eur J Trauma Emerg Surg. (2013) 39:397–403. doi: 10.1007/s00068-013-0281-7
17. Macfarlane DJ, Lee CC, Ho EY, Chan KL, Chan DT. Reliability and validity of the chinese version of Ipaq (short, last 7 days). J Sci Med Sport. (2007) 10:45–51. doi: 10.1016/j.jsams.2006.05.003
18. Craig CL, Marshall AL, Sjöström M, Bauman AE, Booth ML, Ainsworth BE, et al. International physical activity questionnaire: 12-country reliability and validity. Med Sci Sports Exerc. (2003) 35:1381–95. doi: 10.1249/01.MSS.0000078924.61453.FB
19. Tremblay MS, Aubert S, Barnes JD, Saunders TJ, Carson V, Latimer-Cheung AE, et al. Sedentary Behavior Research Network (Sbrn)—terminology consensus project process and outcome. Int J Behav Nutr Phys Activity. (2017) 14:75. doi: 10.1186/s12966-017-0525-8
20. Subramaniam M, Zhang Y, Lau JH, Vaingankar JA, Abdin E, Chong SA, et al. Patterns of physical activity and health-related quality of life amongst patients with multimorbidity in a multi-ethnic Asian population. BMC Public Health. (2019) 19:1612. doi: 10.1186/s12889-019-7941-4
21. Wildman RP, Gu D, Reynolds K, Duan X, He J. Appropriate body mass index and waist circumference cutoffs for categorization of overweight and central adiposity among Chinese adults. Am J Clin Nutr. (2004) 80:1129–36. doi: 10.1093/ajcn/80.5.1129
22. Zhou B. Predictive values of body mass index and waist circumference to risk factors of related diseases in chinese adult population. Zhonghua Liu Xing Bing Xue Za Zhi. (2002) 23:5–10.
23. Rabi DM, McBrien KA, Sapir-Pichhadze R, Nakhla M, Ahmed SB, Dumanski SM, et al. Hypertension Canada's 2020 comprehensive guidelines for the prevention, diagnosis, risk assessment, and treatment of hypertension in adults and children. Can J Cardiol. (2020) 36:596–624. doi: 10.1016/j.cjca.2020.02.086
24. Kanis JA, Glüer CC. An update on the diagnosis and assessment of osteoporosis with densitometry. Committee of Scientific Advisors, International Osteoporosis Foundation. Osteoporosis Int. (2000) 11:192–202. doi: 10.1007/s001980050281
25. Tremblay MS, Colley RC, Saunders TJ, Healy GN, Owen N. Physiological and health implications of a sedentary lifestyle. Appl Physiol Nutr Metab. (2010) 35:725–40. doi: 10.1139/H10-079
26. Zhao YF, Ma JX Li JH, Chen B, Yang Y, Liang H, et al. Study on prevalence of physical activity in rural residents in four counties (Districts) of Shanxi and Chongqing. Zhonghua Liu Xing Bing Xue Za Zhi. (2018) 39:302–7. doi: 10.3760/cma.j.issn.0254-6450.2018.03.010
27. Leão OAA, Knuth AG, Meucci RD. Sedentary behavior in elderly residents from the rural area in Southern Brazil. Rev Bras Epidemiol. (2020) 23:e200008. doi: 10.1590/1980-549720200008
28. Prochnow T, Umstattd Meyer MR, Patterson MS, McClendon ME, Gómez L, Trost SG, et al. Papás Activos: associations between physical activity, sedentary behavior and personal networks among fathers living in Texas Colonias. Int J Environ Res Public Health. (2020) 17:9243. doi: 10.3390/ijerph17249243
29. Ross R, Chaput JP, Giangregorio LM, Janssen I, Saunders TJ, Kho ME, et al. Canadian 24-hour movement guidelines for adults aged 18-64 years and adults aged 65 years or older: an integration of physical activity, sedentary behaviour, and sleep. Appl Physiol Nutr Metab. (2020) 45(Suppl. 2):S57–S102. doi: 10.1139/apnm-2020-0843
30. Du Y, Liu B, Sun Y, Snetselaar LG, Wallace RB, Bao W. Trends in adherence to the physical activity guidelines for americans for aerobic activity and time spent on sedentary behavior among us adults, 2007 to 2016. JAMA Netw Open. (2019) 2:e197597. doi: 10.1001/jamanetworkopen.2019.7597
31. Tu R, Li Y, Shen L, Yuan H, Mao Z, Liu X, et al. The prevalence and influencing factors of physical activity and sedentary behaviour in the rural population in China: the Henan rural cohort study. BMJ Open. (2019) 9:e029590. doi: 10.1136/bmjopen-2019-029590
32. Harvey JA, Chastin SF, Skelton DA. How sedentary are older people? a systematic review of the amount of sedentary behavior. J Aging Phys Activity. (2015) 23:471–87. doi: 10.1123/japa.2014-0164
33. Ding C, Song C, Yuan F, Zhang Y, Feng G, Chen Z, et al. The physical activity patterns among rural Chinese adults: data from China National Nutrition and Health Survey in 2010–2012. Int J Environ Res Public Health. (2018) 15:941. doi: 10.3390/ijerph15050941
34. O'Donoghue G, Perchoux C, Mensah K, Lakerveld J, van der Ploeg H, Bernaards C, et al. A systematic review of correlates of sedentary behaviour in adults aged 18-65 years: a socio-ecological approach. BMC Public Health. (2016) 16:163. doi: 10.1186/s12889-016-2841-3
35. Matthews CE, Chen KY, Freedson PS, Buchowski MS, Beech BM, Pate RR, et al. Amount of time spent in sedentary behaviors in the United States, 2003–2004. Am J Epidemiol. (2008) 167:875–81. doi: 10.1093/aje/kwm390
36. Bowman SA. Television-viewing characteristics of adults: correlations to eating practices and overweight and health status. Prev Chronic Dis. (2006) 3:A38.
37. Lakerveld J, Loyen A, Schotman N, Peeters CFW, Cardon G, van der Ploeg HP, et al. Sitting too much: a hierarchy of socio-demographic correlates. Prev Med. (2017) 101:77–83. doi: 10.1016/j.ypmed.2017.05.015
38. Bennie JA, Chau JY, van der Ploeg HP, Stamatakis E, Do A, Bauman A. The prevalence and correlates of sitting in European adults—a comparison of 32 Eurobarometer-Participating Countries. Int J Behav Nutr Phys Act. (2013) 10:107. doi: 10.1186/1479-5868-10-107
39. Hadgraft NT, Lynch BM, Clark BK, Healy GN, Owen N, Dunstan DW. Excessive sitting at work and at home: correlates of occupational sitting and tv viewing time in working adults. BMC Public Health. (2015) 15:899. doi: 10.1186/s12889-015-2243-y
40. Patterson F, Lozano A, Huang L, Perkett M, Beeson J, Hanlon A. Towards a demographic risk profile for sedentary behaviours in middle-aged British adults: a cross-sectional population study. BMJ Open. (2018) 8:e019639. doi: 10.1136/bmjopen-2017-019639
41. de Farias JC Jr. Association between prevalence of physical inactivity and indicators of socio-economic status in adolescents. Rev Bras De Med Do Esporte. (2008) 14:109–14. doi: 10.1590/s1517-86922008000200005
42. Dunstan DW, Barr ELM, Healy GN, Salmon J, Shaw JE, Balkau B, et al. Television viewing time and mortality the Australian diabetes, obesity and lifestyle study (Ausdiab). Circulation. (2010) 121:384–91. doi: 10.1161/CIRCULATIONAHA.109.894824
43. Herman KM, Saunders TJ. Sedentary behaviours among adults across Canada. Can J Public Health. (2016) 107:e438–e46. doi: 10.17269/CJPH.107.5587
44. Ishii K, Shibata A, Oka K. Sociodemographic and anthropometric factors associated with screen-based sedentary behavior among Japanese adults: a population-based cross-sectional study. J Epidemiol. (2013) 23:382–8. doi: 10.2188/jea.JE20130008
45. Huffman S, Szafron M. Social correlates of leisure-time sedentary behaviours in Canadian adults. Prev Med Rep. (2017) 5:268–74. doi: 10.1016/j.pmedr.2017.01.007
46. Mello GT, Lopes MVV, Minatto G, Costa RMD, Matias TS, Guerra PH, et al. Clustering of physical activity, diet and sedentary behavior among youth from low-, middle-, and high-income countries: a scoping review. Int J Environ Res Public Health. (2021) 18:10924. doi: 10.3390/ijerph182010924
47. Dendup T, Zhao Y, Edi Putra IGN, Dorji T, Tenzin C. Correlates of sedentary behavior among Bhutanese adults: findings from the 2014 Bhutan Steps Survey data. Korean J Fam Med. (2021) 42:288–96. doi: 10.4082/kjfm.20.0059
48. Melo EAS, Ferreira LES, Cavalcanti RJF, Botelho Filho CAL, Lopes MR, Barbosa RHA. Nuances between Sedentary Behavior and Physical Inactivity: Cardiometabolic Effects and Cardiovascular Risk. Rev Assoc Med Bras. (2021) 67:335–43. doi: 10.1590/1806-9282.67.02.20200746
49. Gu J-W, Bailey AP, Tan W, Shparago M, Young E. Long-term high-salt diet causes hypertension and decreases renal expression of vascular endothelial growth factor in sprague-dawley rats. J Am Soc Hypertension. (2008) 2:275–85. doi: 10.1016/j.jash.2008.03.001
50. Bolam KA, van Uffelen JG, Taaffe DR. The effect of physical exercise on bone density in middle-aged and older men: a systematic review. Osteoporosis Int. (2013) 24:2749–62. doi: 10.1007/s00198-013-2346-1
51. Biddle SJH, García Bengoechea E, Pedisic Z, Bennie J, Vergeer I, Wiesner G. Screen time, other sedentary behaviours, and obesity risk in adults: a review of reviews. Curr Obes Rep. (2017) 6:134–47. doi: 10.1007/s13679-017-0256-9
52. Wang M, Wen X, Zhang Y, Jiang C, Wang F. Is Economic environment associated with the physical activity levels and obesity in chinese adults? A cross-sectional study of 30 regions in China. BMC Public Health. (2017) 17:701. doi: 10.1186/s12889-017-4699-4
53. Leeger-Aschmann CS, Schmutz EA, Radtke T, Kakebeeke TH, Zysset AE, Messerli-Bürgy N, et al. Regional sociocultural differences as important correlate of physical activity and sedentary behaviour in Swiss preschool children. Swiss Med Wkly. (2016) 146:w14377. doi: 10.4414/smw.2016.14377
54. Caspersen CJ, Pereira MA, Curran KM. Changes in physical activity patterns in the United States, by sex and cross-sectional age. Med Sci Sports Exerc. (2000) 32:1601–9. doi: 10.1097/00005768-200009000-00013
55. Krems C, Lhrmann PM, Neuhuser-Berthold M. Physical activity in young and elderly subjects. J Sports Med Phys Fitness. (2004) 44:71–6.
56. Palacios-Ceña D, Alonso-Blanco C, Jiménez-Garcia R, Hernández-Barrera V, Carrasco-Garrido P, Pileño-Martinez E, et al. Time trends in leisure time physical activity and physical fitness in elderly people: 20 year follow-up of the Spanish Population National Health Survey (1987–2006). BMC Public Health. (2011) 11:799. doi: 10.1186/1471-2458-11-799
57. Chau J, Smith BJ, Bauman A, Merom D, Eyeson-Annan M, Chey T, et al. Recent trends in physical activity in new south wales. Is the tide of inactivity turning? Aust N Z J Public Health. (2008) 32:82–5. doi: 10.1111/j.1753-6405.2008.00170.x
58. Morseth B, Hopstock LA. Time trends in physical activity in the tromsø study: an update. PLoS ONE. (2020) 15:e0231581. doi: 10.1371/journal.pone.0231581
59. Zhang Y, Xie G, Huang J, Li S. A new leisure-time physical activity in China: square dancing. Minerva Med. (2019) 110:180–1. doi: 10.23736/S0026-4806.18.05932-3
60. Huang SJ, Hung WC. Policy, environment, and worksite fitness program participation among financial enterprise employees in Taiwan. J Exerc Sci Fit. (2016) 14:29–34. doi: 10.1016/j.jesf.2016.05.001
61. Olsen O, Kristensen TS. Impact of work environment on cardiovascular diseases in Denmark. J Epidemiol Commun Health. (1991) 45:4–9; discussion−10. doi: 10.1136/jech.45.1.4
62. Bachner J, Sturm DJ, Demetriou Y. Accelerometer-measured physical activity and sedentary behavior levels and patterns in female sixth graders: the creactivity project. Int J Environ Res Public Health. (2020) 18:32. doi: 10.3390/ijerph18010032
63. Patel AV, Bernstein L, Deka A, Feigelson HS, Campbell PT, Gapstur SM, et al. Leisure time spent sitting in relation to total mortality in a prospective cohort of US adults. Am J Epidemiol. (2010) 172:419–29. doi: 10.1093/aje/kwq155
64. Bauman A, Ainsworth BE, Sallis JF, Hagströmer M, Craig CL, Bull FC, et al. The descriptive epidemiology of sitting. A 20-country comparison using the International Physical Activity Questionnaire (Ipaq). Am J Prevent Med. (2011) 41:228–35. doi: 10.1016/j.amepre.2011.05.003
65. Zhu W, Howard VJ, Wadley VG, Hutto B, Blair SN, Vena JE, et al. Association between objectively measured physical activity and cognitive function in older adults-the reasons for geographic and racial differences in stroke study. J Am Geriatr Soc. (2015) 63:2447–54. doi: 10.1111/jgs.13829
66. Dempsey PC, Owen N, Biddle SJ, Dunstan DW. Managing sedentary behavior to reduce the risk of diabetes and cardiovascular disease. Curr Diab Rep. (2014) 14:522. doi: 10.1007/s11892-014-0522-0
67. Fan M, Lyu J, Guo Y, Bian Z, Yu C, Du H, et al. Regional differences on patterns of physical activity and leisure sedentary time: findings from the China Kadoorie Biobank Study, including a million people from 10 regions. Zhonghua Liu Xing Bing Xue Za Zhi. (2015) 36:779–85. doi: 10.3760/cma.j.issn.0254-6450.2015.08.002
Keywords: sedentary behavior, physical activity levels, rural areas, adults, IPAQ-SF
Citation: Wang J, Wang Y, Korivi M, Chen X and Zhu R (2022) Status of Sedentary Time and Physical Activity of Rural Residents: A Cross-Sectional Population-Based Study in Eastern China. Front. Public Health 10:838226. doi: 10.3389/fpubh.2022.838226
Received: 17 December 2021; Accepted: 14 March 2022;
Published: 14 April 2022.
Edited by:
Selina Khoo, University of Malaya, MalaysiaReviewed by:
Lei Xi, Virginia Commonwealth University, United StatesChia-Hua Kuo, University of Taipei, Taiwan
Copyright © 2022 Wang, Wang, Korivi, Chen and Zhu. This is an open-access article distributed under the terms of the Creative Commons Attribution License (CC BY). The use, distribution or reproduction in other forums is permitted, provided the original author(s) and the copyright owner(s) are credited and that the original publication in this journal is cited, in accordance with accepted academic practice. No use, distribution or reproduction is permitted which does not comply with these terms.
*Correspondence: Rong Zhu, emh1cm9uZ0B3bXUuZWR1LmNu; Xi Chen, Y2hlbnhpQHdtdS5lZHUuY24=
†These authors have contributed equally to this work and share first authorship