 Daniel Antonio Negrón1*
 June Kang1
 Shane Mitchell1
 Mitchell Y. Holland1
 Stephen Wist1Jameson Voss2
 Lauren Brinkac1Katharine Jennings1Stephanie Guertin3Bruce G. Goodwin2
 Shanmuga Sozhamannan2,4
- 1Noblis, Inc., Reston, VA, United States
- 2Joint Program Executive Office for Chemical, Biological, Radiological and Nuclear Defense (JPEO-CBRND), Joint Project Lead for CBRND Enabling Biotechnologies (JPL CBRND EB), Frederick, MD, United States
- 3Noblis ESI, Chantilly, VA, United States
- 4Logistics Management Institute, Tysons, VA, United States
Real-time reverse transcription polymerase chain reaction (RT-PCR) assays are the most widely used molecular tests for the detection of SARS-CoV-2 and diagnosis of COVID-19 in clinical samples. PCR assays target unique genomic RNA regions to identify SARS-CoV-2 with high sensitivity and specificity. In general, assay development incorporates the whole genome sequences available at design time to be inclusive of all target species and exclusive of near neighbors. However, rapid accumulation of mutations in viral genomes during sustained growth in the population can result in signature erosion and assay failures, creating situational blind spots during a pandemic. In this study, we analyzed the signatures of 43 PCR assays distributed across the genome against over 1.6 million SARS-CoV-2 sequences. We present evidence of significant signature erosion emerging in just two assays due to mutations, while adequate sequence identity was preserved in the other 41 assays. Failure of more than one assay against a given variant sequence was rare and mostly occurred in the two assays noted to have signature erosion. Assays tended to be designed in regions with statistically higher mutations rates. in silico analyses over time can provide insights into mutation trends and alert users to the emergence of novel variants that are present in the population at low proportions before they become dominant. Such routine assessment can also potentially highlight false negatives in test samples that may be indicative of mutations having functional consequences in the form of vaccine and therapeutic failures. This study highlights the importance of whole genome sequencing and expanded real-time monitoring of diagnostic PCR assays during a pandemic.
Introduction
Severe acute respiratory syndrome coronavirus 2 (SARS-CoV-2), like other Coronaviruses, is an enveloped virus with a linear, positive-sense single-stranded RNA genome. SARS-CoV-2 genomes range from 27 to 32 kb with an arrangement that is co-linear with other Coronaviruses. The genome is flanked by untranslated regions (UTRs) and protected by a 5′ 7-methylguanosine (m7G) cap and 3′ poly-A tail (1, 2). Genomic translation of ORF1ab yields polyproteins pp1a and pp1ab, which undergo autoproteolysis to yield non-structural (nsp) proteins involved in expression and replication (2). Transcription of the S (spike), E (envelope), M (membrane), and N (nucleocapsid) yields structural proteins for dissemination (2). Additional accessory protein genes include ORF 3a, 6, 7a, 7b, 8, and 9b (2, 3).
Whole genome sequencing (WGS) based genetic surveillance is critical for tracking and forecasting pathogen evolution. Phylogenetic analyses can estimate the spatiotemporal mobility of pathogens between communities around the world over the course of a pandemic. This has been essential for identifying a circulating Variant Being Monitored (VBM), Variant of Concern (VoC), or Variant of Interest (VoI) of SARS-CoV-2, the causative agent of coronavirus disease 2019 (COVID-19). Since the emergence of SARS-CoV-2 in late 2019, sustained transmission among the human host has generated numerous variants with specific phenotypic attributes. Mutations that potentially confer increased transmission, pathogenicity (4), immune escape, or resistance to therapeutics can be identified when sequenced and interpreted by combining in silico inferences with in vitro functional, animal, and epidemiological studies to link genotypes to phenotypes. Without genomic surveillance, some mutations may go unnoticed if they do not impact diagnostic assays.
Polymerase chain reaction (PCR) assays are susceptible to false negatives that result from mutations that weaken primer annealing. For example, a mutation or mutations causing one primer set to fail within a multiplex assay—called a partial assay failure—is best exemplified by the Alpha (B.1.1.7) variant. This variant was discovered first in the UK in December, 2020 by the so-called S gene target failure (SGTF) (aka the S gene dropout) in a Thermofisher TaqPath PCR test kit that targets 3 different regions (ORF1ab, E gene, and S gene) of the viral genome (5). A 6-nt deletion (Δ69–70 aa) resulted in the SGTF while the other two targets of the kit were positive for a given sample (5). After analyses determined the cause of the target failure was a new mutation, SGTF was used as a proxy for the presence of Alpha variant (B.1.1.7) in test samples. There are other examples of less severe assay failures in some commercial SARS-CoV-2 PCR tests (6, 7). Such failures affect biosurveillance network responses and public health policy decisions for disease control, containment, and prevention as they form the basis for our understanding of how an outbreak is progressing. Thus, systematic and periodic assessment of real-time PCR assay performance is critical for maintaining assay specificity and decreasing false negatives (6–10).
The Global Initiative on Sharing Avian Influenza Data (GISAID) organization and Nextstrain project provide genomic data, metadata, and phylodynamic analysis for monitoring ongoing outbreaks (11, 12). Continuous rapid sampling and sequencing of SARS-CoV-2 and sharing of data throughout the course of this pandemic provided a unique opportunity for visualizing signature erosion over time. Specifically, since January 20, 2020, we have used the PCR Signature Erosion Tool (PSET) to periodically evaluate assays in silico against all SARS-CoV-2 genome sequences from the GISAID EpiCoV™ database and share results on virological.org (13). PSET has been used previously to evaluate the impact of genomic drift on current and proposed assays for Ebolavirus and Mammarenavirus (14, 15).
Here, we present our assessment of diagnostic PCR assays in silico by applying PSET to regularly collected SARS-CoV-2 sequences. Recent alignment-based studies have been conducted with comparable results (8, 9). Our approach significantly increases the number of assays and subject sequences tested, breaks-down alignment rates over time by lineage, compares the mutation rate of assay target regions to the rest of the genome, and calculates the number of sequences producing false negatives for multiple assays.
Materials and Methods
PSET Analysis
In this study we tested the in silico performance of 43 PCR assays (Supplementary Table 1) with different gene targets [19 ORF1ab, 8 spike (S) protein, 1 ORF3a, 3 envelope (E) protein, 1 ORF8, and 11 nucleocapsid (N)] against a set of 1,690,689 SARS-CoV-2 accessions (Supplementary Table 2) and sequences downloaded from the GISAID EpiCoV™ database on July 7, 2021 (11, 13, 16–26). At the time of analysis, the CDC listed Pango lineages P.1, B.1.351, B.1.1.7, B.1.427, and B.1.429 as VoCs and lineages P.2, B.1.525, and B.1.526 as VoIs (27, 28). Additional follow-up analysis was performed on the B.1.1.529 VoC as it emerged later. The PSET definition for each assay target was based on a reference amplicon sequence with delimited primer and probe regions (Figure 1). Twenty nucleotides of additional sequence context outside the amplicon were also included to inform alignment at the 5′ and 3′ ends. Context and inter-primer regions were obtained via global-local alignment of the assay primers to the SARS-CoV-2 reference genome by running the glsearch36 program of the FASTA suite (29).

Figure 1. PSET assay definition. The assay definition includes square brackets and parentheses to delimit the primer sequences. Note that a probe is optional and that any sequence outside of the amplicon region is considered context for alignment purposes. This example corresponds to the cdc_n1 assay.
The first phase of PSET analysis queries the assay target definition against a BLAST+ database to search for matching subjects based on local alignment with the blastn program (30). Expansion of ambiguous DNA codes of the query is required for compatibility. For example, “GAWTAYA” has two, representing four expansions: “GAATACA,” “GATTACA,” “GAATATA,” and “GATTATA.” Only the first permutation is queried. An additional step re-evaluates the BLAST+ identity statistics by replacing the expanded query with the original one to account for ambiguous base similarity. Subjects with ≥85% identity to the amplicon region are then extended to cover the query range and extracted.
The second phase queries the corresponding primers separately against the library of extracted sequences to search for matching subjects based on global-local alignment with the glsearch36 program, which is compatible with ambiguous DNA codes. Subjects with ≥90% identity are kept and aggregated by subject accession. A true positive (TP) is called if all primers aligned to the subject with the required identity and strand arrangement such that the primer would hypothetically amplify the target. The special case of a perfect true positive (PT) is called when there is 100% identity. Otherwise, a false negative (FN) is called. If the subject contains an N in any of the primer alignment regions, an N is appended to the category name (TPN and FNN). Doing so avoids removing low-quality, yet potentially informative sequences. An additional unknown (UNK) category is included to account for subjects that failed alignment during the first phase. In the case of near-neighbor analysis, a false positive (FP) or true negative (TN) is called when the taxonomy of the subject differs from the assay target. FPs with 100% identity are perfect false positives (PF).
Results were filtered to include high-coverage, human-host sequences with assigned Centers for Disease Control (CDC) and Pango lineages corresponding to VoC [Alpha (B.1.1.7), Beta (B.1.351), Gamma (P.1), Delta (B.1.617), Epsilon (B.1.427/B.1.429)] and VoI [Eta (B1.525), Theta (P.2), and Iota (B.1.526)] (27, 28). Metadata also included VoC and VoI designation times from disease control centers (31–39). Further aggregation and visualization was performed using the R programming language with the tidyverse (v1.3.1), lubridate (1.8.0), tsibble (v1.1.0), and cowplot (v1.1.1) packages (40–43). The PSET workflow itself was implemented using Biopython and Snakemake (44, 45). A summary of results and methodology refinements were posted to virological.org on a near-weekly basis (13).
Variation Analysis
For variant analysis, the local GISAID EpiCoV™ database used for the PSET analysis was filtered to include only unambiguous DNA codes, resulting in a subset of 961,051 sequences. Single nucleotide variations (SNVs) and insertions or deletions (indels) were calculated by running the nucmer and show-snps programs of the MUMmer4 suite (46). Parameters for nucmer included NCBI GenBank accession no. NC_045512.2 (47) as the reference and flags to search the forward strand of each query (-f) with 28 threads (-t). The show-snps program transformed the resulting delta file into a tabular file (-T) of SNP/indel calls. An R script loaded the variants identified via MUMmer4 and split the data into two groups according to overlap with assay primer and probe target regions. The percentage of positions with ≥n mutations was calculated, where n was in the range [0, 500]. A two-sample Kolmogorov-Smirnov procedure tested the null hypothesis that the observed mutation percentages arose from the same distribution for the assay target and non-target genomic regions.
Omicron Analysis
The Omicron (B.1.1.529) wave emerged after the initial analysis was completed. Accordingly, an updated analysis targeted this VoC. On February 16, 2022, genomes were downloaded manually from the EpiCoV™ search page. Filters were enabled to include complete sequences with high coverage and collection dates. The PSET workflow analyzed the final set of 48,358 sequences (Supplementary Table 3) as previously described.
Results
Assay Regions and Genomic Variation
Figure 2 shows the target region of each assay with respect to the reference SARS-CoV-2 genome (NCBI GenBank accession no. NC_045512.2), SNVs, and indels (47). Mutations with <1% prevalence (~99.62% of all positions with observed mutations) were excluded from the figure but remain listed in Supplementary Table 4. The figure also plots the assay target regions on the genome. Plotting all the regions together with respect to mutations helps visualize signature erosion due to genetic drift.
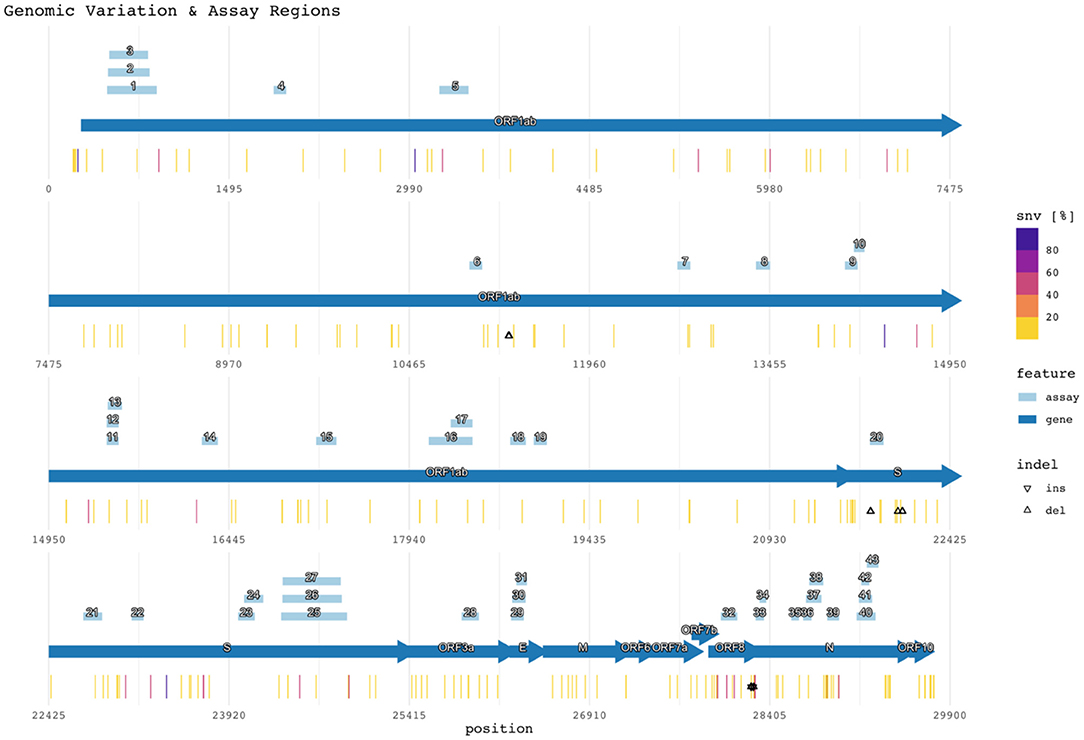
Figure 2. Genomic variation and assay regions. The numbered rectangles and labeled arrows indicate PCR assay and gene regions respectively. Heat values indicate the percentage of SNVs observed at the reference location across all subjects. Percentages for both SNVs and indels are compiled in Supplementary Table 4.
On the other hand, when the assay target regions are compared specifically against the non-target regions, assay target regions with mutations are present in higher percentage of genomes (Figure 3). The two-sample Kolmogorov-Smirnov test obtained a p value of 2.2E−16, rejecting the null hypothesis at a significance level of 0.05 in favor of the two-sided alternative.
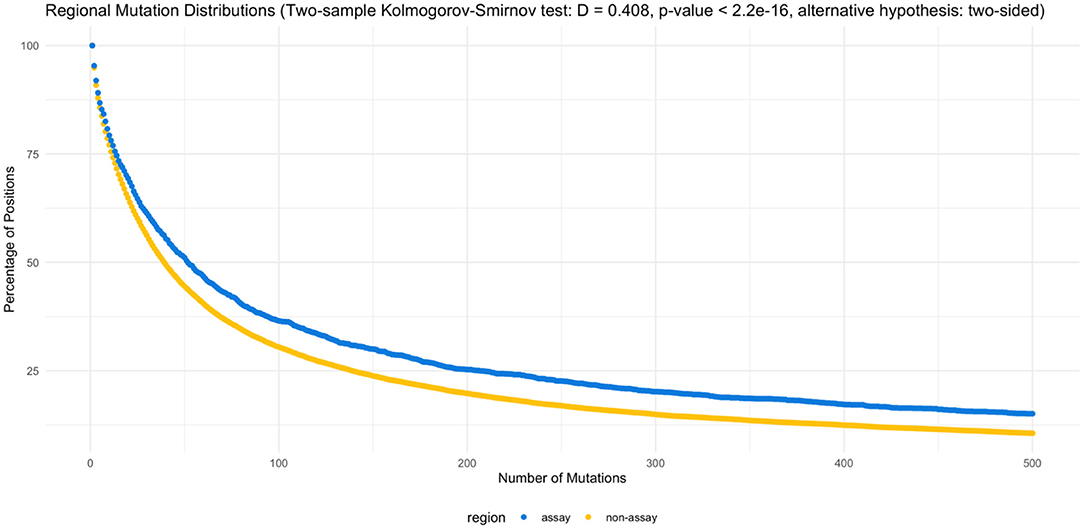
Figure 3. Regional mutation distributions. The two-sample Kolmogorov-Smirnov test rejected the null hypothesis (α = 0.05), supporting the elevated number of mutations observed in the assay regions (D = 0.408, p < 2.2e−16, alternative hypothesis: two-sided). Supplementary Tables 5, 6 list the counts by position and percentage of mutations by region.
Assay Alignment Confusion Matrix
The assays were able to correctly detect the vast majority of the 1,690,689 genome sequences according to the in silico PSET analysis. Of the 43 assays, 34 aligned with 100% identity to over 1.6 million subjects. Otherwise, TP rates exceeded 98%, except for the Young-S and China_N assays, which exhibited high FN rates at ~47% and ~59% respectively. The TP percentage was calculated as the sum of PT, TP, and TPN divided by the total number of subjects. Alignments exceeded identity threshold for most corresponding subject amplicon sequences, only failing on average ~0.74% (UNK%) of the time. Table 1 and Supplementary Table 7 include a full breakdown by assay. In the separate Omicron study, most of the assays (40 / 43) were able to detect sequences with a TP rate of ≥96%, with Young_S, Thailand_WH-NIC_N, and China_N assays having reached TP rates of 75.64%, 2.98%, and 0.34% respectively (Supplementary Table 8). We also looked at the specificity of the assays against near-neighbor sequences (Supplementary Table 9), where 8 showed significant false positives (FP) and perfect FPs (PFs) (those with 100% identity).
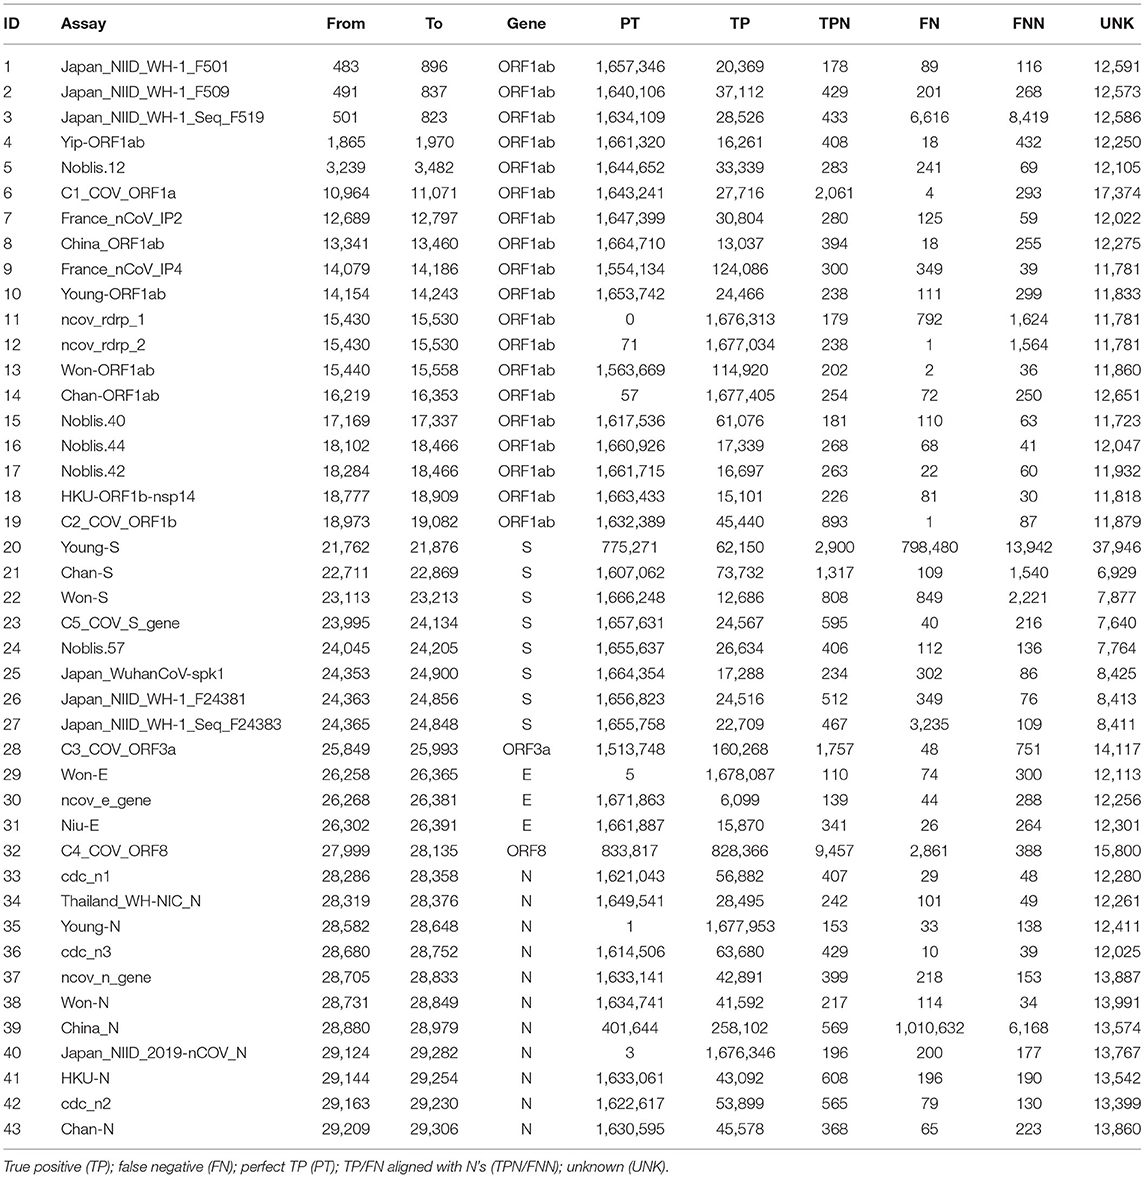
Table 1. Confusion matrix of assay calls based on alignment/arrangement.
Assay Alignment Identity Over Time
Alignment identity of all assays against sequences of different lineages of SARS-CoV-2 was assessed from 2020-03-15 to 2021-07-05. Figure 4 depicts heat maps of the TP rate over time for each VoC/VoI with a corresponding line graph of the cumulative log-total number of sequences. Only GISAID sequences with collection date metadata specifying year, month, and day were included in the heatmap. The graph reveals sudden changes in assay alignment identity with respect to variant abundance.
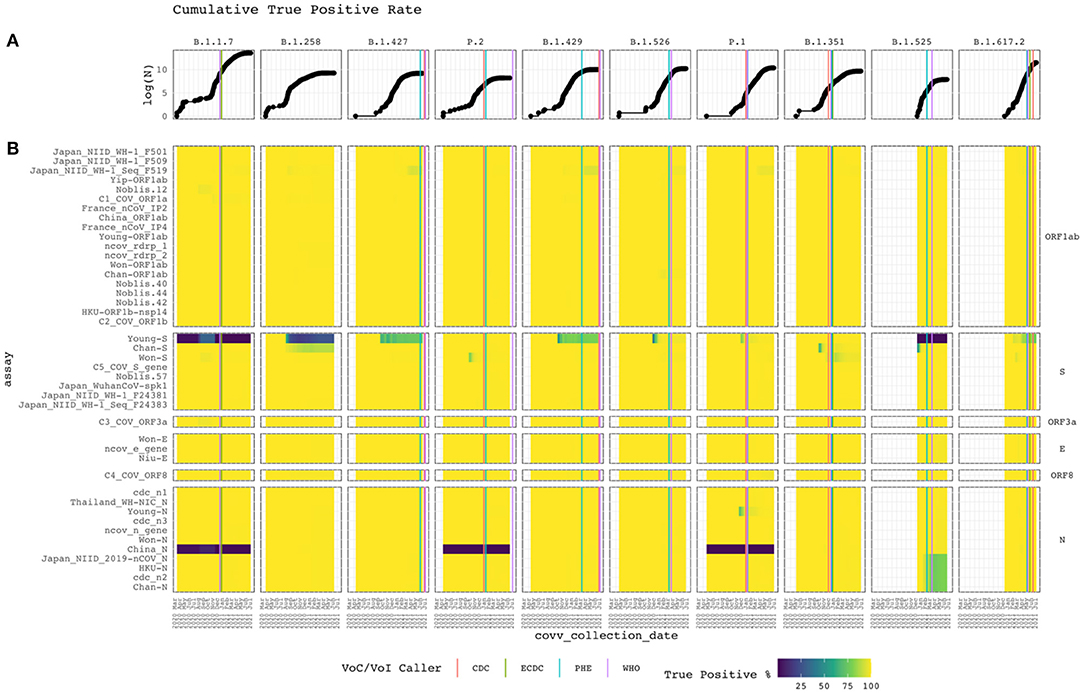
Figure 4. Cumulative true positive rate. Vertical and horizontal facets divide the graph by Pango lineage and assay target gene. (A) The top line graph shows the logarithm of the cumulative total of subject sequences. (B) Heat map of the current PCR assays with the cumulative conditional true positive rate assessed from Apr 2020 to Feb 2021. The assay targeting specific genes are labeled on the right. White represents the absence of subject sequences of the lineage in the reference database. Vertical lines when each disease control organization called the lineage a VoC/VoI based on available data (compiled in Supplementary Table A).
Alignment identity remained constant for most assays, with perfect or near-perfect TP rates. However, some interesting patterns were observed. Some assays targeting the S and N genes performed poorly. For example, Young-S exhibited low TP rates within the B.1.1.7 and B.1.525 lineages and faltered for B.1.258, B.1.427, and B.1.429 isolates as cumulative sampling increased. Other assays targeting the S protein gene performed well, despite some temporary rough patches for Chan-S, Won-S and C5_COV_S_gene. Recently, Chan-S appears to have started failing for the B.1.258 lineage. China_N failed for the B.1.1.7, P.2, and P.1 clades. All other assays targeting the N gene performed well. However, Japan_NIID_2019-nCOV_N, HKU-N, cdc_n2, and Chan-N recently started failing for the B.1.525 lineage. Also, Young-N temporarily exhibited a low TP rate before recovering.
VoC/VoI Call Patterns
Figure 4 displays the timeline for each lineage to be identified as a VoC/VoI by the CDC, European CDC (ECDC), Public Health England (PHE), and World Health Organization (WHO). Most identifications occurred within a month of each other. However, for P.2 and B.1.429, 186 and 118 days passed between the initial and final call. The CDC and PHE called the former within 12 days of each other and the former within 111 days. In both cases, the WHO called last. We found no evidence of a call from the ECDC in these cases. The B.1.429 case shows the initial call occurring during a period of low alignment identity for the Young-S assay and the beginning of a decline for the Japan_NIID_WF-1_Seq_F519 assay. Despite the varying times at which these lineages were identified, when looking at the cumulative increase of the GISAID sequences for each, it is readily apparent that they initially occurred at very low proportions. This increase, and the resulting VoC/VoI designations, underscore the importance of continual monitoring from multiple organizations offering different perspectives and criteria with respect to spatiotemporal trends.
In silico False Negative Distribution by Assay
As assay targets were distributed throughout the genome, we were also interested in seeing whether emerging variants possessed mutations that resulted in more than one assay producing a predicted FN. Supplementary Table SB shows that nearly all (>99%) sequences resulted in a predicted true positive in at least 41 of 43 assays. Also, Supplementary Table SC shows that the majority (97%) of sequences producing a single FN were observed to originate from the China_N (87%) or Young-S (10%) assays. The majority (765,813) of sequences produced FNs in two different assays, China_N and Young-S, while 643,876 sequences did not produce an FN in any of the 43 assays. We observed a substantial drop-off in the number of sequences which caused FNs in 3 or more assays. This suggests that it is unlikely for a sequence to produce FNs in more than 2 assays and that a multiplex panel with any of the other 41 assays evaluated here would likely perform successfully.
Discussion
Signature Erosion Analysis
The rapid increase of novel SARS-CoV-2 variants raises concerns regarding the efficacy of PCR-based diagnostic assays. This study assesses the potential signature erosion of the current COVID-19 real-time diagnostic assays using the GISAID sequence database. We find that 41 out of the 43 assays continue to perform very well throughout the observed timeframe even as new variants arose. Additional analysis completed after the emergence of Omicron revealed that 40 of 43 assays continued to perform well.
Variants containing mutations within the target regions for primer and probe hybridization were observed to have a substantial effect on predicted assay alignment identity. The characteristic S:Δ69/70 mutation of the Alpha variant occurs within the forward primer of the Young-S assay target, while mutations N:R203K and N:G204R occurred within the borders of the China_N assay target, resulting in PSET calling significant FN rates of those assays. The China_N assay failed completely for the lineages B.1.1.7, P1, and P2. This may be due to a “GGG” to “AAC” mutation in the forward primer, as observed in previous studies (8, 9). The 3-nt substitution mutation could potentially reduce the China_N forward primer binding affinity, which could significantly increase the FN rate, especially since it occurs at the 5′-end. The B.1.1.529 lineage contains an N:Δ31/33 deletion (48) which falls inside the borders of the Thailand_WH-NIC_N assay and results in PSET predicting significant FN rates. This may be a similar situation as described above where primer binding affinity is affected by this type of mutation.
Various point mutations at the primer binding motifs are observed in all the lineages, which did not affect overall performance according to evaluation of in silico alignments. The exception was for lineage B.1.258, which bears a complementary sequence to the China_N primer resulting in perfect alignment. The China_N and Young-S assays experience 56 × and 44 × the FN rate of all other assays combined, respectively. In almost all assays, there is a percentage of mutations in one of the targets of the assay.
Recent Studies and Future Direction
The COVID-19 pandemic has demonstrated the need for the in silico monitoring of PCR-based diagnostic assay performance. Furthermore, given that surveillance network data are widely available to aid in quick-turnaround research and development of replacement assays, in silico monitoring has become an important early warning indicator (10). Our approach is consistent with recent alignment-based studies by confirming the overall high assay target sequence identity and detection of the China_N mutation (8, 9). We also observed potential early signs of signature erosion prior to official variant calls. Future research can further elucidate validation of in vitro and in silico predictions while considering the clinical and public health relevance. For example, the PSET algorithm could incorporate mismatch position, since mismatches near the 3′ end of the probe sequence potentially have a greater impact on assay performance (49, 50). Additional wet lab experiments can help systematically select alignment thresholds and motivate algorithmic refinements.
Conclusion
This study highlights the consequences of mutations in SARS-CoV-2 genomes on PCR-based diagnostic assays. The importance of real-time monitoring of molecular assay alignment in silico is highlighted by the discovery of the Alpha variant. The failure of one primer/probe combination within the multiplex assay targeting a region of a deletion in this variant underscored the need for extensive sequence-based surveillance. Sustained transmission and proliferation of viruses such as SARS-CoV-2 in a global pandemic leads to rapid evolution and accumulation of mutations that confer advantageous phenotypes, such as potentially evading diagnostics, therapeutics, and vaccines. Real-time in silico monitoring of assay signature erosion allows for the redesign and refinement of diagnostic assays to address assay and medical countermeasure failures to avoid dire failures of medical countermeasures.
Data Availability Statement
The original contributions presented in the study are included in the article/Supplementary Material, further inquiries can be directed to the corresponding author/s.
Author Contributions
SS: conceptualization and supervision. DN, JK, and SW: data curation. DN, JK, SM, and SW: formal analysis. BG: funding acquisition. DN, JK, SM, LB, and SS: investigation. DN, JK, SM, MH, SW, and SS: methodology. BG and SS: project administration. DN, MH, and SW: software. DN, JK, SM, SW, JV, and SS: validation. DN and SW: visualization. DN, JK, SM, and SS: writing—original draft. DN, JK, SM, JV, LB, KJ, SG, and SS: writing—review and editing. All authors contributed to the article and approved the submitted version. The following CRediT (Contributor Roles Taxonomy) terms indicate the corresponding initials of the contributing authors.
Funding
Funding for this work was provided by Joint Program Executive Office, JPL-CBRND-EB, DBPAO under the contract number W911QY-17-C-0016.
Conflict of Interest
DN, JK, SM, MH, SW, LB, and KJ were employed by Noblis, Inc. SG was employed by Noblis ESI. SS was employed by Logistics Management Institute.
The remaining authors declare that the research was conducted in the absence of any commercial or financial relationships that could be construed as a potential conflict of interest.
Publisher's Note
All claims expressed in this article are solely those of the authors and do not necessarily represent those of their affiliated organizations, or those of the publisher, the editors and the reviewers. Any product that may be evaluated in this article, or claim that may be made by its manufacturer, is not guaranteed or endorsed by the publisher.
Acknowledgments
We gratefully acknowledge the work of all authors who generated and submitted the numerous sequences to GISAID's EpiCoV™ Database on which this study is based on. We also acknowledge the contributions and data provided by the GISAID organization. Special thanks to Dr. Yan Yi for reviewing and advice on the statistical analysis.
Supplementary Material
The Supplementary Material for this article can be found online at: https://www.frontiersin.org/articles/10.3389/fpubh.2022.889973/full#supplementary-material
References
1. Betacoronavirus. ViralZone. Available online at: https://viralzone.expasy.org/764 (accessed March 30, 2022)
2. Gulyaeva AA, Gorbalenya AE. A nidovirus perspective on SARS-CoV-2. Biochem Biophys Res Commun. (2021) 538:24–34. doi: 10.1016/j.bbrc.2020.11.015
3. Brant AC, Tian W, Majerciak V, Yang W, Zheng Z-M. SARS-CoV-2: from its discovery to genome structure, transcription, and replication. Cell Biosci. (2021) 11:136. doi: 10.1186/s13578-021-00643-z
4. Voss JD, Skarzynski M, McAuley EM, Maier EJ, Gibbons T, Fries AC, et al. Variants in SARS-CoV-2 associated with mild or severe outcome. Evol Med Public Health. (2021) 9:267–75. doi: 10.1093/emph/eoab019
5. Public Health England. Investigation of novel SARS-CoV-2 variant: Variant of Concern 202012/01. Report No.: Technical briefing 5 (2020). Available online at: https://assets.publishing.service.gov.uk/government/uploads/system/uploads/attachment_data/file/959426/Variant_of_Concern_VOC_202012_01_Technical_Briefing_5.pdf (accessed Jan 19, 2021).
6. Ziegler K, Steininger P, Ziegler R, Steinmann J, Korn K, Ensser A. SARS-CoV-2 samples may escape detection because of a single point mutation in the N gene. Eurosurveillance. (2020) 25:39. doi: 10.2807/1560-7917.ES.2020.25.39.2001650
7. Artesi M, Bontems S, Göbbels P, Franckh M, Maes P, Boreux R, et al. A recurrent mutation at position 26340 of SARS-CoV-2 is associated with failure of the e gene quantitative reverse transcription-pcr utilized in a commercial dual-target diagnostic assay. J Clin Microbiol. (2020) 58:10. doi: 10.1128/JCM.01598-20
8. Arena F, Pollini S, Rossolini GM, Margaglione M. Summary of the available molecular methods for detection of SARS-CoV-2 during the ongoing pandemic. Int J Mol Sci. (2021) 22:1298. doi: 10.3390/ijms22031298
9. Gand M, Vanneste K, Thomas I, Van Gucht S, Capron A, Herman P, et al. Deepening of in silico evaluation of SARS-CoV-2 detection RT-qPCR assays in the context of new variants. Genes. (2021) 12:565. doi: 10.3390/genes12040565
10. Pritzker K. Impact of the COVID-19 pandemic on molecular diagnostics. Expert Rev Mol Diagn. (2021) 21:519–21. doi: 10.1080/14737159.2021.1923481
11. Shu Y, McCauley J. GISAID: global initiative on sharing all influenza data—from vision to reality. Eurosurveillance. (2017) 22:30494. doi: 10.2807/1560-7917.ES.2017.22.13.30494
12. Hadfield J, Megill C, Bell SM, Huddleston J, Potter B, Callender C, et al. Nextstrain: real-time tracking of pathogen evolution. Bioinformatics. (2018) 34:4121–3. doi: 10.1093/bioinformatics/bty407
13. Holland M, Negrón DA, Mitchell S, Ivancich M, Jennings KW, Goodwin B, et al. Preliminary in silico assessment of the specificity of published molecular assays and design of new assays using the available whole genome sequences of 2019-nCoV - SARS-CoV-2 Coronavirus/nCoV-2019 diagnostics and vaccines. Virological. (2020). Available online at: https://virological.org/t/preliminary-in-silico-assessment-of-the-specificity-of-published-molecular-assays-and-design-of-new-assays-using-the-available-whole-genome-sequences-of-2019-ncov/343 (accessed January 24, 2020).
14. Sozhamannan S, Holland MY, Hall AT, Negrón DA, Ivancich M, Koehler JW, et al. Evaluation of signature erosion in ebola virus due to genomic drift and its impact on the performance of diagnostic assays. Viruses. (2015) 7:3130–54. doi: 10.3390/v7062763
15. Wiley MR, Fakoli L, Letizia AG, Welch SR, Ladner JT, Prieto K, et al. Lassa virus circulating in Liberia: a retrospective genomic characterisation. Lancet Infect Dis. (2019) 19:1371–8. doi: 10.1016/S1473-3099(19)30486-4
16. Corman VM, Landt O, Kaiser M, Molenkamp R, Meijer A, Chu DK, et al. Detection of 2019 novel coronavirus (2019-nCoV) by real-time RT-PCR. Eurosurveillance. (2020) 25:2000045. doi: 10.2807/1560-7917.ES.2020.25.3.2000045
17. Lu X, Wang L, Sakthivel SK, Whitaker B, Murray J, Kamili S, et al. US CDC real-time reverse transcription PCR panel for detection of severe acute respiratory syndrome Coronavirus 2. Emerg Infect Dis J. (2020) 26:1645. doi: 10.3201/eid2608.201246
18. Niu P, Lu R, Zhao L, Wang H, Huang B, Ye F, et al. Three novel real-time RT-PCR assays for detection of COVID-19 virus. China CDC Wkly. (2020) 2:453–7. doi: 10.46234/ccdcw2020.116
19. Chu DKW, Pan Y, Cheng SMS, Hui KPY, Krishnan P, Liu Y, et al. Molecular diagnosis of a novel coronavirus (2019-nCoV) causing an outbreak of pneumonia. Clin Chem. (2020) 66:549–55. doi: 10.1093/clinchem/hvaa029
20. Ministry of Public Health (Thailand). Diagnostic Detection of Novel Coronavirus 2019 by Real Time RT-PCR. (2020). Available online at: https://www.who.int/docs/default-source/coronaviruse/conventional-rt- pcr-followed-by-sequencing-for-detection-of-ncov-rirl-nat-inst-health-t.pdf (accessed July 12, 2021).
21. Nao N, Shiratori K, Katano H, Matsuyama S, Takeda M. Detection of second case of 2019-nCoV infection in Japan. Natl Inst Infect Dis. (2020). Available online at: https://www.niid.go.jp/niid/en/2019-ncov-e/9334-ncov-vir3-2.html (accessed July 12, 2021).
22. Institut, Pasteur. Protocol: Real-Time RT-PCR Assays for the Detection of SARS-CoV-2. Available online at: https://www.who.int/docs/default-source/coronaviruse/real-time-rt-pcr-assays-for-the-detection-of-sars-cov-2-institut-pasteur-paris.pdf?sfvrsn=3662fcb6_2 (accessed July 12, 2021).
23. Yip CC-Y, Ho C-C, Chan JF-W, To KK-W, Chan HS-Y, Wong SC-Y, et al. Development of a novel, genome subtraction-derived, SARS-CoV-2-specific COVID-19-Nsp2 real-time RT-PCR assay and its evaluation using clinical specimens. Int J Mol Sci. (2020) 21:1–11. doi: 10.3390/ijms21072574
24. Young BE, Ong SWX, Kalimuddin S, Low JG, Tan SY, Loh J, et al. Epidemiologic features and clinical course of patients infected with SARS-CoV-2 in Singapore. JAMA. (2020) 323:1488. doi: 10.1001/jama.2020.3204
25. Won J, Lee S, Park M, Kim TY, Park MG, Choi BY, et al. Development of a laboratory-safe and low-cost detection protocol for SARS-CoV-2 of the coronavirus disease 2019 (COVID-19). Exp Neurobiol. (2020) 29:107–19. doi: 10.5607/en20009
26. Chan JF-W, Yip CC-Y, To KK-W, Tang TH-C, Wong SC-Y, Leung K-H, et al. Improved molecular diagnosis of COVID-19 by the novel, highly sensitive and specific COVID-19-RdRp/Hel real-time reverse transcription-PCR assay validated in vitro and with clinical specimens. J Clin Microbiol. (2020) 58:e00310–20. doi: 10.1128/JCM.00310-20
27. CDC. Cases, Data, and Surveillance. Centers for Disease Control and Prevention (2020). Available online at: https://www.cdc.gov/coronavirus/2019-ncov/cases-updates/variant-surveillance/variant-info.html (accessed July 12, 2021).
28. Rambaut A, Holmes EC, O'Toole Á, Hill V, McCrone JT, Ruis C, et al. A dynamic nomenclature proposal for SARS-CoV-2 lineages to assist genomic epidemiology. Nat Microbiol. (2020) 5:1403–7. doi: 10.1038/s41564-020-0770-5
29. Pearson WR, Lipman DJ. Improved tools for biological sequence comparison. Proc Natl Acad Sci. (1988) 85:2444–8. doi: 10.1073/pnas.85.8.2444
30. Camacho C, Coulouris G, Avagyan V, Ma N, Papadopoulos J, Bealer K, et al. BLAST+: architecture and applications. BMC Bioinform. (2009) 10:421. doi: 10.1186/1471-2105-10-421
31. Rambaut A, Loman N, Pybus O, Barclay W, Barrett J, Carabelli A, et al. Preliminary genomic characterisation of an emergent SARS-CoV-2 lineage in the UK defined by a novel set of spike mutations—SARS-CoV-2 coronavirus/nCoV-2019 Genomic Epidemiology. COVID-19 Genomics Consortium UK (CoG-UK) (2020). Available online at: https://virological.org/t/preliminary-genomic-characterisation-of-an-emergent-sars-cov-2-lineage-in-the-uk-defined-by-a-novel-set-of-spike-mutations/563 (accessed November 30, 2021).
32. Hetrick B, He S, Chilin LD, Dabbagh D, Alem F, Narayanan A, et al. Development of a novel hybrid alphavirus-SARS-CoV-2 particle for rapid in vitro screening and quantification of neutralization antibodies, viral variants, and antiviral drugs. bioRxiv. (2020) 2020.12.22.423965. doi: 10.1101/2020.12.22.423965
33. Deng X, Garcia-Knight MA, Khalid MM, Servellita V, Wang C, Morris MK, et al. Transmission, infectivity, and antibody neutralization of an emerging SARS-CoV-2 variant in California carrying a L452R spike protein mutation. medRxiv. (2021) 2021.03.07.21252647. doi: 10.1101/2021.03.07.21252647
34. Voloch CM, da Silva Francisco R, de Almeida LGP, Cardoso CC, Brustolini OJ, Gerber AL, et al. Genomic characterization of a novel SARS-CoV-2 lineage from Rio de Janeiro, Brazil. J Virol. (2021) 95:e00119–21. doi: 10.1128/JVI.00119-21
35. Hoffmann M, Arora P, Groß R, Seidel A, Hörnich B, Hahn A, et al. SARS-CoV-2 variants B.1.351 and B.1.1.248: escape from therapeutic antibodies and antibodies induced by infection and vaccination (2021). Available online at: https://europepmc.org/article/PPR/PPR282426 (accessed November 30, 2021).
36. Faria NR, Claro IM, Candido D, Franco LM, Andrade PS, Coletti TM, et al. Genomic characterisation of an emergent SARS-CoV-2 lineage in Manaus: preliminary findings—SARS-CoV-2 coronavirus/nCoV-2019 Genomic Epidemiology. CADDE Genomic Network. (2021). Available online at: https://virological.org/t/genomic-characterisation-of-an-emergent-sars-cov-2-lineage-in-manaus-preliminary-findings/586 (accessed November 30, 2021)
37. West AP, Wertheim JO, Wang JC, Vasylyeva TI, Havens JL, Chowdhury MA, et al. Detection and characterization of the SARS-CoV-2 lineage B. 1526 in New York. Nat Commun. (2021) 12:4886. doi: 10.1038/s41467-021-25168-4
38. Liu J, Bodnar BH, Wang X, Wang P, Meng F, Khan AI, et al. Correlation of vaccine-elicited antibody levels and neutralizing activities against SARS-CoV-2 and its variants. medRxiv. (2020) 2021.05.31.445871.
39. Peacock TP, Sheppard CM, Brown JC, Goonawardane N, Zhou J, Whiteley M, et al. The SARS-CoV-2 variants associated with infections in India, B.1.617, show enhanced spike cleavage by furin. bioRxiv. (2020) 2021.05.28.446163. doi: 10.1101/2021.05.28.446163
40. Wickham H, Averick M, Bryan J, Chang W, McGowan L, François R, et al. Welcome to the Tidyverse. J Open Source Softw. (2019) 4:1686. doi: 10.21105/joss.01686
41. Grolemund G, Wickham H. Dates and times made easy with lubridate. J Stat Softw. (2011) 40:1–25. doi: 10.18637/jss.v040.i03
42. Wang E, Cook D, Hyndman RJ. A New tidy data structure to support exploration and modeling of temporal data. J Comput Graph Stat. (2020) 29:466–78. doi: 10.1080/10618600.2019.1695624
44. Cock PJA, Antao T, Chang JT, Chapman BA, Cox CJ, Dalke A, et al. Biopython: freely available Python tools for computational molecular biology and bioinformatics. Bioinformatics. (2009) 25:1422–3. doi: 10.1093/bioinformatics/btp163
45. Mölder F, Jablonski KP, Letcher B, Hall MB, Tomkins-Tinch CH, Sochat V, et al. Sustainable data analysis with Snakemake. F1000Research. (2021) 10:33. doi: 10.12688/f1000research.29032.2
46. Marçais G, Delcher AL, Phillippy AM, Coston R, Salzberg SL, Zimin A. MUMmer4: a fast and versatile genome alignment system. PLoS Comput Biol. (2018) 14:e1005944. doi: 10.1371/journal.pcbi.1005944
47. Severe acute respiratory syndrome coronavirus 2 isolate Wuhan-Hu-1 complete genome (2020). Available online at: http://www.ncbi.nlm.nih.gov/nuccore/NC_045512.2 (accessed July 21, 2021).
48. CDC. Science Brief: Omicron (B.1.1.529) Variant. Centers for Disease Control and Prevention (2021). Available online at: https://www.cdc.gov/coronavirus/2019-ncov/science/science-briefs/scientific-brief-omicron-variant.html (accessed March 2, 2022).
49. Deekshit VK, Jazeela K, Chakraborty G, Rohit A, Chakraborty A, Karunasagar I. Mismatch amplification mutation assay-polymerase chain reaction: a method of detecting fluoroquinolone resistance mechanism in bacterial pathogens. Indian J Med Res. (2019) 149:146–50. doi: 10.4103/ijmr.IJMR_2091_17
Keywords: PCR, RT-PCR, COVID-19, SARS-CoV-2, diagnostics, pandemic, biosurveillance, signature
Citation: Negrón DA, Kang J, Mitchell S, Holland MY, Wist S, Voss J, Brinkac L, Jennings K, Guertin S, Goodwin BG and Sozhamannan S (2022) Impact of SARS-CoV-2 Mutations on PCR Assay Sequence Alignment. Front. Public Health 10:889973. doi: 10.3389/fpubh.2022.889973
Received: 04 March 2022; Accepted: 05 April 2022;
Published: 28 April 2022.
Edited by:
Pragya Dhruv Yadav, ICMR-National Institute of Virology, IndiaReviewed by:
José Eduardo Levi, University of São Paulo, BrazilBader Alhatlani, Qassim University, Saudi Arabia
Copyright © 2022 Negrón, Kang, Mitchell, Holland, Wist, Voss, Brinkac, Jennings, Guertin, Goodwin and Sozhamannan. This is an open-access article distributed under the terms of the Creative Commons Attribution License (CC BY). The use, distribution or reproduction in other forums is permitted, provided the original author(s) and the copyright owner(s) are credited and that the original publication in this journal is cited, in accordance with accepted academic practice. No use, distribution or reproduction is permitted which does not comply with these terms.
*Correspondence: Daniel Antonio Negrón, ZGFuaWVsLm5lZ3JvbkBub2JsaXMub3Jn