 Huanchun Huang
 Yang Li
 Yimin Zhao1
 Wei Zhai
- 1College of Landscape Architecture, Nanjing Forestry University, Nanjing, China
- 2School of Architecture and Planning, The University of Texas at San Antonio, San Antonio, TX, United States
The combined effect of global warming and the heat island effect keeps the temperature of cities rising in the summer, seriously threatening the physical and mental health of urban residents. Taking the area within the Sixth Ring Road of Beijing as an example, based on Landsat remote sensing images, meteorological stations, and questionnaires, this study established a relational model between temperature and hostility and then analyzed the changes in the emotional health risk (hostility) in the study area and the mechanism of how outdoor activity duration influences hostility. Results show that: (1) the area within the Sixth Ring Road of Beijing had a higher and higher temperature from 1991 to 2020. Low-temperature areas gradually shrank, and medium- and high-temperature areas extended outwards from the center. (2) The threat of high temperature to residents' hostility gradually intensified—the sphere of influence expanded, low-risk areas quickly turned into medium-high-risk areas, and the level of hostility risk increased. Level 1 risk areas of hostility had the most obvious reduction—a 74.33% reduction in area proportion; meanwhile, Level 3 risk areas had the most significant growth—a 50.41% increase in area proportion. (3) In the first 120 min of outdoor activities under high temperature, residents' hostility was negatively correlated with outdoor activity duration; after more than 120 min, hostility became positively correlated with duration. Therefore, figuring out how temperature changes influence human emotions is of great significance to improving the living environment and health level of residents. This study attempts to (1) explore the impact of temperature changes and outdoor activity duration on hostility, (2) evaluate residents' emotional health risk levels affected by high temperature, and (3) provide a theoretical basis for the early warning mechanism of emotional health risk and the planning of healthy cities.
Introduction
At present, the frequent occurrence of extreme weather and global warming has brought significant impacts on the environment, ecosystems, society, and health, as well as pressing economic impacts related to labor, capital, goods, or services (1). In particular, increasingly severe urban summer high temperatures caused by urban heat islands has been widely treated as a major factor directly or indirectly threatening human health (2–4). Since the discovery of the urban heat island effect, scholars have conducted empirical research on the causes, influencing factors, and spatiotemporal distribution of urban high-temperature environments (5–7). Some studies have found that there is a correlation between urban morphological characteristics and functional area differences, and urban thermal environment, and at the same time, it has been proved that climatic zones also have an impact on urban surface temperature (8–12). Cities are the most important living areas of human beings, but they are also where disasters affect people's survival and daily lives the most. According to the latest data from the World Urbanization Prospects and World Population Prospects released by the United Nations Population Division, the world's urban population has exceeded 4.3 billion, accounting for about 55.3% of the total population, and this number may reach 68% by 2050 (13, 14). Urbanization continues to accelerate, and environmental problems caused by the urban heat island effect and global warming continue to deteriorate. Data shows that the global average temperature has risen by 1.1°C in the past century and may continue to rise in the future (15, 16). Faced with the dual pressures from accelerated urbanization and intensified heat island effect, how to improve the urban environment in order to protect the physical and mental health of residents has become a challenging issue worldwide. Hence, it is urgent to assess how the urban thermal environment threatens human health and establish an early warning mechanism.
The heat island effect exacerbates the harm brought by heatwaves and the risk of accidental death caused by heatstroke (17). The pooled relative risks of heatwaves on non-accidental mortality at lag 0, lag 0–2, and lag 0–10 days were 1.06 (95% CI: 1.03–1.09), 1.09 (1.05–1.13), and 1.10 (1.05–1.15), respectively. Compared with non-accidental mortality, higher effect estimates of heatwaves were observed among deaths from ischemic heart diseases, stroke, and respiratory diseases (18). It also increases the incidence of cardiovascular and cerebrovascular diseases and other heat-related diseases (e.g., heat cramps, and heat stroke) (19, 20). Previous studies indicate a significant correlation between elevated temperatures and the incidence of cardiovascular, cerebrovascular, and respiratory diseases (21, 22), and if the temperature exceeds a certain threshold, the regional excess mortality will increase (23–25). Studies on the impact of high temperature on human physical health have been bearing fruit. But according to the World Health Organization's definition, human health should also include spiritual and even social health. Unfortunately, up to now, few studies have explored the correlation between high temperature and people's emotional health. Current studies point out that high temperature and heat waves are significantly correlated with suicide, acute illness, severe depression, and admissions for mental illness (26, 27). The ambient temperature in summer has a significant impact on the length of hospital stay of patients with mental disorders, with two obvious thresholds—24.6°C and 33.1°C (28). A study using linear regression further proved that summer high temperatures severely affect the mortality associated with mental disorders (29). Studies have shown that a high ambient temperature also affects people's emotions, behavioral disorders, mental health, and other relevant health indexes (30). In addition, when the temperature exceeds certain thresholds, people's negative emotions intensify, even leading to a series of mental illnesses such as bipolar disorder (31, 32). According to Goal 3 (good health and wellbeing) of the Sustainable Development Goals Report 2021 issued by the United Nations, it is necessary to add the high-temperature effect as an important factor in safeguarding the health of people with mental or behavioral disorders.
The United Nations (UN) has included the promotion of subjective wellbeing (SWB) as one of the key indicators of its Sustainable Development Goals (SDGs) [(33, 92); UN-TOW]. Emotion is an important indicator of mental health and has an important impact on life wellbeing. Higher levels of positive emotions and lower levels of negative emotions can enhance high levels of life satisfaction (34, 35). Many studies have shown that emotions can be affected by environmental factors. Favorable soundscapes proved to be capable of reducing stress-related physiological markers; for example, nature sounds produce a higher reduction in skin conductance level than other sounds related to urban contexts (36). As a consequence, natural sounds were indicated as vital factors in easing stress recovery (37). The same visual and odor can also have an impact on people's emotions (38–40). The thermal environment has a more complex effect on emotional wellbeing (41). Compared to average daily temperatures in the 50–60 °F (10–16 °C) range, temperatures above 70°F (21°C) reduce positive emotions (e.g., joy, happiness), increase negative emotions (e.g., stress, anger), and increase fatigue (feeling tired, low energy) (42). At the same time, the length of exposure to high-temperature environments can also affect emotional health. Studies have found that prolonged heat exposure can seriously harm workers' physical and mental health, and work mood and further lead to a decline in productivity (43). Therefore, we wondered whether the duration of outdoor activities also had an emotion-related effect on the residents in the high-temperature environment.
Therefore, based on Landsat remote sensing images, electronic maps, meteorological data, and questionnaires collected by the research group, this study used ArcGIS, MATLAB, GraphPad, and other software for data processing and analysis, graded the summer high-temperature intensity, and analyzed the difference in its spatiotemporal evolution within the Sixth Ring Road of Beijing. Furthermore, this study decided on the emotion of hostility and took middle-aged and elderly people aged 40 and above as the study subjects to explore the relational model between residents' hostility level and two factors—urban summer high temperatures and outdoor activity duration. After that, this study evaluated the impact of high temperature on residents' emotional health. It provides a basis for carrying out emotional health risk early warning, and at the same time provides a reference for carrying out relevant urban planning adaptation measures.
Materials and methods
Overview of study area
Beijing, “Jing” for short, is the capital of the People's Republic of China, the political and cultural center of the country, at once both a world-famous ancient capital and a modern international metropolis. Beijing is located at 39°56′N, 116°20′E, in the northern part of the North China Plain, neighboring Tianjin city in the east, and Hebei province in the west, north, and south. The city is in the warm temperate zone, with a semi-humid and semi-arid monsoon climate, meaning hot and rainy in summer and cold and dry in winter. The terrain is high in the northwest and low in the southeast. The west, north, and northeast sides are surrounded by mountains, and the southeast is a plain gently tilting toward the Bohai Sea.
By the end of 2020, the permanent population of Beijing was 21.89 million, and the urbanization rate reached 87.6% (44). Under the influence of increased population density, a surge of anthropogenic heat, and changes in underlying surface attributes, the intensity of the heat island effect in Beijing increased with fluctuations that were significantly related to the city's urbanization progress (45).
This study took the most densely populated area—the area within the Sixth Ring Road (Dongcheng District, Xicheng District, Chaoyang District, Haidian District, Fengtai District, Shijingshan District, etc.) as the study area, covering a total area of 2,257.01 km2 (Figure 1).
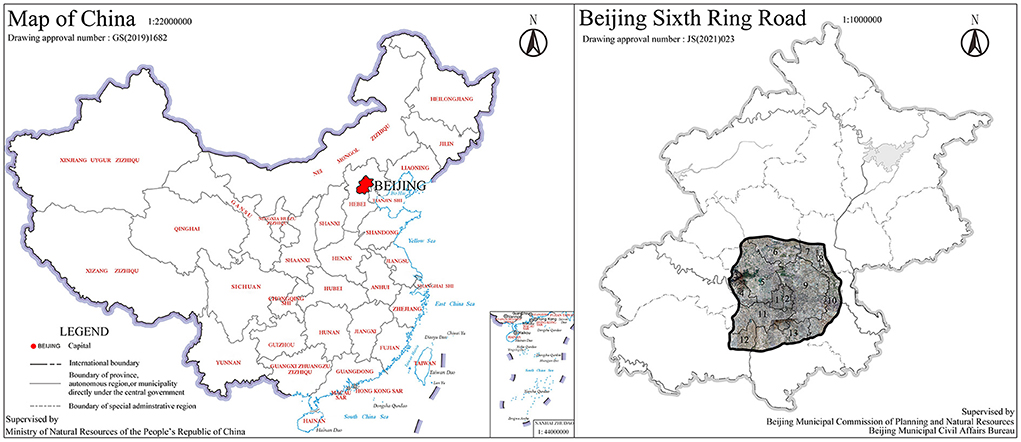
Figure 1. The location of study area (1: Xicheng District ; 2: Dongcheng District ; 3: Mentougou District ; 4: Shijinshan District ; 5: Haidian District ; 6: Changping District ; 7: Shunyi District ; 8: Beijing Capital International Airport ; 9: Chaoyang District ; 10: Tongzhou District ; 11: Fengtai District ; 12: Fangshan District ; 13: Daxing District).
Data sources
Data collection
The data applied in this study include remote sensing images, meteorological data, and field survey questionnaires. Details are shown in Table 1. The remote sensing images with no cloud coverage, no precipitation, and wind speed below 2 m/s at the time of imaging were selected. The air temperature data was measured by the WS-30 small handheld weather station. The measurement accuracy of the device is ±0.3°C for temperature, ±3% for humidity, and ±0.3 m/s for wind speed. The device was placed at an observation point where buildings, vegetation, hardened ground, and artificial facilities around the measurement site had less interference with the heat island, and maintained a distance of 1.5 m from the ground. After the measurement data was stable, the weather station would automatically record data at 1-min intervals. There were 7 measurement sites (Figure 2 and Table 2), including park squares, commercial plazas, residential area squares, public squares, and other green open spaces for urban residents' daily life and activities, which were typically representative. July and August, the summer months with the highest temperature in Beijing, so the experiment dates were July 27-August 3, 2019 and August 1–3, 2020 to meet the high-temperature requirements for the study. At the same time, the surveys were conducted from 8:00 to 17:00 when the change in outdoor travel volume was relatively stable. When conducting research, we ensured that the sample was evenly distributed across time periods.
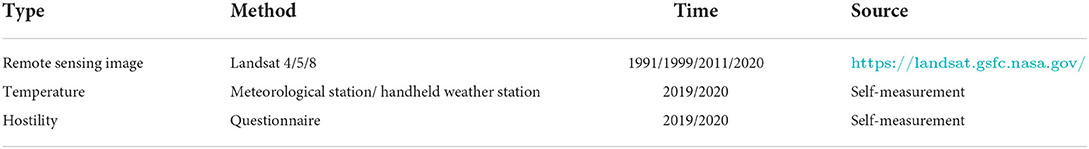
Table 1. Data sources.
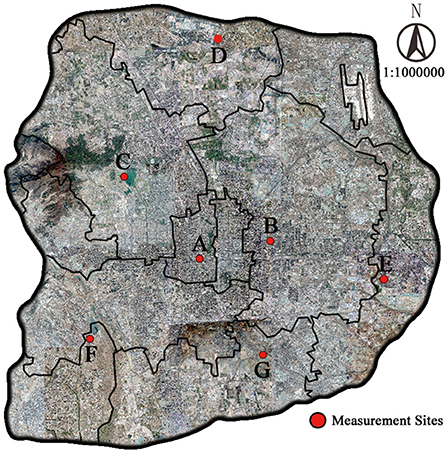
Figure 2. Measurement sites.
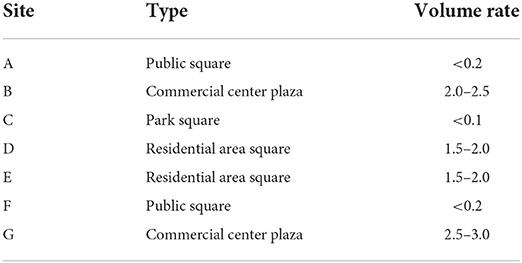
Table 2. Survey location overview.
Experimental procedure
According to the Positive and Negative Affect Schedule (PANAS) for Chinese people, improved by Huang et al. (46), this study used hostility as a proxy for measuring negative emotions. When the individual is threatened by the increase in the background temperature, he or she will have a hostile attitude and strong dissatisfaction, which is called hostile emotion, an extreme manifestation of negative emotion (47, 48). Face-to-face interviews were conducted through questionnaires asking respondents “How hostile do you feel now?” According to their current emotional state, respondents answered “1 almost none,” “2 relatively little,” “3 medium,” “4 relatively much” and “5 extremely much” to quantify their hostility. In addition to the hostility scale, gender, age, and time spent outdoors were also recorded.
Questionnaires were handed out, and the temperature was measured at the same location at the same time (Figure 3), and the survey respondents were middle-aged and elderly people over 40 years old who were active outdoors. The questionnaires of this study are based on random sampling, so the influence of previous activities or unexpected events cannot be excluded from the research process. To minimize the bias of data analysis caused by these uncertainties, while ensuring the randomness of sampling in the meantime, we conducted a preliminary screening of the survey respondents, excluding those who just went out of indoor space or car, did strenuous exercise outdoors, and took a long rest in the shade.
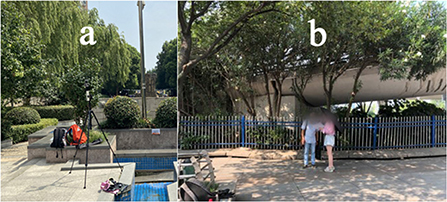
Figure 3. Temperature measurement and questionnaire [(a) handheld weather meter setup; (b) questionnaire distribution].
Result analysis
Data processing
Sample data analysis
The recorded air temperatures were typed into GraphPad for descriptive statistical analysis to draw a violin plot (Figure 4). Statistical analysis showed that the sample data covered 25.1–50.5°C with a relatively even distribution. The mean was 39.2°C, and the standard deviation was 4.89°C. The lower quartile was 35.2°C, the median was 39.7 °C, and the upper quartile was 42.9°C. The sample data was concentrated during 35.2–42.9°C, enough to cover the summer temperature range in the study area to analyze the effect of high temperature on hostility.
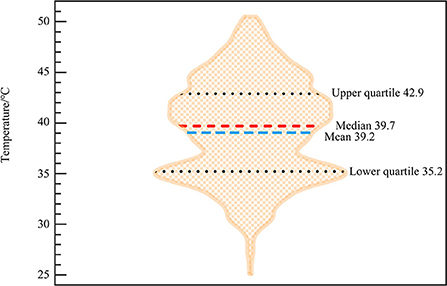
Figure 4. Sample temperature distribution.
The questionnaire data were collected and summarized, and the questionnaire data pivot table (Table 3) was obtained. The results showed that the ratio of male to female respondents was ~1:1, and the difference in hostility between males and females was negligible. The mean age of the subjects was 64 years, and the subjects in the 40–49 age group had the highest mean hostility score at 1.45. Subjects' average outdoor activity time was 98 min, and subjects who were active for 1.5–2 h had the lowest hostility score of 1.22.
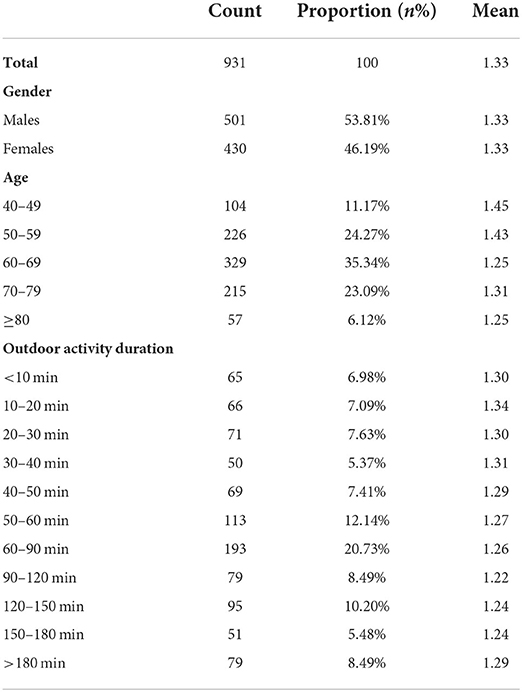
Table 3. Participant hostility and characteristics.
Temperature retrieval
Based on the Landsat satellite images, this study used the atmospheric correction method [also known as Radiative Transfer Equation (RTE)] for land surface temperature (LST) retrieval. The basic principles are: First, the influence of the atmosphere on the surface radiation is excluded from the total amount of thermal radiation received by the satellite sensor to obtain the surface brightness temperature, which was then converted into the corresponding LST (49, 50).
The hourly temperature field data in summer from meteorological stations were collected, and the hourly average temperature from 8:00 to 17:00 was used as the average daytime temperature. Regression analysis was carried out on LST, Normalized Vegetation Index (NDVI), and daytime average temperature, resulting in a linear regression equation with good significance (Formula 1).
where TA is the average daytime temperature; TL is LST; y is NDVI; and R2 = 0.576.
According to Formula 1, the raster data of the average daytime temperature of the imaging days in the 4 years was obtained via ArcGIS and then visualized. In this paper, the temperatures were divided into 6 levels—low-temperature area (≤27°C), lower-medium temperature area (27–29°C), medium temperature area (29–31°C), higher-medium temperature area (31–33°C), high-temperature area (33–35°C), and extreme-high temperature area (>35°C) (42).
Establishing a relational model between average daytime temperature and hostility
Based on the selected 931 questionnaires and temperature data from the handheld weather station, this study used SPSS for cross-tabulation, and the proportions of different degrees of hostility in each temperature range were obtained. The percentage of influence on hostility was weighted to get the integrated influence index in each temperature range. Finally, data were smoothed, and the maximum value of the influence index was normalized.
After that, this study used MATLAB to run multiple curvilinear regression analyses on the data, establishing a theoretical relational model between transient temperature and hostility and screening out the most fitted formula (Formula 2) (Figure 5).
where H is the quantified hostility value; t is transient temperature. SSE = 5.904, R2= 0.9094.
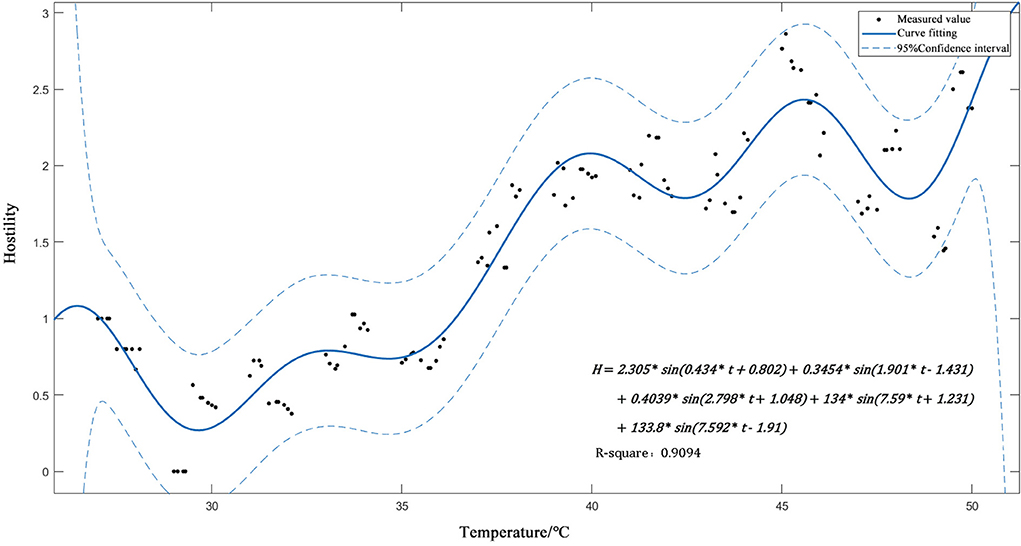
Figure 5. Relationship model between instantaneous temperature and hostility.
According to the relational model between transient temperature and hostility, the quantified hostility value from 8:00 to 17:00 every day was averaged as the average hostility value during the day, and the average temperature from 8:00 to 17:00 was taken as the average daytime temperature during the day, to establish a linear equation of the relationship between them (Formula 3, Figure 6).
where HA is the average hostility value; TA is the average daytime temperature. R2 = 0.706, Sy.x = 0.1072, with sound goodness of fit.
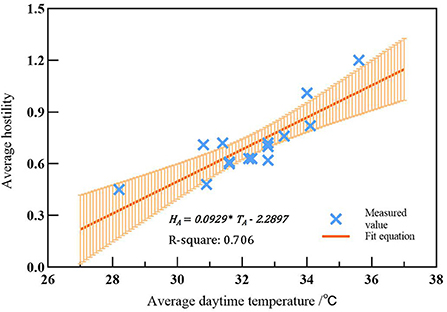
Figure 6. The relationship model between the average temperature during the day and the average hostility.
This study took the average daytime temperature of 27°C as the threshold, divided the degree of influence of urban high temperature on hostility into 6 levels, and used them as a standard for evaluating residents' emotional health risk. In detail, below 0.2 is Level 1 area, 0.2 to 0.4 Level 2 area, 0.4 to 0.6 Level 3 area, 0.6 to 0.8 Level 4 area, 0.8 to 1.0 Level 5 area, and above 1.0 Level 6 area (Table 4).
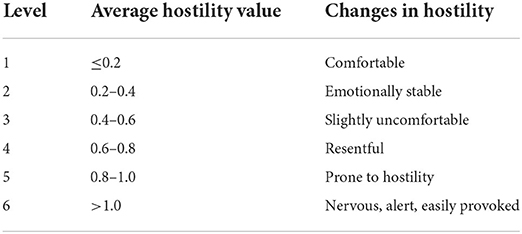
Table 4. Health risk assessment criteria for hostile emotions.
Analysis of the spatiotemporal evolution of summer high temperatures
The temperature within the Sixth Ring Road of Beijing has been significantly affected by urbanization in the past 20 years (51–53). The city was rapidly expanding outwards from the Forbidden City, and the concentrated population and buildings exacerbated the heat island effect. Analysis shows that from 1991 to 2020, the temperature changes were mainly concentrated in low-temperature areas (<27°C), lower-medium temperature areas (27–29°C), medium temperature areas (29–31°C) and higher-medium temperature areas (31–33°C). Meanwhile, high-temperature areas (33–35°C) and extreme-high temperature areas (>35°C) did not experience significant changes, and the area proportion changed by <0.5% (Table 5).

Table 5. Regional statistics of temperature changes within the Sixth Ring Road of Beijing.
In accordance with Figure 7, low-temperature areas experienced the most significant changes during the period between 1991 and 2020, with their proportion dropping by 51.41%, to <1% by 2020. In terms of spatial distribution, low-temperature areas were concentrated as large patches in the periphery in 1991, yet had dissipated by 1999 and then disappeared. Meanwhile, the total area of the lower-medium temperature areas increased by 72.72% from 1991 to 1999, expanding in a radial pattern from the center to the whole region. During urbanization, the outer suburbs were gradually heated up due to the heat island effect, transforming from low-temperature areas into lower-medium temperature areas, then rapidly dissipating. The medium temperature area, on the other hand, presented the most obvious trend of spreading. In 1999, the medium-temperature areas were concentrated in Dongcheng District and Xicheng Districts. In 2011, they began to spread radially from the central urban area to the periphery. From 2011 to 2020, they further penetrated into the outer suburbs. By 2020, they made up 70.54% of the total area of the study area. Next, higher-medium temperature areas went through a few changes from 1991 to 1999, with small broken patches scattered in the center. In 2011, it continued to expand to the periphery and gathered in small areas as broken patches. By 2020, continuous and small patches were concentrated in the urban built-up area. Last, high-temperature areas and extreme-high-temperature areas always maintained a very low proportion, less than 1%, showing a trend of slow growth.
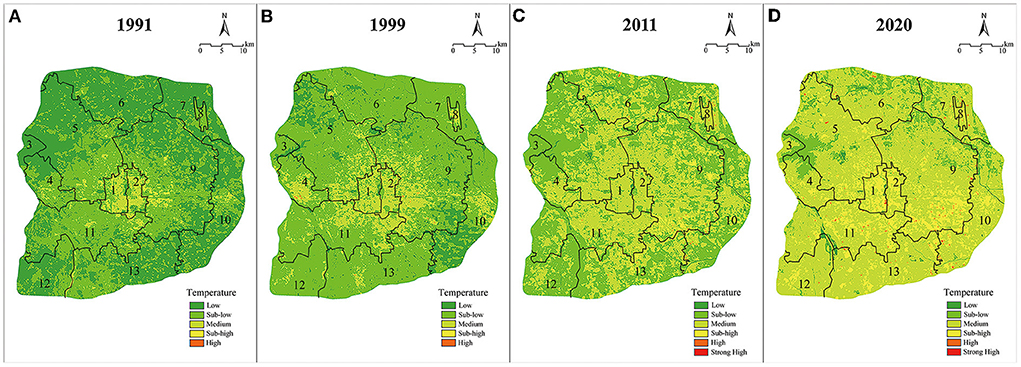
Figure 7. Spatial and temporal distribution of temperature of 1991 (A), 1999 (B), 2011 (C), 2020 (D) (1: Xicheng District ; 2: Dongcheng District ; 3: Mentougou District ; 4: Shijinshan District ; 5: Haidian District ; 6: Changping District ; 7: Shunyi District ; 8: Beijing Capital International Airport ; 9: Chaoyang District ; 10: Tongzhou District ; 11: Fengtai District ; 12: Fangshan District ; 13: Daxing District).
Assessment of the emotional health risk (hostility) of high temperature
This study evaluated the entire study area based on the standard for assessing the emotional health risk (hostility) of the high temperature mentioned above. Results showed (Table 6; Figure 8) that low-risk areas, consisting of Level 1 and Level 2 risk areas, dwindled rapidly in the study area. Eventually, only a few low-risk areas could be seen in the green space areas of Beihai Park, Zhonghai Park, Nanhai Park, Summer Palace, and Fragrant Hills Park. The remaining ones were less affected by urbanization due to their unique historical, cultural and ecological value, yielding little impact on the hostility of residents.
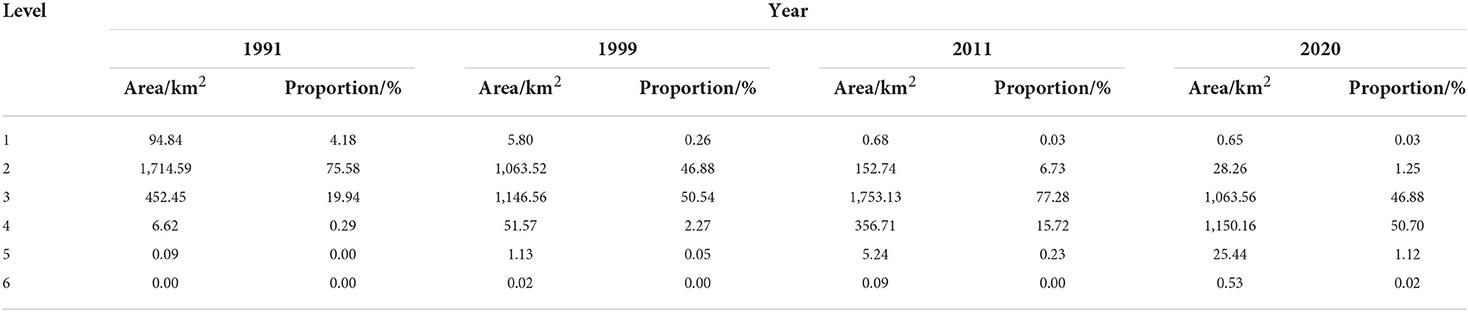
Table 6. Statistics on the emotional health risk level of hostility caused by high temperature within the Sixth Ring Road of Beijing.
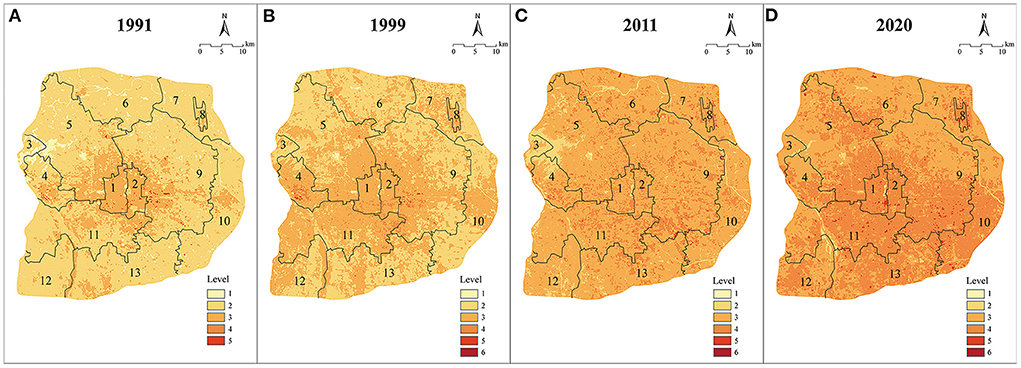
Figure 8. Hostility Health Heat Risk Level of year 1991 (A), 1999 (B), 2011 (C), 2020 (D) (1: Xicheng District ; 2: Dongcheng District ; 3: Mentougou District ; 4: Shijinshan District ; 5: Haidian District ; 6: Changping District ; 7: Shunyi District ; 8: Beijing Capital International Airport ; 9: Chaoyang District ; 10: Tongzhou District ; 11: Fengtai District ; 12: Fangshan District ; 13: Daxing District).
After 30 years of development, medium-risk areas consisting of Level 3 and Level 4 areas occupied 97.58% of the study area. Level 3 risk areas expanded from the center to the surroundings, then to the whole region, rapidly increasing by 2.88 times from 1991 to 2011. Level 4 risk areas extended slowly during 1991-1999, scattered as a large number of dense patches in 2011, then as an interconnected matrix in 2020, with area proportion increasing from 0.29 to 50.70%. In terms of spatial distribution, the diffusion mode of Level 4 risk areas was not from the center to the surroundings. Instead, they started first in Shijingshan District, Chaoyang District, and Haidian District in the periphery of Dongcheng District and Xicheng District, later spreading to the whole region from 2011 to 2020.
High-risk areas (Level 5 and 6), affected mainly by the urban anthropogenic heat, changed slowly from 1991 to 2020, and gradually expanded from 2011 to 2020. Once the high-density urbanization development prevents the heat from dissipating into the air, high-risk areas easily expand and pose a greater threat to the emotional health of residents.
Influence of residents' outdoor activity duration on hostility
The average hostile emotion of subjects in each outdoor activity time period was counted, and a scatter plot was made with the outdoor activity time. The scatterplot showed a non-monotonic relationship between hostility and time spent outdoors (Figure 9). Therefore, the possibility of a linear correlation between the two was ruled out. In order to further explore how outdoor activity duration affects hostility under high temperatures, this study conducted linear and nonlinear regression analyses on the average hostility value and outdoor activity duration. Finally, a fitted nonlinear polynomial second-order least-squares fitting model was decided on Formula 4:
whereHA is the quantified average hostility value, and t is the outdoor activity duration. R2 = 0.8254.
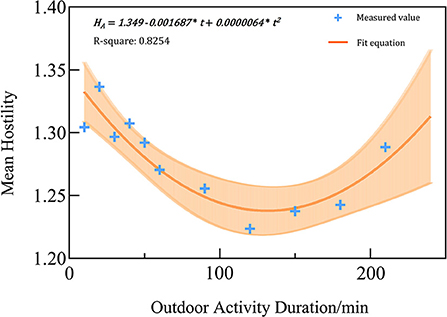
Figure 9. The trend of hostility with time of outdoor activities.
The regression equation showed a “U-shape” relationship between hostility and outdoor activity duration under high temperatures. As the duration lengthened, hostility first dropped significantly and then climbed up gradually—not exactly a positive correlation.
Discussion
Overall, air temperature within the Sixth Ring Road of Beijing kept rising during the period from 1991 to 2020. Low-temperature areas gradually disappeared, and middle and high-temperature areas expanded outward from the center. This was inseparable from the rapid urbanization of Beijing. The heat island effect caused by rapid urbanization had a significant impact on the temperature increase in Beijing in summer (54–56). From 1985 to 2017, each 10% increase in the urbanization ratio with 10 km2 had led to additional annual warming of 0.14 ± 0.11, 0.17 ± 0.08, and 0.30 ± 0.17°C at nonrural stations for daily maximum (T-max), mean (T-mean), and minimum (T-min) air temperatures, respectively. Meanwhile, each 10% increase in the urbanization ratio with 10 km2 had led to additional changes of 11.6 ± 5.1, 12.7 ±- 5.8, and −11.1 ± 5.2 days at nonrural stations for hot days, hot nights, and chilly nights, respectively (51). Generally, urban areas tend to experience more severe heat stress under heat waves due to the urban heat island (UHI) effect (i.e., urban areas being warmer than rural areas) (57, 58). Increased solar radiation under heat waves was an important factor for the amplified UHIs. In addition, changes in wind direction also played an essential role (59). Human activities, including changes in the attributes of the underlying surface, reduction of green plants, and increase of heating elements like engines, made it so that the urban heat was unable to effectively be dissipated (60–63), increasing the urban temperature (64) and yielding a serious impact on the living environment of urban residents and threatening their physical and mental health (65–67).
Our study showed a positive correlation between hostility and average daytime temperature, when it exceeds 27°C, a finding that aligns with previous studies. Ambient temperatures above 70 °F, and especially above 90 °F, significantly reduce emotional well-being (42). And because of the rising summer temperatures in Beijing, the risk of heat waves to the emotional health of urban residents also continued to rise. The increasingly harsh urban thermal environment has caused serious harm to the physical and mental health of residents. Worse still, high temperatures brought residents greater stress and fatigue, a reduced sense of pleasure, and made them have psychological feelings like depression, anger, pain, and hostility, which in turn affected their mental health (68, 69). Contrary to the situation where high temperatures enhance negative emotions, negative emotions and mental fatigue are both relieved when temperatures are extremely low. Cold temperatures can reduce negative emotions by reducing feelings of aggression and arousal (70), which may also explain lower rates of violent crime in cold temperatures (71).
As shown in Figure 9, when outdoor activity lasted for <120 min, residents' hostility got alleviated gradually; when it lasted for over 120 min, residents' hostility climbed. When residents go from an air-conditioned indoor environment to a hot urban environment, it is difficult for them to quickly adjust to the temperature difference; therefore, they must focus on coping with the environmental threat (72, 73). The urban environment with high complexity, great spatial heterogeneity, and concentrated buildings can easily induce emotional reactions such as tension and hostility, and the external environment with low comfort can lead to excessive emotional stress response and intrinsic cognitive load (30, 74). As outdoor activity duration lengthened, the human body gradually adapts to the high-temperature environment, with hostility relieved (75). The “U-shape” relationship between residents' outdoor travel time and hostility is similar to the curve of physical health measures' response to temperature. Physical health measures respond negatively to both extreme cold and heat, with increases in negative outcomes observable at both ends of the temperature spectrum (76–78).
Although the high-temperature environment will harm people's emotional health and even physical and mental health (79), the human body also has a coping mechanism for high temperature, which can physiologically adapt to climate change to a certain extent (80). Studies have shown that people living in hotter climates at lower latitudes are more thermally adapted than people living in cooler climates at higher latitudes (81). In addition to the physiological heat adaptation, the human body also has an adaptation mechanism to high temperature (82), such that repeated heat exposure can improve the subject's sense of heat and sweat (83, 84). A more comprehensive understanding of the human body's adaptation mechanism to the thermal environment will help to formulate human adaptation strategies in the future.
In addition to the human body's thermal adaptability, the government can also take some active measures to adapt to the rising temperature and reduce the life hazards that may be caused by high-temperature heat waves. For example, identifying and warning of high-temperature health risk areas ahead of time, making preparations for the health system in advance, strengthening housing improvement and thermal adaptation urban planning and a series of policies (85, 86). Meanwhile, we should focus on socially vulnerable groups with poor heat adaptation (the elderly, those with low education levels, and patients with mental health problems, etc) (42, 87), and provide timely help and guidance, such as a direct policy recommendation stemming is for mental health providers to ensure patients get adequate sleep during a heat event (31).
The impact of high temperature on human emotional health is a complex process and a combined result of multiple factors (68). The questionnaire respondents of this study may experience emotional discomfort due to other uncontrollable objective factors such as humidity and wind speed. At the same time, the mental health level and group differences of these subjects would also interfere with the study, resulting in less valid or accurate data (88, 89). This study still has limitations by ignoring transient temperature, subjects' socioeconomic level and outdoor thermal experience, and other factors that may have affected the experimental results. Studies have shown that physiological indicators such as salivary cortisol, brain waves, and skin conductance levels can reflect changes in mental state (90, 91). In the future, more in-depth research on the relationship between physiological indicators and psychological and emotional health will help to better understand people's mental health and emotional health. At the same time, there are many factors that affect emotional health besides temperature, such as sound, vision, heat, smell, etc (36–38). The coupling effect of multiple factors on emotions can be explored in the future. This will aid in targeted urban planning as well as health policy.
Conclusion
Based on various data from remote sensing images, meteorological stations, and questionnaires in Beijing, this study used ArcGIS, MATLAB and GraphPad for data processing to analyze the evolution trend of temperature in the study area from 1991 to 2020. In doing so, this study assessed the influence of the urban thermal environment on human emotional health (hostility) and the relationship between hostility and outdoor activity duration. Here are the conclusions:
(1) Affected by urbanization, air temperature within the Sixth Ring Road of Beijing kept rising over the past three decades. Low-temperature areas gradually disappeared, and medium and high-temperature areas showed a more and more obvious tendency to expand outwards from the center. The area of low and lower-medium-temperature areas dwindled by 82.76%, while that of medium and higher-medium-temperature areas increased by 82.51%.
(2) Influence of high temperature on hostility gradually intensified, and low-risk areas rapidly evolved into medium and high-risk areas, with the risk level of hostility increasing. Level 1 risk areas of emotional health (hostility) were cut down the most, with a reduction of 74.33% in the area proportion. Level 3 risk area, on the other hand, had the most obvious growth, with its area proportion climbing by 50.41%.
(3) Residents' hostility showed a “U-shape” relationship with outdoor activity duration in summer. In the first 120 min of outdoor activity, hostility is negatively correlated with duration; but when the activity lasts for more than 120 min, hostility becomes positively correlated with duration.
Against the backdrop of continuous global warming, the urban heat island effect gets intensified, and extreme weather conditions like extremely high temperatures happen more and more frequently year by year, yielding a serious and extensive impact on residents' emotional health. Hence, it is urgent to apply multi-level and multi-angle effective precautions (e.g., emotional health risk assessment and early warning) to better cope with climate changes in advance. In the future, while conducting in-depth research on how temperature affects human emotions and mental health, it is necessary to carry out urban planning, especially on residents' mental health, to help cities better adjust to climate changes and improve residents' overall health. In addition, we need to conduct interdisciplinary, integrated, and crossover research on climate, population, city, economy, and society to better cope with climate change and build healthy cities.
Data availability statement
Publicly available datasets were analyzed in this study. This data can be found here: https://earthexplorer.usgs.gov/.
Ethics statement
Ethics review and approval/written informed consent was not required as per local legislation and institutional requirements.
Author contributions
HH: conceptualization, methodology, data curation, formal analysis, writing—original draft preparation, review and editing, investigation, and visualization. YL: methodology, data curation, formal analysis, writing—original draft preparation, review and editing, investigation, and visualization. YZ: validation. WZ: resources, data curation, and validation. All authors contributed critically to the manuscript and agreed to publication.
Funding
The HH's work was supported the National Natural Science Foundation of China (Grant No. 319 31971717) and the Top-notch Academic Programs Project of Jiangsu (Grant No. PPZY2015A063).
Conflict of interest
The authors declare that the research was conducted in the absence of any commercial or financial relationships that could be construed as a potential conflict of interest.
Publisher's note
All claims expressed in this article are solely those of the authors and do not necessarily represent those of their affiliated organizations, or those of the publisher, the editors and the reviewers. Any product that may be evaluated in this article, or claim that may be made by its manufacturer, is not guaranteed or endorsed by the publisher.
References
1. He BJ, Wang J, Zhu J, Qi J. Beating the urban heat: Situation, background, impacts and the way forward in China. Renew Sustain Energy Rev. (2022) 161:112350. doi: 10.1016/j.rser.2022.112350
2. Nie JD, Zhang JH, Huang B. A review of the human health consequences of urban heat island effect. Ecol Sci. (2021) 40:200–208. doi: 10.14108/j.cnki.1008-8873.2021.01.025
3. Shen P, Zhao S, Ma Y. Perturbation of urbanization to Earth's surface energy balance. J Geophys Res Atmos. (2021) 126: e2020JD033521. doi: 10.1029/2020JD033521
4. Mücke HG, Litvinovitch JM. Heat extremes, public health impacts, and adaptation policy in Germany. Int J Environ Res Public Health. (2020) 17:7862. doi: 10.3390/ijerph17217862
5. Wang Y, Yi G, Zhou X, Zhang T, Bie X, Li J, et al. Spatial distribution and influencing factors on urban land surface temperature of twelve megacities in China from 2000 to 2017. Ecol Indic. (2021) 125:107533. doi: 10.1016/j.ecolind.2021.107533
6. Xiong Y, Zhang F. Effect of human settlements on urban thermal environment and factor analysis based on multi-source data: a case study of Changsha city. J Geograph Sci. (2021) 31:819–38. doi: 10.1007/s11442-021-1873-5
7. Li T, Cao J, Xu M, Wu Q, Yao L. The influence of urban spatial pattern on land surface temperature for different functional zones. Landsc Ecol Eng. (2020) 16:249–62. doi: 10.1007/s11355-020-00417-8
8. Chen Y, Yang J, Yang R, Xiao X, Xia JC. Contribution of urban functional zones to the spatial distribution of urban thermal environment. Build Environ. (2022) 216:109000. doi: 10.1016/j.buildenv.2022.109000
9. Ren J, Yang J, Zhang Y, Xiao X, Xia JC, Li X, et al. Exploring thermal comfort of urban buildings based on local climate zones. J Clean Prod. (2022) 340:130744. doi: 10.1016/j.jclepro.2022.130744
10. Lee YY, Md Din MF, Iwao K, Lee YH, Anting N. Impact of thermal behaviour of different environmental conditions on ambient environment and thermal discomfort in Malaysia. Indoor Built Environ. (2021) 30:520–34. doi: 10.1177/1420326X19897956
11. Yang Z, Chen Y, Guo G, Zheng Z, Wu Z. Characteristics of land surface temperature clusters: Case study of the central urban area of Guangzhou. Sustain Cities Soc. (2021) 73:103140. doi: 10.1016/j.scs.2021.103140
12. Yang J, Shi B, Xia G, Xue Q, Cao SJ. Impacts of urban form on thermal environment near the surface region at pedestrian height: a case study based on high-density built-up areas of Nanjing City in China. Sustainability. (2020) 12:1737. doi: 10.3390/su12051737
13. Desa UN. World Population Prospects 2019: Highlights, Vol. 11. New York, NY: United Nations Department for Economic and Social Affairs (2019). p. 125.
14. Desa U. World Urbanization Prospects-Population Division: The 2018 Revision. New York, NY: United Nations Department of Economic and Social Affairs (2018).
15. IPCC. Summary for Policymakers. In: Masson-Delmotte V, Zhai P, Pirani A, Connors SL, Péan C, Berger S, et al. editors. Climate Change 2021: The Physical Science Basis. Contribution of Working Group I to the Sixth Assessment Report of the Intergovernmental Panel on Climate Change. Geneva (In Press).
16. Zhou T, Chen Z, Chen X, Zuo M, Jiang J, Hu S. Interpreting IPCC AR6: future global climate based on projection under scenarios and on near-term information. Adv. Clim. Change Res. (2021) 17:652. doi: 10.12006/j.issn.1673-1719.2021.239
17. Petitti DB, Hondula DM, Yang S, Harlan SL, Chowell G. Multiple trigger points for quantifying heat-health impacts: new evidence from a hot climate. Environ Health Perspect. (2016) 124:176–83. doi: 10.1289/ehp.1409119
18. Yang J, Yin P, Sun J, Wang B, Zhou M, Li M, et al. Heatwave and mortality in 31 major Chinese cities: definition, vulnerability and implications. Sci Total Environ. (2019) 649:695–702. doi: 10.1016/j.scitotenv.2018.08.332
19. Thompson R, Hornigold R, Page L, Waite T. Associations between high ambient temperatures and heat waves with mental health outcomes: a systematic review. Public Health. (2018) 161:171–91. doi: 10.1016/j.puhe.2018.06.008
20. Xu XZ, Zheng YF, Yin JF, Wu RJ. Characteristics of high temperature and heat wave in Nanjing City and their impacts on human health. Chin J Ecol. (2011) 30:2815–20. doi: 10.13292/j.1000-4890.2011.0413
21. Ma Y, Jiao H, Zhang Y, Feng F, Cheng B, Ma B, et al. Short-term effect of extreme air temperature on hospital emergency room visits for cardiovascular diseases from 2009 to 2012 in Beijing, China. Environ Sci Pollut Res. (2020) 27:38029–37. doi: 10.1007/s11356-020-09814-w
22. Yin P, Chen R, Wang L, Liu C, Niu Y, Wang W, et al. The added effects of heatwaves on cause-specific mortality: a nationwide analysis in 272 Chinese cities. Environ Int. (2018) 121:898–905. doi: 10.1016/j.envint.2018.10.016
23. Ebi KL, Capon A, Berry P, Broderick C, de Dear R, Havenith G, et al. Hot weather and heat extremes: health risks. Lancet. (2021) 398:698–708. doi: 10.1016/S0140-6736(21)01208-3
24. Yang J, Ren J, Sun D, Xiao X, Xia JC, Jin C, et al. Understanding land surface temperature impact factors based on local climate zones. Sustain Cities Soc. (2021) 69:102818. doi: 10.1016/j.scs.2021.102818
25. Guo Y, Gasparrini A, Li S, Sera F, Vicedo-Cabrera AM, de Sousa Zanotti Stagliorio Coelho M, et al. Quantifying excess deaths related to heatwaves under climate change scenarios: a multicountry time series modelling study. PLoS Med. (2018) 15:e1002629. doi: 10.1371/journal.pmed.1002629
26. Almendra R, Loureiro A, Silva G, Vasconcelos J, Santana P. Short-term impacts of air temperature on hospitalizations for mental disorders in Lisbon. Sci Total Environ. (2019) 647:127–33. doi: 10.1016/j.scitotenv.2018.07.337
27. Fernández-Arteaga V, Tovilla-Zárate CA, Fresán A, González-Castro TB, Juárez-Rojop IE, López-Narváez L, et al. Association between completed suicide and environmental temperature in a Mexican population, using the Knowledge Discovery in Database approach. Comput Methods Prog Biomed. (2016) 135:219–24. doi: 10.1016/j.cmpb.2016.08.002
28. Peng Z, Wang Q, Kan H, Chen R, Wang W. Effects of ambient temperature on daily hospital admissions for mental disorders in Shanghai, China: a time-series analysis. Sci Total Environ. (2017) 590:281–6. doi: 10.1016/j.scitotenv.2017.02.237
29. Ho HC, Wong MS. Urban environmental influences on the temperature–mortality relationship associated mental disorders and cardiorespiratory diseases during normal summer days in a subtropical city. Environ Sci Pollut Res. (2019) 26:24272–85. doi: 10.1007/s11356-019-05594-0
30. Gao J, Cheng Q, Duan J, Xu Z, Bai L, Zhang Y, et al. Ambient temperature, sunlight duration, and suicide: a systematic review and meta-analysis. Sci Total Environ. (2019) 646:1021–9.3 doi: 10.1016/j.scitotenv.2018.07.098
31. Mullins JT, White C. Temperature and mental health: evidence from the spectrum of mental health outcomes. J Health Econ. (2019) 68:102240. doi: 10.1016/j.jhealeco.2019.102240
32. Lee S, Lee H, Myung W, Kim EJ, Kim H. Mental disease-related emergency admissions attributable to hot temperatures. Sci Total Environ. (2018) 616:688–94. doi: 10.1016/j.scitotenv.2017.10.260
33. Helliwell J, Layard R, Sachs J. World Happiness Report 2016. New York, NY: UN Sustainable Development Solutions Network (2016).
34. Houben M, Van Den Noortgate W, Kuppens P. The relation between short-term emotion dynamics and psychological well-being: a meta-analysis. Psychol Bull. (2015) 141:901. doi: 10.1037/a0038822
35. Lyubomirsky S, King L, Diener E. The benefits of frequent positive affect: Does happiness lead to success?. Psychol. Bull. (2005) 131: 803. doi: 10.1037/0033-2909.131.6.803
36. Alvarsson JJ, Wiens S, Nilsson ME. Stress recovery during exposure to nature sound and environmental noise. Int J Environ Res Public Health. (2010) 7:1036–46. doi: 10.3390/ijerph7031036
37. Cerwén G, Pedersen E, Pálsdóttir AM. The role of soundscape in nature-based rehabilitation: a patient perspective. Int J Environ Res Public Health. (2016) 13:1229. doi: 10.3390/ijerph13121229
38. Yeom S, Kim H, Hong T, Ji C, Lee DE. Emotional impact, task performance and task load of green walls exposure in a virtual environment. Indoor Air. (2022) 32:e12936. doi: 10.1111/ina.12936
39. Zhuang J, Qiao L, Zhang X, Su Y, Xia Y. Effects of visual attributes of flower borders in urban vegetation landscapes on aesthetic preference and emotional perception. Int J Environ Res Public Health. (2021) 18:9318. doi: 10.3390/ijerph18179318
40. Weber ST, Heuberger E. The impact of natural odors on affective states in humans. Chem Senses. (2008) 33:441–7. doi: 10.1093/chemse/bjn011
41. Gao W, Tu R, Li H, Fang Y, Que Q. In the subtropical monsoon climate high-density city, what features of the neighborhood environment matter most for public health? Int J Environ Res Public Health. (2020) 17. doi: 10.3390/ijerph17249566
42. Noelke C, McGovern M, Corsi DJ, Jimenez MP, Stern A, Wing IS, et al. Increasing ambient temperature reduces emotional well-being. Environ Res. (2016) 151:124–9. doi: 10.1016/j.envres.2016.06.045
43. Singh S, Hanna EG, Kjellstrom T. Working in Australia's heat: health promotion concerns for health and productivity. Health Promot Int. (2015) 30:239–50. doi: 10.1093/heapro/dat027
44. National Bureau of Statistics of People's Republic of China. China Statistical Yearbook. Beijing:China Statistics Press. (2021).
45. Ge RF, Zhang LX, Wang JL, Tian GJ. Multi-scale temporal characteristics and periodic analysis of urban heat island — a case study of Beijing. J Beijing Norm Univ. (2016) 210–5. doi: 10.16360/j.cnki.jbnuns.2016.02.017
46. Huang L, Yang T, Ji Z M. Applicability of the Positive and Negative Affect Scale in Chinese. Chin Ment Health J. (2003) 54–56. doi: 10.3321/j.issn:1000-6729.2003.01.018
47. Frankenhuis WE, Bijlstra G. Does exposure to hostile environments predict enhanced emotion detection?. Collabra Psychol. (2018) 4. doi: 10.1525/collabra.127
48. Cohen AH, Krueger JS. Rising mercury, rising hostility: How heat affects survey response. Field Methods. (2016) 28:133–52. doi: 10.1177/1525822X15627974
49. Yue H, Liu Y. Comparison and analysis of land surface temperature retrieval algorithms based on Landsat 8 TIRS. Sci Technol Eng. (2018) 18:200–5.
50. Qin ZH, Li WJ, Zhang MH, Karnieli A, Berliner P. Estimating of the essential atmospheric parameters of mono-window algorithm for land surface temperature retrieval from Landsat TM 6. Remote Sens Land Resour. (2003) 15:37–43. doi: 10.3969/j.issn.1001-070X.2003.02.010
51. Jiang S, Du J, Wei Z. Impacts of continuously increasing urbanization ratios on warming rates and temperature extremes observed over the Beijing area. J Geophys Res. (2021) 126: e2021JD034536. doi: 10.1029/2021JD034536
52. Chen W, Zhang Y, Pengwang C, Gao W. Evaluation of urbanization dynamics and its impacts on surface heat islands: a case study of Beijing, China. Remote Sens. (2017) 9:453. doi: 10.3390/rs9050453
53. Wang Y, Ji W, Yu X, Xu X, Jiang D, Wang Z, et al. The impact of urbanization on the annual average temperature of the past 60 years in Beijing. Adv Meteorol. (2014) 1–9. doi: 10.1155/2014/374987
54. An N, Dou J, González-Cruz JE, Bornstein RD, Miao S, Li L. An observational case study of synergies between an intense heat wave and the urban heat island in Beijing. J Appl Meteorol Climatol. (2020) 59:605–20. doi: 10.1175/JAMC-D-19-0125.1
55. Jiang S, Wang K, Mao Y. Rapid local urbanization around most meteorological stations explains the observed daily asymmetric warming rates across China from 1985 to 2017. J Clim. (2020) 33:9045–61. doi: 10.1175/JCLI-D-20-0118.1
56. Li Q, Zhang H, Liu X, Huang J. Urban heat island effect on annual mean temperature during the last 50 years in China. Theor Appl Climatol. (2004) 79:165–74. doi: 10.1007/s00704-004-0065-4
57. Founda D, Santamouris M. Synergies between Urban Heat Island and Heat Waves in Athens (Greece), during an extremely hot summer (2012). Sci Rep. (2017) 7:1–11. doi: 10.1038/s41598-017-11407-6
58. Li D, Bou-Zeid E. Synergistic interactions between urban heat islands and heat waves: The impact in cities is larger than the sum of its parts. J Appl Meteorol Climatol. (2013) 52:2051–64. doi: 10.1175/JAMC-D-13-02.1
59. Jiang S, Lee X, Wang J, Wang K. Amplified urban heat islands during heat wave periods. J Geophys Res. (2019) 124:7797–812. doi: 10.1029/2018JD030230
60. Chen Q, Yang X, Ouyang Z, Zhao N, Jiang Q, Ye T, et al. Estimation of anthropogenic heat emissions in China using Cubist with points-of-interest and multisource remote sensing data. Environ Pollut. (2020) 266:115183. doi: 10.1016/j.envpol.2020.115183
61. Eastin MD, Baber M, Boucher A, Di Bari S, Hubler R, Stimac-Spalding B, et al. Temporal variability of the Charlotte (sub) urban heat island. J Appl Meteorol Climatol. (2018) 57:81–102. doi: 10.1175/JAMC-D-17-0099.1
62. Ao X, Grimmond CSB, Chang Y, Liu D, Tang Y, Hu P, et al. Heat, water and carbon exchanges in the tall megacity of Shanghai: challenges and results. Int J Climatol. (2016) 36:4608–24. doi: 10.1002/joc.4657
63. Allen L, Lindberg F, Grimmond CSB. Global to city scale urban anthropogenic heat flux: model and variability. Int J Climatol. (2011) 31:1990–2005. doi: 10.1002/joc.2210
64. Chen L, Frauenfeld OW. Impacts of urbanization on future climate in China. Clim Dyn. (2016) 47:345–57. doi: 10.1007/s00382-015-2840-6
65. Li Y, Ren T, Kinney PL, Joyner A, Zhang W. Projecting future climate change impacts on heat-related mortality in large urban areas in China. Environ Res. (2018) 163:171–85. doi: 10.1016/j.envres.2018.01.047
66. Wong LP, Haridah A, Nasrin A, Sima A, Nik MNS. Physical, psychological, and social health impact of temperature rise due to urban heat island phenomenon and its associated factors. Biomed Environ Sci. (2018) 31:545–50.
67. Wong LP, Haridah A, Nasrin A, Sima A, Nik MNS. Physical, psychological, and social health impact of temperature rise due to urban heat island phenomenon and its associated factors. Biomed Environ Sci. (2018) 31:545-–50. doi: 10.3967/bes2018.074
68. Yu G, Chen T, Zhao F. The influence of air temperature and temperature variability on mental health. Adv Psychol Sci. (2020) 28:1282. doi: 10.3724/SP.J.1042.2020.01282
69. Chen NT, Lin PH, Guo YLL. Long-term exposure to high temperature associated with the incidence of major depressive disorder. Sci Total Environ. (2019) 659:1016–20. doi: 10.1016/j.scitotenv.2018.12.434
70. Anderson CA, Bushman BJ. Human aggression. Annu Rev Psychol. (2002) 53:27–51. doi: 10.1146/annurev.psych.53.100901.135231
71. Ranson M. Crime, weather, and climate change. J Environ Econ Manage. (2014) 67:274–302. doi: 10.1016/j.jeem.2013.11.008
72. Di Napoli C, Pappenberger F, Cloke HL. Verification of heat stress thresholds for a health-based heat-wave definition. J Appl Meteorol Climatol. (2019) 58:1177–94. doi: 10.1175/JAMC-D-18-0246.1
73. Hatvani-Kovacs G, Belusko M, Skinner N, Pockett J, Boland J. Drivers and barriers to heat stress resilience. Sci Total Environ. (2016) 571:603–14. doi: 10.1016/j.scitotenv.2016.07.028
74. Buttazzoni A, Doherty S, Minaker L. How do urban environments affect young people's mental health? A novel conceptual framework to bridge public health, planning, and neurourbanism. Public Health Rep. (2022) 137:48–61. doi: 10.1177/0033354920982088
75. Du C, Li B, Cheng Y, Li C, Liu H, Yao R. Influence of human thermal adaptation and its development on human thermal responses to warm environments. Build Environ. (2018) 139:134–45. doi: 10.1016/j.buildenv.2018.05.025
76. Heutel G, Miller NH, Molitor D. Adaptation and the mortality effects of temperature across US climate regions. Rev Econ Stat. (2021) 103:740–53. doi: 10.1162/rest_a_00936
77. White C. The dynamic relationship between temperature and morbidity. J Assoc Environ Resour Econ. (2017) 4:1155–98. doi: 10.1086/692098
78. Barreca A, Clay K, Deschenes O, Greenstone M, Shapiro JS. Adapting to climate change: The remarkable decline in the US temperature-mortality relationship over the twentieth century. J Polit Econ. (2016) 124:105–59. doi: 10.1086/684582
79. Krabbendam L, van Vugt M, Conus P, Söderström O, Empson LA, van Os J, et al. Understanding urbanicity: how interdisciplinary methods help to unravel the effects of the city on mental health. Psychol Med. (2021) 51:1099–110. doi: 10.1017/S0033291720000355
80. Kellogg DL Jr. In vivo mechanisms of cutaneous vasodilation and vasoconstriction in humans during thermoregulatory challenges. J Appl Physiol. (2006) 100:1709–18. doi: 10.1152/japplphysiol.01071.2005
81. Zhang J, Guo W, Cheng B, Jiang L, Xu S. A review of the impacts of climate factors on humans' outdoor thermal perceptions. J Therm Biol. (2022) 103272. doi: 10.1016/j.jtherbio.2022.103272
82. Wu CF, Hsieh YF, Ou SJ. Thermal adaptation methods of urban plaza users in Asia's hot-humid regions: a Taiwan case study. Int J Environ Res Public Health. (2015) 12:13560–86. doi: 10.3390/ijerph121013560
83. Ji W, Cao B, Luo M, Zhu Y. Influence of short-term thermal experience on thermal comfort evaluations: a climate chamber experiment. Build Environ. (2017) 114:246–56. doi: 10.1016/j.buildenv.2016.12.021
84. Cândido C, de Dear R, Ohba M. Effects of artificially induced heat acclimatization on subjects' thermal and air movement preferences. Build Environ. (2012) 49:251–8. doi: 10.1016/j.buildenv.2011.09.032
85. Majidi AN, Vojinovic Z, Alves A, Weesakul S, Sanchez A, Boogaard F, et al. Planning nature-based solutions for urban flood reduction and thermal comfort enhancement. Sustainability. (2019) 11:6361. doi: 10.3390/su11226361
86. Dütemeyer D, Barlag AB, Kuttler W, Axt-Kittner U. Measures against heat stress in the city of Gelsenkirchen, Germany. DIE ERDE–J Geograph Soc Berlin. (2013) 144:181–201. doi: 10.12854/erde-144-14
87. Graff Zivin J, Neidell M. Temperature and the allocation of time: Implications for climate change. J Labor Econ. (2014) 32:1–26. doi: 10.1086/671766
88. Abbasi AM, Motamedzade M, Aliabadi M, Golmohammadi R, Tapak L. The impact of indoor air temperature on the executive functions of human brain and the physiological responses of body. Health Promot Perspect. (2019) 9:55. doi: 10.15171/hpp.2019.07
89. Chang TY, Kajackaite A. Battle for the thermostat: gender and the effect of temperature on cognitive performance. PLoS ONE. (2019) 14:e0216362. doi: 10.1371/journal.pone.0216362
90. Veiga G, Rodrigues AD, Lamy E, Guiose M, Pereira C, Marmeleira J. The effects of a relaxation intervention on nurses' psychological and physiological stress indicators: a pilot study. Complement Ther Clin Pract. (2019) 35:265–71. doi: 10.1016/j.ctcp.2019.03.008
91. Wålinder R, Gunnarsson K, Runeson R, Smedje G. Physiological and psychological stress reactions in relation to classroom noise. Scand J Work Environ Health. (2007) 33:260–266. doi: 10.5271/sjweh.1141
92. Desa UN,. Transforming Our World: The 2030 Agenda for Sustainable Development. (2016). Available online at: https://stgwedocs.unep.org/bitstream/handle/20.500.11822/11125/unepswiosm1inf7sdg.pdf?sequence=1
Keywords: outdoor activity duration, high temperature, emotional health, hostility, Beijing
Citation: Huang H, Li Y, Zhao Y and Zhai W (2022) Analysis of the impact of urban summer high temperatures and outdoor activity duration on residents' emotional health: Taking hostility as an example. Front. Public Health 10:955077. doi: 10.3389/fpubh.2022.955077
Received: 02 June 2022; Accepted: 06 July 2022;
Published: 25 July 2022.
Edited by:
Zhonghua Gou, Wuhan University, ChinaReviewed by:
Meifang Su, Northwest A&F University, ChinaWenfeng Zheng, University of Electronic Science and Technology of China, China
Jian Zhang, Griffith University, Australia
Copyright © 2022 Huang, Li, Zhao and Zhai. This is an open-access article distributed under the terms of the Creative Commons Attribution License (CC BY). The use, distribution or reproduction in other forums is permitted, provided the original author(s) and the copyright owner(s) are credited and that the original publication in this journal is cited, in accordance with accepted academic practice. No use, distribution or reproduction is permitted which does not comply with these terms.
*Correspondence: Wei Zhai, d2VpLnpoYWlAdXRzYS5lZHU=
†These authors have contributed equally to this work and share first authorship