 Lu Liu
 Yi Zheng1†
 Sen He
- 1Department of Cardiology, West China Hospital of Sichuan University, Chengdu, China
- 2Department of Cardiology, Hospital of Traditional Chinese Medicine of Shuangliu District, Chengdu, China
- 3Department of Cardiovascular Medicine, Hospital of Chengdu Office of People's Government of Tibetan Autonomous Region, Chengdu, China
- 4Department of Cardiology, First People's Hospital of Longquanyi District, Chengdu, China
Objective: Because of rapid economic growth and followed urban expansion in China, many people drinking natural water had to change their water sources to tap water. We aimed to test the unknown association that whether continued use of natural water for drinking is different from switching to tap water in all-cause mortality risks in elderly people.
Methods: In total, based on Chinese Longitudinal Healthy Longevity Survey, 26,688 elderly participants drinking natural water from childhood to young-old were included in the final analyses. Associations between whether changing drinking water sources or not and all-cause mortality risk were then estimated by Cox regression models with the use of multiple propensity score methods, and the primary analysis used propensity score matching, with other propensity score methods confirming the robustness of the results.
Results: Baseline characteristics were fairly well balanced by the three post-randomization methods. During a median follow-up period of 3.00 (IQR: 1.52, 5.73) years, 21,379 deaths were recorded. The primary analysis showed people using natural water unchangeably was associated with a lower risk of all-cause mortality than those switching to tap water in later life (HR: 0.94, 95% CI: 0.91–0.97, p < 0.001). Other propensity score methods, as well as Cox regression analysis without using propensity score methods, showed similar results.
Conclusions: Among elderly people depending on natural water for drinking from their childhood to young-old in China, continued use of natural water was associated with a lower all-cause mortality risk than conversion to tap water later. Further studies in different countries and populations are needed to verify our conclusions.
Introduction
In countries with an advanced economy, science and technology, the choice of water sources such as tap water, bottled water, natural mineral water, and others is a privilege for residents (1). Besides the considerations of accessibility, price difference, tastes, odors, and environmental protection, drinking water safety is increasingly becoming a major concern (2–5). Major contamination in drinking water often comes from heavy metals, harmful substances, and pathogens (2).
People often associate tap water with chemicals, chlorine, sediments, etc., (5, 6), leading to increased demand and sales for bottled water and mineral water to some extent (1, 4, 5, 7). Over the previous decades, because of sometimes reports of water supply network contamination (8), tap water was occasionally a controversial topic (1). When it comes to natural waters, take mineral water for an example, it has different characteristics from tap water and originates from protected underground water sources, and is subjected to different safety regulations as well (9). However, despite the microbiological wholesomeness of mineral water (10), very recent reports determined microplastic particles in it (11), arousing public attention.
Rapid economic growth and its huge population have accelerated the urban expansion in China in the past decades. People flooded into metropolises and used tap water in most daily life. At the same time, there was still a considerably large amount of population staying in the countryside and obtaining water directly from rivers, lakes, wells, pools, springs, etc., (12). As far as we know, recent studies mainly concentrated on the associations between components in drinking water and health problems (13–15), the data on the impact of different drinking water sources on long-term survival or mortality is limited. Thus, we aimed to explore whether consistently drinking natural water makes difference from converting to tap water on all-cause mortality in elderly people from a longitudinal prospective study in China.
Materials and methods
Study participants
Data were obtained from the Chinese Longitudinal Healthy Longevity Survey (CLHLS), a nationwide, ongoing, prospective cohort study of community-dwelling Chinese elderly people. The CLHLS aimed to examine the social, behavioral, biological, and environmental determinants of healthy human longevity and oldest-old mortality.Briefly, the survey adopted a targeted random-sample design to ensure representativeness, through interviews with approximately equal numbers of male and female non-agenarians, octogenarians, and young-old (aged 65–79 years) living near to the centenarians (in the same village or street, if available, or in the same sampled county or city) and was conducted in a half of the counties and cities in 23 provinces, covering about 85.0% of the total population of China. The CLHLS began in 1998, with subsequent follow-ups in 2000, 2002, 2005, 2008, 2011, 2014, and 2018. To reduce the attrition due to death and loss to follow-up, new participants are enrolled during the following waves from 1998.These waves were administered in participants' homes by trained interviewers with a structured questionnaire. Other details concerning the objectives, design and methods of the CLHLS can be found elsewhere (16, 17). The CLHLS complied with the principles of the Declaration of Helsinki (18), and was approved by the Research Ethics Committee of Peking University (IRB00001052-13074). All participants or their proxy respondents provided written informed consent.
The present study was based on seven waves (1998, 2000, 2002, 2005, 2008, 2011, and 2014 waves) within the CLHLS, and the final wave of interview was 2018–2019. Figure 1A shows the design of the present study, based on which the participant enrollment process was conducted (Figure 1B), and the final sample consisted of 26,688 elderly participants (age ≥ 65 years). Figure 2 shows the spatial distributions of the study population.
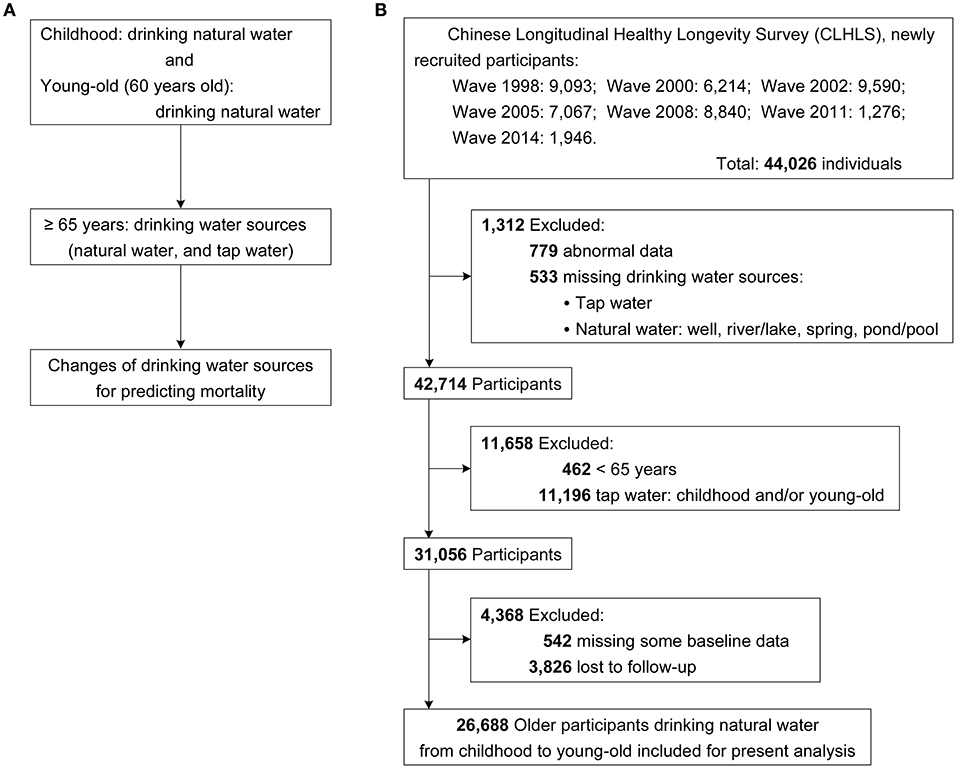
Figure 1. Flow chart. (A) study design, (B) participants selection diagram.
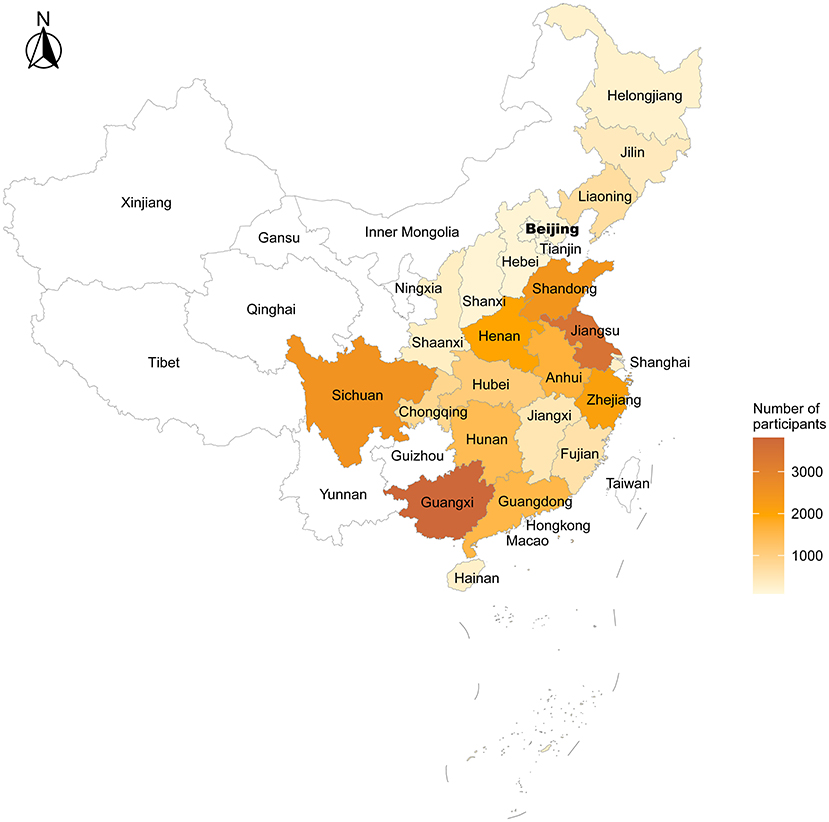
Figure 2. Spatial distributions of the study population. In the present study, province with the most study participants was Guangxi (n = 3,808), followed by Jiangsu, Sichuan, Shandong, Zhejiang, Henan, Anhui, Guangdong, Hunan, Hubei, Chongqing, Liaoning, Fujian, Jiangxi, Jilin, Shaanxi, Shanghai, Hainan, Helongjiang, Hebei, Shanxi, Tianjin, and Beijing.
Assessment of drinking water sources
At baseline, participants' drinking water sources were assessed by the questionnaire with the questions: “Water you drank at childhood was mainly from?”, “Water you drank at around 60 years old was mainly from?”, and “Water you drink at present is from?”, and the drinking water sources included well, river/lake, spring, pond/pool, and tap water. In the present study, a complex composition of drinking water sources, including wells, river/lake, spring, and pond/pool, was defined as natural water; then, the drinking water sources were classified into natural water and tap water. If the participants drank natural water at childhood and around 60 years old (young-old), they were considered to drink natural water from childhood to young-old. Using the information on drinking water sources, we compared the changes of drinking water sources, drinking natural water unchangeably and switching to tap water in later life, for association with the risk of all-cause mortality.
Covariates
In our analyses, we also examined as many factors as possible that might be associated with drinking water sources and mortality, including sex, age, education, marital status, residence, co-residence, fresh fruits, fresh vegetables, taking meat, reading books/newspapers, current smoking, current drinking, current regular exercise, hypertension, diabetes, heart diseases, cerebrovascular diseases, respiratory diseases, cancer, self-rated health, and places of birth. Supplementary Table S1 displays the detailed information about the scales of reclassifications of baseline variables used in the present study.
Study outcome
The study outcome was set as all-cause mortality, and the participants' survival status and date of death were collected through interviews with close family members during each survey. All individuals were followed from the first interview up to the outcome or the most recent interview.
Statistical analysis
The missing values for all the baseline variables were no more than 0.59%, and Supplementary Table S2 shows the distributions of variables with missing data. Due to such low missing rates, the cases with missing values were deleted in the statistical analyses without imputing.
Baseline characteristics of the study population were displayed based on baseline drinking water sources (natural water vs. tap water), and the characteristics were described as median (interquartile range, IQR) for continuous variables and number (percentage) for categorical variables.
The balance in covariates was assessed by using the absolute standardized mean difference (ASD) approach, and factors with imbalance between the two groups was defined as an ASD ≥ 0.100 (19). Given the observational nature of the present study, propensity scores were developed to account for potential confounding by observed baseline characteristics (20). Propensity score methods replace an entire set of baseline characteristics with a single composite score, and this can be accomplished with a number of potential confounders in excess of what is possible with conventional regression methods. Individual propensities of participants drinking natural water were estimated with the multivariable logistic regression model that included the same covariates as the Cox regression model.
Associations between whether changing drinking water sources or not and all-cause mortality risk were then estimated by Cox regression models with the use of multiple propensity score methods. The primary analysis used propensity score matching (PSM), and 1:1 matching without replacement was performed using the nearest neighbor matching algorithm, with a fixed caliper width of 0.1. In addition, stabilized inverse probability treatment weighting (IPTW) (21) and overlap weighting (22) were performed to confirm the reproducibility of the results by PSM.
Covariate differences after PSM, as well as IPTW and overlap weighting, were assessed using the overall propensity score distributional curves and calculating the ASD for each covariate. Then, Kaplan Meier curves and Cox models that used the above-mentioned propensity score methods were reported, and we also showed the Cox model that included propensity scores as an additional covariate. To eliminate the risk of insufficient covariate balance, we also repeated the analyses by further adjusting for baseline covariates in the propensity score weighting-adjusted Cox regression models (called the “doubly robust” method) (23). Our test ascertained that the proportional hazard assumption was not been violated.
To explore the potential for unmeasured confounding between drinking water sources and risk of all-cause mortality by calculating E-values, which quantify the required magnitude of an unmeasured confounder that could negate the observed association between drinking water sources and all-cause mortality risk (24).
The statistical analyses were performed with the use of R software, version 4.1.0 (R Project for Statistical Computing), including the “survival”, “tidyverse”, “rms”, “tableone”, “survey”, “survminer”, “stats”, “MatchIt”, “cobalt”, and “RISCA” packages. For all statistical analyses, a two-sided p-value of 0.050 was considered statistically significant.
Results
Baseline characteristics
From the seven waves, the number of newly recruited participants was 44,026, and 42,714 of them completed the drinking water sources assessment, which was the primary exposure of the study. Then, 11,658 participants were excluded for not meeting the study design and hypothesis that they were under 65 at baseline or drinking tap water at their childhood and/or young-old. Of 31,056 participants, 4,368 were excluded because of the absence of baseline or follow-up data (Figure 1B). Overall, 26,688 elderly participants drinking natural water from childhood to young-old (around 60 years old) were finally included in the study. The age of the study population was 91.00 (82.00, 100.00) years presented as median (IQR) and 89.81 ± 10.76 years as mean (±SD), and 16,254 (60.90%) of the participants were women.
In the crude sample, there was an imbalance (ASD ≥ 0.100) between the two groups in seven baseline variables, including residence, co-residence, fresh fruits, taking meat, reading books/newspapers, self-rated health, and places of birth (Table 1; Supplementary Table S3; Supplementary Figure S1). After PSM, IPTW and overlap weighting, the distributions of baseline characteristics were fairly well balanced (Figure 3); the differences were within the margin of 0.100 for all variables (Table 2; Supplementary Table S4; Supplementary Figure S1). Results of multivariable logistic regression analysis that predicted drinking natural water are listed in Supplementary Table S5, and the C-index of the propensity-score model was 0.695.
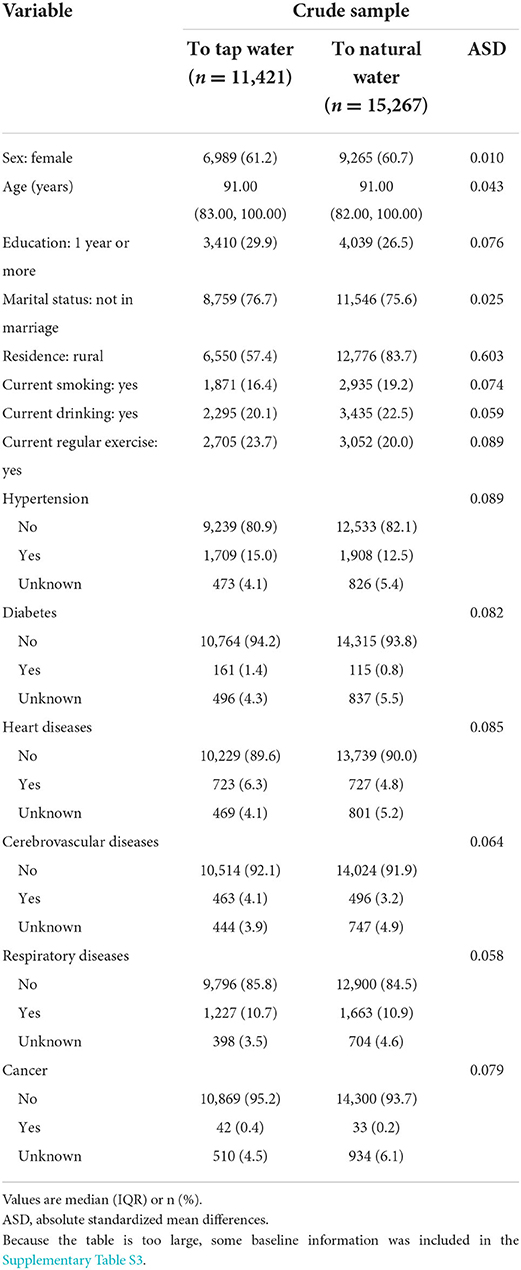
Table 1. Baseline characteristics stratified by baseline drinking water sources.
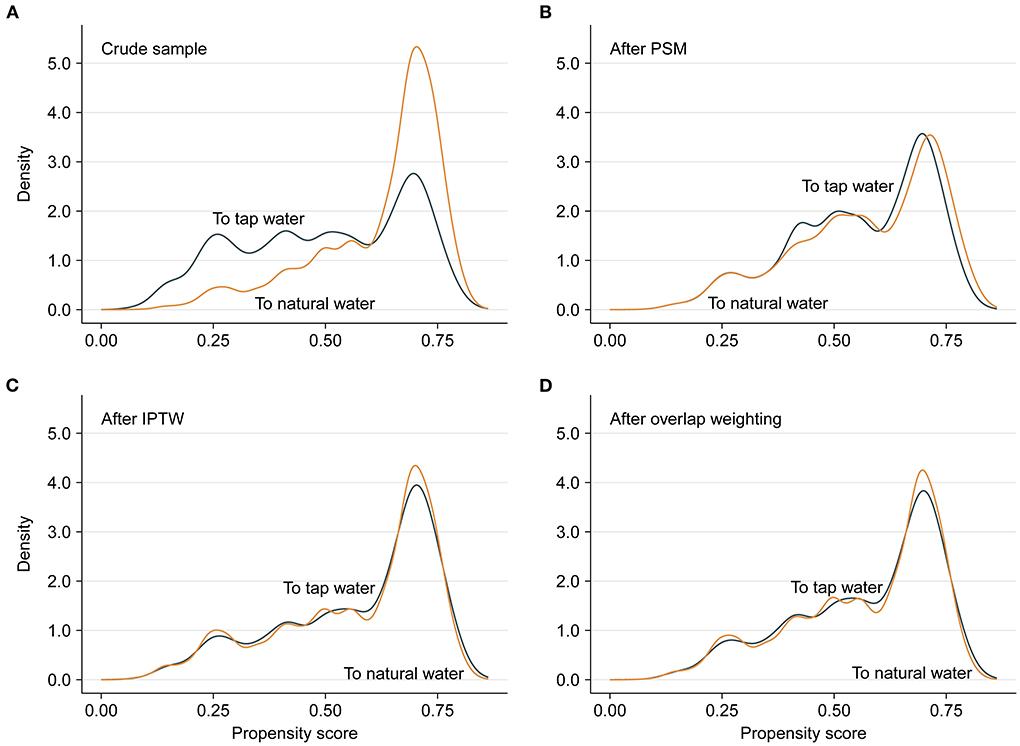
Figure 3. Propensity score distributional overlap before and after matching or weighting. (A–D) present propensity score distributions between the participants who drank natural water unchangeably and the participants who switched to tap water in the crude sample, PSM sample, IPTW sample and overlap weighting sample. For intervals along the x-axis, the area under the probability density curve represents the probability of those propensity scores, and smoothing was via the kernel density estimate. Greater overlap of propensity score curves of the two groups indicates a lesser risk of confounding.
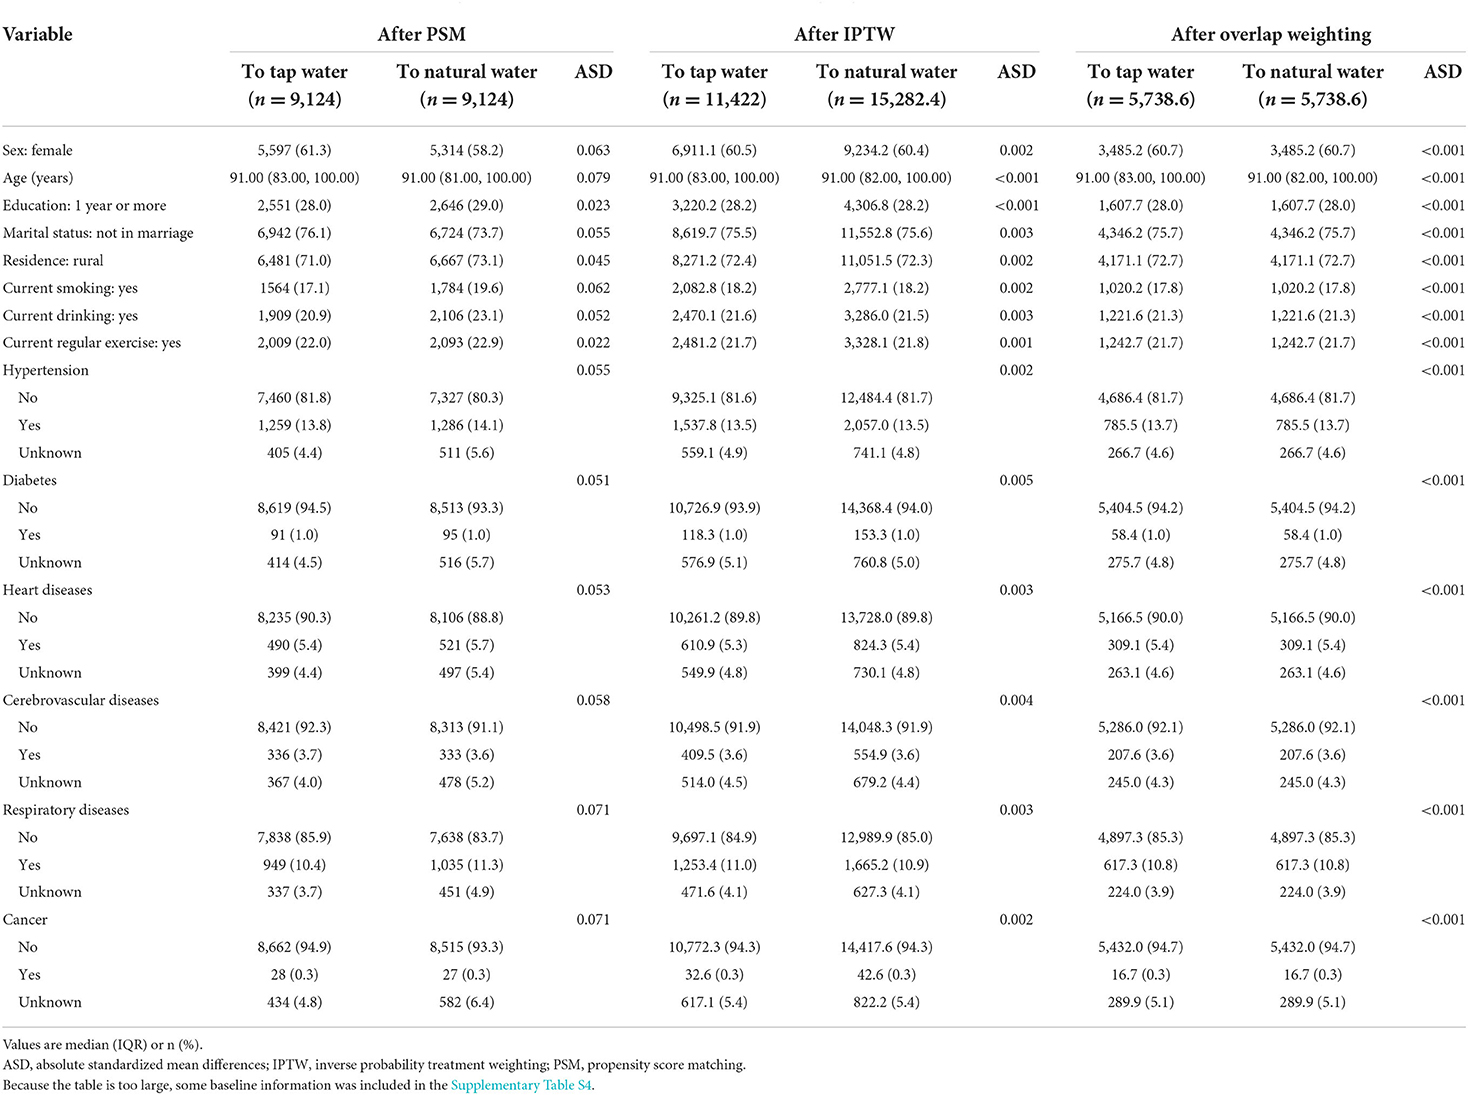
Table 2. Baseline characteristics stratified by baseline drinking water sources after PSM, IPTW, and overlap weighing.
Association between drinking water sources and all-cause mortality
During a median follow-up period of 3.00 (IQR: 1.52, 5.73; Max: 21.06) years, 21,379 deaths were recorded, 8,945 of them were from the group switching to tap water and the remaining 12,434 were from the other group. Kaplan-Meier curves demonstrate that participants who drank natural water unchangeably had a lower cumulative incidence of all-cause mortality either before or after matching and weighting (all log-rank p < 0.001, Figures 4A–D). In the crude and multivariable analyses, participants who drank natural water unchangeably had a significantly lower all-cause mortality risk than those who switched to tap water later (Table 3). The primary multivariable Cox analyses with PSM yielded similar results (HR: 0.94, 95% CI: 0.91–0.97, p < 0.001). Results remained consistent in other additional multivariable propensity-score analyses (Table 3).
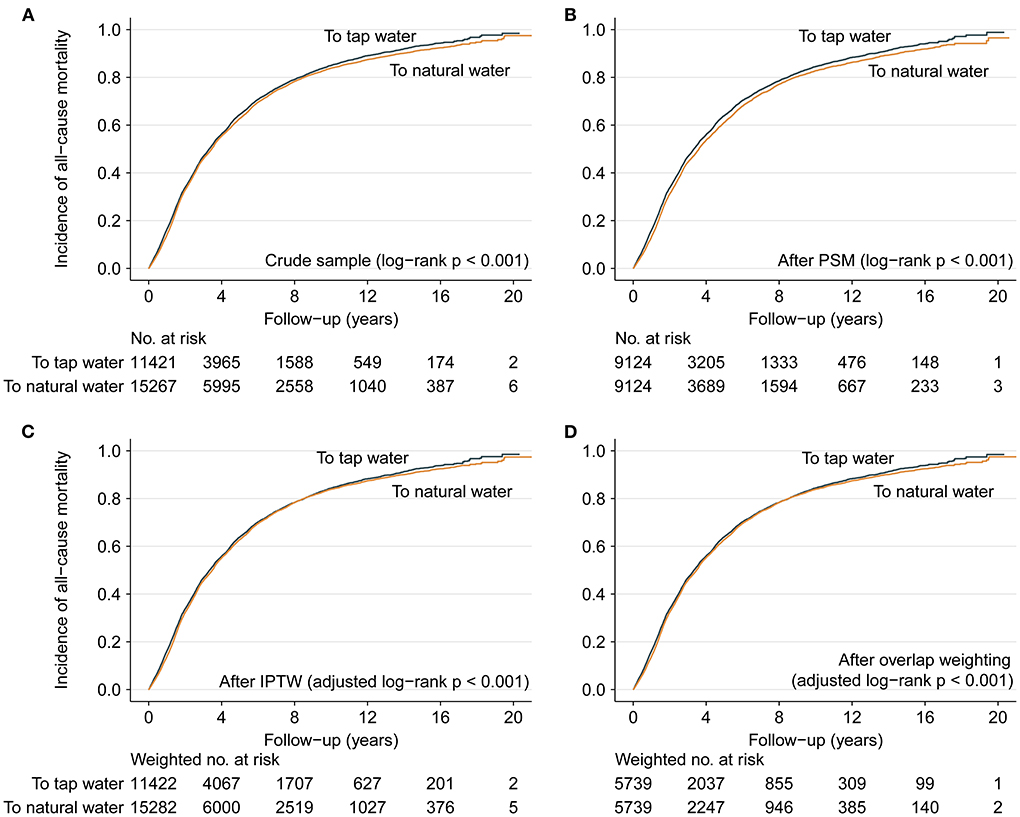
Figure 4. Cumulative incidence of all-cause mortality. (A–D) present Kaplan-Meier curves showing the participants with continued use of natural water had significantly lower cumulative incidence of all-cause mortality during the follow up in comparison with those switching to tap water later in the crude sample, PSM sample, IPTW sample and overlap weighting sample. In addition, the maximal difference of cumulative incidence was only 0.16% for the curves of “to tap water” between IPTW sample and overlap weighting sample at each same point of follow-up time, and the maximal difference was only 0.20% for the curves of “to natural water”; therefore, the curves were similar between (C,D).
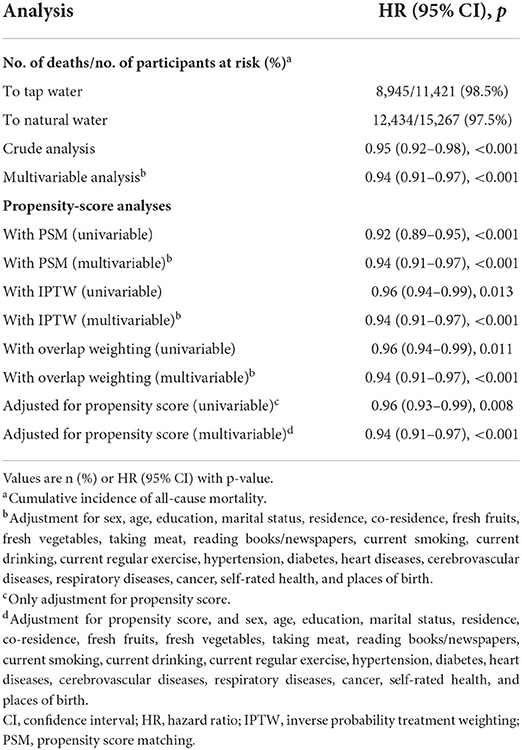
Table 3. Associations between drinking natural water and all-cause mortality (natural water vs. tap water).
Moreover, the E-values for the point estimate for all-cause mortality ranged from 1.20 to 1.31 with the upper limit ranging from 1.26 to 1.39 in different models (Supplementary Table S6), which might mean the robustness of the primary findings. Because in the case of the present sufficient covariates we adjusted, unless an unmeasured confounder existed with a substantially greater effect on risk of all-cause mortality (an HR higher than the E-values), the observed association or its CI would be reduced to null.
Discussion
To our best knowledge, the present study was the first to investigate the relationship between different drinking water sources and all-cause mortality. Based on a prospective cohort of community-dwelling Chinese elderly people, for the participants depending on natural water for drinking from their childhood to young-old, those who drank natural water unchangeably had a significantly lower all-cause mortality risk than those who switched to tap water in later life.
People often have conflicting attitudes toward tap water (4, 7) even though it is subject to strict safety regulations and very regular inspections (25). In fact, the production of drinking water complying with international quality standards does not necessarily ensure healthy for the consumer. For instance, several factors such as concentration of organic compounds, chlorine concentration, the residence time of the water in the distribution system, water temperature, physicochemical characteristics of the material lining the distribution pipes, and detachment, accumulation, and resuspension of loose deposits can influence the regrowth of heterotrophic bacteria or the water quality in the drinking water supply system (26–28).
Owing to the high efficiency in inactivating microbial pathogens and reducing microbial growth, Chlorine is used worldwide in drinking water treatment, but meanwhile, as a strong oxidant, it causes the formation of chlorination by-products, which have been confirmed genotoxic, cytotoxic, and carcinogenic (29, 30). More than this, in comparison with bacteria isolated from an unchlorinated drinking water distribution system, chlorine-tolerant microorganisms including Legionella, Escherichia, and Geobacter in chlorinated water as bacteria isolated from a chlorinated system were more resistant to both combined and free forms of chlorine (31, 32).
Nowadays microplastics have been widely concerned as a new emerging pollutant, affecting human health in various aspects (33–35). Based on 38 tap water samples taken in different cities in China (36), Tong et al. found the amount of microplastics varied from 440 ± 275 particles/L with most of which smaller than 50 μm. Using micro-Raman spectroscopy, the authors identified 14 different materials, and the majority comprised of polyethylene and polypropylene, which are utilized in pipes in drinking water distribution systems or household (36).
Lead contamination in drinking water is also a public health issue, generally resulting from the water contact with leaded distribution piping and on premise plumbing (15). Early in 1986, US Congress amended the Safe Drinking Water Act to prohibit the use of leaded pipes, solder, and flux in public water systems (15). Lead contamination can contribute to neurotoxicity, memory reduction, reproductive toxicity, vitamin-D deficiency, cancer, and catastrophic damage to reading capability, cardiovascular and hematopoietic systems (37). A survey of lead concentration in the tap water of 29 buildings on the National Taiwan University campus revealed that faucet was a major lead source in at least 8 buildings (38).
Another issue tightly associated with tap water is water storage tanks or other similar secondary water supply systems (pumps, pipes, etc.,) commonly constructed in multi-floor and high-rise buildings in metropolises to provide adequate hydraulic pressure and equalize water demands (39). Due to some typical characteristics of these secondary water supply systems including long detention time, presence of active materials, sediment accumulation and water stratification in tanks, and warm temperature on account of sunlight exposure (e.g., outdoor tanks), disinfectant decay and subsequent microbial multiplication can take place, further leading to tap water quality deterioration (39). A study found that water storage system commonly made of commercial PVC, 304 stainless steel, and Portland cement (PTL 325) is a reservoir for several opportunistic pathogens such as P. aeruginosa, Legionella spp., mycobacteria, and V. vermiformis, which have become an emerging public health threat worldwide, especially for immunocompromised populations (40). Accumulating evidences have linked these opportunistic pathogens infections with drinking water systems (41, 42).
In contrast, drinking natural water can avoid the problems above to a certain extent. China is a large agricultural country and natural water is a common drinking source for the rural areas (43). Natural water can enhance biological stability and lower concentrations of micropollutants on account of the presence of certain bacterial and fungal species helping to promote biodegradation of organic and inorganic matter (44). It is true of natural water, which cannot be subjected to any type of disinfection that modifies or eliminates its biological components, as a result, natural water always contains bacteria that are primarily a natural component of it (10). Meanwhile, no evidence between human diseases and the natural bacteria found in natural water has been discovered (10). Additionally, owing to the adsorption by the soil and degradation by various microorganisms in the soil, spring water contained fewer contaminants like antibiotics (43).
Different types of natural waters are an excellent source of calcium, bicarbonate, magnesium, and other useful mineral substances (45). Old age is a stage with increased calcium requirements for the body, and drinking natural water rich in calcium helps to prevent osteoporosis, tooth loss, and insomnia (46). Magnesium is a protective factor against atherosclerosis, ischemic heart disease, arrhythmias, sudden death, and cerebrovascular diseases (45) which have been determined to relate to age. The high bioavailability of magnesium in natural water makes it one of the best sources of supply (45). In addition, sodium bicarbonate mineral water has also been associated with a significant drop in total cholesterol (6.3%), low-density lipoprotein cholesterol (10%), and glucemia (45).
Several limitations merit consideration. Firstly, the current sample included in the analyses was composed of Chinese elderly individuals, thus, the conclusion of these findings should be extrapolated with caution. Secondly, participants' drinking water sources in childhood were collected by the questionnaire at baseline, and it could result in recall bias. Thirdly, there is possibly some residual confounding, therefore, we further calculated E-values which ranged from 1.20 to 1.31 in the presence of adjustment for various covariates. Fourth, some information such as the daily drinking amount was not collected. Fifth, we didn't exclude the deaths from injury or accidents, further studies focused on all-mortality should exclude it to explore the relationships.
In conclusion, based on the data from CLHLS, in Chinese elderly people depending on natural water for drinking from childhood to young-old, using natural water unchangeably was associated with a significantly lower risk of all-cause mortality compared with those switching to tap water in later life. More studies, as well as comprehensive causal analyses, are needed to explore the association in different countries and populations. Last but not least, close attention should be paid to residents' drinking water safety and quality.
Data availability statement
Publicly available datasets were analyzed in this study. This data can be found here: https://sites.duke.edu/centerforaging/programs/chinese-longitudinal-healthy-longevity-survey-clhls/survey-documentation/questionnaires/.
Ethics statement
The studies involving human participants were reviewed and approved by Research Ethics Committee of Peking University (IRB00001052-13074). The patients/participants provided their written informed consent to participate in this study.
Author contributions
LLiu, YZ, and SH designed the study protocol. LLiu and YZ performed statistical analysis, interpretation, and drafted the manuscript. HR, LLi, LZ, MZ, and LD performed the data collection. SH participated to the data cleaning. All authors read and approved the final manuscript.
Funding
This study was supported by Sichuan Science and Technology Program, China (Grant No. 2022YFS0186) and the National Natural Science Foundation of China (Grant No. 81600299).
Acknowledgments
We are grateful to the CLHLS Study, which provided the data for this research.
Conflict of interest
The authors declare that the research was conducted in the absence of any commercial or financial relationships that could be construed as a potential conflict of interest.
Publisher's note
All claims expressed in this article are solely those of the authors and do not necessarily represent those of their affiliated organizations, or those of the publisher, the editors and the reviewers. Any product that may be evaluated in this article, or claim that may be made by its manufacturer, is not guaranteed or endorsed by the publisher.
Supplementary material
The Supplementary Material for this article can be found online at: https://www.frontiersin.org/articles/10.3389/fpubh.2022.981782/full#supplementary-material
References
1. De Giglio O, Quaranta A, Lovero G, Caggiano G, Montagna MT. Mineral water or tap water? An endless debate. Ann Ig. (2015) 27:58–65. doi: 10.7416/ai.2015.2023
2. Rosario-Ortiz F, Rose J, Speight V, von Gunten U, Schnoor J. How do you like your tap water? Science. (2016) 351:912–14. doi: 10.1126/science.aaf0953
3. Debbeler LJ, Gamp M, Blumenschein M, Keim D, Renner B. Polarized but illusory beliefs about tap and bottled water: A product- and consumer-oriented survey and blind tasting experiment. Sci Total Environ. (2018) 643:1400–10. doi: 10.1016/j.scitotenv.2018.06.190
4. Geerts R, Vandermoere F, Van Winckel T, Halet D, Joos P, Van Den Steen K, et al. Bottle or tap? Toward an integrated approach to water type consumption. Water research. (2020) 173:115578. doi: 10.1016/j.watres.2020.115578
5. Ward LA, Cain OL, Mullally RA, Holliday KS, Wernham AG, Baillie PD, et al. Health beliefs about bottled water: a qualitative study. BMC Public Health. (2009) 9:196. doi: 10.1186/1471-2458-9-196
6. McLeod L, Bharadwaj L, Waldner C. Risk factors associated with the choice to drink bottled water and tap water in rural Saskatchewan. Int J Environ Res Public Health. (2014) 11:1626–46. doi: 10.3390/ijerph110201626
7. Doria MF. Bottled water versus tap water: understanding consumers' preferences. J Water Health. (2006) 4:271–6. doi: 10.2166/wh.2006.0023
8. Hanna-Attisha M, LaChance J, Sadler RC, Champney Schnepp A. Elevated blood lead levels in Children associated with the flint drinking water crisis: a spatial analysis of risk and public health response. Am J Public Health. (2016) 106:283–90. doi: 10.2105/AJPH.2015.303003
9. Sala-Comorera L, Caudet-Segarra L, Galofré B, Lucena F, Blanch AR, García-Aljaro C. Unravelling the composition of tap and mineral water microbiota: Divergences between next-generation sequencing techniques and culture-based methods. Int J Food Microbiol. (2020) 334:108850. doi: 10.1016/j.ijfoodmicro.2020.108850
10. Leclerc H, Moreau A. Microbiological safety of natural mineral water. FEMS Microbiol Rev. (2002) 26:207–22. doi: 10.1111/j.1574-6976.2002.tb00611.x
11. Schymanski D, Goldbeck C, Humpf HU, Fürst P. Analysis of microplastics in water by micro-Raman spectroscopy: release of plastic particles from different packaging into mineral water. Water Res. (2018) 129:154–62. doi: 10.1016/j.watres.2017.11.011
12. Wang T, Sun D, Zhang Q, Zhang Z. China's drinking water sanitation from 2007 to 2018: a systematic review. Sci Total Environ. (2021) 757:143923. doi: 10.1016/j.scitotenv.2020.143923
13. Han Z, An W, Yang M, Zhang Y. Assessing the impact of source water on tap water bacterial communities in 46 drinking water supply systems in China. Water Res. (2020) 172:115469. doi: 10.1016/j.watres.2020.115469
14. Watt GC, Britton A, Gilmour WH, Moore MR, Murray GD, Robertson SJ, et al. Is lead in tap water still a public health problem? An observational study in Glasgow. BMJ. (1996) 313:979–81. doi: 10.1136/bmj.313.7063.979
15. Jakositz S, Pillsbury L, Greenwood S, Fahnestock M, McGreavy B, Bryce J, et al. Protection through participation: Crowdsourced tap water quality monitoring for enhanced public health. Water Res. (2020) 169:115209. doi: 10.1016/j.watres.2019.115209
16. Zeng Y, Feng Q, Hesketh T, Christensen K, Vaupel JW. Survival, disabilities in activities of daily living, and physical and cognitive functioning among the oldest-old in China: a cohort study. Lancet. (2017) 389:1619–29. doi: 10.1016/S0140-6736(17)30548-2
17. Li ZH, Zhang XR, Lv YB, Shen D, Li FR, Zhong WF, et al. Leisure activities and all-cause mortality among the chinese oldest-old population: a prospective community-based cohort study. J Am Med Dir Assoc. (2020) 21:713–9 e2. doi: 10.1016/j.jamda.2019.08.003
18. World Medical A. World Medical Association Declaration of Helsinki: ethical principles for medical research involving human subjects. JAMA. (2013) 310:2191–4. doi: 10.1001/jama.2013.281053
19. Austin PC. Balance diagnostics for comparing the distribution of baseline covariates between treatment groups in propensity-score matched samples. Stat Med. (2009) 28:3083–107. doi: 10.1002/sim.3697
20. Austin PC. An introduction to propensity score methods for reducing the effects of confounding in observational studies. Multivariate Behav Res. (2011) 46:399–424. doi: 10.1080/00273171.2011.568786
21. Austin PC. Variance estimation when using inverse probability of treatment weighting (IPTW) with survival analysis. Stat Med. (2016) 35:5642–55. doi: 10.1002/sim.7084
22. Thomas LE, Li F, Pencina MJ. Overlap weighting: a propensity score method that mimics attributes of a randomized clinical trial. JAMA. (2020) 323:2417–8. doi: 10.1001/jama.2020.7819
23. Funk MJ, Westreich D, Wiesen C, Stürmer T, Brookhart MA, Davidian M. Doubly robust estimation of causal effects. Am J Epidemiol. (2011) 173:761–7. doi: 10.1093/aje/kwq439
24. Haneuse S, VanderWeele TJ, Arterburn D. Using the E-value to assess the potential effect of unmeasured confounding in observational studies. JAMA. (2019) 321:602–3. doi: 10.1001/jama.2018.21554
25. Eichler S, Christen R, Höltje C, Westphal P, Bötel J, Brettar I, et al. Composition and dynamics of bacterial communities of a drinking water supply system as assessed by RNA- and DNA-based 16S rRNA gene fingerprinting. Appl Environ Microbiol. (2006) 72:1858–72. doi: 10.1128/AEM.72.3.1858-1872.2006
26. Niquette P, Servais P, Savoir R. Bacterial dynamics in the drinking water distribution system of Brussels. Water Res. (2001) 35:675–82. doi: 10.1016/S0043-1354(00)00303-1
27. Liu G, Zhang Y, Knibbe WJ, Feng C, Liu W, Medema G, et al. Potential impacts of changing supply-water quality on drinking water distribution: A review. Water Res. (2017) 116:135–48. doi: 10.1016/j.watres.2017.03.031
28. Nescerecka A, Juhna T, Hammes F. Identifying the underlying causes of biological instability in a full-scale drinking water supply system. Water Res. (2018) 135:11–21. doi: 10.1016/j.watres.2018.02.006
29. Liu J, Li Y, Jiang J, Zhang X, Sharma VK, Sayes CM. Effects of ascorbate and carbonate on the conversion and developmental toxicity of halogenated disinfection byproducts during boiling of tap water. Chemosphere. (2020) 254:126890. doi: 10.1016/j.chemosphere.2020.126890
30. Richardson SD, Plewa MJ, Wagner ED, Schoeny R, Demarini DM. Occurrence, genotoxicity, and carcinogenicity of regulated and emerging disinfection by-products in drinking water: a review and roadmap for research. Mutat Res. (2007) 636:178–242. doi: 10.1016/j.mrrev.2007.09.001
31. Ridgway HF, Olson BH. Chlorine resistance patterns of bacteria from two drinking water distribution systems. Appl Environ Microbiol. (1982) 44:972–87. doi: 10.1128/aem.44.4.972-987.1982
32. Chiao TH, Clancy TM, Pinto A, Xi C, Raskin L. Differential resistance of drinking water bacterial populations to monochloramine disinfection. Environ Sci Technol. (2014) 48:4038–47. doi: 10.1021/es4055725
33. Prunier J, Maurice L, Perez E, Gigault J, Pierson Wickmann AC, Davranche M, et al. Trace metals in polyethylene debris from the North Atlantic subtropical gyre. Environ Pollut. (2019) 245:371–9. doi: 10.1016/j.envpol.2018.10.043
34. Wright SL, Thompson RC, Galloway TS. The physical impacts of microplastics on marine organisms: a review. Environ Pollut. (2013) 178:483–92. doi: 10.1016/j.envpol.2013.02.031
35. Xu S, Ma J, Ji R, Pan K, Miao AJ. Microplastics in aquatic environments: Occurrence, accumulation, and biological effects. Sci Total Environ. (2020) 703:134699. doi: 10.1016/j.scitotenv.2019.134699
36. Tong H, Jiang Q, Hu X, Zhong X. Occurrence and identification of microplastics in tap water from China. Chemosphere. (2020) 252:126493. doi: 10.1016/j.chemosphere.2020.126493
37. Rehman K, Fatima F, Waheed I, Akash MSH. Prevalence of exposure of heavy metals and their impact on health consequences. J Cell Biochem. (2018) 119:157–84. doi: 10.1002/jcb.26234
38. Chang FC, Lin YP. Survey of lead concentration in tap water on a university campus. Environ Sci Pollut Res Int. (2019) 26:25275–85. doi: 10.1007/s11356-019-05771-1
39. Li H, Li S, Tang W, Yang Y, Zhao J, Xia S, et al. Influence of secondary water supply systems on microbial community structure and opportunistic pathogen gene markers. Water Res. (2018) 136:160–8. doi: 10.1016/j.watres.2018.02.031
40. Zhang X, Xia S, Ye Y, Wang H. Opportunistic pathogens exhibit distinct growth dynamics in rainwater and tap water storage systems. Water Res. (2021) 204:117581. doi: 10.1016/j.watres.2021.117581
41. Brown-Elliott BA, Wallace RJ Jr, Tichindelean C, Sarria JC, McNulty S, Vasireddy R, et al. Five-year outbreak of community- and hospital-acquired Mycobacterium porcinum infections related to public water supplies. J Clin Microbiol. (2011) 49:4231–8. doi: 10.1128/JCM.05122-11
42. Benedict KM, Reses H, Vigar M, Roth DM, Roberts VA, Mattioli M, et al. Surveillance for waterborne disease outbreaks associated with drinking water - United States, 2013-2014. MMWR Morb Mortal Wkly Rep. (2017) 66:1216–21. doi: 10.15585/mmwr.mm6644a3
43. Meng T, Cheng W, Wan T, Wang M, Ren J, Li Y, et al. Occurrence of antibiotics in rural drinking water and related human health risk assessment. Environ Technol. (2021) 42:671–81. doi: 10.1080/09593330.2019.1642390
44. Deshmukh R, Khardenavis AA, Purohit HJ. Diverse metabolic capacities of fungi for bioremediation. Indian J Microbiol. (2016) 56:247–64. doi: 10.1007/s12088-016-0584-6
45. Casado Á, Ramos P, Rodríguez J, Moreno N, Gil P. Types and characteristics of drinking water for hydration in the elderly. Crit Rev Food Sci Nutr. (2015) 55:1633–41. doi: 10.1080/10408398.2012.692737
Keywords: tap water, natural water, drinking water sources, mortality, elderly people
Citation: Liu L, Zheng Y, Ruan H, Li L, Zhao L, Zhang M, Duan L and He S (2022) Drinking natural water unchangeably is associated with reduced all-cause mortality in elderly people: A longitudinal prospective study from China. Front. Public Health 10:981782. doi: 10.3389/fpubh.2022.981782
Received: 29 June 2022; Accepted: 05 August 2022;
Published: 22 August 2022.
Edited by:
Tao Liu, Jinan University, ChinaReviewed by:
Jianxiong Hu, Guangdong Provincial Center for Disease Control and Prevention, ChinaGuanhao He, Jinan University, China
Copyright © 2022 Liu, Zheng, Ruan, Li, Zhao, Zhang, Duan and He. This is an open-access article distributed under the terms of the Creative Commons Attribution License (CC BY). The use, distribution or reproduction in other forums is permitted, provided the original author(s) and the copyright owner(s) are credited and that the original publication in this journal is cited, in accordance with accepted academic practice. No use, distribution or reproduction is permitted which does not comply with these terms.
*Correspondence: Sen He, aGVzZW5zdWJtaXRAMTYzLmNvbQ==
†These authors have contributed equally to this work and share first authorship