 Li Zhang
 Quan Zhou
 Li Hua Shao1
 Xue Qin Hu
 Jun Xia
- 1Department of Neurology, The First People's Hospital of Changde, Changde, Hunan, China
- 2Department of Science and Education, The First People's Hospital of Changde, Changde, Hunan, China
- 3Department of Neurosurgery, The First People's Hospital of Changde, Changde, Hunan, China
Background: The association of metabolic syndrome (MetS) with depression has been previously reported; however, the results are ambiguous due to imbalanced confounding factors. Propensity score-based analysis is of great significance to minimize the impact of confounders in observational studies. Thus, the current study aimed to clarify the influence of MetS on depression incidence in the U.S. adult population by using propensity score (PS)-based analysis.
Methods: Data from 11,956 adults aged 20–85 years from the National Health and Nutrition Examination Survey (NHANES) database between 2005 and 2018 were utilized. Using 1:1 PS matching (PSM), the present cross-sectional study included 4,194 participants with and without MetS. A multivariate logistic regression model and three PS-based methods were applied to assess the actual association between MetS and depression incidence. Stratified analyses and interactions were performed based on age, sex, race, and components of MetS.
Results: After PSM, the risk of developing depression in patients with MetS increased by 40% in the PS-adjusted model (OR = 1.40, 95% confidence interval [CI]: 1.202–1.619, P < 0.001), and we could still observe a positive association in the fully adjusted model (OR = 1.37, 95% CI: 1.172–1.596, P < 0.001). Regarding the count of MetS components, having four and five conditions significantly elevated the risk of depression both in the PS-adjusted model (OR = 1.78, 95% CI: 1.341–2.016, P < 0.001 vs. OR = 2.11, 95% CI: 1.626–2.699, P < 0.001) and in the fully adjusted model (OR = 1.56, 95 CI%: 1.264–1.933, P < 0.001 vs. OR = 1.90, 95% CI: 1.458–2.486, P < 0.001). In addition, an elevation in MetS component count was associated with a significant linear elevation in the mean score of PHQ-9 (F =2.8356, P < 0.001). In the sensitivity analysis, similar conclusions were reached for both the original and weighted cohorts. Further interaction analysis revealed a clear gender-based difference in the association between MetS and depression incidence.
Conclusion: MetS exhibited the greatest influence on depression incidence in US adults, supporting the necessity of early detection and treatment of depressive symptoms in patients with MetS (or its components), particularly in female cases.
Introduction
Major depression, characterized by limited psychosocial function and a reduction in the quality of life, is expected to become the third largest cause of the overall disease burden worldwide (1). In the past 30 years, the number of global depression cases increased by 49.86% (2), causing a huge economic burden. Previous studies indicated several risk factors associated with depression, including old age, female gender, low education level, cognitive impairment, central obesity, physiological abnormalities, and a chronic medical history (3–5). A deeper excavating of the impact of risk factors on depression is of advantage to effective prophylaxis and cure. Aside from these traditional risk factors, the influence of metabolic syndrome (MetS) on the development of depression should be studied.
MetS has been proposed as a risk factor for cardiovascular disease (CVD). Patients diagnosed with MetS are at a greater risk of CVD (2–3 times) and type 2 diabetes (five times) (6). Insulin resistance (IR) is thought to be the core mechanism of MetS. Patients with depression could also show IR and glucose intolerance (7). Meanwhile, arterial stiffness (AS), a key mediator of CVD, was confirmed to be associated with middle-aged depression (5). Patients with mental illness have a higher prevalence of MetS, ranging from 29.4 to 67.9% (8). In Brazil's general population, the risk of MetS in patients with psychiatric disorders was 1.58 times higher (8, 9). All these findings suggested that there should be a link between MetS and depression.
Recently, several scholars have paid attention to the depression–MetS relationship, but the results obtained were still ambiguous. A few studies supported the independent correlation of MetS with elevated depression risk, even after adjusting for related factors (10–12), whereas other studies have not found any positive association between mental distress and MetS (13, 14). Scholars have frequently utilized traditional regression models to control for confounding. However, such methods may cause bias due to unmeasured or residual confounders, while including all available variables may cause the model to overfit, preventing the effective identification of the association between exposures of interest and outcome (15). The adjustment method based on the propensity score (PS) is of great significance to limit confounding in observational studies. It was pointed out that adjusting PS is important to eliminate biases caused by all observational covariates (16, 17). Scholars have attempted to introduce weighting, regression adjustment, and matching as PS-based adjustment methods (17).
The present study aimed at evaluating the actual association between MetS and depression incidence using PS-based analysis in US adults aged 20–85 years, utilizing data from the National Health and Nutrition Examination Survey (NHANES) over the period 2005–2018.
Methods
Study design and data source
The data of this study were obtained from NHANES, as previously described (18). The NHANES survey contained two parts; a family interview covering demographics, socioeconomic, nutritional, and health concerns; and a routine physical examination completed at the Mobile Examination Center (MEC) involving medical, dental, physiological measures, and laboratory testing. More details on NHANES can be obtained from the database.
Seven cycles of continuous NHANES data (2005–2018) were pooled in this cross-sectional study to produce sizable samples for analysis. Of the 70,190 subjects, we first eliminated individuals younger than 20 years (n = 30,441), followed by those who had missing data for MetS components (n = 23,318), depression questionnaire (n = 1,181), and other confounding factors (n = 3,294). Finally, this study contained 11,956 eligible subjects. The flowchart for choosing eligible subjects is displayed in Figure 1. The NCHS Research Ethics Review Committee gave its approval for all data collection, and all participants gave their written informed permission.
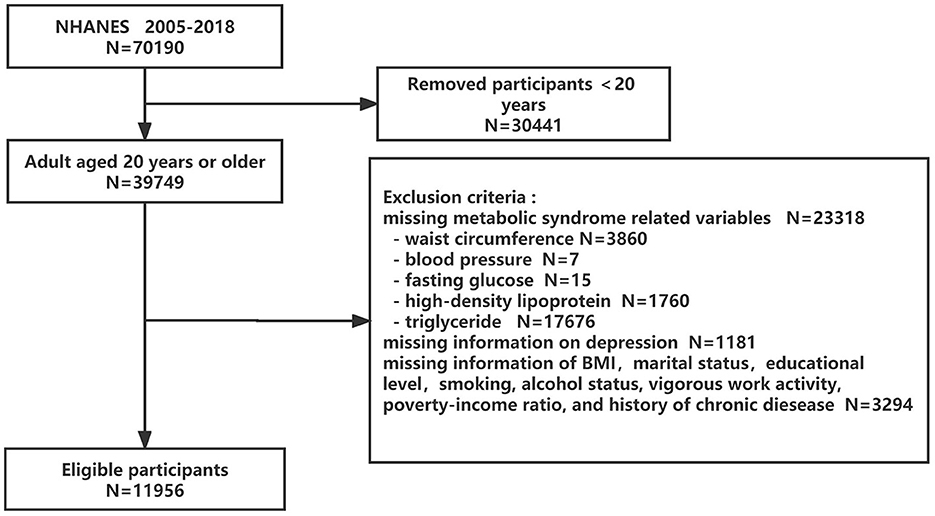
Figure 1. Flowchart of the eligible participant selection process. NHANES, National Health and Nutrition Examination Surveys.
Assessment of depressive symptoms
We utilized the Patient Health Questionnaire-9 (PHQ-9) scores to evaluate depressive symptoms (19). A total score of ≥ 10 was used as the cutoff to define depression according to a previous study (19).
Assessment of metabolic factors
We evaluated waist circumference with the assistance of trained NHANES staff through procedures designed for this target. Blood pressure was measured by an automatic sphygmomanometer at rest, and the mean value of three right-arm readings was recorded. Laboratory data for fasting glucose, HDL-C, and triglyceride levels were determined from fasting plasma samples using routine methods. More information on sample collection and processing instructions can be obtained from the NHANES Laboratory Procedures Manual.
Definition of metabolic syndrome
According to the revised National Cholesterol Education Program-Adult Treatment Panel III (NCEP-ATP III) criteria (20), MetS was defined as having at least three of the following conditions: (1) abdominal obesity, defined as a waist circumference of at least 102 cm for men and at least 88 cm for women; (2) hypertension, defined as an SBP of ≥130 mmHg or a DBP of ≥85 mmHg, or pharmacological therapy; (3) hypertriglyceridemia, defined as a triglyceride level of ≥150 mg/dL or fibrates being used; (4) low HDL-C level, defined as an HDL-C of <40 mg/dL in men and <50 mg/dL in women or having recently used lipid-lowering drugs; (5) hyperglycemia, defined as a fasting plasma glucose level of ≥100 mg/dL or currently using insulin or oral hypoglycemic drugs (20).
Collection of confounding factors
As potential confounders, the sociodemographic factors, lifestyle factors, and the health examination of subjects were collected, which including age, sex, race, marital status, education level, poverty-to-income ratio (PIR), smoking status, alcohol status, vigorous work activity, and history of chronic diseases [congestive heart failure (CHF), coronary heart disease (CHD), angina, heart attack, hypertension, diabetes mellitus, hyperlipidemia, and stroke]. PIR was stratified as ≤1.3, 1.3–1.85, and >1.85, based on data from the original survey. Smoking status was categorized as current, former, and never based on participants' answers to the following questions: “Have you smoked more than 100 cigarettes in your lifetime?” and “Do you smoke now?” Alcohol status was regarded as positive if participants consumed ≥12 alcoholic drinks per year. Vigorous work activity was defined in terms of responses to participation in the vigorous-intensity activity. A history of chronic diseases was based on self-reports of physician diagnoses.
Statistical analysis
Continuous variables were presented as the mean±standard deviation (SD), and comparison between groups was made using the two-sample t-test; the expression of categorical variables was undertaken as percentages, and the statistical differences between groups were measured using the Rao-Scott chi-square test.
PS analysis matched all confounding variables listed in Table 1 between MetS and non-MetS groups, and a single group, involving subjects with similar covariates, was formed. A non-parsimonious multivariable logistic regression model was utilized to estimate PS, in which MetS and 14 confounding variables were regarded as independent variables and covariates, respectively. A 1:1 greedy nearest neighbor matching without replacement (greedy matching algorithm) was performed in this study, and the caliper width was set to 0.01. Standardized difference (SD) was calculated as the evaluation index of the covariate balance in these matched participants. For a given covariate, a SD <10.0% represents a relatively little imbalance (21, 22). Detailed information on PSM is provided in Supplementary Table 1 and Supplementary Figure 1. In addition, an assessment of differences in the PHQ-9 mean score was undertaken using Fisher's exact method by counting MetS components.
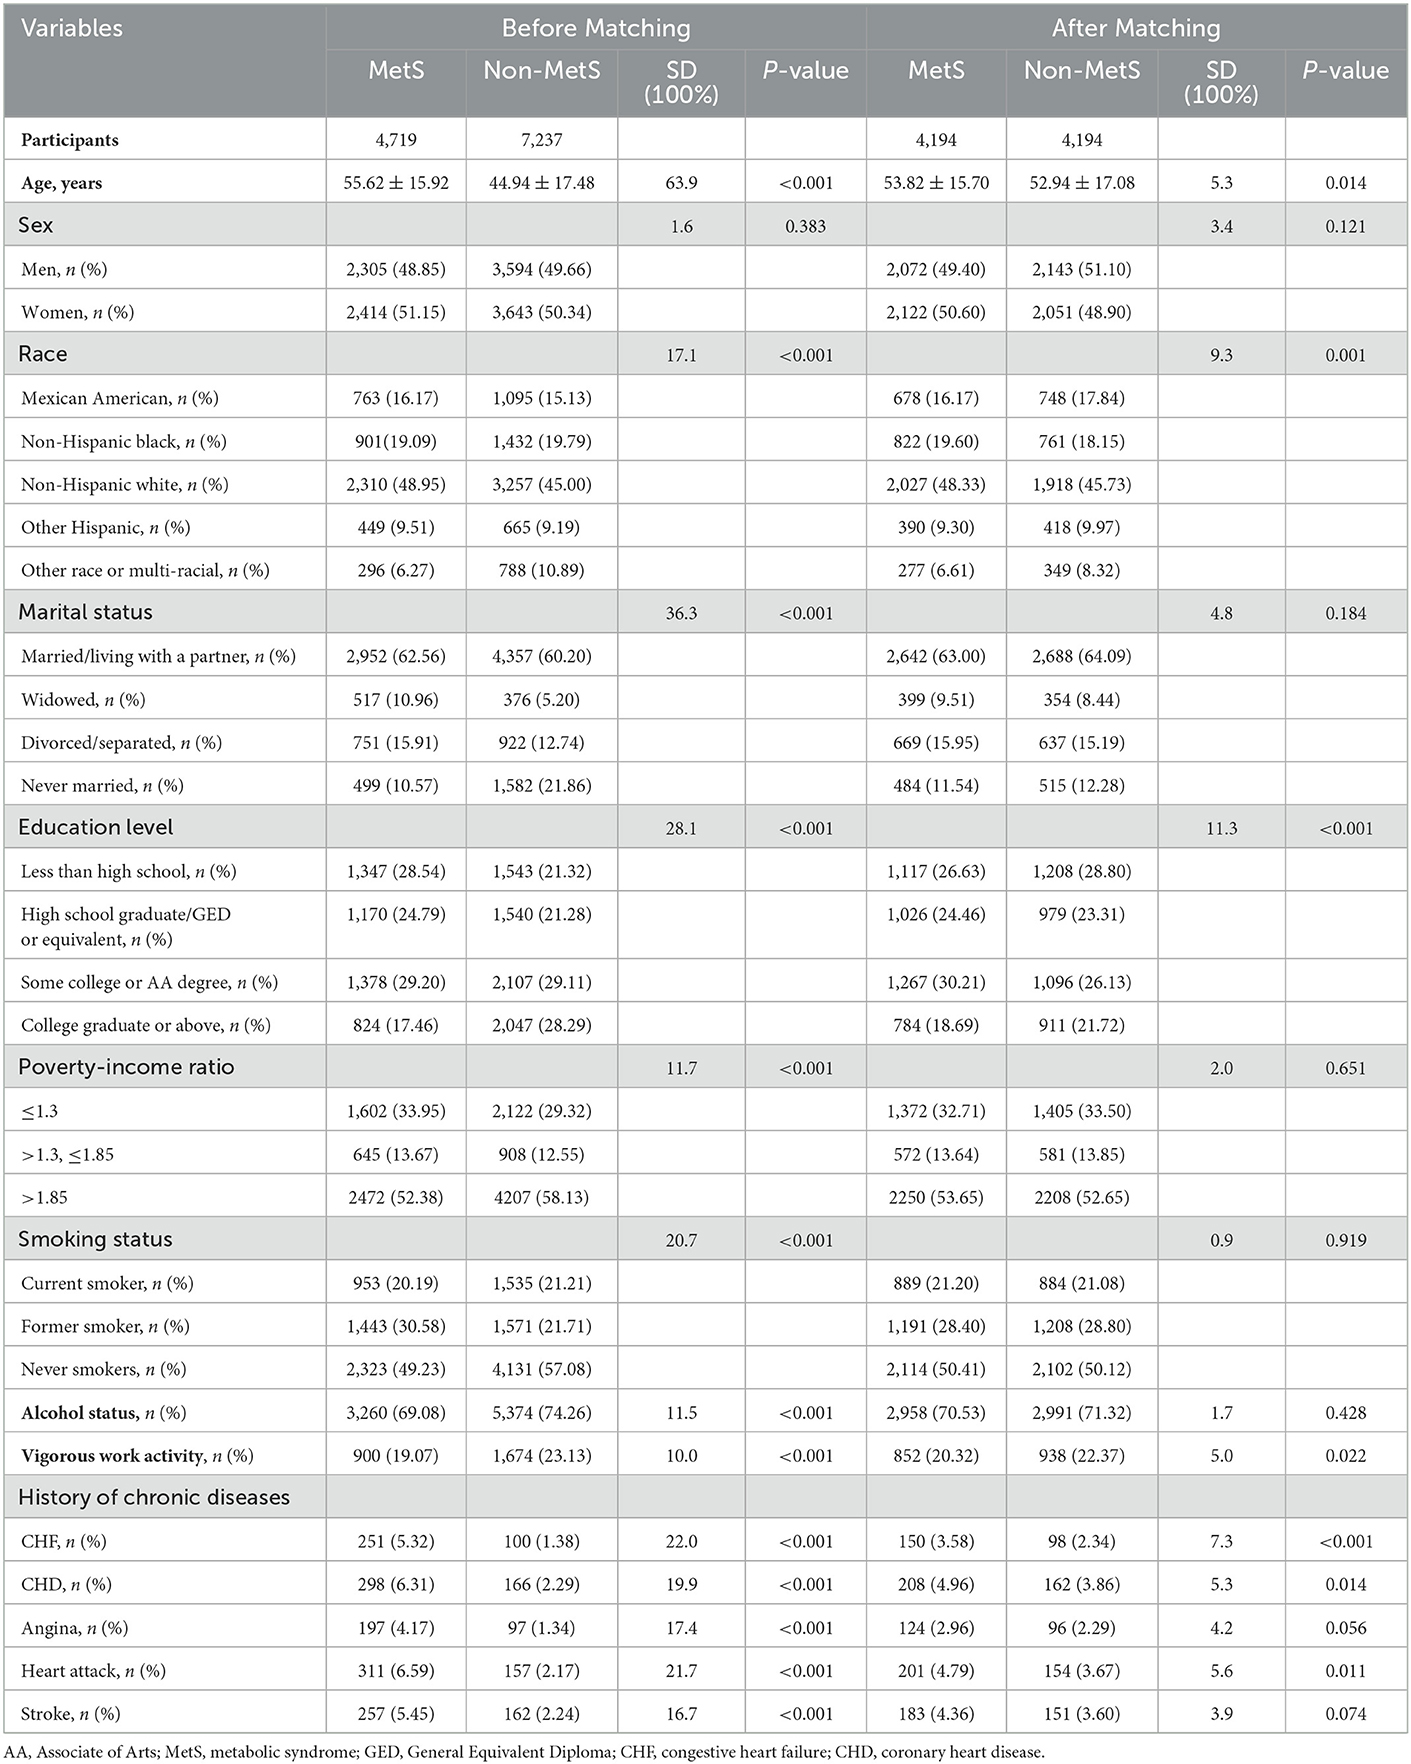
Table 1. Baseline characteristics of MetS and non-MetS participants before and after propensity score matching.
In our study, a robust estimation method was applied to control confounding variables and to evaluate the actual association between MetS and depression incidence. Specifically, the multiple logistic regression model and three PS-based models were used, including PS matching, PS adjustment, and inverse probability of treatment-weighted (IPTW) models were employed. First, the multiple logistic regression models were designed by adjusting for covariates in the PS-matched cohort. Second, PS adjustment was defined as a multivariate-adjusted regression model with adjustment for PS in the PS-matched cohort (17, 23). Third, for sensitivity analyses, an estimation of PS was undertaken for the calculation of IPTW. For instance, 1/PS was regarded as the weight of MetS, while 1/(1–PS) was attributable to the weight of non-MetS. The creation of a weighted cohort was undertaken via the IPTW model (24, 25). Using two relationship inference models (both in the original and weighted cohorts), sensitivity analysis was conducted. In addition, because PSM could only control the influence of measured confounders, if there are still unmeasured confounding factors, this will bring invisible bias. The E-value was calculated to assess the possibility of unmeasured confounders affecting the observed association between MetS and depression (26).
To further determine the robustness of our results in the diverse subgroups, stratified analysis based on age, sex, race, and components of MetS was also performed using stratified multivariate regression models. Each stratification was adjusted for PS in the PS-matched cohort. Exploration of modifications and interactions of subgroups was carried out using likelihood ratio tests. The STROBE statement was utilized to report the findings (27). R programming (version 4.1.3) and Empower Stats 4.1 software were applied for statistical analysis, and P < 0.05 was considered for defining statistical differences.
Results
Baseline characteristics
In this study, we enrolled 11,956 eligible subjects, whose mean age was 49.15 [17.67] years. Among them, 1,003 (8.4%) suffered from depression, with 369 (6.3%) and 634 (10.5%) being men and women, respectively. Before PSM, between the MetS group versus the non-MetS group, we identified significant differences in several confounding variables (Table 1). Patients with MetS appeared to be older, widowed, or divorced, with a lower PIR and education level, had a higher prevalence of cardiac–cerebral vascular diseases, and were more likely to be former smokers and drinkers. In general, 4,194 patients with MetS were successfully matched with non-MetS subjects by using a 1:1 PSM. Except for educational level, almost computation of standardized differences (SDs) indicated a rate of <10% for almost all covariates, exhibiting a well-matched after PSM.
MetS and its components exhibited a correlation with depression
We utilized multiple logistic regression models to clarify whether MetS is correlated with depression incidence after PSM. In the non-adjusted model, patients with MetS presented with a higher risk of depression (Model 1: OR: 1.41, 95 CI%: 1.211–1.630, P < 0.001; Table 2). After adjusting for all confounding factors, the results of Model 2 (OR:1.37, 95 CI%: 1.172–1.596, P < 0.001) were similar to those of Model 1. Even in the PS-adjusted model, the incidence of depression was still higher in patients with MetS (Model 3: OR: 1.40, 95 CI%: 1.202–1.619, P < 0.001). In addition, we also found a greater risk of depression among those cases whose count of MetS components was higher. Compared with those who had less than three MetS components, participants who had four or five components of MetS were 1.56 and 1.90 times, respectively, more likely to develop depression after full adjustment (Model 2: OR: 1.56, 95% CI: 1.264–1.933, P < 0.001 vs. OR: 1.90, 95% CI: 1.458–2.486, P < 0.001). The association still existed after adjusting for PS (Model 3: OR: 1.78, 95 CI%: 1.341–2.016, P < 0.001 vs. OR: 2.11, 95% CI: 1.626–2.699, P < 0.001). To ensure the robustness of our results, we also handled the count of MetS components as a continuous variable and observed the same trend (P for the trend < 0.001).
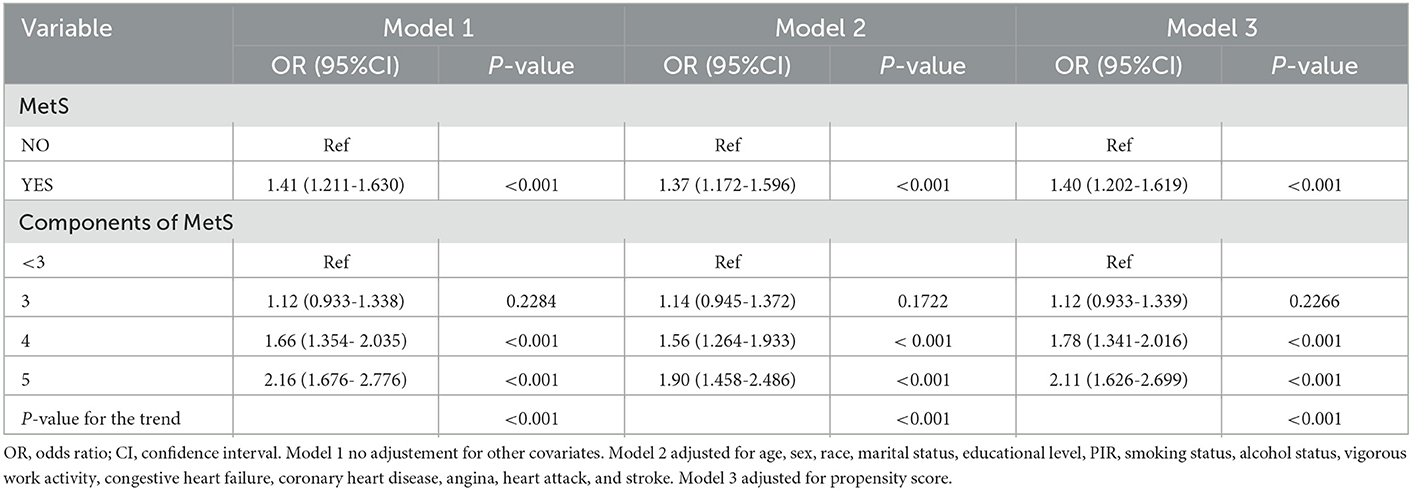
Table 2. Adjusted odds ratios for the prevalence of depression according to the presence of metabolic syndrome and its components in the PS-matched cohort.
The patients' mean PHQ-9 score, based on MetS components count, is presented in Figure 2. It was noted that an elevation in MetS components count was associated with a significant linear elevation in the mean score of PHQ-9 (F = 2.8356, P < 0.001).
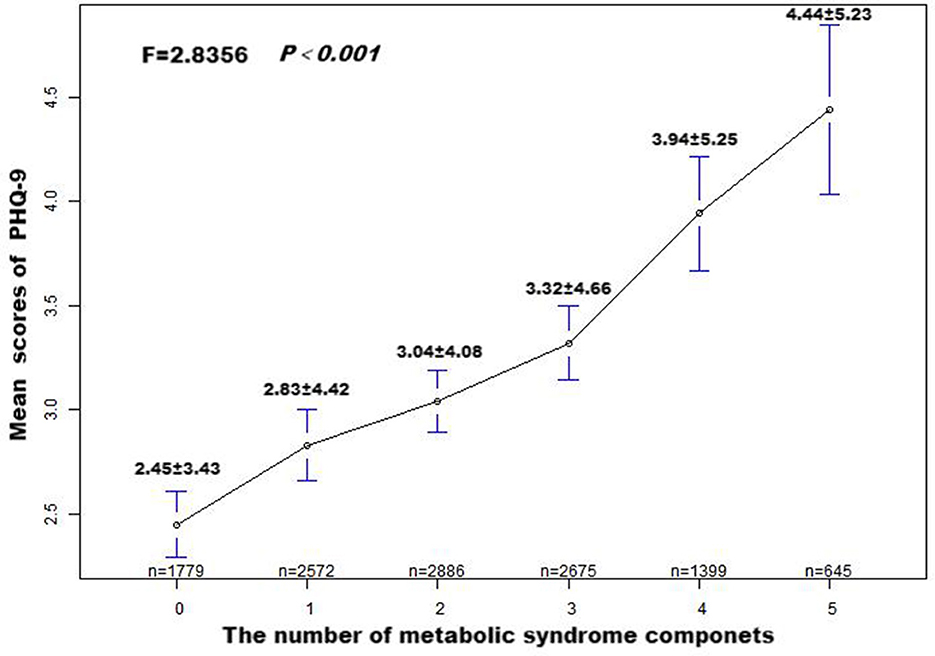
Figure 2. Patient Health Questionnaire-9 (PHQ-9) means score and standard error, according to the number of metabolic syndrome components. P-values were obtained by Fisher's exact test.
Sensitivity analysis
This study applied sensitivity analysis to further confirm the association between MetS and the incidence of depression in the two mentioned cohorts (Table 3). We utilized the estimated PS to form a weighted cohort via developing an IPTW model. In addition, we attempted to use the non-adjusted, partially adjusted, and fully adjusted models in both cohorts. A greater risk of developing depression was strongly related to patients with MetS in the cohorts. After adjusting all covariates, a greater risk of MetS was noted in those cases with MetS (Model 3: OR: 1.44, 95% CI: 1.247–1.659, P < 0.001) in the original cohort, and the results (Model 3: OR: 1.43, 95% CI: 1.241–1.642, P < 0.001) remained marked in the weighted cohort. MetS components count and the increased incidence of depression exhibited an independent relationship in the two cohorts. After adjusting all covariates, patients in the two cohorts with four (Model 3: OR: 1.69, 95% CI:1.390–2.058, P < 0.001 vs. OR: 1.70, 95% CI: 1.440–2.010, P < 0.001) or five (Model 3: OR: 1.94, 95% CI:1.507–2.496, P < 0.001 vs. OR: 2.07, 95% CI: 1.697–2.535, P < 0.001) components of MetS had a significantly elevated risk of depression than those without.
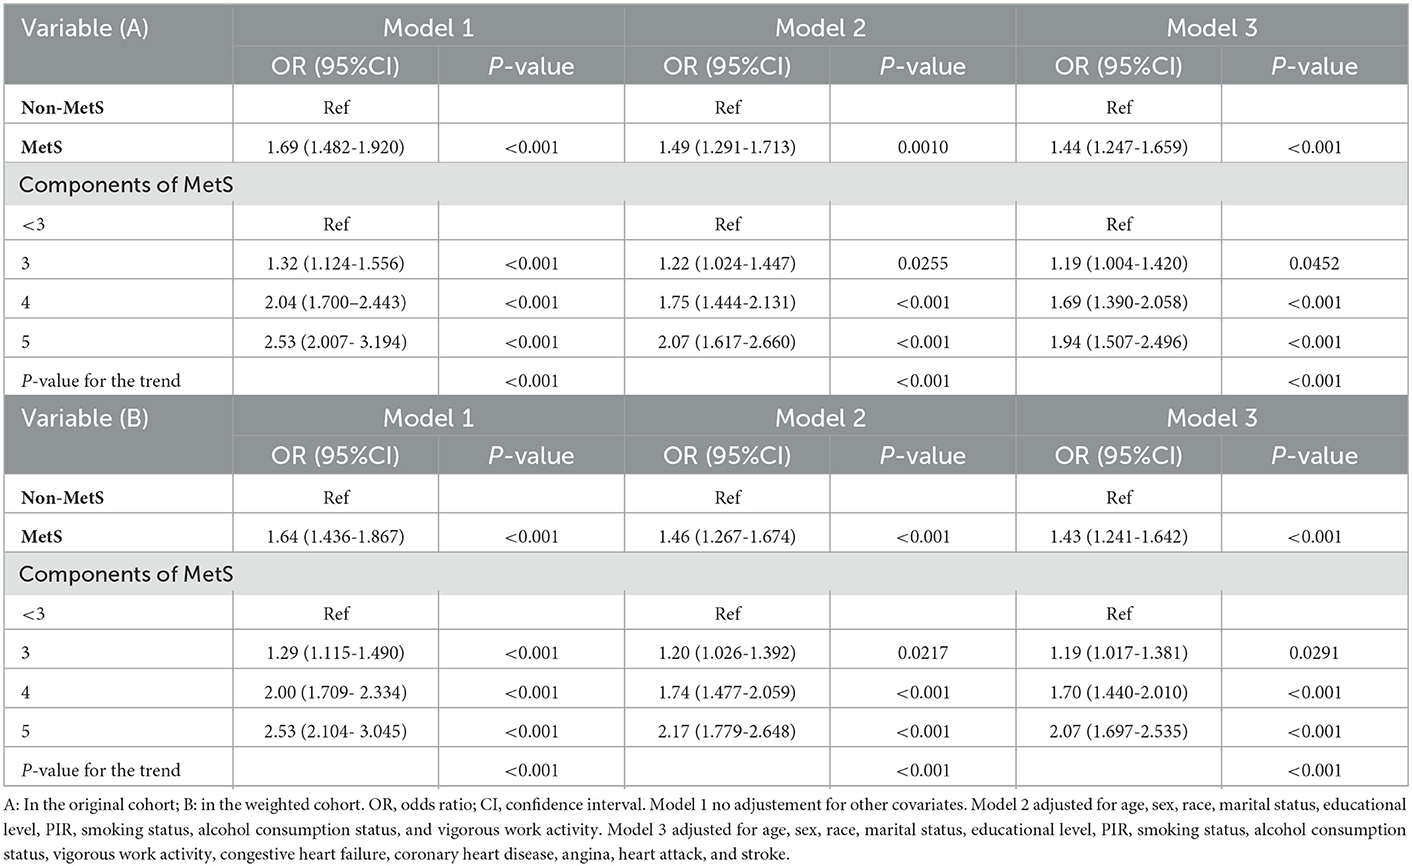
Table 3. Association of MetS and its components with depression in the original and the weighted cohorts.
Moreover, the sensitivity of unmeasured confounders was estimated via the calculation of the E-value. The E-value was 2.15 (lower confidence limit, 1.68), indicating that there is less likely to be an unmeasured confounding factor that can affect the current association between MetS and depression incidence.
Subgroup analysis
We attempted to carry out a stratified analysis to assess the robustness of our findings in the diverse subgroups after PSM. Figure 3 indicates that stratified analysis based on the age, sex, race, and components of MetS yielded consistent outcomes. The interaction analysis revealed a clear gender-based difference in the relationship between MetS and depression incidence. After adjusting for possible confounders, the risk of depression in female participants with MetS was 1.63 times higher than those without (OR:1.63, 95 CI%: 1.34–1.98). However, the association did not reach a statistical difference between male participants with MetS and depression (P for the interaction < 0.05). No noticeable interaction was identified for age, race, or components of MetS.
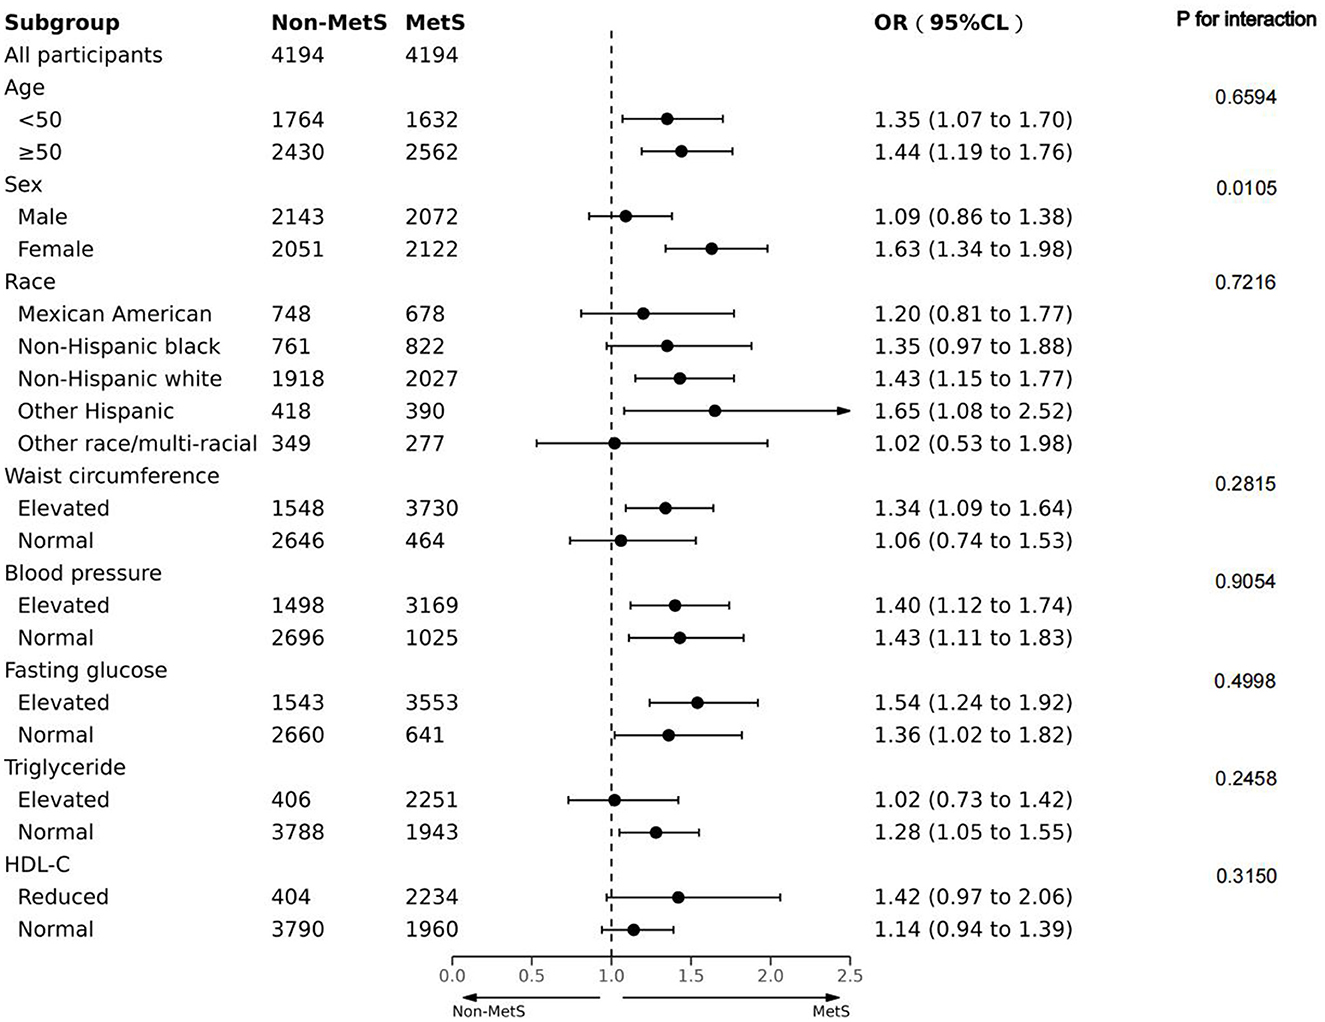
Figure 3. Forest plot of the association between MetS and depression in terms of age, sex, race, and components associated with MetS in the PS-matched cohort. Adjusted for PS.
Discussion
Depression is one of the most prevalent mental illnesses affecting adults, seriously impacting public health in the USA (28). To date, the concept of MetS has been assessed, and was related to a greater likelihood of CVD and all-cause mortality (29). Previously, few studies have attempted to determine the association between MetS and the prevalence of depression. In this PSM cohort study, we observed a positive association between MetS and depression incidence in US adults: Patients with MetS had a 40% elevated risk of developing depression after adjusting for PS, and the association still existed after adjusting for all confounders. In addition, an elevated MetS components count was positively associated with a greater risk of developing depression after PSM. In the sensitivity analysis, similar conclusions were reached for both the original and weighted cohorts. Even after adjusting for PS, subgroup analysis stratified by the chosen variables yielded consistent findings. Further interaction analysis revealed a clear gender-based difference in the relationship between MetS and depression risk.
As a comorbid factor of multiple diseases, depression has been associated with all-cause mortality (30) and adverse health outcomes (31). Scholars have pointed out a link between depression and MetS. In a recent meta-analysis, a bi-directional association between the two was detected in prospective cohort studies (32), consistent with two other cross-sectional studies, which showed a link between depression and MetS in Korean adults (12) and the rural Chinese population (3). In another longitudinal cohort study, the utilization of antidepressants and elevated depressive symptoms exhibited a link with short-term metabolic dysregulation (33). In the current study, the positive association of MetS with depression occurrence was also observed. The interaction between MetS and depression may be regulated by multiple mechanisms. First, the pathophysiology of depression and Mets shared similar biological processes, involving central obesity (34), insulin resistance (35), and chronic inflammation (36); thus, the occurrence and development of MetS may increase the risk of depression. Second, according to the vascular depression hypothesis, vascular damage in the brain may be a predisposing factor to depression in the elderly population (37). Third, the common unhealthy lifestyle related to depression and MetS, such as poor diet and sleep, smoking and alcohol use, as well as physical inactivity, may contribute to the promotion and development of each (38, 39). Fourth, antidepressants may have direct impacts on MetS components, for example, the use of tricyclic antidepressants (TCA) is related to abdominal obesity; conversely, a negative self-perception due to abdominal obesity may increase the risk of depression (40). In short, the mechanisms underlying this interrelationship are complex and unclear, and more research is needed, which will be essential for the prevention and treatment of both conditions.
The current study demonstrated that MetS and depression incidence exhibited a positive relationship. In this study, after PSM, the odds ratio for depression in patients with MetS was 1.40 (95% CI = 1.202–1.619), within the range of 1.23 to 1.52, which was provided as the odds ratio of patients with MetS for developing depression in a systematic review (33), confirming the importance of early detection and treatment of depression in patients with MetS. In terms of MetS components count, we observed a positive relationship of elevated OR for depression with MetS components count. Consistently, a study from the Korean NHANE (2007–2013) showed that MetS components count and the increased risk of depression exhibited a relationship (10). In addition, previous studies have also shown that the greater the MetS components count, the higher the mean PHQ-9 score (12, 35) or the severity of depression (12). The findings indicated that active treatment of depression should not only be aimed at those diagnosed with MetS but also those with a higher number of MetS components.
In addition, a sex difference in the association between MetS and depression occurrence was detected in the current study. The finding that the association was more remarkable in female patients with MetS agreed with previous studies (41–43). Physiological hormone differences (44), distinct lifestyle habits (45), and the use of a self-reported symptom scale for depression may partly explain the sex difference in this association. Men were more likely to under-report the severity of their depression, resulting in a classification bias.
Although a growing body of evidence has well-established the cross-sectional relationship between psychopathology and metabolic dysregulation, our study was the first conducted to explore the association between MetS and depression incidence by using the PS-based method. In addition, we attempted to conduct a sensitivity analysis to prove that our findings were robust. Moreover, our results may be more convincing due to the national representation and large sample size of NHANES. Lastly, age, sex, race, and components of MetS were selected for stratified analysis to analyze in more detail the effects of different populations diagnosed with MetS on depression incidence. However, the shortcomings of the present study should be acknowledged. First, the validity of the results might be influenced because no structured diagnostic scale was utilized to identify depression. Second, no longitudinal causal relationship could be determined between MetS and depression, attributable to the cross-sectional design. Third, some information (smoking status, physical activity, and alcohol consumption) was based on the participants' self-reports, highlighting the inevitability of bias risk.
Conclusion
In summary, MetS and depression incidence exhibited a positive relationship in a large, nationally representative study. The results highlighted the ongoing necessity for the early screening and management of depression in patients with MetS (or its components), particularly in female cases.
Data availability statement
The datasets presented in this study can be found in online repositories. The names of the repository/repositories and accession number(s) can be found at: http://www.cdc.gov/nhanes.
Ethics statement
The studies involving human participants were reviewed and approved by the NCHS Research Ethics Review Committee. The patients/participants provided their written informed consent to participate in this study.
Author contributions
LZ and JX contributed to the drafting of the manuscript, the analysis, interpretation of the data, read, and approved the final manuscript. LZ contributed to the conception, critical revision of the manuscript, analysis, interpretation of data, and approved the final version of the submitted manuscript. All authors contributed to the article and approved the submitted version.
Funding
This research was supported by grants from the general program of Changde City Science Foundation (2020S014).
Conflict of interest
The authors declare that the research was conducted in the absence of any commercial or financial relationships that could be construed as a potential conflict of interest.
Publisher's note
All claims expressed in this article are solely those of the authors and do not necessarily represent those of their affiliated organizations, or those of the publisher, the editors and the reviewers. Any product that may be evaluated in this article, or claim that may be made by its manufacturer, is not guaranteed or endorsed by the publisher.
Supplementary material
The Supplementary Material for this article can be found online at: https://www.frontiersin.org/articles/10.3389/fpubh.2023.1081854/full#supplementary-material
Abbreviations
MetS, metabolic syndrome; NHANES, National Health and Nutrition Examination Survey; TC, total cholesterol; TG, triglyceride; HDL-C, high-density lipoprotein cholesterol; IR, insulin resistance; AS, arterial stiffness; AA, Associate of Arts; GED, General Equivalent Diploma; CVD, cardiovascular disease; CHF, congestive heart failure; CHD, coronary heart disease; OR, odds ratio; CI, confidence interval; Ref, reference; PS, propensity score; IPTW, inverse probability of treatment weight.
References
2. Liu Q, He H, Yang J, Feng X, Zhao F, Lyu J. Changes in the global burden of depression from 1990 to 2017: findings from the global burden of disease study. J Psychiatr Res. (2020) 126:134–40. doi: 10.1016/j.jpsychires.2019.08.002
3. Yu S, Yang H, Guo X, Zheng L, Sun Y. Metabolic syndrome and depressive symptoms among rural Northeast general population in China. BMC Public Health. (2017) 17:43. doi: 10.1186/s12889-016-3913-0
4. Mezuk B, Eaton WW, Albrecht S, Golden SH. Depression and type 2 diabetes over the lifespan: a meta-analysis. Diabetes Care. (2008) 31:2383–90. doi: 10.2337/dc08-0985
5. Dregan A, Rayner L, Davis K. Associations between depression, arterial stiffness, and metabolic syndrome among adults in the UK Biobank population study: a mediation analysis. JAMA Psychiatry. (2020) 77:598–606. doi: 10.1001/jamapsychiatry.2019.4712
6. Ford ES. Risks for all-cause mortality, cardiovascular disease, and diabetes associated with the metabolic syndrome: a summary of the evidence. Diabetes Care. (2005) 28:1769–78. doi: 10.2337/diacare.28.7.1769
7. Silva N, Atlantis E, Ismail K. A review of the association between depression and insulin resistance: pitfalls of secondary analyses or a promising new approach to prevention of type 2 diabetes. Curr Psychiatry Rep. (2012) 14:8–14. doi: 10.1007/s11920-011-0245-8
8. Tirupati S, Chua LE. Obesity and metabolic syndrome in a psychiatric rehabilitation service. Aust N Z J Psychiatry. (2007) 41:606–10. doi: 10.1080/00048670701392841
9. Teixeira PJ, Rocha FL. The prevalence of metabolic syndrome among psychiatric inpatients in Brazil. Braz J Psychiatry. (2007) 29:330–6. doi: 10.1590/S1516-44462007000400007
10. Park SJ, Roh S, Hwang J, Kim HA, Kim S, Lee TK, et al. Association between depression and metabolic syndrome in Korean women: Results from the Korean national health and nutrition examination survey (2007-2013). J Affect Disord. (2016) 205:393–9. doi: 10.1016/j.jad.2016.08.022
11. Skogberg N, Castaneda AE, Agyemang C, Koponen P, Lilja E, Laatikainen T. The association of depressive and anxiety symptoms with the metabolic syndrome and its components among Russian, Somali, and Kurdish origin adults in Finland: A population-based study. J Psychosom Res. (2022) 159:110944. doi: 10.1016/j.jpsychores.2022.110944
12. Kim Y, Kim HY. Association between depression and metabolic syndrome in korean adults: data from the 2014 and 2016 Korea national health and nutrition examination survey. Asia Pac J Public Health. (2019) 31:18–29. doi: 10.1177/1010539518813704
13. Herva A, Räsänen P, Miettunen J, Timonen M, Läksy K, Veijola J, et al. Co-occurrence of metabolic syndrome with depression and anxiety in young adults: the Northern Finland 1966 Birth Cohort Study. Psychosom Med. (2006) 68:213–6. doi: 10.1097/01.psy.0000203172.02305.ea
14. Hildrum B, Mykletun A, Midthjell K, Ismail K, Dahl AA. No association of depression and anxiety with the metabolic syndrome: the Norwegian HUNT study. Acta Psychiatr Scand. (2009) 120:14–22. doi: 10.1111/j.1600-0447.2008.01315.x
15. Thiese MS. Observational and interventional study design types; an overview. Biochem Med (Zagreb). (2014) 24:199–210. doi: 10.11613/BM.2014.022
16. Austin PC. An introduction to propensity score methods for reducing the effects of confounding in observational studies. Multivariate Behav Res. (2011) 46:399–424. doi: 10.1080/00273171.2011.568786
17. Kurth T, Walker AM, Glynn RJ, Chan KA, Gaziano JM, Berger K, et al. Results of multivariable logistic regression, propensity matching, propensity adjustment, and propensity-based weighting under conditions of nonuniform effect. Am J Epidemiol. (2006) 163:262–70. doi: 10.1093/aje/kwj047
19. Kroenke K, Spitzer RL, Williams JB. The PHQ-9: validity of a brief depression severity measure. J Gen Intern Med. (2001) 16:606–13. doi: 10.1046/j.1525-1497.2001.016009606.x
20. National Cholesterol Education Program. Treatment of high blood cholesterol in adults (adult treatment panel III) final report. Circulation. (2002) 106:3143–421. doi: 10.1161/circ.106.25.3143
21. Normand SL, Landrum MB, Guadagnoli E, Ayanian JZ, Ryan TJ, Cleary PD, et al. Validating recommendations for coronary angiography following acute myocardial infarction in the elderly: a matched analysis using propensity scores. J Clin Epidemiol. (2001) 54:387–98. doi: 10.1016/S0895-4356(00)00321-8
22. Han Y, Hu H, Liu Y, Li Q, Huang Z, Wang Z, et al. The association between congestive heart failure and one-year mortality after surgery in Singaporean adults: a secondary retrospective cohort study using propensity-score matching, propensity adjustment, and propensity-based weighting. Front Cardiovasc Med. (2022) 9:858068. doi: 10.3389/fcvm.2022.858068
23. Zheng X, Cao C, He Y, Wang X, Wu J, Hu H. Association between nonalcoholic fatty liver disease and incident diabetes mellitus among Japanese: a retrospective cohort study using propensity score matching. Lipids Health Dis. (2021) 20:59. doi: 10.1186/s12944-021-01485-x
24. Koch B, Vock DM, Wolfson J. Covariate selection with group lasso and doubly robust estimation of causal effects. Biometrics. (2018) 74:8–17. doi: 10.1111/biom.12736
25. Geleris J, Sun Y, Platt J, Zucker J, Baldwin M, Hripcsak G, et al. Observational study of hydroxychloroquine in hospitalized patients with Covid-19. N Engl J Med. (2020) 382:2411–8. doi: 10.1056/NEJMoa2012410
26. Haneuse S, Van der Weele TJ, Arterburn D. Using the E-value to assess the potential effect of unmeasured confounding in observational studies. JAMA. (2019) 321:602–3. doi: 10.1001/jama.2018.21554
27. von Elm E, Altman DG, Egger M, Pocock SJ, Gøtzsche PC, Vandenbroucke JP. The Strengthening the reporting of observational studies in epidemiology (STROBE) statement: guidelines for reporting observational studies. Int J Surg. (2014) 12:1495–9. doi: 10.1016/j.ijsu.2014.07.013
28. Reeves WC, Pratt LA, Thompson W, Ahluwalia IB, Dhingra SS, McKnight-Eily LR, et al. Mental illness surveillance among adults in the United States. MMWR Suppl. (2011) 60:1–29.
29. Mottillo S, Filion KB, Genest J, Joseph L, Pilote L, Poirier P, et al. The metabolic syndrome and cardiovascular risk a systematic review and meta-analysis. J Am Coll Cardiol. (2010) 56:1113–32. doi: 10.1016/j.jacc.2010.05.034
30. Walker ER, McGee RE, Druss BG. Mortality in mental disorders and global disease burden implications: a systematic review and meta-analysis. JAMA Psychiatry. (2015) 72:334–41. doi: 10.1001/jamapsychiatry.2014.2502
31. Global, regional, and and national burden of 12 mental disorders in 204 countries and territories 1990-2019: 1990-2019: a systematic analysis for the Global Burden of Disease Study 2019. Lancet Psychiatry. (2022) 9:137–50. doi: 10.1016/S2215-0366(21)00395-3
32. Pan A, Keum N, Okereke OI, Sun Q, Kivimaki M, Rubin RR, et al. Bidirectional association between depression and metabolic syndrome: a systematic review and meta-analysis of epidemiological studies. Diabetes Care. (2012) 35:1171–80. doi: 10.2337/dc11-2055
33. Hiles SA, Révész D, Lamers F, Giltay E, Penninx BW, Bidirectional prospective associations of metabolic syndrome components with depression anxiety, and antidepressant use. Depress Anxiety. (2016) 33:754–64. doi: 10.1002/da.22512
34. Xu Q, Anderson D, Lurie-Beck J. The relationship between abdominal obesity and depression in the general population: a systematic review and meta-analysis. Obes Res Clin Pract. (2011) 5:e267–360. doi: 10.1016/j.orcp.2011.04.007
35. Liaw FY, Kao TW, Hsueh JT, Chan YH, Chang YW, Chen WL. Exploring the link between the components of metabolic syndrome and the risk of depression. Biomed Res Int. (2015) 2015:586251. doi: 10.1155/2015/586251
36. Howren MB, Lamkin DM, Suls J. Associations of depression with C-reactive protein, IL-1, and IL-6: a meta-analysis. Psychosom Med. (2009) 71:171–86. doi: 10.1097/PSY.0b013e3181907c1b
37. Alexopoulos GS, Meyers BS, Young RC, Campbell S, Silbersweig D, Charlson M. 'Vascular depression' hypothesis. Arch Gen Psychiatry. (1997) 54:915–22. doi: 10.1001/archpsyc.1997.01830220033006
38. Lopresti AL, Hood SD, Drummond PD. A review of lifestyle factors that contribute to important pathways associated with major depression: diet, sleep and exercise. J Affect Disord. (2013) 148:12–27. doi: 10.1016/j.jad.2013.01.014
39. Strine TW, Mokdad AH, Dube SR, et al. The association of depression and anxiety with obesity and unhealthy behaviors among community-dwelling US adults. Gen Hosp Psychiatry. (2008) 30:127–37. doi: 10.1016/j.genhosppsych.2007.12.008
40. van Reedt Dortland AK, Giltay EJ, van Veen T, Zitman FG, Penninx BW. Metabolic syndrome abnormalities are associated with severity of anxiety and depression and with tricyclic antidepressant use. Acta Psychiatr Scand. (2010) 122:30–9. doi: 10.1111/j.1600-0447.2010.01565.x
41. Rhee SJ, Kim EY, Kim SH, Lee HJ, Kim B, Ha K, et al. Subjective depressive symptoms and metabolic syndrome among the general population. Prog Neuropsychopharmacol Biol Psychiatry. (2014) 54:223–30. doi: 10.1016/j.pnpbp.2014.06.006
42. Laudisio A, Marzetti E, Pagano F, Pozzi G, Bernabei R, Zuccalà G. Depressive symptoms and metabolic syndrome: selective association in older women. J Geriatr Psychiatry Neurol. (2009) 22:215–22. doi: 10.1177/0891988709335793
43. Pulkki-Råback L, Elovainio M, Kivimäki M, Mattsson N, Raitakari OT, Puttonen S, et al. Depressive symptoms and the metabolic syndrome in childhood and adulthood: a prospective cohort study. Health Psychol. (2009) 28:108–16. doi: 10.1037/a0012646
44. Freeman EW, Sammel MD, Boorman DW, Zhang R. Longitudinal pattern of depressive symptoms around natural menopause. JAMA Psychiatry. (2014) 71:36–43. doi: 10.1001/jamapsychiatry.2013.2819
Keywords: metabolic syndrome, depression, propensity score-based analysis, positive association, cross-sectional study
Citation: Zhang L, Zhou Q, Shao LH, Hu XQ, Wen J and Xia J (2023) Association of metabolic syndrome with depression in US adults: A nationwide cross-sectional study using propensity score-based analysis. Front. Public Health 11:1081854. doi: 10.3389/fpubh.2023.1081854
Received: 27 October 2022; Accepted: 04 January 2023;
Published: 01 February 2023.
Edited by:
Dominic D'Agostino, University of South Florida, United StatesReviewed by:
Kristina Vatcheva, The University of Texas Rio Grande Valley, United StatesXueping Chen, Sichuan University, China
Copyright © 2023 Zhang, Zhou, Shao, Hu, Wen and Xia. This is an open-access article distributed under the terms of the Creative Commons Attribution License (CC BY). The use, distribution or reproduction in other forums is permitted, provided the original author(s) and the copyright owner(s) are credited and that the original publication in this journal is cited, in accordance with accepted academic practice. No use, distribution or reproduction is permitted which does not comply with these terms.
*Correspondence: Li Zhang,  MzQyNjQyNzRAcXEuY29t