 Gary M. Marsh
 Adam Kruchten
- Center for Occupational Biostatistics and Epidemiology, Department of Biostatistics, Graduate School of Public Health, University of Pittsburgh, Pittsburgh, PA, United States
Objectives: The study aimed to determine whether the National Cancer Institute's (NCI) recent suggestion of associations between acrylonitrile (AN) exposure and mortality in lung and bladder cancer and pneumonitis is robust to alternative methods of data analysis.
Materials and methods: We used the Richardson method to indirectly adjust risk ratios (RRs) in relation to AN exposure for potential confounding by smoking and asbestos. We repeated key analyses omitting workers from Plant 4 to account for possible local, historical shipyard-related asbestos exposures.
Results: The adjustment of lung cancer RRs for confounding by both smoking and asbestos and omitting Plant 4 workers yielded mostly decreased RRs and much less evidence of a positive association with cumulative AN exposure.
Conclusion: Overall, our reanalysis provided little evidence to support NCI's suggestion of associations between AN exposure and mortality in lung and bladder cancer and pneumonitis.
Introduction
Acrylonitrile (AN) is an important industrial chemical used in the manufacturing of acrylic and modacrylic fibers, resins, plastics, elastomers, adiponitrile, and nitrile rubber for various consumer goods. The primary routes of potential human industrial exposures to AN are inhalation and dermal contact. Potential non-industrial AN exposures arise from the burning of biomass (e.g., wildfires and fuel wood) and as a component of tobacco smoke (1). Experimental studies with rats exposed to AN by inhalation, drinking water, or gavage have produced tumors in the brain, Zymbal's gland, forestomach, and mammary gland (2). Tumors of the Harderian gland and forestomach were subsequently reported in mice exposed to gavage (3). Early epidemiological studies of AN-exposed workers revealed no clear and consistent evidence of an excess human cancer risk related to AN exposure. Although some studies reported slightly elevated relative risks for cancers of the lung, bladder, prostate, and CNS (central nervous system) (4–11), the findings were inconsistent and limited by study deficiencies such as the lack of exposure information, small study size, and inability to adjust adequately for potential confounding factors such as cigarette smoking and asbestos. In 1999, based on sufficient evidence in experimental animals and inadequate evidence in humans, the International Agency for Research on Cancer classified AN as a possible human carcinogen (12). Subsequent and other earlier studies (13–15), reanalyses of individual cohorts (16–18), reviews (19), and meta-analyses (20) have shown no consistent association between AN exposure and increased mortality risks based on any cancer site.
The NCI study originally reported by Blair et al. (5), which remains the largest cohort study to date, originally examined mortality patterns through 1989 among 25,460 employees from eight U.S. facilities that produced AN or used AN as feedstock in other manufacturing processes. The authors found no consistent evidence of an AN exposure–response relationship for lung cancer but reported a nonstatistically significant 1.5-fold excess of lung cancer in the highest quintile of cumulative exposure (5). Further analysis by deciles of cumulative exposure yielded similar results. The NCI study, which was updated in 2019 and is the basis of our reanalysis reported herein, extended mortality follow-up through 2011. The authors concluded that they found additional evidence of an association between AN exposure and lung cancer, as well as a possible increased risk for death due to bladder cancer and pneumonitis (21). Additional details of the NCI study are detailed in the following sections.
Updated NCI study: Further details and objectives of reanalysis
In 2019, NCI investigators extended the mortality follow-up of the NCI cohort of 21 years through 2011 and updated the case–cohort study by imputing smoking histories for newly identified lung cancer deaths (21). External mortality comparisons revealed an isolated statistically significant overall excess in mesothelioma [Standardized Mortality Ratio (SMR) = 2.24, 95% CI = 1.39–3.42]. Internal mortality comparisons again revealed the largest lung cancer (defined as lung and bronchus cancer) excesses in the highest quintile of cumulative AN exposure [Hazard Ratio (HR) = 1.43, 95% CI = 1.13–1.81], with marginal evidence of an exposure–response relationship (trend p-value = 0.05). Mortality risks from bladder cancer (defined as urinary bladder cancer) and pneumonitis (defined as pneumonitis due to solids and liquids) were also the largest in the highest cumulative AN exposure category, and both causes of death revealed a statistically significant trend with increasing cumulative AN exposure. No exposure–response relationship was found for mesothelioma. The authors concluded that their findings provided additional evidence of an association between AN exposure and lung cancer, as well as possible increased mortality risks for bladder cancer and pneumonitis.
The assessment of the cause-specific mortality risks in both NCI reports was based almost exclusively on internal study group comparisons (5, 21). The strengths of the internal study group comparison are that it will usually reduce the healthy worker effect (22) and it allows direct comparison of relative risk across strata. However, internal comparisons can be unstable when the study population is small (producing wider confidence limits) and may be misleading if workers included in the baseline category (i.e., least exposed or unexposed) have different underlying cancer risks than workers in the exposed groups. On the contrary, external comparisons based on regional rates have the strength of being able to adjust to geographic variability in social, cultural, and economic factors related to disease (23) and are generally very stable. The disadvantages of the external comparison group are the inability to adjust to the healthy worker effect and the difficulty in comparing standardized mortality ratios between groups when their confounder distributions differ (24).
In 2001, Marsh et al. reported a reanalysis of the lung cancer risk using cohort data from the original NCI study (5) that focused on AN exposure-specific lung cancer rates via external mortality comparisons (25). The authors found that the internal comparison-based NCI lung cancer excess among the most highly AN-exposed workers arose because of a small deficit in lung cancer deaths in the highest AN exposure category (regional rate-based SMR = 0.92, 95% CI = 0.6–1.4) was compared to a large, statistically significant deficit in deaths among unexposed workers that served as the baseline for the internal comparisons (SMR = 0.68, 95% CI = 0.5–0.9). Based largely on this and similar findings (25), it was concluded that their reanalysis provided little evidence that AN exposure increases lung cancer risk.
Another key shortcoming of both NCI study reports was the limited adjustment of lung cancer risk estimates for potential confounding by smoking or asbestos, and in the latest report, no adjustment of bladder cancer risk estimates was seen for potential confounding by smoking. That is, while the NCI case–cohort study enabled lung cancer risk estimates for 10% of the cohort (along with imputed smoking histories for new cases) to be adjusted for potential confounding by smoking, it did not permit smoking adjustment at the cohort level. Furthermore, based on unreasonable relative risk estimates for smoking and lung cancer, the smoking data in the original NCI study were likely to be misclassified (26) (Cunningham, MS, unpublished thesis, University of Pittsburgh, 2005). Adjustment for asbestos in the latest NCI study was based on semi-quantitative asbestos exposure probability scores.
We report here our re-analysis of the cohort data from the 2011 NCI cohort update and compare our findings to those of Koutros et al. (21) We focused on those findings as follows: (1) The relationship between cumulative AN exposure and mortality from the four causes of death categories of a priori interest: lung cancer, bladder cancer, mesothelioma, and pneumonitis using external comparisons (SMRs); and (2) indirect adjustment for potential confounding by smoking (lung and bladder cancer) and asbestos (lung cancer) at the cohort level and within AN exposure categories. We repeated key analyses omitting workers from one study plant (Plant 4) to account for possible historical shipyard-related asbestos exposures in the local area.
Methods
Reconstruct cohort data file
We obtained a copy of the updated NCI AN study data from the authors. This file included individual demographic, work history, and AN exposure data for 25,460 workers. Further details about the NCI-NIOSH study are provided by Blair et al. (5) and Koutros et al. (21). Due to the summary nature of the NCI work history and AN exposure data, we first reconstructed a cohort analysis file that was compatible with the more detailed input format of the OCMAP-Plus cohort analysis program (27). Because of the many assumptions required to reformat the NCI cohort file, we performed an extensive cross-check to establish the comparability of the NCI and our cohort data. Appendix A provides details of the study file reformatting and validation process. To comply with the data transfer agreement between the University of Pittsburgh and the NCI, no cohort data used or generated in our reanalysis were disclosed for any subcohort unit smaller than 10 subjects.
External mortality comparisons
We computed standardized mortality ratios (SMRs) and 95% confidence intervals (CI) for the four a priori causes of death categories among AN-exposed and unexposed workers stratified by study plant and in all plants combined. The four a priori categories were defined by the same International Classification of Diseases (ICD) codes used by NCI (21). SMRs were also computed for the categories (quintiles) of cumulative AN exposure (lagged 10 years as done by NCI) and time since the first AN exposure was reported in the NCI study. All SMRs were adjusted for race, sex, age group, and time period. As in the NCI study, person-year counts in the unexposed or lowest exposure baseline categories include the observation time of workers before their first AN exposure. SMRs were computed using both total U.S.-specific and plant-specific regional mortality rates developed from the Mortality Information and Research Analytics (MOIRA) program maintained at the University of Pittsburgh (27). Regional rates were based on an aggregate of individual counties or parishes from which at least 80% of each plant workforce resided. We show below the plant number, the counties or parishes comprising the regional rate, the 2,000 total populations (N) of the regional areas, and the total U.S. population in 2,000.
Plant 1: Santa Rosa and Escambia, FL (N = 412,153)
Plant 2: Brazoria, Galveston, and Harris, TX (N = 3,892,503)
Plant 3: Allen, Auglaize, Hardin, Hancock, Mercer, Putnam, and Van Wert, OH (N = 363,633)
Plant 4: Hampton City, Newport News City, and James City, VA (N = 374,689)
Plant 5: Morgan, Lawrence, Limestone, Cullman, and Madison, AL (N = 565,726)
Plant 6: Jefferson, Orleans, and St. Charles Parishes, LA (N = 988,212)
Plant 7: Hamilton, OH and Dearborn and Ripley, IN (N = 917,935)
Plant 8: Galveston and Brazoria, TX (N = 491,925)
Total U.S. (N = 281,421,906)
Our interpretation of the external comparisons focuses on the regional rates as we believe that they usually provide the most valid external comparison by helping to adjust for the social, cultural, and economic factors related to the disease. In addition, the large size of the regional populations shown earlier assures the stability of the associated death rates. We compared our U.S. and regional rate-based SMRs with the U.S. rate-based SMRs and internal rate-based hazard ratios (HRs) computed by Koutros et al. (21).
Indirect adjustment for potential confounding at the cohort level
Negative control outcome confounding adjustment
We used the methods described by Richardson (28) and Richardson et al. (29) to indirectly adjust internal cohort relative risks [Risk Ratio (RRs)] for lung cancer, bladder cancer, and pneumonitis among AN-exposed workers for potential confounding by smoking. This cohort-level method provides a control for the effect of unmeasured smoking through a negative control or proxy outcome that is known to be caused by smoking but not caused by the exposure of interest. We chose the cause of death category, i.e., chronic obstructive pulmonary disease (COPD), as the smoking-related cause of the death category that is not associated with AN exposure (i.e., negative control outcome). We applied the same method to indirectly adjust RRs for lung cancer for potential asbestos exposure (and for both smoking and asbestos exposure), using the cause of death category mesothelioma as the negative control outcome. The NCI study provided no evidence that mesothelioma mortality risks were related to AN exposure. We applied the Richardson method to both categorical and continuous forms of the AN exposure data (continuous data limited to lung cancer and COPD).
The Richardson method requires some strong assumptions that cannot be verified from data but must be informed by outside knowledge. First, and most critically, is the negative control condition that stipulates that the exposure of interest (AN) has no causal effect on the negative control outcome (COPD). If the negative control condition is not satisfied, the method is not valid, and it is not clear what the adjusted coefficients may mean. The second assumption is the equi-confounding assumption that requires that the unobserved confounders should have the same overall effect on both the negative control outcome (COPD) and the outcome of interest (lung cancer). If the equi-confounding assumption is satisfied, the Richardson method is able to remove unobserved confounders. In the case that the equi-confounding assumption is not fully satisfied, it must be noted that the Richardson method only provides partial adjustment. We further note that if one believes that the equi-confounding is not approximately true, the adjustments provided by the Richardson method may still contain some residual confounding bias. In this case, one should be cautious in the interpretation of the adjusted coefficients but can still use them as indicators of the presence of uncontrolled confounders (30).
We fitted relative risk regression models of the form λ(t) = λ0(t) expx(t)β to the internal cohort rates (31–33). For fitting the models, we used the exact conditional logistic regression procedure in the survival package (34) for R 4.0 software (35). For each model, we estimated the parameters β and the associated RRs. For each cause of death, risk sets were explicitly constructed using a nested case–control design from the NCI cohort data using the RISKSET program module in OCMAP-PLUS (27). We matched risk sets on the exact age at death (event time) and year of birth (±1-year caliper). We included race, sex, and pay type (wage or salary) as covariates in the resulting conditional logistic regression models. Time-dependent AN exposures were evaluated for each study member at each event time they were at risk.
We point out that conditional logistic regression is used to fit the model due to the use of explicitly constructed risk sets and is equivalent to estimating a stratified Cox proportional hazard model where strata are possibly varying in time (36). Furthermore, we clarify that this model estimates RRs due to the use of the nested case–control design. Some readers may be concerned that the use of conditional logistic regression mean results must be interpreted as an odds ratio. However, due to the study design, the odds ratio estimated by the conditional logistic regression is an exposure odds ratio rather than a disease odds ratio. The exposure odds ratio in this design is exactly equal to a rate ratio of mortality, which can further be interpreted as an RR as death can only occur at most once per individual (37). We further point out that our method to compute internal RRs is analogous to the Cox regression modeling used by NCI (21) and produced consistent results. Additional mathematical details of our application of the Richardson method and associated variance estimates are provided in Appendix B.
Bias adjustment factors and Monte Carlo sensitivity analysis
We also applied the indirect method proposed by Miettinen (38) and described by Axelson and Steenland (39) and Steenland and Greenland (40) to adjust selected external mortality comparisons for lung and bladder cancer for potential confounding by smoking (full cohort for both and plant-specific for lung cancer—UPitt regional rate-based SMRs for workers in the highest cumulative AN exposure category). The basic approach to adjusting SMRs indirectly first requires determining the confounding risk ratio (CRR), which is a function of the estimated RR for smoking and lung cancer among the cohort and also the prevalence of ever smoking among cohort members and members of the corresponding external standard populations. From the NCI case–cohort study, we used the reported RR = 19.1 for ever smoking and lung cancer and computed the overall and plant-specific prevalence of ever smoking. For smoking and bladder cancer, we used an RR = 3.5 (41). Because smoking data for the newly identified lung cancer cases and some original cases were imputed by NCI and not included in the data file, we adjusted our plant-specific prevalence measures by a factor of 0.68/0.63 = 1.081. We used the Behavioral Risk Factor Surveillance System Survey, 1995, (42) to determine smoking prevalence for the states that included each study plant. The “all plants” ever-smoking prevalence was reported by Koutros et al. (21) as 0.68.
Because the indirect method described earlier produces only a point estimate of the smoking-adjusted SMR, we applied Monte Carlo simulation-based sensitivity analysis to allow the inclusion of additional uncertainty by simulating plausible ranges of the unmeasured confounder variables and generating a distribution of possible parameter estimates and uncertainty values (40).
Plant 4 sensitivity analysis
Plant 4, which includes 3,379 study members (13.3% of the cohort), is located in the area of the Newport News Shipyard, the largest and oldest naval shipbuilding site in the United States. Because Newport News used hundreds of asbestos-containing products to build ships, its shipyard workers have an elevated risk of asbestos-related diseases including lung cancer and mesothelioma (43–50). Given the possibility that some, if not many, of the Plant 4 study members had prior or subsequent employment at Newport News, we repeated some of our key external and internal mortality comparisons with Plant 4 subjects who were omitted or isolated to evaluate the extent to which these possible extraneous asbestos exposures may have impacted our overall results.
Results
Issues identified in the NCI cohort file and analysis
Cohort deaths in 2012
Our efforts to reformat and validate the NCI cohort file revealed that 42 cohort members had dates of death in 2012 despite the NCI-reported study end date of 31 December 2011. These dates occurred uniformly across the year 2012 and included seven deaths in two of the four a priori causes of death categories (five lung and bronchus cancers and two urinary bladder cancers). Because the total death and specific cause of death counts in the NCI and UPitt cohorts matched using the 2011 study end date, we assumed that the NCI analysis must have somehow included the 42 deaths that occurred in 2012 within the earlier 1942–2011 period. To examine the impact of not extending follow-up properly through 2012, we computed regional rate-based SMRs for all causes of death including lung and bladder cancer, using both a 2011 and 2012 study end date and compared these with the U.S. rate-based SMRs reported by NCI (Table 1).
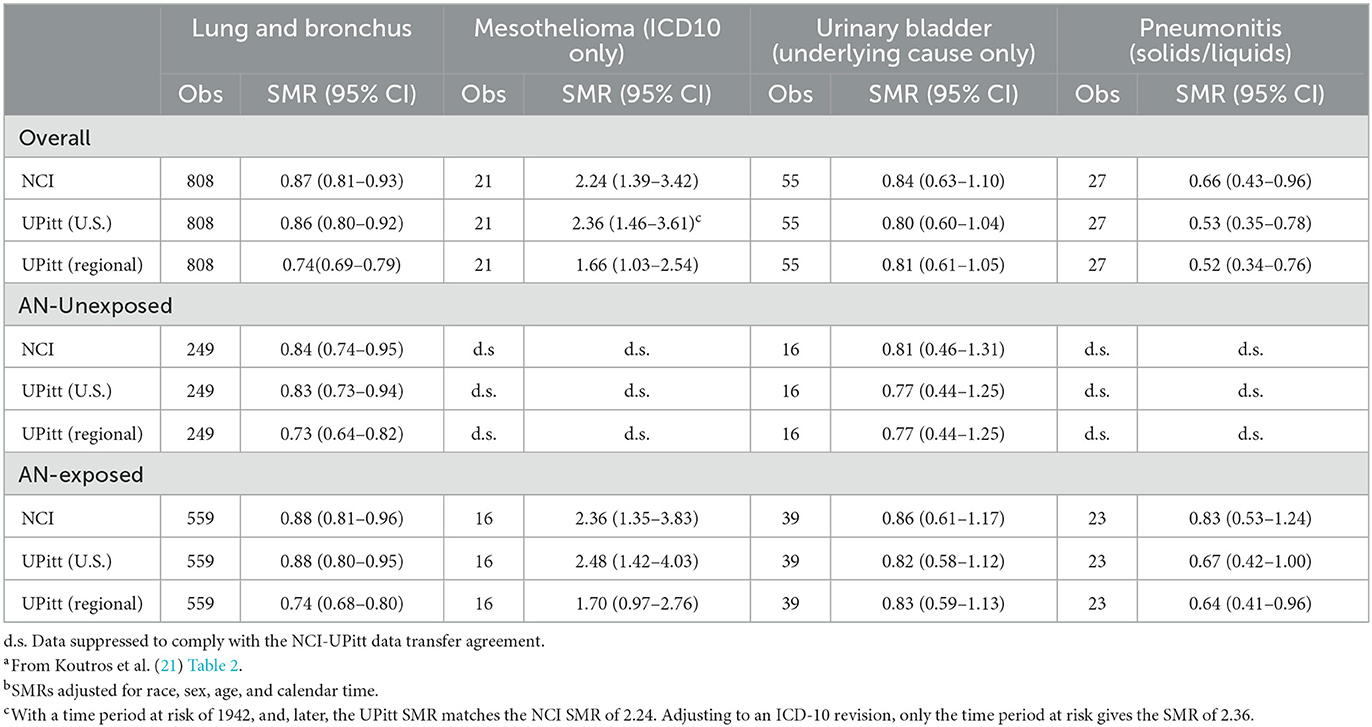
Table 1. Observed deaths, NCI U.S. rate-based SMRsa, b, UPitt U.S. and regional rate-based SMRsb for key causes of death by AN exposure, full NCI AN cohort, 1942–2011.
Supplemental Table 1 shows that for all causes of death categories, the UPitt SMRs based on both study end dates were uniformly less than the NCI U.S. rate-based SMRs. Moreover, the Upitt SMRs using the 2011 end date were ~4–5% greater than those based on the 2012 end date, suggesting that all NCIs 2011-based SMRs were inflated by this amount. The UPitt SMR for bladder cancer in the full cohort based on the 2012 end date revealed a statistically significant 25% deficit deaths (SMR = 0.76, 95% CI = 0.57–0.99). For the sake of consistency with the NCI analysis, we recorded the date of the death of the 2012 deaths to 31 December 2011 and used the same 2011 end date in all reanalyses.
Inconsistently reported follow-up periods
NCI reports that “Person-years of follow-up for SMRs were characterized from time of hire, the earliest of which was 1942, through 2011” (21). Given this, the titles of the NCI SMR tables, Table 2 and Web Table 5, are incorrect and misleading as they indicate a 1960–2011 follow-up, and Table 3 indicates a 1952–2011 follow-up. The earliest date of hire among cohort members was 1942, and the date of the first AN production was 1952. We identified 51 deaths between 1952 and 1959, and a very small number of person-years at risk (and no deaths) between 1942 and 1951. Thus, we found SMRs based on 1942–2011 to be very close to those based on 1952–2011, but for the sake of completeness and consistency, we chose to use 1942–2011 as the follow-up period for all external and internal mortality comparisons. NCI's use of a 1952–2011 follow-up for their internal analyses is consistent with the cohort data and reported accurately.
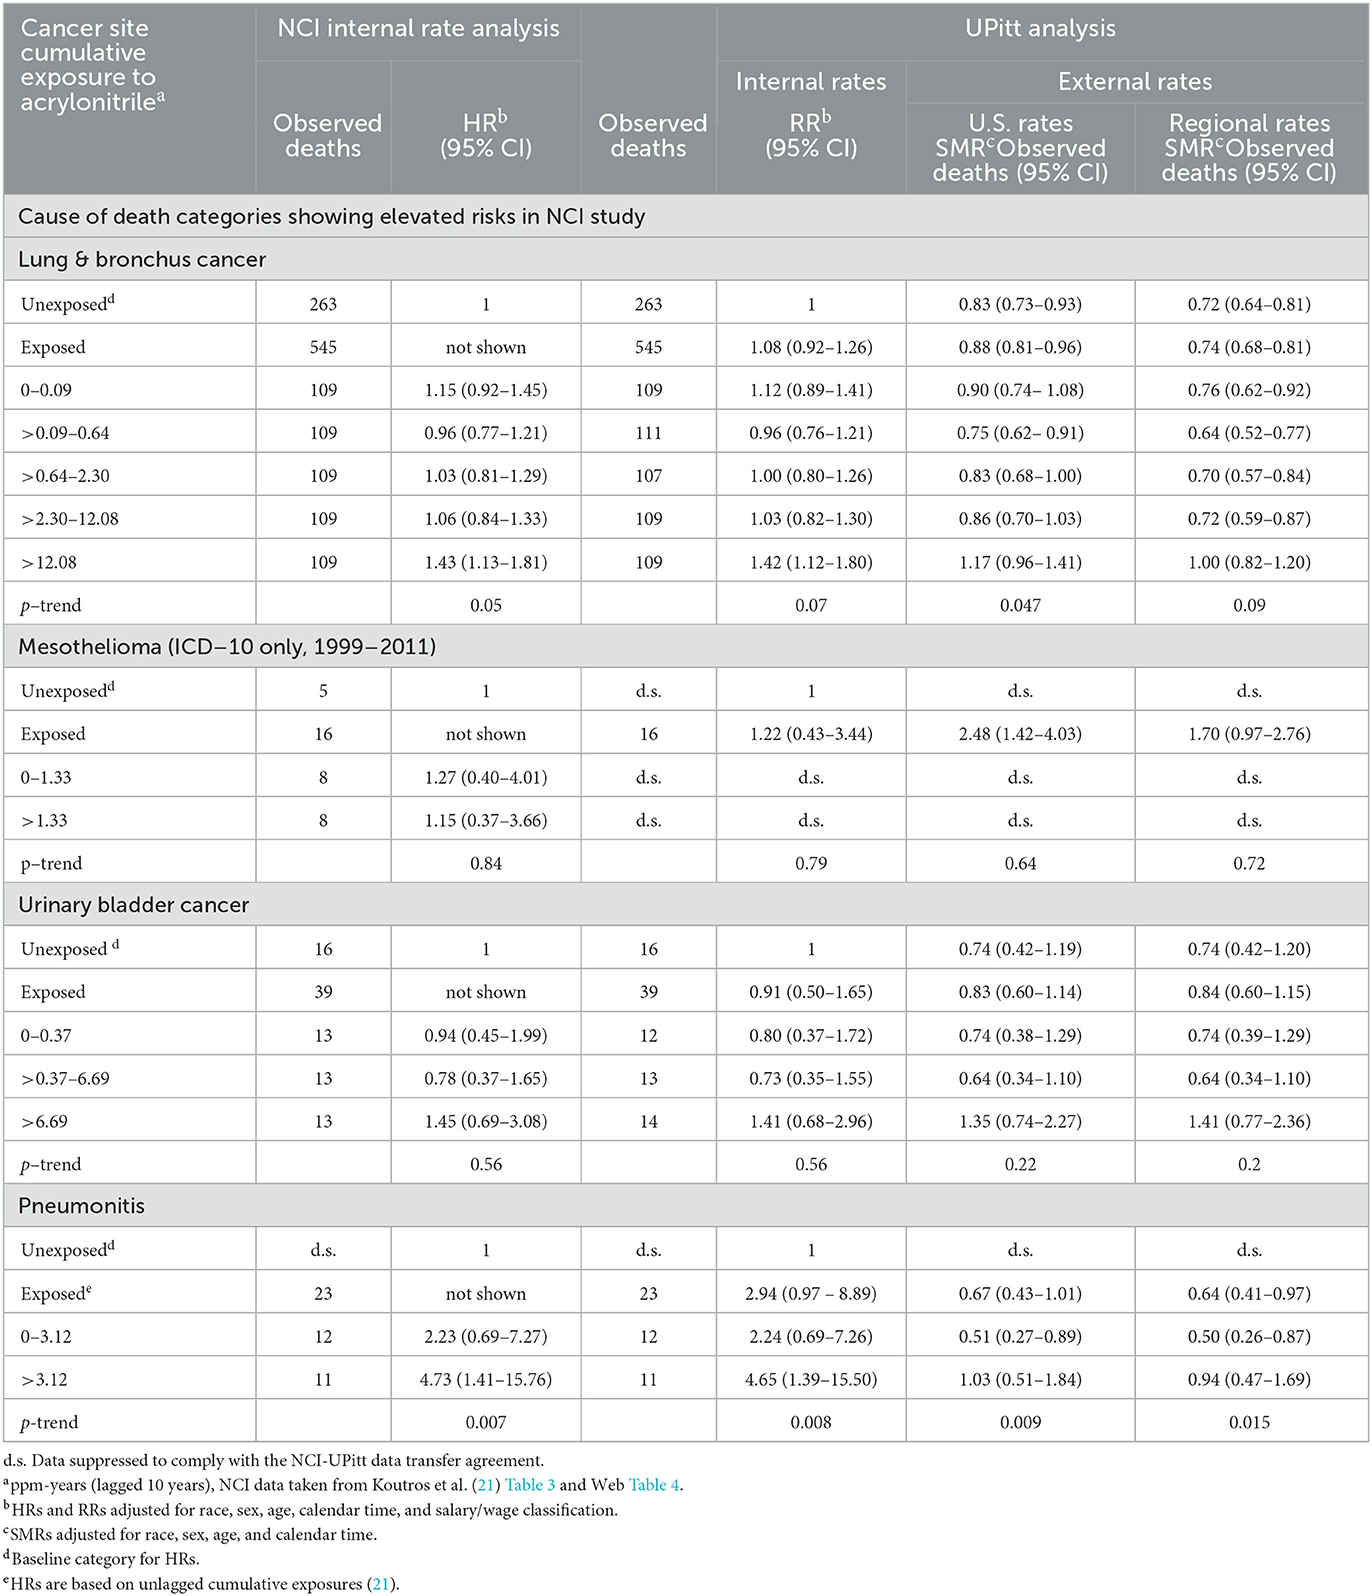
Table 2. Observed deaths, NCI internal rate-based HRs, and UPitt external rate-based SMRs (U.S. and regional rates) for selected causes of death by NCI cumulative acrylonitrile exposure category (lagged 10 years unless otherwise noted), full cohort, in the follow-up period 1942–2011.
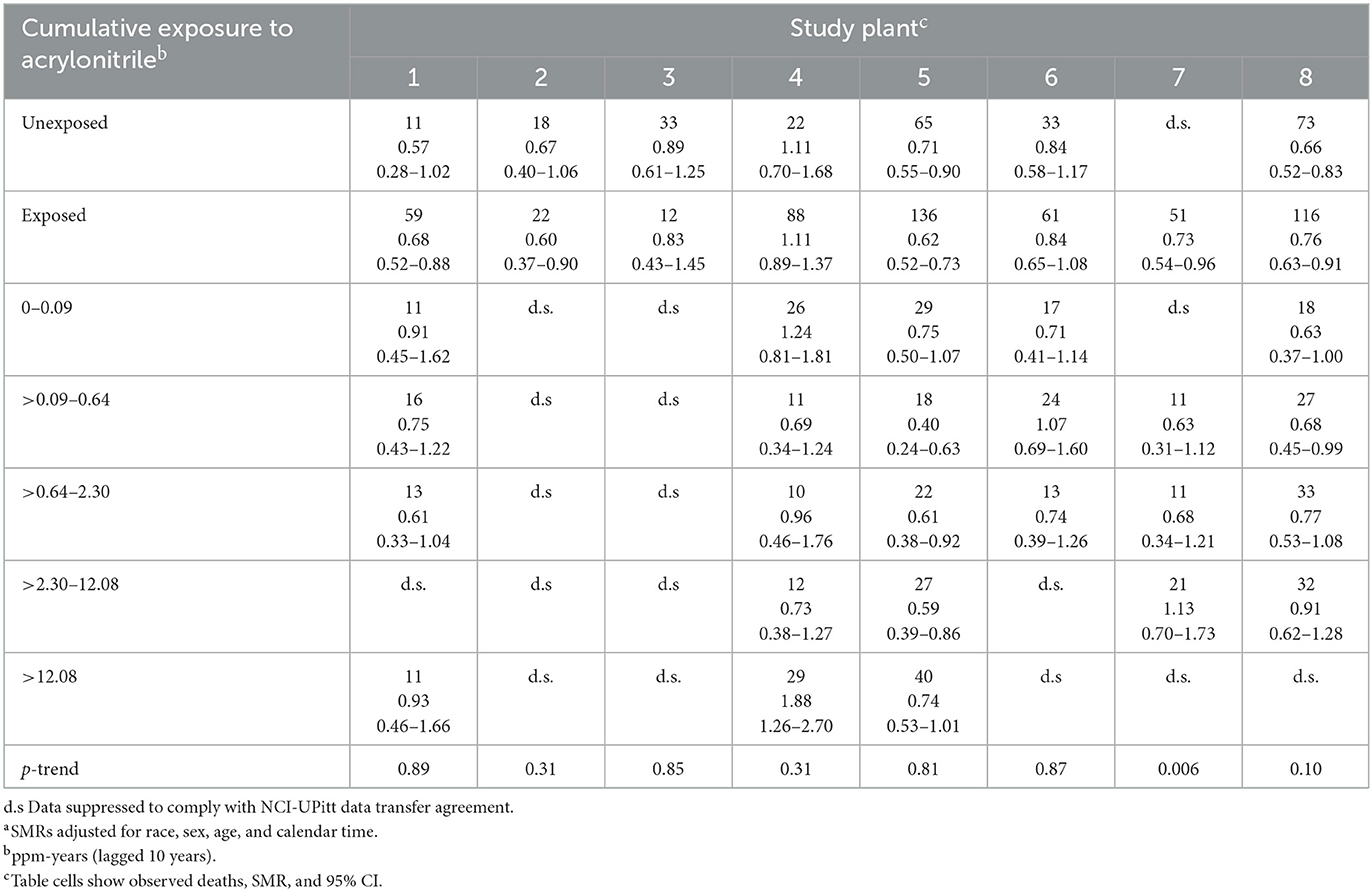
Table 3. Observed deaths and UPitt external rate-based SMRsa (regional rates) and 95% CIs for lung and bronchus cancer by cumulative acrylonitrile exposure category (lagged by 10 years) and study plant, full cohort, in the follow-up period 1942–2011.
Misinformation about follow-up period for mesothelioma deaths
National Cancer Institute notes throughout their report that the risk period for mesothelioma mortality was limited to the years of the ICD-10 (1999–2011) as this was the first ICD revision to include specific codes for mesothelioma (ICD-10 code C45) (21). However, as shown in Table 1, our U.S. rate-based SMR analysis for mesothelioma replicated exactly the NCI SMR of 2.24 (95% CI = 1.39–3.42) for the full cohort only when we used the entire 1942–2011 observation period. When we limited the observation period to ICD-10, we found a slightly larger SMR for mesothelioma of 2.36 (95% CI = 1.46–3.61) (Table 1).
External mortality comparisons
Table 1 shows a comparison of the NCI U.S. rate-based SMRs with UPitt SMRs based on U.S. and regional rates by AN exposure status for the four a priori cause of death categories. The numbers of deaths are identical for each cause of death category and with a few exceptions probably due to the aforementioned inconsistencies in follow-up periods used by NCI, and U.S. rate-based SMRs are close in value. For lung cancer and mesothelioma, UPitt regional rate-based SMRs are markedly less than U.S. rate-based SMRs reflecting higher rates of deaths for these two causes in the regional areas of the study plants. The UPitt U.S. rate-based SMR for mesothelioma among AN-exposed workers decreased from a statistically significant 2.48 (95% CI = 1.42–4.03) to a non-statistically significant < 2-fold risk (SMR = 1.70, 95% CI = 0.97–2.76). The UPitt U.S. and regional rate-based SMRs for bladder cancer and pneumonitis were nearly identical overall and by AN exposure status.
Table 2 shows a comparison of the NCI and UPitt observed counts, internal rate-based HRs (NCI) and RRs (UPitt), and UPitt U.S. and regional rate-based SMRs by NCI's cumulative AN exposure categories for the four a priori causes of death categories. Despite minor discrepancies in observed deaths for a few AN exposure categories, HRs and RRs were comparable for all causes of death and AN exposure categories. For lung cancer, regional rate-based SMRs were consistently less than U.S. rate-based SMRs, and with the exception of the highest AN exposure category, all represented statistically significant deficits in deaths. NCI's statistically significant 1.43-fold excess for the highest AN exposure category is fundamentally a result of comparing a null SMR of 1.00 to a statistically significant 28% deficit in deaths (SMR = 0.72, 95% CI = 0.64–0.81) for the unexposed baseline category (in fact, this actual ratio = 1.00 / 0.72 = 1.39). The UPitt regional rate-based SMRs also show less evidence of a linear trend with cumulative AN exposure than the NCI HRs (p-trend = 0.09 vs. 0.05, respectively). The UPitt SMRs and RRs and corresponding 95% CIs for lung cancer are graphed in Figure 1.
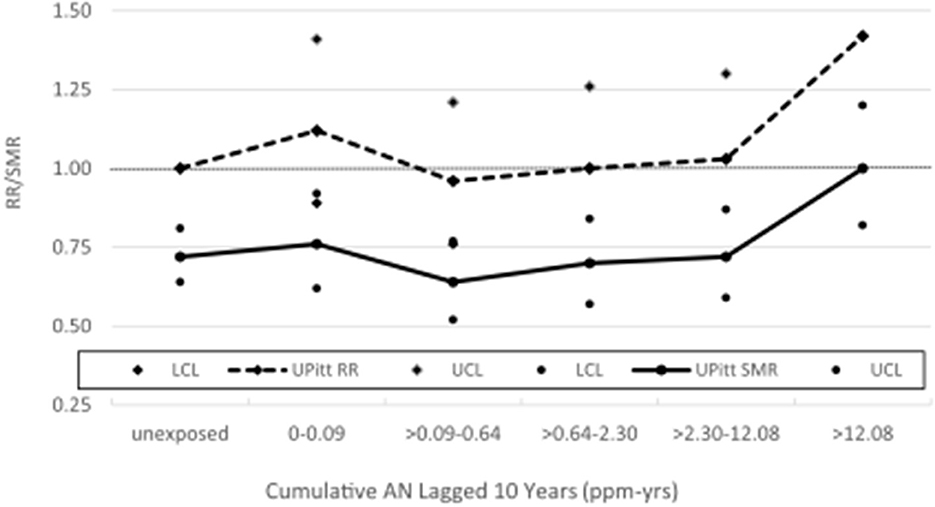
Figure 1. UPitt lung cancer relative risks (RR) and regional rate-based SMRs by cumulative AN exposure.
Regional rate-based SMRs for mesothelioma are less than those based on U.S. rates and show no statistically significant excesses in deaths across the unexposed and exposed AN categories (data suppressed for some categories) with no evidence of a linear trend with exposure (trend p = 0.72). Moreover, the UPitt U.S.-based SMR for mesothelioma in the highest cumulative AN exposure category (>1.33 ppm-years) decreased from a statistically significant to a nonstatistically significant < 2-fold risk based on regional rates (values not shown due to data suppression). U.S. and regional rate-based SMRs were similar for bladder cancer and revealed risk estimates, and AN exposure–response relationship trends were similar to the internal rate analyses. For pneumonitis, Table 2 shows a pattern of findings similar to those noted earlier for lung cancer. That is, the statistically significant 4.73-fold HR for workers in the highest cumulative AN exposure category is fundamentally due to a 6% deficit in deaths (regional SMR = 0.94, 95% CI = 0.47–1.69) being compared to an inordinately large, statistically significant deficit in deaths among the unexposed workers (actual ratio = 3.76; values not shown due to data suppression).
Table 3 shows plant-specific observed numbers of deaths, regional rate-based SMRs, and 95% CIs for lung cancer by AN cumulative exposure quintile. Corresponding internal RRs were discussed but not explicitly reported by Blair et al. (5) and Koutros et al. (21). While not shown here, the U.S. rate-based SMRs were higher than those based on regional rates for all plants except Plant 3, where the regional SMRs were only slightly larger. Among workers in the unexposed baseline category, Table 3 shows deficits in lung cancer deaths, ranging from a statistically significant SMR for Plant 7 to 0.89 (95% CI = 0.61–1.25) for Plant 3. Only unexposed workers in Plant 4 have an SMR slightly larger than expected (SMR = 1.11, 95% CI = 0.70–1.68).
For only one plant did we observe a slight lung cancer excess among the combined AN-exposed workers compared with the unexposed (Plant 4, SMR = 1.11, 95% CI = 0.89–1.37). We observed only one statistically significant excess in lung cancer deaths among the AN exposure categories examined (Plant 4, >12.08 ppm-years, SMR = 1.88, 95% CI = 1.26–2.70) but with no evidence of an exposure–response relationship (trend p = 0.31). With the exception of Plant 7, no plant revealed evidence of an AN exposure–response relationship. Trends in SMRs are difficult to discern in Table 3, due to the small number of observed deaths involved in many of the plant-specific exposure categories (including suppressed data). The statistically significant trend p for Plant 7 was apparently driven by the inordinately large statistically significant deficit of deaths among unexposed workers (value not shown due to data suppression).
Plant 4 sensitivity analysis
Our results in Tables 1, 2 indicate substantial variability in regional background mortality rates for mesothelioma. There are also some pieces of evidence in Table 3 that Plant 4 is responsible for a substantial portion of this variability. That is, Plant 4 was the only plant where AN-unexposed workers had an elevated risk of lung cancer and the only plant with a statistically significant excess in lung cancer deaths among the AN exposure categories examined.
Indirect adjustment for potential confounding at the cohort level
Negative control outcome confounding adjustment
Table 4 shows the results of our application of the Richardson method (28, 29) to indirectly adjust lung cancer RRs from the exposure–response relationship analysis for lung cancer presented in Table 2 for potential confounding by smoking and also shows observed deaths and RRs for lung cancer and COPD categorized into “unexposed” and “exposed” groups and by the NCI categories of the cumulative and average intensity of AN exposure (AIE). The unexposed categories served as the baseline category in the models in Table 4. Table 4 shows that the RRs for COPD for all AN-exposed workers and all but one cumulative AN exposure category were larger than 1.0 (ranging from 1.04 to 1.19), indicating a small degree of positive confounding by smoking, and the RR for the second cumulative AN exposure category was below 1.0 (0.78), indicating a moderate degree of negative confounding by smoking. Using these RRs for COPD to adjust for confounding by smoking, the unadjusted lung cancer RR for all workers exposed to AN and for all but the one cumulative exposure category reduced toward or below the null value. The RR for workers in the highest cumulative AN exposure category reduced from 1.43 to 1.33 and is no longer statistically significant (95% CI = 0.84–2.11); however, the Richardson confidence intervals tend to be conservative. Our adjusted RRs for lung cancer also provide much less evidence of a positive association with cumulative AN exposure (UPitt trend p-value = 0.63 vs. 0.07 for NCI). We note that our cohort-level adjusted RR for this highest exposure category is nearly identical to the smoking status-adjusted RR from NCI's case-cohort study (RR = 1.32, 95% CI = 0.55–3.17). A graph of the unadjusted and adjusted RRs and 95% CIs for lung cancer is shown in Figure 2. For AIE, three of the COPD RRs were below and two were above 1.0, indicating inconsistent evidence of confounding by smoking. The RR for the highest AIE, which showed evidence of positive confounding, reduced from 1.21 to 1.07.
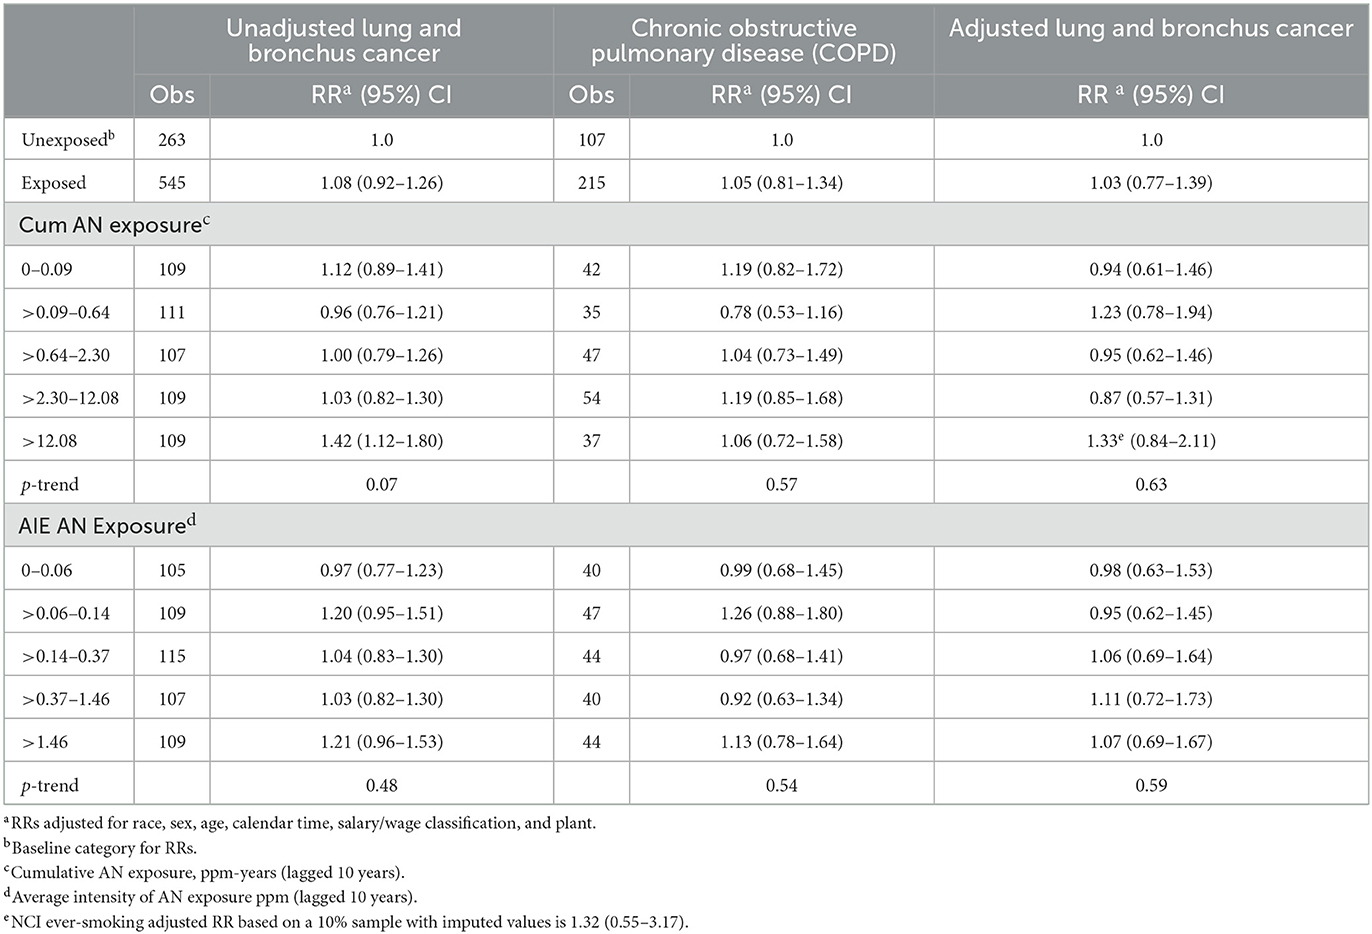
Table 4. UPitt Lung and bronchus cancer relative risks (RR) in relation to AN exposure adjusted for potential confounding by smoking using the Richardson method, full cohort, 1942–2011.
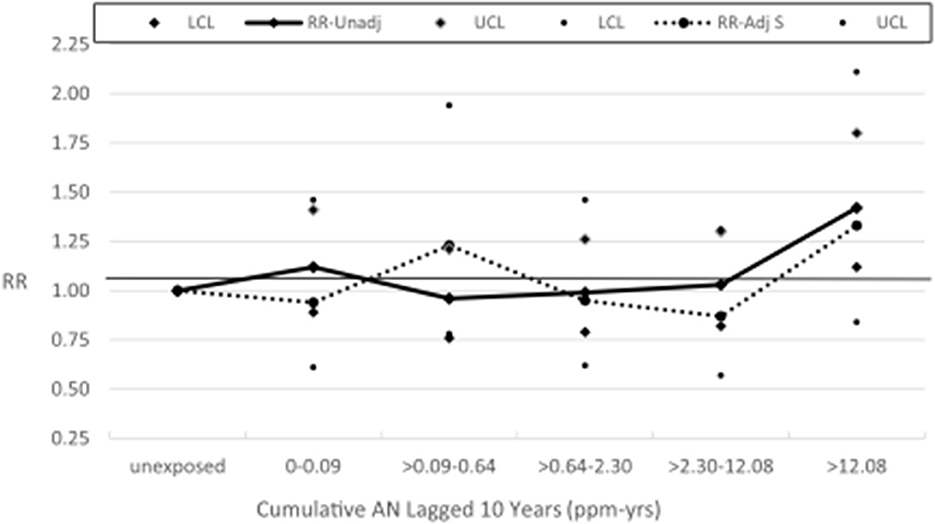
Figure 2. UPitt lung cancer relative risks (RR) by cumulative AN exposure, unadjusted and adjusted for confounding by smoking using the Richardson method.
For lung cancer, we also fitted the two-parameter log-linear-quadratic model used by NCI to the continuous cumulative AN exposure (lagged 10 years) and applied the Richardson method to adjust this model for potential confounding by smoking (sparse data precluded modeling mesothelioma) using the corresponding parameter estimates for COPD. Figure 3, which is similar to Figure 1 in Koutros et al. (21) for the unadjusted model, shows that RRs from the adjusted model fall uniformly below those of the unadjusted model, corroborating our findings from the categorical analysis. Supplemental Table 8A provides details of the unadjusted and adjusted models. It should be noted that the linear and quadratic parameter estimates for lung cancer (and COPD) in both models (and COPD) are very close to 0 (even closer for the adjusted model) and neither is statistically significant, indicating no evidence of a positive AN exposure–response relationship as is evident in Figure 3.
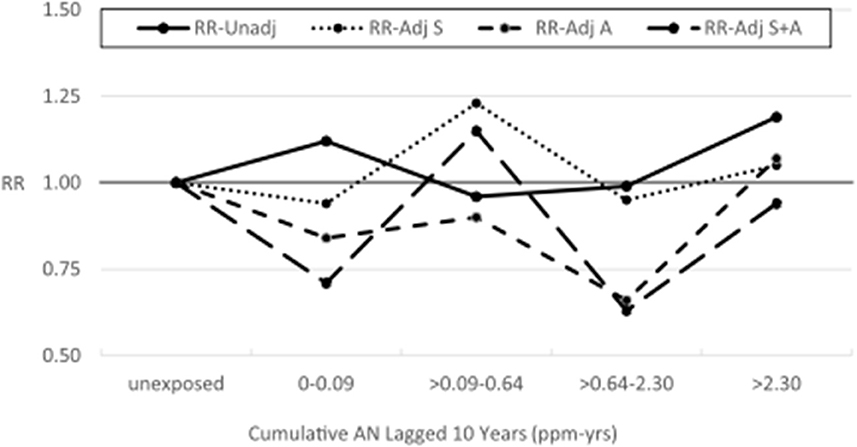
Figure 3. Lung cancer relative risks by cumulative AN exposure, full cohort—unadjusted and adjusted for smoking using the Richardson method (Continuous Data).
Supplemental Tables 2–7 show plant-specific results for Plants 1 and 4–8 in the format of those presented in Table 4 for the combined cohort. Small numbers of lung cancer deaths precluded the analysis of Plants 2 and 3, and due to the small number of observed COPD deaths in some plants analyzed, many cell values were suppressed. In Plants 1, 4, 6, and 7, we observed evidence of positive confounding by smoking via the decreased adjusted RRs for many of the cumulative AN exposure categories examined. In Plant 6, adjustment for confounding led to a statistically significant inverse trend in RRs by cumulative AN exposure. In Plant 7, a statistically significant trend in unadjusted RRs was attenuated and no longer statistically significant based on the adjusted RRs. For AIE, in which we collapsed the five original exposure categories into two categories for Plants 6 and 7 and three for the remaining plants to minimize data suppression. We observed generally consistent evidence of positive confounding by smoking in Plants 4, 6, and 7, resulting in reduced adjusted RRs. Positive confounding was most pronounced in Plants 4 and 7 where adjusted RRs were markedly reduced, and in Plant 7, there was much less evidence of exposure–response relationship (unadjusted trend p = 0.01 vs. adjusted trend p = 0.19).
Table 5 shows the results of our application of the Richardson method to indirectly adjust lung cancer RRs for potential confounding by asbestos exposure. To minimize data suppression, we combined the last two cumulative AN exposure categories (now >2.30 ppm-years) and the last two AN AIE categories (now >0.37 ppm). For all AN-exposed workers and every cumulative AN exposure category, the adjusted RRs for lung cancer were reduced indicating a consistent, moderate level of positive confounding by asbestos exposure. In addition, as with the smoking adjustment, the adjusted RRs show much less evidence of an AN exposure–response relationship. Similarly, for AIE, three of four adjusted RRs were reduced showing less evidence of exposure–response relationship. Table 6 and Figure 4 show the results of adjusting lung cancer RRs for both smoking and for asbestos exposure using the same categories as Table 5. RRs for all but the second exposed category were further reduced with the RR for the highest cumulative AN exposure category now showing a deficit in risk (RR = 0.94, 95% CI = 0.26–3.34).
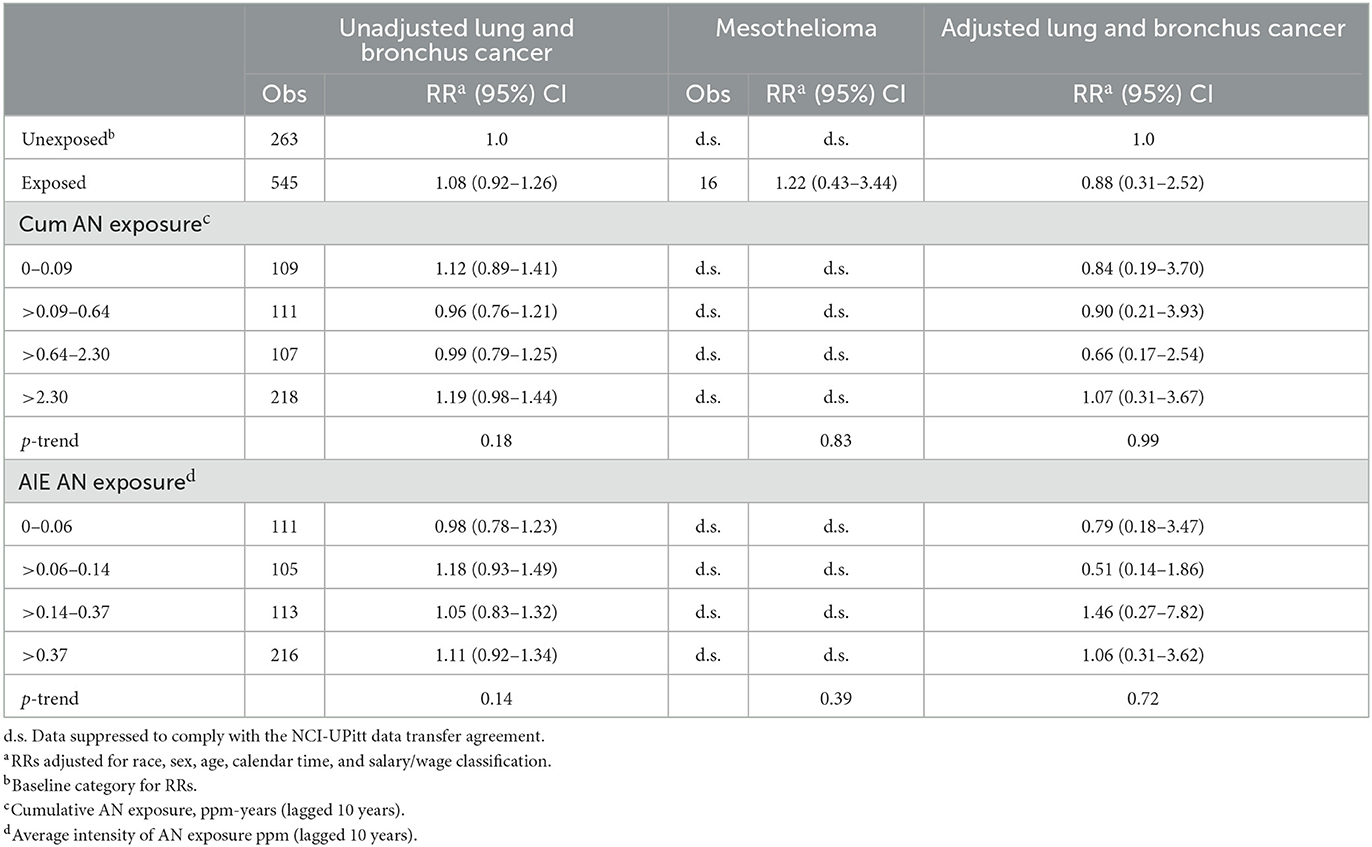
Table 5. UPitt lung and bronchus cancer relative risks (RR) in relation to AN exposure adjusted for potential confounding by asbestos using the Richardson method, full cohort, 1942–2011.
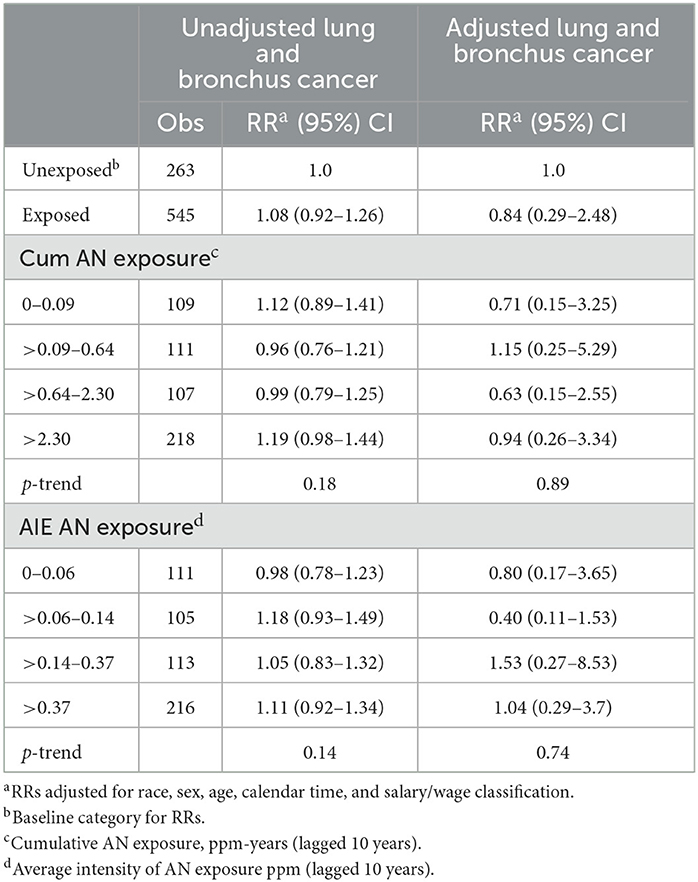
Table 6. UPitt lung and bronchus cancer relative risks (RR) in relation to AN exposure adjusted for potential confounding by smoking and by asbestos using the Richardson method, full cohort, 1942–2011.
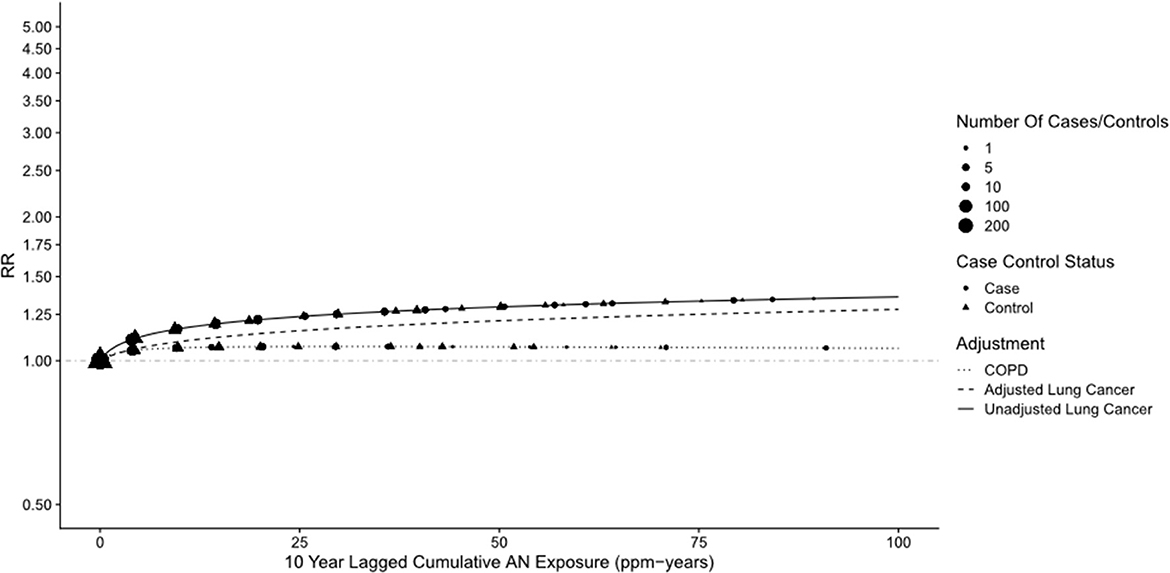
Figure 4. UPitt lung cancer relative risks (RR) by cumulative AN exposure, unadjusted and adjusted for confounding by smoking (S) and asbestos (A) using the Richardson method.
Table 7 shows the results of our application of the Richardson method to indirectly adjust bladder cancer RRs for potential confounding by smoking. For all AN-exposed workers and every NCI AN cumulative exposure category, the RRs for COPD were slightly larger than 1.0 (ranging from 1.01 to 1.07), indicating a small degree of positive confounding by smoking. This resulted in only slight reductions in the bladder cancer RRs and a similar lack of evidence for a positive exposure–response relationship. Similar findings were observed for AIE. Small numbers of observed deaths precluded plant-specific analyses of the data in Tables 5–7. Our application of the Richardson method to adjust pneumonitis RRs for potential confounding by smoking revealed only slight evidence of positive confounding and minor reductions in the RRs by cumulative AN exposure shown in Table 2 (data not shown).
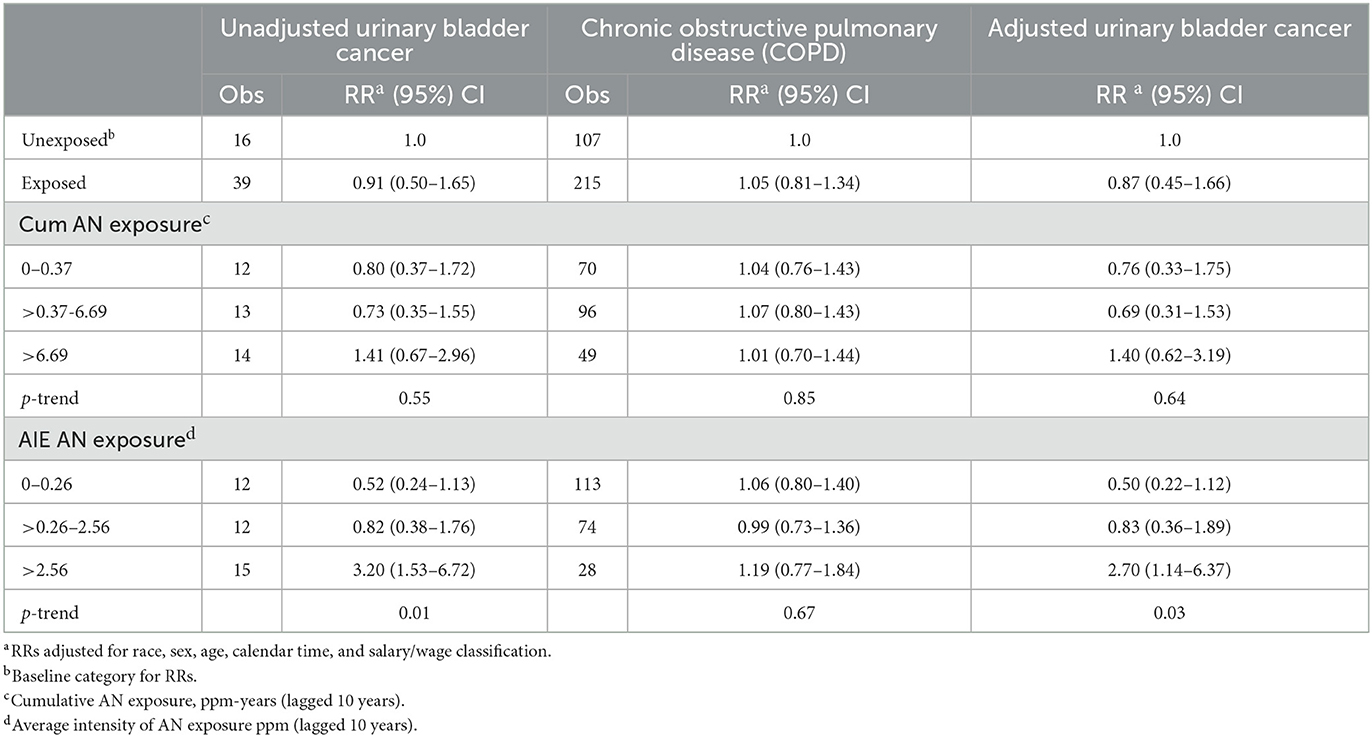
Table 7. UPitt urinary bladder cancer relative risks (RR) in relation to AN exposure adjusted for potential confounding by smoking using the Richardson method, full cohort, 1942–2011.
Plant 4 sensitivity analysis for lung cancer
Supplemental Tables 8B, 9–11 show results similar to Supplementary Tables 4–6, 8A but with Plant 4 omitted. In Supplemental Table 9, the unadjusted RR for lung cancer in the highest cumulative AN category (>12.08 ppm-years) was reduced from a statistically significant 1.42 (95% CI: 1.12–1.80) to a non-statistically significant 1.23 (95% CI: 0.94–1.60), and the trend p-value increased from 0.07 to 0.30. A similar pattern of findings was also observed for the highest category of the average intensity of AN exposure (>1.46 ppm). Similarly, in the log-linear-quadratic model (Supplementary Table 8B), the coefficients are closer to 0 indicating less evidence of an exposure–response relationship with cumulative AN exposure. This attenuated association is also evident in Figure 5 which compares the log-linear quadratic models for the full cohort and full cohort omitting Plant 4. The omission of Plant 4 had a similar effect of reducing lung cancer RRs and evidence of exposure–response relationship in models adjusted for asbestos (Table 5 vs. Supplementary Table 10) and for smoking and asbestos (Table 6 vs. Supplementary Table 11). Figure 6 compares the unadjusted lung cancer RRs to RRs adjusted for both smoking and asbestos for the full cohort omitting Plant 4 (Supplementary Table 11). In analyses adjusted for asbestos with Plant 4 omitted, sparse data required collapsing the two highest cumulative AN exposure categories into one (> 2.30 ppm-years) and precluded the comparison of the corresponding continuous data models.
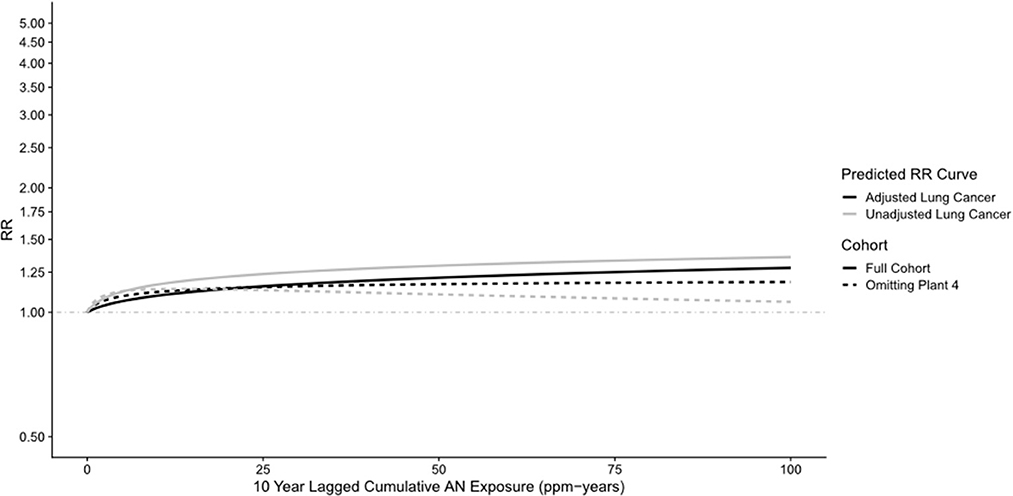
Figure 5. UPitt lung cancer relative risk: full cohort vs. omitting plant 4—unadjusted and adjusted for smoking using the Richardson method (continuous data).
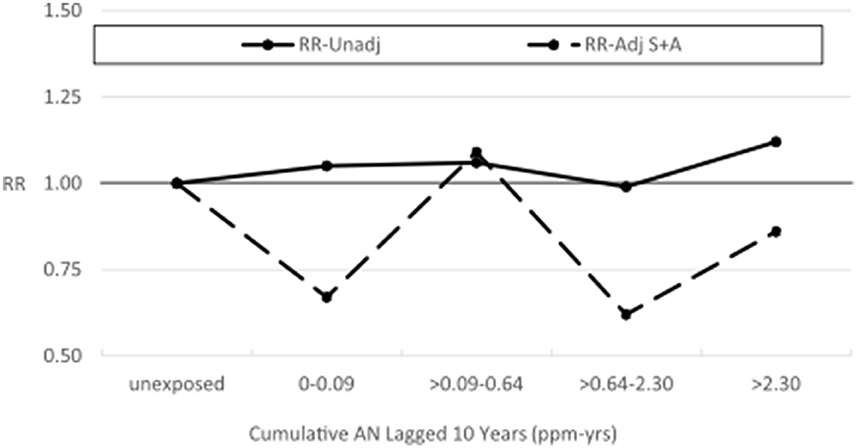
Figure 6. UPitt lung cancer relative risks (RR) by cumulative AN exposure, unadjusted and adjusted for confounding by smoking (S) and by asbestos (A) using the Richardson method, omitting Plant 4.
Bias adjustment factors and Monte Carlo sensitivity analysis
Table 8 shows the results of our cohort-level indirect adjustment of lung and bladder cancer SMRs for potential confounding by smoking. The ever-smoking prevalence among workers from all plants is considerably greater than the corresponding rates in the standard state populations, indicating that unadjusted SMRs were heavily and positively confounded by smoking. This led to lung cancer CRRs that exceeded 2.0 for all but two plants (data not shown due to suppression) and a CRR of 1.61 for bladder cancer. Thus, lung and bladder cancer unadjusted SMRs were reduced to less than null values in all cases and all but one deficit in deaths was statistically significant. Notably, the statistically significant unadjusted lung cancer SMR for Plant 4 (SMR = 1.88, 95% CI = 1.26–2.70) was reduced to a statistically significant 34% deficit in deaths (SMR = 0.66, 95% CI = 0.46–0.95).
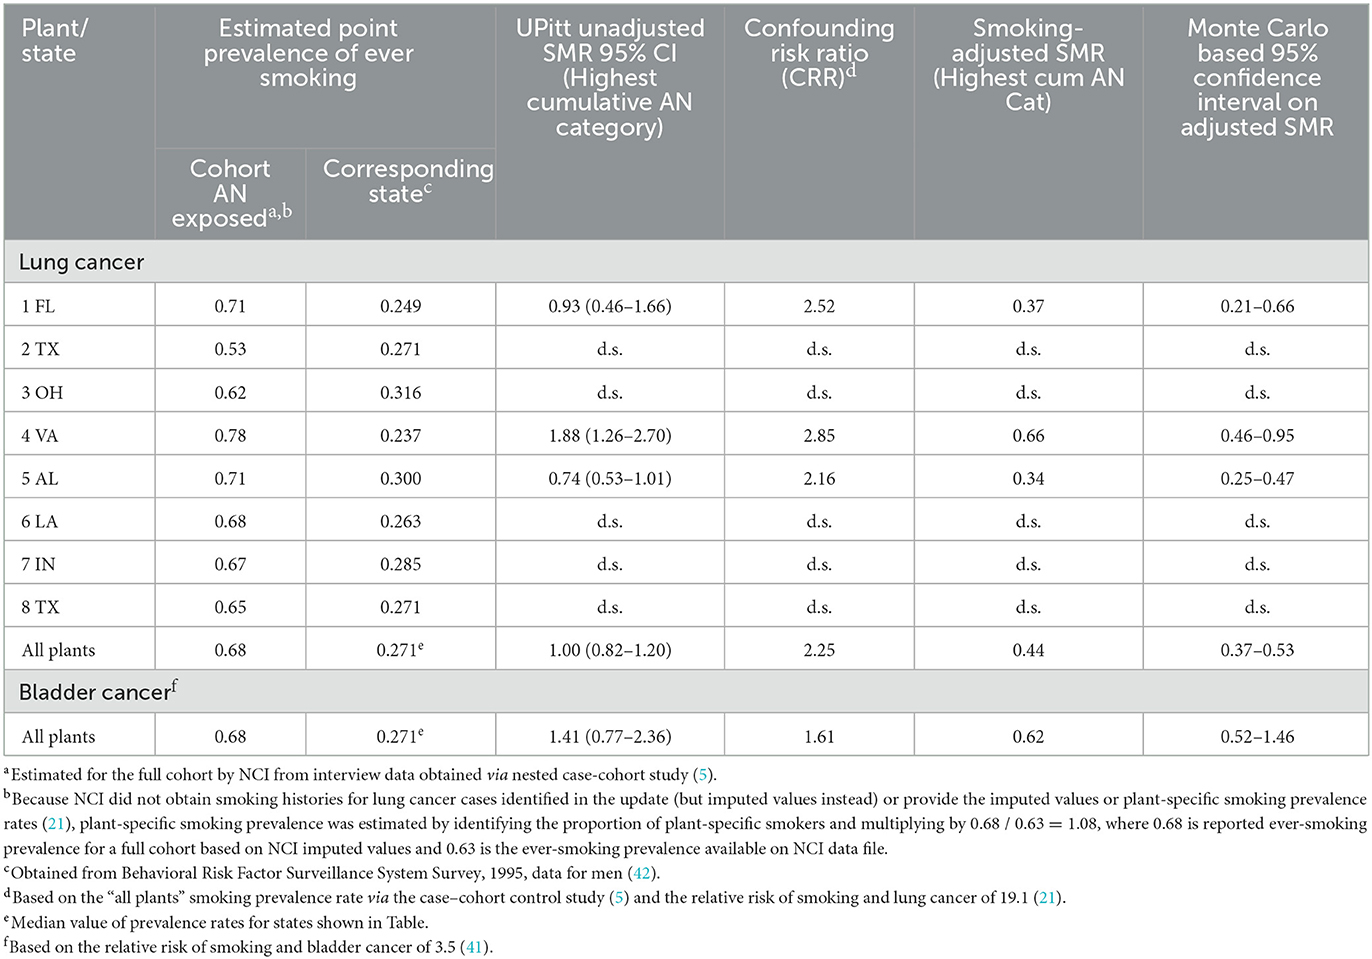
Table 8. Confounding risk ratios (CRR) and smoking-adjusted SMRs for lung and bladder cancer based on estimated cohort smoking prevalence rates, showing unadjusted SMRS by plant and overall, full cohort, 1942–2011.
Discussion
Our evaluation of the relationship between AN exposure and lung cancer mortality using external comparisons based on plant-specific regional mortality rates produced results similar to those that we reported in our reanalysis of the first NCI AN cohort study follow-up (25). We observed statistically significant deficits in lung cancer deaths among unexposed workers in contrast to SMRs at or near the null value among the most highly exposed workers. This indicates that the statistically significant 1.43-fold lung cancer excess among workers in the highest quintile of cumulative AN exposure (lagged 10 years) reported by NCI using internal rate comparisons (HRs) was fundamentally a result of comparing a null value to a statistically significant deficit (21). In this second reanalysis, we observed a similar but more pronounced pattern for pneumonitis mortality in which a statistically significant 4.73-fold excess stemmed from comparing a 6% deficit in deaths among the highest exposure to a large, statistically significant deficit among the unexposed.
As we discussed in our first reanalysis (25), several possible explanations exist for the large differences in lung cancer relative risks in this study population when internal or external comparison rates are used. First, internal comparisons produce more valid results because selection bias stemming from the healthy worker effect can reduce the putative effect of high exposure to acrylonitrile when external comparison rates are used. However, the NCI cohort has now been followed for several decades and much of any healthy worker effect present in the first update has attenuated. In addition, the selection for workers who are healthy at the time of hire is usually more relevant for chronic cardiovascular and non-malignant respiratory diseases than lung cancer, which has a relatively sudden onset, short survival time, and high case-fatality rate (24). Second, external comparisons produce more valid results because the unexposed group has a different underlying lung cancer risk than the exposed group. The inordinately low SMRs for lung cancer among unexposed workers overall are puzzling given that we used regional standard population rates. As regional rates can help adjust for the social, cultural, and economic factors related to diseases such as lung cancer and even help to adjust for geographic variability in tobacco use, it is difficult to postulate what non-occupational factors may have had such a profound influence on the lung cancer mortality experience of the unexposed workers. Supplemental Table 12 compares the distribution of the major demographic factors of unexposed and exposed workers in the NCI cohort. Factors possibly related to AN exposure (e.g., sex, age at hire, year of hire, and wage class) do not differ markedly between unexposed and exposed workers, and our adjustments for these factors in internal relative risk models for lung cancer likely did not lead to any residual confounding.
Third, given the large number of lung cancer deaths and the overall robustness of the NCI study, the chance or under-ascertainment of deaths are unlikely explanations for the low SMRs among unexposed workers. Finally, the possibility remains that some heretofore unknown selection factors for low lung cancer incidence were operating on members of this cohort or that some type of protective effect for lung cancer arose from a particular exposure or combination of exposures encountered at the study plants. Some of these explanations also apply to our findings for pneumonitis although the heterogeneous nature of this cause of death category and their uncertain etiologies further complicate their interpretation. Consequently, the underlying reason for the inordinately low SMRs among unexposed workers remains unknown.
In the NCI study, investigators have attempted to adjust lung cancer risk estimates for confounding by smoking via a nested case-cohort study of lung cancer based on a 10% random sample of the cohort. Blair et al. (5) initially reported an exceedingly low RR for lung cancer among ever smokers compared to never smokers of 3.6 (95% CI = 1.6–8.2), suggesting that smoking status was most likely misclassified among subjects. This observation was confirmed later by Cunningham in 2005 (26). Blair et al.'s finding contrasts starkly with the corresponding HR of 19.1 (95% CI = 5.3–68.9) reported by Koutros et al. (21) in the updated cohort based on imputed smoking data for the new lung cancer cases. While the more recent estimate is in line with well-known relative risks for smoking and lung cancer, it is not clear why this estimate increased so dramatically from the first update and was reported with much less precision, especially considering that 646 new lung cancer cases that were added to the case-cohort study in the recent update. Koutros et al. (21) also limited smoking adjustment to lung cancer HRs among workers in the highest cumulative AN exposure category, thus precluding an evaluation of how smoking adjustment impacted AN exposure–response relationships.
In contrast, our application of the Richardson indirect method enabled adjustment of lung cancer risks for potential confounding by smoking at the cohort level and for workers in all categories of AN exposure. In addition, unlike the NCI study, this method enabled additional adjustment of lung cancer risks for asbestos exposure and smoking adjustment of bladder cancer risks. Consequently, our cohort-level adjustment of lung cancer RRs for confounding by smoking and asbestos yielded for the total cohort, and within the eight study plants (smoking adjustment only), mostly had decreased RRs and much less evidence of a positive association with cumulative AN exposure than reported by NCI.
In the current reanalysis, we recognized markedly lower mesothelioma SMRs based on regional vs. U.S. death rates as well as uniquely higher lung cancer SMRs among unexposed and exposed workers from Plant 4 and noted that the local area includes the Newport News Shipyards where many asbestos-containing materials were used historically. Shipyard work is associated with elevated lung cancer and mesothelioma risks, and some Plant 4 workers (and persons in the local general population) may have been employed for some time in the yards. Despite the elevated lung cancer rates among Plant 4 workers, we observed no mesothelioma deaths among Plant 4 workers (21 mesothelioma deaths occurred in Plants 1, 3, 5, 6, 7, and 8).
While our Richardson lung cancer adjustment for asbestos likely accounted for at least some of any shipyard-related asbestos exposures that may have occurred among Plant 4 workers, residual confounding from asbestos exposures unique to Plant 4 may remain in the cohort. Thus, we repeated key mortality comparisons omitting or isolating workers from Plant 4. This sensitivity analysis of the remaining cohort revealed decreased lung cancer mortality risks and even less evidence of an AN exposure–response relationship, particularly in RR models adjusted for both smoking and asbestos exposure. Thus, while Plant 4 comprised only 13.3% of the total cohort, it had a relatively large impact on the overall findings for lung cancer that were not recognized in the NCI study (5, 21).
As expected from the small relative risk for smoking and bladder cancer, our application of the Richardson method to bladder cancer revealed little evidence of positive confounding by smoking, and a similar lack of a positive relationship with cumulative AN exposure as reported by NCI (21). In an independent cohort study of Plant 3 workers, (14) a statistically significant excess risk for bladder cancer based on four observed deaths was reported. An expanded Plant 3 study to investigate the bladder cancer excess (15) and a further expansion and extended follow-up of the cohort (16) found that the bladder cancer excess decreased to a non-statistically significant level. As noted by Koutros et al., because of high survival rates, bladder cancer risks are best evaluated in studies that include both incidence cases and deaths.
Our cohort-level adjustments for smoking based on internal mortality comparisons were corroborated by our smoking adjustment of regional rate-based SMRs for lung and bladder cancer among workers in the highest cumulative AN exposure category. This analysis revealed considerably higher smoking rates among workers compared with plant-specific standard state populations indicating that unadjusted lung and bladder cancer SMRs in the NCI study were heavily and positively confounded by smoking.
The results of our reanalysis of the 2011 update of the NCI study continue to reflect the lack of clear and consistent evidence of an association between AN exposure and mortality from lung cancer both across earlier studies and within the current NCI study. In the latter case, we observed considerable inconsistencies in results when using external vs. internal mortality comparisons and when considering potential confounding by smoking and/or asbestos and/or the impact of Plant 4. Given that consistent evidence of elevated risks and exposure–response relationships across and within studies are requisites to establish a causal association, the absence of such overall evidence argues against a causal association between AN and lung cancer.
Conclusion
Overall, our reanalysis provided little evidence to support NCI's suggestion of associations between AN exposure and mortality from lung and bladder cancer and pneumonitis. NCI's conclusions were driven by exposure–response relationships stemming from exceedingly low baseline rates, lack of cohort-level adjustment for confounding by smoking and/or asbestos or within the categories of AN exposure reported by the NCI study authors, and no accounting for the potential impact of historical shipyard-related asbestos exposures in the local area of Plant 4.
Data availability statement
The data analyzed in this study is subject to the following licenses/restrictions: The data that support the findings of this study are available from the National Cancer Institute but restrictions apply to the availability of these data, which were used for the current study under a data transfer agreement between the NCI and the UPitt, and so are not publicly available. Requests to access these datasets should be directed to Stella Koutros, S291dHJvc1NAbWFpbC5uaWguZ292.
Ethics statement
The studies involving human participants were reviewed and approved by Institutional Review Board of the University of Pittsburgh. Written informed consent for participation was not required for this study in accordance with the national legislation and the institutional requirements.
Author contributions
GM designed and directed the statistical analysis used in the reanalysis of the NCI acrylonitrile cohort data and played a major role in the preparation of the manuscript. AK conducted and contributed to the design of the statistical analysis and contributed to the preparation of the manuscript. Both authors contributed to the article and approved the submitted version.
Funding
This study was supported by funds from the Acrylonitrile Group (ANG) and conducted under a sponsored research agreement between ANG and UPitt and a data transfer agreement between the NCI and UPitt. The design, analysis, and conclusions of the study are exclusively those of the authors.
Acknowledgments
The authors acknowledge the cooperation and assistance of Dr. Stella Koutros who provided a copy of the NCI cohort data file. We also wish to acknowledge the computer programming support of Charles Alcorn. This article is dedicated to the memory of our friend and esteemed colleague, Dr. James Collins, whose commitment and contributions to acrylonitrile epidemiology research are unsurpassed.
Conflict of interest
The authors declare that the research was conducted in the absence of any commercial or financial relationships that could be construed as a potential conflict of interest.
Publisher's note
All claims expressed in this article are solely those of the authors and do not necessarily represent those of their affiliated organizations, or those of the publisher, the editors and the reviewers. Any product that may be evaluated in this article, or claim that may be made by its manufacturer, is not guaranteed or endorsed by the publisher.
Supplementary material
The Supplementary Material for this article can be found online at: https://www.frontiersin.org/articles/10.3389/fpubh.2023.1122346/full#supplementary-material
Abbreviations
AN, Acrylonitrile; AIE, Average intensity of AN exposure; ANG, Acrylonitrile Group; CNS, Central Nervous System; COPD, Chronic Obstructive Pulmonary Disease; MOIRA, Mortality Information and Research Analytics; NCI, National Cancer Index; HR, Hazard Ratio; ICD, International Classification of Diseases; SMR, Standardized Mortality Ratio; RR, Risk Ratio; Upitt, University of Pittsburgh.
Footnotes
1. ^0.68 is the reported ever-smoking prevalence for full cohort based on NCI imputed values (21) and 0.63 is the ever-smoking prevalence available to us on NCI data file.
References
1. PubChem. Acrylonitrile. Available online at: https://pubchem.ncbi.nlm.nih.gov/compound/7855 (accessed October 15, 2021).
2. Strother DE, Mast RW, Kraska RC, Frankos V. Acrylonitrile as a carcinogen. Ann N Y Acad Sci. (1988) 534:169–78. doi: 10.1111/j.1749-6632.1988.tb30110.x
3. Ghanayem BI, Nyska A, Haseman JK, Bucher JR. Acrylonitrile is a multisite carcinogen in male and female B6C3F1 mice. Toxicol Sci Off J Soc Toxicol. (2002) 68:59–68. doi: 10.1093/toxsci/68.1.59
4. Benn T, Osborne K. Mortality of United Kingdom acrylonitrile workers—an extended and updated study. Scand J Work Environ Health. (1998) 24:17–24.
5. Blair A, Stewart PA, Zaebst DD, Pottern L, Zey JN, Bloom TF, et al. Mortality of industrial workers exposed to acrylonitrile. Scand J Work Environ Health. (1998) 24:25–41.
6. O'Berg MT, Chen JL, Burke CA, Walrath J, Pell S. Epidemiologic study of workers exposed to acrylonitrile: an update. J Occup Med. (1985) 27:835–40. doi: 10.1097/00043764-198511000-00018
7. Theiss AM, Frentzel-Beyme R, Link R, Wild H. Mortality study ofchemical workers in different plants with exposure to acrylonitrile. Zbl Arbeistmed. (1980) 30:259–67.
8. Chen JL, Fayerweather WE, Pell S. Cancer incidence of workers exposed to dimethylformamide and/or acrylonitrile. J Occup Med. (1988) 30:813–8. doi: 10.1097/00043764-198810000-00013
9. Delzell E, Monson RR. Mortality among rubber workers: VI. Men with potential exposure to acrylonitrile J Occup Med. (1982) 24:767–9.
10. Kiesselbach N, Korallus U, Lange HJ, Neiss A, Zwingers T. [Acrylonitrile–epidemiological study–Bayer 1977: a report on a prospective epidemiological study with a past beginning of coworkers at the Leverkusen plant of Bayer AG with acrylonitrile (ACN) exposure]. Zentralbl Arbeitsmed Arbeitsschutz Prophyl. (1979) 29:256–9.
11. Swaen GM, Bloemen LJ, Twisk J, Scheffers T, Slangen JJ, Collins JJ, et al. Mortality update of workers exposed to acrylonitrile in The Netherlands. Scand J Work Environ Health. (1998) 24:10–6.
12. IARC GB. “Acrylonitrile,” In: IARC Monograph Evaluating Carcinogenic Risks in Humans. (1999). p. 43–108.
13. Collins JJ, Page LC, Caporossi JC, Utidjian HM, Lucas LJ. Mortality patterns among employees exposed to acrylonitrile. J Occup Med. (1989) 31:368–71. doi: 10.1097/00043764-198907000-00013
14. Marsh GM, Gula MJ, Youk AO, Schall LC. Mortality among chemical plant workers exposed to acrylonitrile and other substances. Am J Ind Med. (1999) 36:423–36.
15. Marsh GM, Gula MJ, Youk AO, Cassidy LD. Bladder cancer among chemical workers exposed to nitrogen products and other substances. Am J Ind Med. (2002) 42:286–95. doi: 10.1002/ajim.10116
16. Marsh GM, Zimmerman SD. Mortality among chemical plant workers exposed to acrylonitrile: 2011 follow-up. J Occup Environ Med. (2015) 57:134–45. doi: 10.1097/JOM.0000000000000369
17. Swaen GMH, Bloemen LJN, Twisk J, Scheffers T, Slangen JJM, Collins JJ, et al. Mortality update of workers exposed to acrylonitrile in the Netherlands. J Occup Environ Med. (2004) 46:691–8. doi: 10.1097/01.jom.0000128161.17144.27
18. Symons JM, Kreckmann KH, Sakr CJ, Kaplan AM, Leonard RC. Mortality among workers exposed to acrylonitrile in fiber production: an update. J Occup Environ Med. (2008) 50:550–60. doi: 10.1097/JOM.0b013e318162f640
19. Cole P, Mandel JS, Collins JJ. Acrylonitrile and cancer: a review of the epidemiology. Regul Toxicol Pharmacol RTP. (2008) 52:342–51. doi: 10.1016/j.yrtph.2008.09.004
20. Collins JJ, Acquavella JF. Review and meta-analysis of studies of acrylonitrile workers. Scand J Work Environ Health. (1998) 24:71–80.
21. Koutros S, Lubin JH, Graubard BI, Blair A, Stewart PA, Beane Freeman LE, et al. Extended mortality follow-up of a cohort of 25,460 workers exposed to acrylonitrile. Am J Epidemiol. (2019) 188:1484–92. doi: 10.1093/aje/kwz086
22. Pearce N, Checkoway H, Shy C. Time-related factors as potential confounders and effect modifiers in studies based on an occupational cohort. Scand J Work Environ Health. (1986) 12:97–107. doi: 10.5271/sjweh.2161
23. Doll R. Occupational cancer: a hazard for epidemiologists. Int J Epidemiol. (1985) 14:22–31. doi: 10.1093/ije/14.1.22
24. Checkoway H, Pearce N, Kriebel D. Research Methods in Occupational Epidemiology. Oxford: Oxford University Press (2004). p. 388. doi: 10.1093/acprof:oso/9780195092424.001.0001
25. Marsh GM, Youk AO, Collins JJ. Reevaluation of lung cancer risk in the acrylonitrile cohort study of the National Cancer Institute and the National Institute for occupational safety and health. Scand J Work Environ Health. (2001) 27:5–13. doi: 10.5271/sjweh.581
27. Marsh GM, Youk AO, Stone RA, Sefcik S, Alcorn C, OCMAP-PLUS. A program for the comprehensive analysis of occupational cohort data. J Occup Environ Med. (1998) 40:351–62. doi: 10.1097/00043764-199804000-00010
28. Richardson DB. Occupational exposures and lung cancer: adjustment for unmeasured confounding by smoking. Epidemiol Camb Mass. (2010) 21:181–6. doi: 10.1097/EDE.0b013e3181c6f7d9
29. Richardson DB, Laurier D, Schubauer-Berigan MK, Tchetgen ET, Cole SR. Assessment and indirect adjustment for confounding by smoking in cohort studies using relative hazards models. Am J Epidemiol. (2014) 180:933–40. doi: 10.1093/aje/kwu211
30. Sofer T, Richardson DB, Colicino E, Schwartz J, Tchetgen Tchetgen EJ. On negative outcome control of unobserved confounding as a generalization of difference-in-differences. Stat Sci Rev J Inst Math Stat. (2016) 31:348–61. doi: 10.1214/16-STS558
31. Cox DR. Regression models and life-tables. J R Stat Soc Ser B Methodol. (1972) 34:187–202. doi: 10.1111/j.2517-6161.1972.tb00899.x
33. Prentice RL. Relative risk regression analysis of epidemiologic data. Environ Health Perspect. (1985) 63:225–34. doi: 10.1289/ehp.8563225
34. Therneau TM. TL, Original S >R, port R, maintainer, Elizabeth A, Cynthia C. Survival: Survival Analysis (2021). Available online at: https://CRAN.R-project.org/package=survival (accessed October 15, 2021).
35. R Core Team. R: A Language and Environment for Statistical Computing. Vienna, Austria: R Foundation for Statistical Computing (2021).
36. Gail MH, Lubin JH, Rubinstein LV. Likelihood calculations for matched case-control studies and survival studies with tied death times. Biometrika. (1981) 68:703–7. doi: 10.1093/biomet/68.3.703
37. Knol MJ, Vandenbroucke JP, Scott P, Egger M. What do case-control studies estimate? Survey of methods and assumptions in published case-control research. Am J Epidemiol. (2008) 168:1073–81. doi: 10.1093/aje/kwn217
38. Miettinen OS. Components of the crude risk ratio. Am J Epidemiol. (1972) 96:168–72. doi: 10.1093/oxfordjournals.aje.a121443
39. Axelson O, Steenland K. Indirect methods of assessing the effects of tobacco use in occupational studies. Am J Ind Med. (1988) 13:105–18. doi: 10.1002/ajim.4700130107
40. Steenland K, Greenland S. Monte Carlo sensitivity analysis and Bayesian analysis of smoking as an unmeasured confounder in a study of silica and lung cancer. Am J Epidemiol. (2004) 160:384–92. doi: 10.1093/aje/kwh211
41. Stewart SL, Cardinez CJ, Richardson LC, Norman L, Kaufmann R, Pechacek TF, et al. Surveillance for cancers associated with tobacco use—United States, 1999–2004. Morb Mortal Wkly Rep Surveill Summ. (2002) 57:1–33.
42. CDC—BRFSS. 1995 Survey Data and Documentation. (2019). Available online at: https://www.cdc.gov/brfss/annual_data/annual_1995.htm (accessed April 13, 2022).
44. Oman V. Johns-Manville Corp. (2022). Available online at: https://casetext.com/case/oman-v-johns-manville-corp (accessed April 14, 2022).
45. Center for Maritime Safety Health Studies | NIOSH | CDC. (2022). Available online at: https://www.cdc.gov/niosh/programs/cmshs/default.html (accessed April 14, 2022).
46. Tagnon I, Blot WJ, Stroube RB, Day NE, Morris LE, Peace BB, et al. Mesothelioma associated with the shipbuilding industry in coastal Virginia. Cancer Res. (1980) 40:3875–9.
47. Blot WJ, Harrington JM, Toledo A, Hoover R, Heath CW, Fraumeni JF. Lung cancer after employment in shipyards during World War II. N Engl J Med. (1978) 299:620–4. doi: 10.1056/NEJM197809212991202
48. Blot WJ, Morris LE, Stroube R, Tagnon I, Fraumeni JF. Lung and laryngeal cancers in relation to shipyard employment in coastal Virginia. J Natl Cancer Inst. (1980) 65:571–5.
49. Kolonel LN, Yoshizawa CN, Hirohata T, Myers BC. Cancer occurrence in shipyard workers exposed to asbestos in Hawaii. Cancer Res. (1985) 45:3924–8.
Keywords: acrylonitrile, cancer, cohort study, mortality, industrial workers, bladder cancer, lung cancer, mesothelioma
Citation: Marsh GM and Kruchten A (2023) A reevaluation of selected mortality risks in the updated NCI/NIOSH acrylonitrile cohort study. Front. Public Health 11:1122346. doi: 10.3389/fpubh.2023.1122346
Received: 12 December 2022; Accepted: 24 February 2023;
Published: 06 April 2023.
Edited by:
Alberto Modenese, University of Modena and Reggio Emilia, ItalyReviewed by:
Tsuyoshi Nakamura, Nagasaki University, JapanRosalind Brigham Penney, San Juan Basin Public Health, United States
Copyright © 2023 Marsh and Kruchten. This is an open-access article distributed under the terms of the Creative Commons Attribution License (CC BY). The use, distribution or reproduction in other forums is permitted, provided the original author(s) and the copyright owner(s) are credited and that the original publication in this journal is cited, in accordance with accepted academic practice. No use, distribution or reproduction is permitted which does not comply with these terms.
*Correspondence: Gary M. Marsh, Z21hcnNoQHBpdHQuZWR1