 Lisa T. Crummett*
 Muhammad H. Aslam
- Life Sciences, Soka University of America, Aliso Viejo, CA, United States
Introduction: Type 2 diabetes (T2D) is a growing public health burden throughout the world. Many people looking for information on how to prevent T2D will search on diabetes websites. Multiple dietary factors have a significant association with T2D risk, such as high intake of added sugars, refined carbohydrates, saturated fat, and red meat or processed meat; and decreased intake of dietary fiber, and fruits/vegetables. Despite this dietary information being available in the scientific literature, it is unclear whether this information is available in gray literature (websites).
Objective: In this study, we evaluate the use of specific terms from diabetes websites that are significantly associated with causes/risk factors and preventions for T2D from three term categories: (A) dietary factors, (B) nondietary nongenetic (lifestyle-associated) factors, and (C) genetic (non-modifiable) factors. We also evaluate the effect of website type (business, government, nonprofit) on term usage among websites.
Methods: We used web scraping and coding tools to quantify the use of specific terms from 73 diabetes websites. To determine the effect of term category and website type on the usage of specific terms among 73 websites, a repeated measures general linear model was performed.
Results: We found that dietary risk factors that are significantly associated with T2D (e.g., sugar, processed carbohydrates, dietary fat, fruits/vegetables, fiber, processed meat/red meat) were mentioned in significantly fewer websites than either nondietary nongenetic factors (e.g., obesity, physical activity, dyslipidemia, blood pressure) or genetic factors (age, family history, ethnicity). Among websites that provided “eat healthy” guidance, one third provided zero dietary factors associated with type 2 diabetes, and only 30% provided more than two specific dietary factors associates with type 2 diabetes. We also observed that mean percent usage of all terms associated with T2D causes/risk factors and preventions was significantly lower among government websites compared to business websites and nonprofit websites.
Conclusion: Diabetes websites need to increase their usage of dietary factors when discussing causes/risk factors and preventions for T2D; as dietary factors are modifiable and strongly associated with all nondietary nongenetic risk factors, in addition to T2D risk.
Introduction
Type 2 diabetes (T2D) is a chronic disease characterized by excessive levels of glucose in the blood resulting from the cells’ inability to respond to insulin, termed insulin resistance, and an inability of pancreatic beta cells to produce adequate levels of insulin. The International Diabetes Federation (IDF) has stated that the increasing global prevalence of T2D presents a large social, financial, and health system burden across the world (1). The global prevalence of T2D in 20–79 year old adults was estimated at 10.5% in 2022 and it is projected to increase to 12.2% by 2045 (2). A staggering 38% of the adult population in the United States (US) has prediabetes (insulin resistance) and 11.3% have T2D (3). “Adult-onset diabetes” was a commonly used term for T2D because it only affected adults; but that is no longer true. In 2021, there were approximately 41,600 new cases of T2D diagnosed in children, worldwide (4). Considering that only the proximate cause of death appears on death certificates, diabetes-associated deaths may be significantly underestimated (5).
Understanding what factors promote the development of insulin resistance and T2D is imperative in curbing the soaring T2D pandemic. Genetic risk factors for T2D include family history (6), advanced age (2), and non-white ethnicity (7). However, ethnic groups that show a relatively high prevalence of T2D in the US, show a much lower T2D prevalence in their country of origin (7); showing that environmental factors play a critical role in T2D risk. Further, in order to explain the rapid increase in T2D prevalence over the last three decades (8, 9), and reduce the predicted growth of T2D prevalence in the future (2, 8), we need to look beyond genetic (non-modifiable) risk factors for T2D, and focus on dietary and lifestyle-associated risk factors that are modifiable.
A review of 86 meta-analyzes that analyzed risk factors for T2D reported “convincing evidence” for the association between T2D risk and the following modifiable risk factors: low whole grain consumption, metabolically healthy obesity, increased sedentary time, low adherence to a healthy dietary pattern, high level of serum uric acid, which has been associated with high fructose/sugar intake (10–12), low level of serum vitamin D, and decreased conscientiousness (13). A meta-analysis of cohort studies that specifically examined lifestyle-related risk factors for T2D reported the following high-risk factors: obesity, (especially central obesity), metabolic syndrome components (hypertension, dyslipidemia), lack of physical activity, high consumption of sugar-sweetened beverages, processed red meat, refined grains, and alcohol; and low consumption of fruits, vegetables, fiber, and whole grains (14). It is important to note that these dietary risk factors were still significantly associated with T2D after controlling for body mass index (BMI) (14).
Given that dietary factors may be the most amenable to modification to prevent the development of T2D, some recent meta-analyzes of T2D risk factors have focused solely on dietary factors. One study reported significant associations with T2D risk and higher intake of cereal fiber, unsaturated fatty acids, magnesium, and polyphenols; and reduced glycemic load, intake of added sugars, and intake of high-sugar beverages (15). Another study reported a significant negative association with T2D risk and intake of foods associated with a Mediterranean diet, including: whole grains, low-fat dairy products, yogurt, olive oil, chocolate, fiber, magnesium, and flavonoids (16). The same study reported a significant positive association with T2D risk and high glycemic index/load diets, high consumption of red and processed meat, sugar, and artificial sugar-sweetened beverages (16).
To understand how to prevent the development of T2D, many people are likely to search diabetes websites, via a Google search, rather than searching scientific journal articles. Based on searching a limited number of diabetes websites, we found limited information on nongenetic (lifestyle-associated) causes/risk factors or preventions for T2D, aside from obesity and lack of physical activity. The observed lack of information on diabetes websites, regarding nongenetic T2D causes/risk factors and preventions, may be anecdotal, or it may point to a real lack of information in the gray literature. To answer this important public health question, we used web scraping and computer code to extract and quantify terms associated with T2D causes/risk factors and preventions from 73 diabetes websites. We quantified the use of terms for T2D causes/risk factors and preventions that were categorized as (A) dietary factors (B) nondietary nongenetic (lifestyle-associated) factors, and (C) genetic (non-modifiable) factors. We determined if term category (dietary, nondietary nongenetic, genetic) or website type (business, government, nonprofit) had a significant effect on the percentage of sites providing specific terms.
Materials and methods
Website selection
In November 2022, we performed a “Google Advanced Search” to search for diabetes websites to analyze. We used the following advanced search criteria, which resulted in 436,000 websites in the search engine results (Figure 1): All these words: “type 2 diabetes”; this exact word or phrase: “causes” OR “risk” OR “prevention”; none of these words: “pubmed, “doi:,” “download pdf,” “youtube,” “amazon,” “advertisement”; Language: English; Region: anywhere; Last update: past year; site or domain: NA; terms appearing: In the text of the page; file type: any format; usage rights: not filtered by license. The “none of these words” criteria effectively excluded websites associated with academic journals, books, videos, and advertisements. The first 80 websites in the search engine results were selected for analysis (Figure 1). Other studies in which website data from a keyword search were analyzed, selected the first 50–60 websites that appeared in the search engine results (17–20). Eighty websites were reduced to 73 websites after excluding some sites due to one of the following reasons: (1) website was funded by the same organization/company as that of another included website, or (2) one had to click on several links to access relevant information (the information was external to the website), or (3) the site was outside the US and was only accessible within the source country (Figure 1).
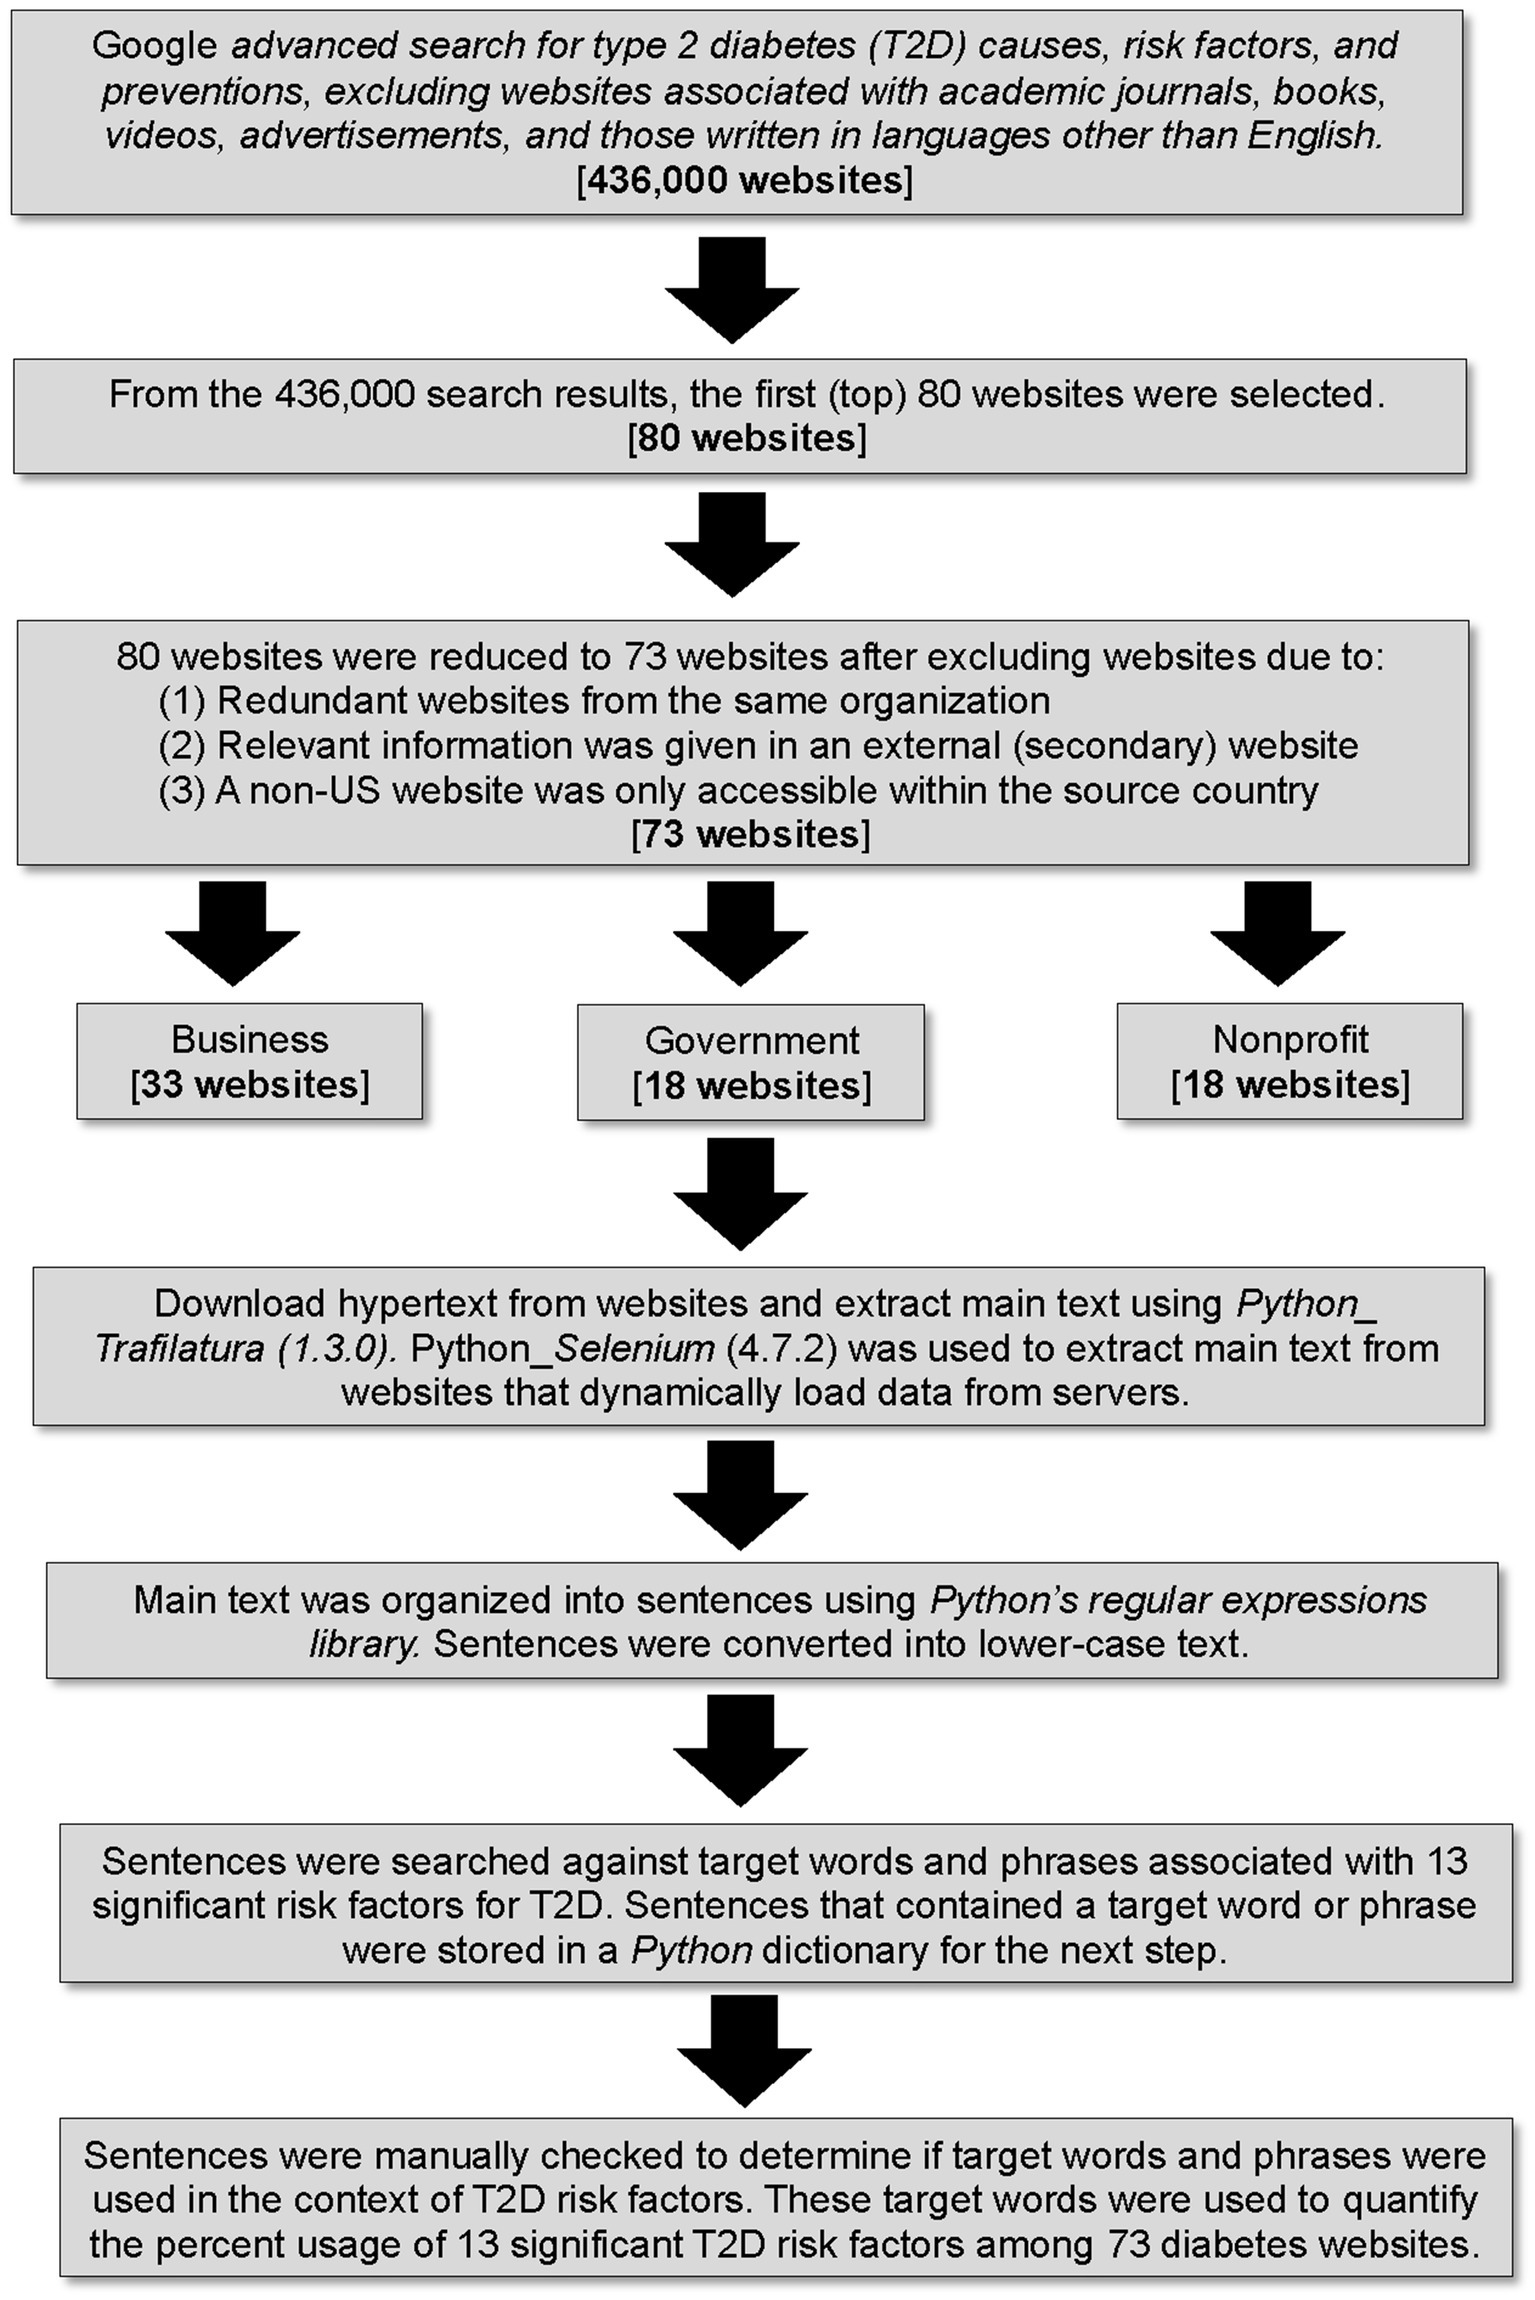
Figure 1. Flow diagram illustrating methodology for website selection, categorization, web scraping, sentence filtering, and quantification of terms. Software package versions are indicated in parentheses.
Categorization of websites
The 73 websites that were included in the analysis were categorized as business, government, or nonprofit (Supplementary Table S1; Figure 1). Websites owned by for-profit companies were assigned to the business category (n = 33) and most had.com domains (Supplementary Table S1). Websites owned by county, state, or federal government were assigned to the government category (n = 18) and most had.gov domains (Supplementary Table S1). Websites owned by tax-exempt organizations, either nonprofit or not-for-profit (their income is not distributed to members or officers of the organization), were assigned to a single “nonprofit” category (n = 22) (Supplementary Table S1). All nonprofit websites had a.org domain, except for one website, which had a.edu domain (Supplementary Table S1). For each of the 73 websites, the site type, source country, and SEMrush score (measurement of a website’s popularity) were recorded (Supplementary Table S1). Sixty websites were from the US, nine were from Non-US countries, and four were international (Supplementary Table S1).
Selection of target words and phrases
We selected target words and phrases to quantify from websites that were associated with statistically significant risk factors for T2D (6, 7, 13–16) and we categorized them into three term categories: (A) dietary factors, (B) nondietary nongenetic (lifestyle-associated) factors, and (C) genetic (non-modifiable) factors (Table 1). Dietary words and phrases were further categorized into the following six subcategories: (1) sugar, (2) refined carbohydrates, (3) fiber, (4) fruits or vegetables, (5) dietary fat, and (6) red meat or processed meat (Table 1). Nondietary nongenetic (lifestyle-associated) words and phrases were further categorized into the following four subcategories: obesity, physical activity, blood pressure, dyslipidemia (Table 1). Genetic (non-modifiable) words and phrases were further categorized into three subcategories: age, family history, and ethnicity. All target words and phrases were present in at least three of the 73 websites (Table 1).
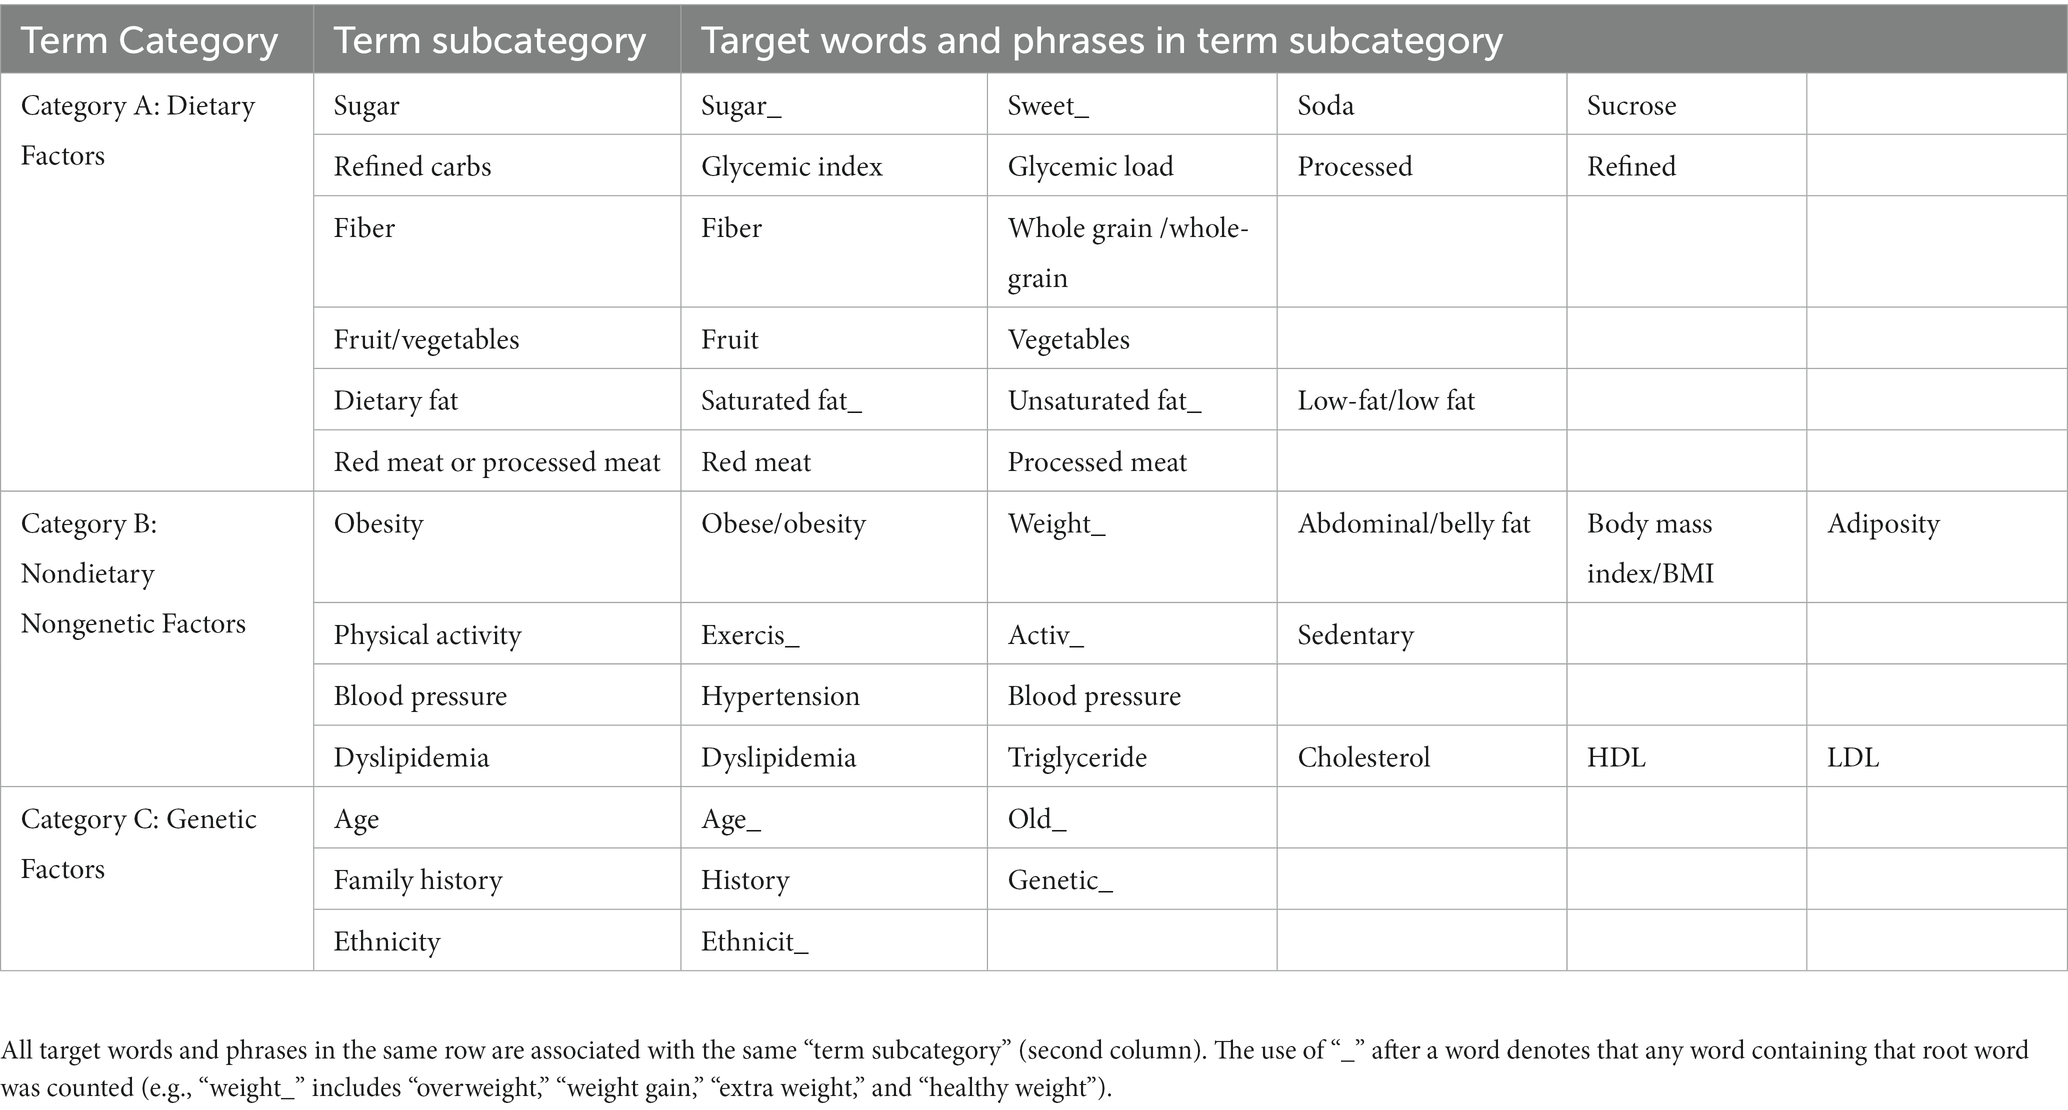
Table 1. Target words and phrases that were quantified from 73 diabetes websites and their categorization for statistical analyzes.
Web scraping, sentence filtering, and quantification of terms
We downloaded the hypertext from each of the 73 websites and then used a Python package, Trafilatura (version 1.3.0) (21), to extract the main text of each website. We used Python’s web-automating library, Selenium (version 4.7.2) (22), to extract the complete main text from websites that dynamically load data from servers. The main text was organized into sentences using Python’s built-in regular expressions library. Sentences were converted to lower-case text before searching for target words and phrases. Each sentence was searched against target words and phrases (Table 1). Sentences containing a target word or phrase were stored in a Python dictionary. Each sentence in the Python dictionary was manually checked to determine if a target word or phrase was being used in the context of causes/risk factors or preventions for T2D. For example, the sentence “Avoid sugary drinks,” was recorded as providing a “sugar” term. However, the sentence “Patients with type 2 diabetes have high blood sugar levels,” would be deleted from the Python dictionary, because sugar was not used in a dietary context as a cause/risk factor or prevention for T2D. A flow diagram of the above methodology is provided (Figure 1).
All the sentences that passed the manual filtering step were used to quantify per-website count of target words and phrases (Table 1); and those counts were used to determine subcategory and category usage (Table 1) among 73 websites (Table 1). The computer code that we wrote for website text extraction and quantification of target words and phrases is available on GitHub: https://github.com/MHannanAslam/Quantification-of-T2DM-risk-factors-from-websites (23).
Statistical analysis
We quantified the presence/absence (1/0) of at least one target word or phrase associated with each of the 13 subcategory terms (Table 1), per website. The presence/absence values were used to calculate the percentage of websites that used at least one target word or phrase associated with each of the 13 subcategory terms (Table 1). We took this approach because some subcategory terms, such as “sugar,” have more synonymous words and phrases associated with them than other subcategory terms, and therefore, if we had quantified the total number of target words and phrases used per subcategory term, per website, it would have yielded inflated counts for subcategory terms that have a lot of synonyms.
To determine the effect of term category (dietary, nondietary nongenetic, genetic) and website type (business, government, nonprofit) on the usage of words and phrases associated with 13 subcategory terms (Table 1), among 73 websites (Supplementary Table S1), a repeated measures general linear model was performed in SPSS Statistics (version 28.0.1.1). In our model, the 13 subcategory terms (sugar, refined carbohydrates, fiber, fruit/vegetables, dietary fat, red meat/processed meat, obesity, physical activity, blood pressure, dyslipidemia, age, family history, ethnicity) were the subjects; the percentage of websites that provided at least one word or phrase associated with a given subcategory term (Table 1) was the response variable (repeated measure); the term category (dietary, nondietary nongenetic, genetic) was the between subjects factor; and website type (business, government, nonprofit) was the within subjects variable. A Bonferroni correction was applied to multiple pairwise comparisons of website types and term category types. Statistical significance was set to p < 0.05.
Results
Term category vs. percent usage of specific terms
Among the 73 websites analyzed that discussed T2D causes/risk factors and preventions, term category (dietary, nondietary nongenetic, genetic) had a significant main effect on the usage of specific terms (p = 0.016; Figure 2). Mean percent usage of dietary terms (26.3% ± 8.9% SE) was significantly lower (p = 0.016) than mean percent usage of nondietary nongenetic terms (75.7% ± 10.9% SE) and nonsignificantly lower (p = 0.292) than mean percent usage of genetic terms (54.4% ± 12.6% SE) (Figure 2). The mean percent usage of nondietary nongenetic terms (75.7% ± 10.9% SE) was not significantly different (p = 0.685) than the mean percent usage of genetic terms (54.4% ± 12.6% SE) (Figure 2).
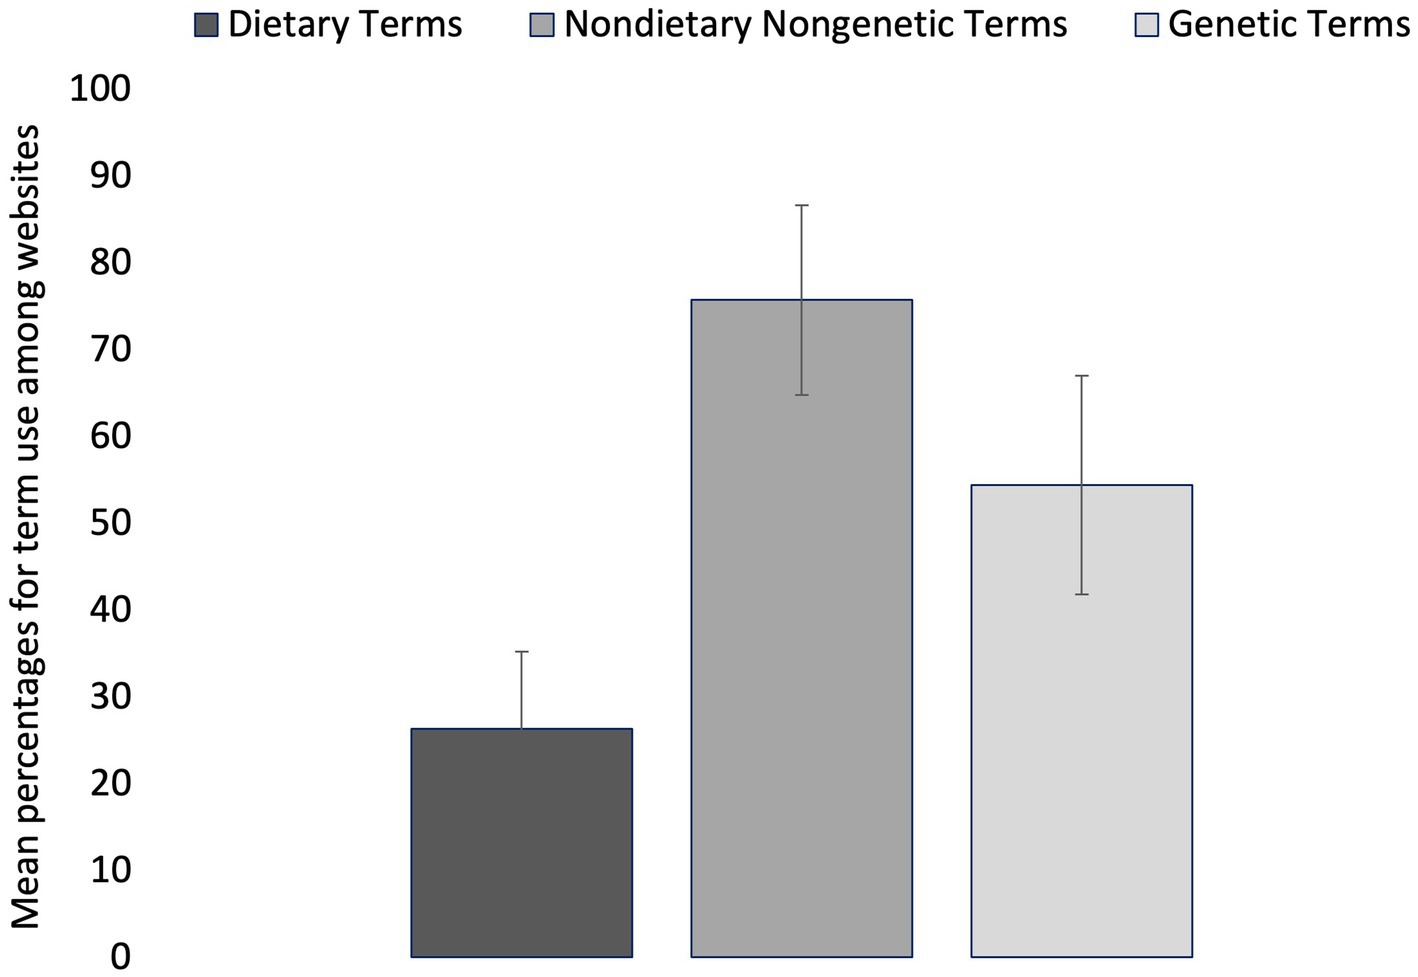
Figure 2. Mean percentages for term use among 73 diabetes websites. Terms are grouped into three categories: dietary, nondietary nongenetic (lifestyle-associated), and genetic (non-modifiable). Error bars represent mean standard error for the term percentages within each category.
When examining the use of specific terms among websites as causes/risk factors and preventions for T2D, obesity and physical activity were discussed in nearly all of the websites (98.6% for each term); age and family history were discussed in most websites (69.8 and 74.0% respectively); blood pressure and dyslipidemia were discussed in approximately half of the websites (56.2 and 49.3% respectively); and each of the six dietary terms were discussed in less than 40% of websites, with sugar being the most mentioned (39.7%) of the dietary terms and processed meat/red meat being the least mentioned (8.2%) (Figure 3).
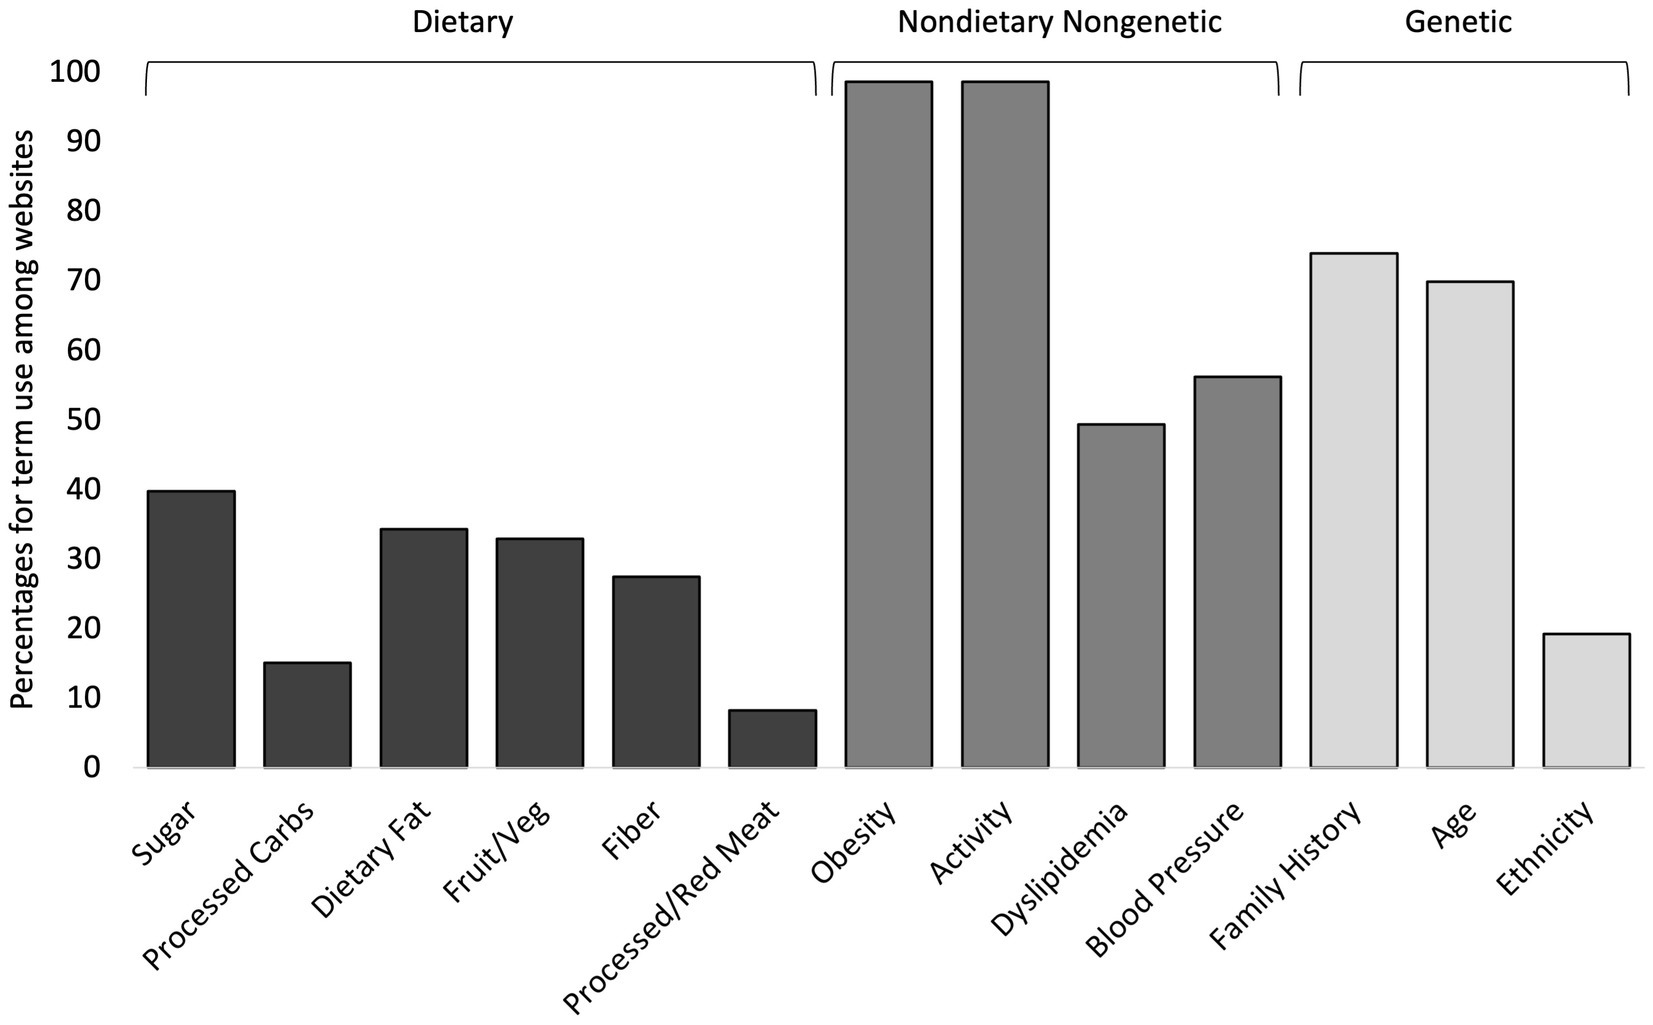
Figure 3. Percentages for term use among 73 diabetes websites for 13 subcategory terms. The three term categories used in statistical analyzes are shown above the brackets at the top of the figure.
Website type vs. percent usage of specific terms
Website type (business, government, nonprofit) had a significant main effect on the usage of specific terms (p < 0.001; Figure 4) for causes/risk factors and preventions for T2D. The mean percent usage of terms (all categories) was significantly lower among government websites (37.2% ± 9.1% SE) compared to business websites (51.5% ± 8.6% SE; p = 0.009) and compared to nonprofit websites (50.3% ± 6.8% SE; p = 0.007) (Figure 4). There was no significant difference (p = 1.000) in mean percent term usage between business websites (51.5% ± 8.6% SE) and nonprofit websites (50.3% ± 6.8% SE) (Figure 4). The interaction between term category x website type was not significant (p = 0.133) in its effect on percent term usage; meaning that the effect of term category on percent term usage was not significantly different among different website types (Figure 5).
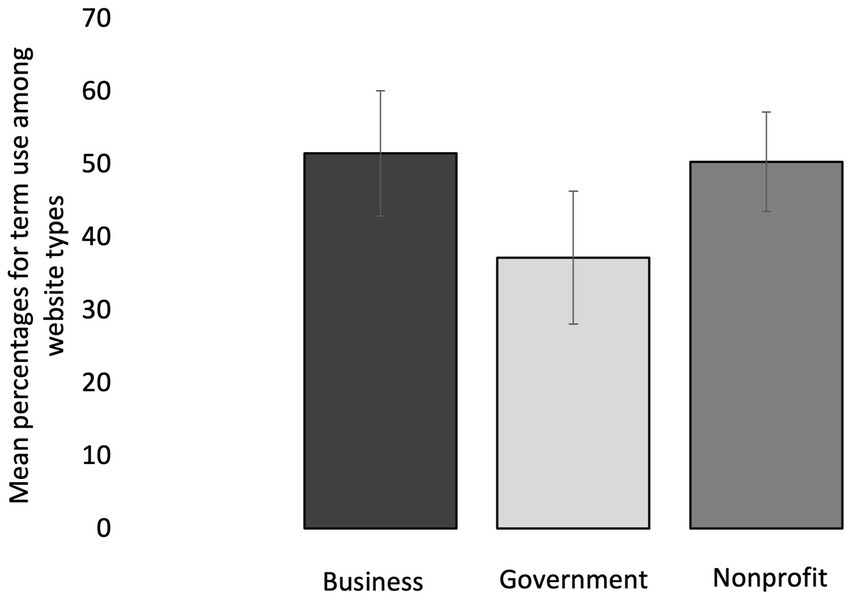
Figure 4. Mean percentages for term use (all term categories included) among 73 diabetes websites that are grouped into three type categories: business, government, and nonprofit. Error bars represent mean standard error for the term percentages within each website category.
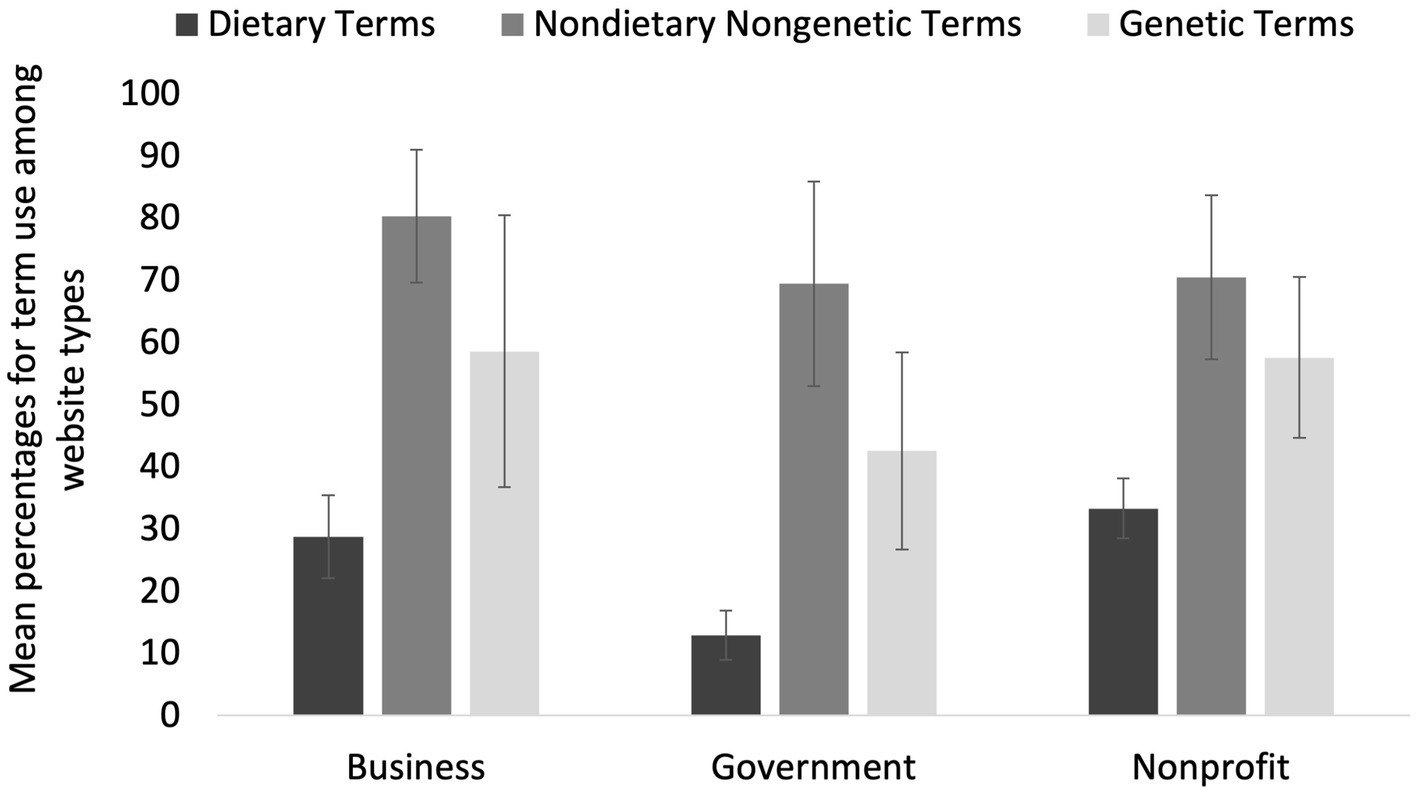
Figure 5. Mean percentages for term use among 73 websites, where terms are grouped into three subcategories: dietary, nondietary nongenetic (lifestyle-associated), and genetic (non-modifiable) and websites are grouped into three type categories: business, government, and nonprofit. Error bars represent mean standard error for the term percentages within each category.
“Healthy diet” used without mention of dietary terms
We observed the use of nonspecific dietary guidance in some websites, including “healthy diet” (27 websites), “healthy eating” (19 websites), “eat healthy” (12 websites), and “balanced diet” (4 websites), but in many cases, no specific dietary terms (sugar, processed carbs, fiber, etc.) that are associated with significant causes/risk factors and preventions for T2D were provided in addition to the nonspecific dietary guidance. Among the 47 websites that provided some form of nonspecific dietary guidance, 32% did not provide any dietary terms associated with significant causes/risk factors and preventions for T2D, 19% provided only one dietary term, and 19% provided only two specific dietary terms (Figure 6). Thus, only 30% of the websites providing “eat healthy” advice for causes/risk factors and preventions for T2D, also provided more than two specific dietary terms with the advice (Figure 6).

Figure 6. Of the 47 diabetes websites that provide “healthy diet advice,” this is the percentage of websites that provide a given number of dietary terms. The total number of dietary terms quantified from diabetes websites was six.
Discussion
Significance of findings
To our knowledge, a systematic review of causes/risk factors and preventions for T2D in the gray literature (websites) has not been performed until now. There is a great need for this type of review because of the growing prevalence of T2D around the world and the need for accurate information about T2D prevention to be accessible to everyone. An unexpected finding was that government websites, comprised of mostly state and federal government agencies (88%), provided significantly fewer causes/risk factors and preventions for T2D, from all categories, than either business websites or nonprofit websites. This suggests that government agencies need to invest more effort into ensuring that the health information provided in their diabetes websites is up-to-date, informative, and effective in disease prevention. We were also surprised to find that many of the websites that provide “eat healthy” guidance in association with causes/risk factors and preventions for T2D, provided little to no specific dietary guidance, such as: limit intake of added sugars (13–16), increase intake of polyunsaturated fats (16, 24, 25), increase intake of high-fiber foods (14–16, 26, 27). Without such dietary guidance, phrases like “eat healthy” are not useful in educating the public on how to prevent T2D. Since we only examined websites written in English, our findings cannot be extrapolated to diabetes websites written in other languages and we encourage others to conduct similar studies of diabetes websites written in non-English languages. Overall, our findings demonstrate a paucity of information on diabetes websites regarding dietary causes/risk factors, and preventions for T2D. This lack of dietary information is problematic for several reasons, which we will discuss below.
Why exclusion of dietary risk factors and preventions for T2D is problematic
All four of the nondietary nongenetic (lifestyle-associated) risk factors for T2D (obesity, physical activity, dyslipidemia, and high blood pressure) are significantly associated with dietary factors, which may be their ultimate cause. An example of a strong association between a dietary risk factor and multiple nondietary nongenetic (lifestyle-associated) risk factors, is found with sugar. In addition to promoting insulin resistance (28–30), high sugar and/or fructose intake has been shown to promote dyslipidemia and increase fat storage (31–33), increase visceral adiposity (28, 33, 34), and cause leptin resistance (33, 35, 36), which is associated with (1) an increased drive to consume excessive amounts of energy (37) and (2) a reduction in energy expenditure (associated with lethargy) (32, 38). Further, many studies have shown that high sugar intake, particularly the fructose component of sugar, promotes hypertension (39–42), via stimulation of the sympathetic nervous system. This illustrates how a dietary risk factor for T2D is strongly associated with all the nondietary nongenetic risk factors: obesity, physical activity, dyslipidemia, and blood pressure; and thus, should be included.
When discussing obesity in association with T2D, it is important to point out that certain dietary factors promote an increase in different types of body fat, and not all body fat is associated with T2D. Subcutaneous fat is not a significant predictor of T2D whereas visceral fat (aka central or abdominal fat) is the strongest predictor of insulin resistance and T2D incidence (43–47). There are significant dietary associations with visceral fat. Overfeeding normal individuals with saturated fat resulted in a two-fold higher increase in visceral fat (the dangerous fat), compared to overfeeding with polyunsaturated fats (48). Studies also show that replacing saturated fat with polyunsaturated fats significantly improves insulin sensitivity (24, 25). Excess fructose intake has been shown to significantly increase visceral fat, but not subcutaneous fat, and significantly decreases insulin sensitivity (28). Alternately, excess glucose intake significantly increases subcutaneous fat, but not visceral fat, and does not affect insulin sensitivity (28). Similarly, when sugar (fructose + glucose) was replaced with starch (glucose) in children with obesity and metabolic syndrome, their glucose tolerance significantly improved in just nine days, along with their blood pressure, triglycerides, and insulin levels (30). Thus, information regarding specific dietary modifications, particularly reduced intake of added sugars and replacement of saturated fats with polyunsaturated fats, is important for reducing visceral adiposity and associated T2D risk.
Among lifestyle factors that can be modified to prevent the development of T2D, modification of dietary factors, alone, may be just as effective at reducing T2D risk as increasing physical activity, alone. A recent meta-analysis of randomized controlled trials and observational studies examining dietary factors and T2D risk, reported that dietary interventions, with or without physical activity, significantly decreased T2D risk in both high risk populations and the general population (16). People with T2D who changed their diet to a paleolithic diet over 12 weeks, showed significant improvement in glycemic control and insulin sensitivity; and the improvement was not significantly different than participants who underwent an exercise intervention + dietary intervention (49). Other intervention studies reported similar findings, in that diet + exercise intervention did not show greater improvement of glycemic control and insulin sensitivity than diet intervention alone (50, 51). For all the reasons that we have discussed, diabetes websites should make a concerted effort to include significant dietary factors when discussing T2D causes/risk factors and preventions to better educate the public on how to prevent the development of T2D.
Data availability statement
The raw data supporting the conclusions of this article will be made available by the authors, without undue reservation.
Author contributions
LC conceptualized the study and designed the methodology, performed data curation, statistical analysis, and interpretation of the data, and prepared the first draft. MA wrote computer code for data extraction and performed data curation. MA and LC revised subsequent drafts and read and approved the final manuscript. All authors contributed to the article and approved the submitted version.
Conflict of interest
The authors declare that the research was conducted in the absence of any commercial or financial relationships that could be construed as a potential conflict of interest.
Publisher’s note
All claims expressed in this article are solely those of the authors and do not necessarily represent those of their affiliated organizations, or those of the publisher, the editors and the reviewers. Any product that may be evaluated in this article, or claim that may be made by its manufacturer, is not guaranteed or endorsed by the publisher.
Supplementary material
The Supplementary material for this article can be found online at: https://www.frontiersin.org/articles/10.3389/fpubh.2023.1159024/full#supplementary-material
References
1. Cho, NH, Shaw, J, Karuranga, S, Huang, Y, da Rocha, FJ, Ohlrogge, A, et al. IDF diabetes atlas: global estimates of diabetes prevalence for 2017 and projections for 2045. Diabetes Res Clin Pract. (2018) 138:271–81. doi: 10.1016/j.diabres.2018.02.023
2. Sun, H, Saeedi, P, Karuranga, S, Pinkepank, M, Ogurtsova, K, Duncan, BB, et al. IDF diabetes atlas: global, regional and country-level diabetes prevalence estimates for 2021 and projections for 2045. Diabetes Res Clin Pract. (2022) 183:109119. doi: 10.1016/j.diabres.2021.109119
4. Wu, H, Patterson, CC, Zhang, X, Ghani, RBA, Magliano, DJ, Boyko, EJ, et al. Worldwide estimates of incidence of type 2 diabetes in children and adolescents in 2021. Diabetes Res Clin Pract. (2022) 185:109785. doi: 10.1016/j.diabres.2022.109785
5. Stokes, A, and Preston, SH. Deaths attributable to diabetes in the United States: comparison of data sources and estimation approaches. PLoS One. (2017) 12:e0170219. doi: 10.1371/journal.pone.0170219
6. Arslanian, SA, Bacha, F, Saad, R, and Gungor, N. Family history of type 2 diabetes is associated with decreased insulin sensitivity and an impaired balance between insulin sensitivity and insulin secretion in white youth. Diabetes Care. (2005) 28:115–9. doi: 10.2337/diacare.28.1.115
7. Abate, N, and Chandalia, M. The impact of ethnicity on type 2 diabetes. J Diabetes Complicat. (2003) 17:39–58. doi: 10.1016/S1056-8727(02)00190-3
8. Khan, MAB, Hashim, MJ, King, JK, Govender, RD, Mustafa, H, and Al, KJ. Epidemiology of type 2 diabetes–global burden of disease and forecasted trends. J Epidemiol Glob Health. (2020) 10:107–11. doi: 10.2991/jegh.k.191028.001
9. Chen, L, Magliano, DJ, and Zimmet, PZ. The worldwide epidemiology of type 2 diabetes mellitus—present and future perspectives. Nat Rev Endocrinol. (2012) 8:228–36. doi: 10.1038/nrendo.2011.183
10. Johnson, RJ, Nakagawa, T, Sanchez-Lozada, LG, Shafiu, M, Sundaram, S, Le, M, et al. Sugar, uric acid, and the etiology of diabetes and obesity. Diabetes. (2013) 62:3307–15. doi: 10.2337/db12-1814
11. Lanaspa, MA, Sanchez-Lozada, LG, Choi, YJ, Cicerchi, C, Kanbay, M, Roncal-Jimenez, CA, et al. Uric acid induces hepatic steatosis by generation of mitochondrial oxidative stress: potential role in fructose-dependent and -independent fatty liver. J Biol Chem. (2012) 287:40732–44. doi: 10.1074/jbc.M112.399899
12. Mayes, PA. Intermediary metabolism of fructose. Am J Clin Nutr. (1993) 58:754S–65S. doi: 10.1093/ajcn/58.5.754S
13. Bellou, V, Belbasis, L, Tzoulaki, I, and Evangelou, E. Risk factors for type 2 diabetes mellitus: an exposure-wide umbrella review of meta-analyses. PLoS One. (2018) 13:e0194127. doi: 10.1371/journal.pone.0194127
14. Kyrou, I, Tsigos, C, Mavrogianni, C, Cardon, G, Van Stappen, V, Latomme, J, et al. Sociodemographic and lifestyle-related risk factors for identifying vulnerable groups for type 2 diabetes: a narrative review with emphasis on data from Europe. BMC Endocr Disord. (2020) 20:1–13. doi: 10.1186/s12902-019-0463-3
15. Palacios, OM, Kramer, M, and Maki, KC. Diet and prevention of type 2 diabetes mellitus: beyond weight loss and exercise. Expert Rev Endocrinol Metab. (2019) 14:1–12. doi: 10.1080/17446651.2019.1554430
16. Toi, PL, Anothaisintawee, T, Chaikledkaew, U, Briones, JR, Reutrakul, S, and Thakkinstian, A. Preventive role of diet interventions and dietary factors in type 2 diabetes mellitus: an umbrella review. Nutrients. (2020) 12:2722. doi: 10.3390/nu12092722
17. Read, J. Schizophrenia, drug companies and the internet. Soc Sci Med. (2008) 66:99–109. doi: 10.1016/j.socscimed.2007.07.027
18. Mitchell, J, and Read, J. Attention-deficit hyperactivity disorder, drug companies and the internet. Clin Child Psychol Psychiatry. (2012) 17:121–39. doi: 10.1177/1359104510396432
19. Mansell, P, and Read, J. Posttraumatic stress disorder, drug companies, and the internet. J Trauma Dissociation. (2009) 10:9–23. doi: 10.1080/15299730802488494
20. Wattignar, SD, and Read, J. The pharmaceutical industry and the internet: are drug company funded depression websites biased? J Ment Health. (2009) 18:476–85. doi: 10.3109/09638230902968183
21. Barbaresi, A, Trafilatura: a web scraping library and command-line tool for text discovery and extraction. Proceedings of the 59th Annual Meeting of the Association for Computational Linguistics and the 11th International Joint Conference on Natural Language Processing: System Demonstrations. (2021).
22. Revathi, K, and Janani, VS. Selenium test automation framework in on-line based application. Int. J. Adv. Eng. (2015) 4:55–63.
23. Aslam, MH. Quantification of T2DM risk factors from websites [computer code]. GitHub2023. Available at: https://github.com/MHannanAslam/Quantification-of-T2DM-risk-factors-from-websites
24. Summers, L, Fielding, B, Bradshaw, H, Ilic, V, Beysen, C, Clark, M, et al. Substituting dietary saturated fat with polyunsaturated fat changes abdominal fat distribution and improves insulin sensitivity. Diabetologia. (2002) 45:369–77. doi: 10.1007/s00125-001-0768-3
25. Imamura, F, Micha, R, Wu, JH, de Oliveira Otto, MC, Otite, FO, Abioye, AI, et al. Effects of saturated fat, polyunsaturated fat, monounsaturated fat, and carbohydrate on glucose-insulin homeostasis: a systematic review and meta-analysis of randomised controlled feeding trials. PLoS Med. (2016) 13:e1002087. doi: 10.1371/journal.pmed.1002087
26. Gross, LS, Li, L, Ford, ES, and Liu, S. Increased consumption of refined carbohydrates and the epidemic of type 2 diabetes in the United States: an ecologic assessment. Am J Clin Nutr. (2004) 79:774–9. doi: 10.1093/ajcn/79.5.774
27. Schulze, MB, Liu, S, Rimm, EB, Manson, JE, Willett, WC, and Hu, FB. Glycemic index, glycemic load, and dietary fiber intake and incidence of type 2 diabetes in younger and middle-aged women. Am J Clin Nutr. (2004) 80:348–56. doi: 10.1093/ajcn/80.2.348
28. Stanhope, KL, Schwarz, JM, Keim, NL, Griffen, SC, Bremer, AA, Graham, JL, et al. Consuming fructose-sweetened, not glucose-sweetened, beverages increases visceral adiposity and lipids and decreases insulin sensitivity in overweight/obese humans. J Clin Invest. (2009) 119:1322–34. doi: 10.1172/JCI37385
29. Basciano, H, Federico, L, and Adeli, K. Fructose, insulin resistance, and metabolic dyslipidemia. Nutr Metab (Lond). (2005) 2:5. doi: 10.1186/1743-7075-2-5
30. Lustig, RH, Mulligan, K, Noworolski, SM, Tai, VW, Wen, MJ, Erkin-Cakmak, A, et al. Isocaloric fructose restriction and metabolic improvement in children with obesity and metabolic syndrome. Obesity. (2016) 24:453–60. doi: 10.1002/oby.21371
31. Lê, K-A, Ith, M, Kreis, R, Faeh, D, Bortolotti, M, Tran, C, et al. Fructose overconsumption causes dyslipidemia and ectopic lipid deposition in healthy subjects with and without a family history of type 2 diabetes. Am J Clin Nutr. (2009) 89:1760–5. doi: 10.3945/ajcn.2008.27336
32. Lustig, RH. Childhood obesity: behavioral aberration or biochemical drive? Reinterpreting the first law of thermodynamics. Nat Clin Pract Endocrinol Metab. (2006) 2:447–58. doi: 10.1038/ncpendmet0220
33. Bursać, BN, Vasiljević, AD, Nestorović, NM, Veličković, NA, Milutinović, DDV, Matić, GM, et al. High-fructose diet leads to visceral adiposity and hypothalamic leptin resistance in male rats—do glucocorticoids play a role? J Nutr Biochem. (2014) 25:446–55. doi: 10.1016/j.jnutbio.2013.12.005
34. Pollock, NK, Bundy, V, Kanto, W, Davis, CL, Bernard, PJ, Zhu, H, et al. Greater fructose consumption is associated with cardiometabolic risk markers and visceral adiposity in adolescents. J Nutr. (2012) 142:251–7. doi: 10.3945/jn.111.150219
35. Shapiro, A, Tümer, N, Gao, Y, Cheng, K-Y, and Scarpace, PJ. Prevention and reversal of diet-induced leptin resistance with a sugar-free diet despite high fat content. Br J Nutr. (2011) 106:390–7. doi: 10.1017/S000711451100033X
36. Harris, RB, and Apolzan, JW. Changes in glucose tolerance and leptin responsiveness of rats offered a choice of lard, sucrose, and chow. Am J Phys Regul Integr Comp Phys. (2012) 302:R1327–39. doi: 10.1152/ajpregu.00477.2011
37. La Fleur, S, Van Rozen, A, Luijendijk, M, Groeneweg, F, and Adan, R. A free-choice high-fat high-sugar diet induces changes in arcuate neuropeptide expression that support hyperphagia. Int J Obes. (2010) 34:537–46. doi: 10.1038/ijo.2009.257
38. Jequier, E. Leptin signaling, adiposity, and energy balance. Ann N Y Acad Sci. (2002) 967:379–88. doi: 10.1111/j.1749-6632.2002.tb04293.x
39. Jayalath, VH, de Souza, RJ, Ha, V, Mirrahimi, A, Blanco-Mejia, S, Di Buono, M, et al. Sugar-sweetened beverage consumption and incident hypertension: a systematic review and meta-analysis of prospective cohorts. Am J Clin Nutr. (2015) 102:914–21. doi: 10.3945/ajcn.115.107243
40. Sayon-Orea, C, Martinez-Gonzalez, MA, Gea, A, Alonso, A, Pimenta, AM, and Bes-Rastrollo, M. Baseline consumption and changes in sugar-sweetened beverage consumption and the incidence of hypertension: the SUN project. Clin Nutr. (2015) 34:1133–40. doi: 10.1016/j.clnu.2014.11.010
41. DiNicolantonio, JJ, and Lucan, SC. The wrong white crystals: not salt but sugar as aetiological in hypertension and cardiometabolic disease. Open Heart. (2014) 1:e000167. doi: 10.1136/openhrt-2014-000167
42. Reaven, GM, and Ho, H. Sugar-induced hypertension in Sprague-Dawley rats. Am J Hypertens. (1991) 4:610–4. doi: 10.1093/ajh/4.7.610
43. Boyko, EJ, Fujimoto, WY, Leonetti, DL, and Newell-Morris, L. Visceral adiposity and risk of type 2 diabetes: a prospective study among Japanese Americans. Diabetes Care. (2000) 23:465–71. doi: 10.2337/diacare.23.4.465
44. Wander, PL, Boyko, EJ, Leonetti, DL, McNeely, MJ, Kahn, SE, and Fujimoto, WY. Change in visceral adiposity independently predicts a greater risk of developing type 2 diabetes over 10 years in Japanese Americans. Diabetes Care. (2013) 36:289–93. doi: 10.2337/dc12-0198
45. Nordström, A, Hadrévi, J, Olsson, T, Franks, PW, and Nordström, P. Higher prevalence of type 2 diabetes in men than in women is associated with differences in visceral fat mass. J Clin Endocrinol Metabol. (2016) 101:3740–6. doi: 10.1210/jc.2016-1915
46. Lebovitz, HE, and Banerji, MA. Point: visceral adiposity is causally related to insulin resistance. Diabetes Care. (2005) 28:2322–5. doi: 10.2337/diacare.28.9.2322
47. Bray, GA, Jablonski, KA, Fujimoto, WY, Barrett-Connor, E, Haffner, S, Hanson, RL, et al. Relation of central adiposity and body mass index to the development of diabetes in the diabetes prevention program. Am J Clin Nutr. (2008) 87:1212–8. doi: 10.1093/ajcn/87.5.1212
48. Rosqvist, F, Iggman, D, Kullberg, J, Cedernaes, J, Johansson, H-E, Larsson, A, et al. Overfeeding polyunsaturated and saturated fat causes distinct effects on liver and visceral fat accumulation in humans. Diabetes. (2014) 63:2356–68. doi: 10.2337/db13-1622
49. Otten, J, Stomby, A, Waling, M, Isaksson, A, Tellström, A, Lundin-Olsson, L, et al. Benefits of a Paleolithic diet with and without supervised exercise on fat mass, insulin sensitivity, and glycemic control: a randomized controlled trial in individuals with type 2 diabetes. Diabetes Metab Res Rev. (2017) 33:e2828. doi: 10.1002/dmrr.2828
50. Wycherley, TP, Noakes, M, Clifton, PM, Cleanthous, X, Keogh, JB, and Brinkworth, GD. A high-protein diet with resistance exercise training improves weight loss and body composition in overweight and obese patients with type 2 diabetes. Diabetes Care. (2010) 33:969–76. doi: 10.2337/dc09-1974
Keywords: diabetes, risk factors, causes, prevention, websites, diet, nutrition
Citation: Crummett LT and Aslam MH (2023) Diabetes websites lack information on dietary causes, risk factors, and preventions for type 2 diabetes. Front. Public Health. 11:1159024. doi: 10.3389/fpubh.2023.1159024
Edited by:
Maria Inês Schmidt, Federal University of Rio Grande do Sul, BrazilReviewed by:
Rodrigo Citton P. dos Reis, Federal University of Rio Grande do Sul, BrazilPaula Bracco, Federal University of Rio Grande do Sul, Brazil
Copyright © 2023 Crummett and Aslam. This is an open-access article distributed under the terms of the Creative Commons Attribution License (CC BY). The use, distribution or reproduction in other forums is permitted, provided the original author(s) and the copyright owner(s) are credited and that the original publication in this journal is cited, in accordance with accepted academic practice. No use, distribution or reproduction is permitted which does not comply with these terms.
*Correspondence: Lisa T. Crummett, bGNydW1tZXR0QHNva2EuZWR1