 Aini Chen1†
 Ke Wei
 Yi Tao
 Feng Lv
- 1School of Medical, Chongqing Medical University, Chongqing, China
- 2Department of Anesthesiology, The First Affiliated Hospital of Chongqing Medical University, Chongqing, China
- 3Department of Phase I Clinical Trial Ward, The First Affiliated Hospital of Chongqing Medical University, Chongqing, China
Objective: Currently, a multitude of studies are underway to investigate the factors affecting the degree of frailty, with a significant focus on the critical role of body mass index (BMI). This study aims to conduct a cross-sectional survey to investigate the multifaceted relationship between multiple body habitus and the factors that influence the degree of frailty.
Methods: A questionnaire survey was conducted among 840 adult residents in Chongqing communities. A total of 723 participants were included in the data analysis, with an effective response rate of 92.0%. Fried’s frailty scale was used to classify individuals into fit, pre-frail, or frail. Non-parametric tests and chi-square tests were employed to evaluate the inter-group differences in frailty levels under different influencing factors. Multivariate logistic regression analysis was performed to select the independent variables associated with frailty statistics. According to the results of the parallel line test, ordered or disordered multivariate logistic regression was used to evaluate the impact of a single independent variable on frailty for different variables.
Results: Adult community residents in Chongqing accounted for 29.18 and 5.67% in pre-frailty and frailty, respectively. In multivariate logistic regression analysis, high BMI, and high waist-hip ratio (WHR) were identified as major risk factors for frailty. Furthermore, the process of aging, coupled with moderate to heavy alcohol consumption, active weight loss behavior in the past year, and the presence of comorbidities, emerged as significant contributors to frailty. Conversely, factors such as a positive inclination toward taste, consistent meal timing, habitual breakfast consumption, sound nutritional intake, and the cultivation of healthy dietary practices were recognized as pivotal elements that act as protective factors against frailty.
Conclusion: The integration of both BMI and WHR provides a more comprehensive perspective, effectively capturing the intertwined influence of obesity and sarcopenia on the extent of frailty. To mitigate the risk of community-wide frailty, a multipronged approach is essential, involving the promotion of favorable dietary practices and achieving nutritional equilibrium, diligent management of coexisting medical conditions, moderation in alcohol consumption, and the enhancement of physical functionality.
1. Introduction
Frailty is a multifaceted clinical condition that arises with age, characterized by a decline in physiological capabilities across various organ systems, rendering individuals more susceptible to stressors (1). The significance of frailty as a predictor of mortality risk among older adults dwelling in the community has been underscored through an in-depth research (2). A comprehensive meta-analysis encompassing 21 studies conducted in high-income countries revealed that the prevalence of frailty among community-dwelling older adults ranged from 4.0 to 59.1%, with an average prevalence of 10.7% (3). In China, the total prevalence rates of pre-frailty and frailty in community-dwelling older adults are 43 and 10%, respectively (4). Clinical manifestations of frailty include weight loss, muscle atrophy and weakness, diminished endurance, compromised balance and mobility, reduced gait speed, and cognitive impairment (5). Given these considerations, it is imperative to embark on research and interventions targeted at addressing frailty.
Beyond the realm of older adults, certain studies have unveiled the occurrence of frailty across other age groups as well (6, 7). Factors affecting frailty are generally considered to be related to BMI (8), as well as risk factors such as aging, smoking, alcohol consumption, comorbidities, malnutrition, diabetes, cognitive impairment, and history of falls (9). Frailty can be mitigated through engagement in physical activities, exercise regimens, dietary modifications, and modulation of gut microbiota (10–13).
Previous research (14) has shown that sarcopenia (the decline in function accompanied by low muscle mass) is the primary cause of frailty, accounting for 70% of frailty cases. The Asian Working Group for Sarcopenia (AWGS) 2014 consensus has defined sarcopenia as “age-related loss of muscle mass, plus low muscle strength, and/or low physical performance” (15), the European Society for Clinical Nutrition and Metabolism (ESPEN) in association with the European Association for the Study of Obesity (EASO) considers BMI as a screening tool for sarcopenia, highlighting that excessive adiposity in conjunction with diminished skeletal muscle mass or correlated body compartments substantiates the diagnosis of sarcopenia (16). Since sarcopenia is a prominent manifestation and risk factor for frailty, BMI is frequently adopted in studies to prognosticate the extent of frailty. Low BMI has been correlated with an elevated frailty risk (17), while conversely, an elevated BMI might augment the likelihood of frailty (18). Nevertheless, relying solely on BMI might not yield a comprehensive understanding of the degree of frailty. Hence, the incorporation of additional indicators of body habitus, such as waist-hip ratio, body fat percentage, body roundness index, body shape index, etc. Become crucial for defining individual physical characteristics, including physique, general bearing, and body shape (19). These indicators facilitate a more accurate and comprehensive characterization of frail patients. Furthermore, scant exploration has been devoted to the factors that influence body habitus, such as dietary habits and nutritional status. Therefore, this study aimed to explore the relationship between body habitus (BMI and the degree of frailty), potential associations between lifestyle, nutrition, dietary habits, and the degree of frailty [as indicated by waist-hip ratio (WHR), body fat percentage (BFP), body roundness index (BRI), and body shape index (ABSI)] based on a community sample.
2. Materials and methods
2.1. Ethical considerations
This study followed the guidelines for human research in the 2013 revised Declaration of Helsinki. The research protocol was approved by the Ethics Committee of the First Affiliated Hospital of Chongqing Medical University (2023–021) and registered at the Chinese Clinical Trial Registry in 2023 (ChiCTR2300068834). Participation in the survey was entirely voluntary, and prior to the commencement of the survey, written informed consent was obtained from each participant. It was explicitly communicated that the anonymity of all participants would be rigorously upheld.
2.2. Participants and procedure
The present cross-sectional study was carried out in Chongqing (China) from March 1, 2023 to March 7, 2023. To be eligible for participation, individuals had to meet the following inclusion criteria: (1) Possession of a registered household registration or temporary residency permit in Chongqing, with a minimum residency duration of 6 months, excluding those classified as migrant population; (2) Attainment of at least 18 years of age; and (3) Willingness to provide informed consent for participation in the study. In order to ensure the scientific validity of the survey design, a multi-stage random cluster sampling method was employed, taking into account significant aspects such as economic status and demographic variables. This approach aimed to ensure the overall representativeness of the sample by aligning with regional income standards, maintaining a distribution of age and gender akin to the general population in Chongqing, and achieving a balanced geographical distribution. The survey targeted 10 communities within Chongqing, which were selected through a random sampling process. Among 12 street offices, six were chosen at random, and from each selected street office, three communities were randomly picked. The sample size of each community survey was approximately 40 individuals. Ultimately, three street offices were identified for inclusion in the survey. All individuals meeting the inclusion criteria were selected from the designated households until the requisite sample size was attained. The study population encompassed individuals aged 18 or above, inclusive of those aged 18. A total of 720 participants were required in the 10 surveyed communities. Upon obtaining informed consent from the participants, pertinent data was acquired via on-site survey questionnaires, which were pre-tested to ensure their validity and reliability. In total, 840 survey questionnaires were distributed, yielding 786 collected responses and an actual response rate of 93.6%. After the exclusion of 61 participants with missing data, the final dataset comprised 723 participants (n = 723), resulting in an effective rate of 92.0%.
2.3. Measures
The survey encompassed an assessment of various domains, including socio-demographic information, body habitus, nutritional assessment, dietary habits, Fried’s frailty scale, and related domains (Appendix 1). Trained personnel executed all evaluations using standardized methodologies. Before distributing the questionnaire, a panel of 5 experts participated in the discussion and evaluation process for scrutinizing and refining the language, accuracy, order, and fluency of the questions and response options. The evaluation process comprised both individual assessment and group discussion. To obviate mutual influence, the experts remained uninformed about each other’s evaluation outcomes. Following the expert evaluation, the questionnaire underwent an initial pre-testing within a small-scale community study, yielding a Cronbach’s alpha coefficient of 0.744.
2.3.1. Sociodemographic characteristics
This study thoroughly examined the sociodemographic characteristics of the participants, including age, gender, marital status (single, married, divorced, widowed), education level (primary school and below, junior high school, senior high school, vocational school, undergraduate, graduate and above), occupation (government enterprises, healthcare professionals, self-employed, students, and retired) and personal income (less than ¥1,000, ¥1,000–3,999, ¥4,000–9,999, more than ¥10,000). Smoking status was classified as smoking (continuous or cumulative smoking for 6 months or more) or non-smoking (20). Drinking status was classified as non-drinking, moderate drinking (female ≤1 glass/day for women, male ≤2 glasses/day), or heavy drinking (female >1 glass/day, male >2 glasses/day) (21). Exercise was defined as moderate-intensity activity for ≥150 min/week or high-intensity activity for ≥75 min/week (22). Active weight loss behavior in the past year was defined as a binary variable (yes or no), indicating whether individuals had actively pursued strategies to manage their weight. Comorbidities were defined as self-reported chronic diseases (such as hypertension, diabetes, coronary heart disease, cerebrovascular disease, chronic obstructive pulmonary disease, joint diseases, etc.).
2.3.2. Body habitus
This section comprises nine indicators pertinent to body habitus, including height, weight, waist circumference, hip circumference, BMI, WHR, BFP, BRI, and ABSI.
BRI serves as an index for measuring the distribution of body fat, which considers the mass, distribution, and shape of total fat. BRI is calculated by the ratio of waist circumference to hip circumference. A higher BRI value corresponds to greater fat accumulation around the waist. Notably, BRI stands as a more precise gage of waist fat distribution and the roundness of body shape, characterized by robust practicality and accuracy (23, 24). ABSI, on the other hand, offers a body shape measurement that takes into account body fat distribution and BMI (25). ABSI is calculated based on the ratio of waist circumference to [height raises to 2/3 power times the square root of BMI]. A higher ABSI value implies greater waist fat accumulation relative to height and BMI. Several studies have shown that high ABSI and BRI values are associated with increased risks of cardiovascular disease, diabetes, and cancer (26, 27). Currently, ABSI is incorporated in certain studies for the prediction of health risks and the evaluation of body shape (28). The measurement of all the aforementioned indicators adhered to the standard methods specified by the Chinese Center for Disease Control and Prevention (29). Calibrated weighing scales with a precision of 1,000 grams were employed, height measurements were precise to 1 cm, and the calculation outcomes were recorded to two decimal places.
2.3.3. Nutritional assessment scale
The Short Nutritional Assessment Questionnaire (SNAQ), a concise, succinct, and repeatable survey questionnaire, was utilized for the nutritional appetite assessment (30). SNAQ consists of 4 questions, each with 5 answer options, represented by the letters A through E. The questionnaire’s content, along with the scoring criteria, are detailed in Appendix 1. Lower scores denote poorer appetite and an elevated risk of weight loss, with the score range spanning 4 to 20. A score of ≤14 signifies a potential risk of weight loss.
2.3.4. Dietary habits assessment scale
This segment of the questionnaire aligns with the “Chinese Dietary Guidelines for Residents (2016 edition)” (31). The questionnaire consists of 5 questions, and the specific questions and corresponding scoring criteria can be found in Appendix 1. The cumulative score on this scale ranges from 12 to 55 points.
2.3.5. Frailty assessment scale
In this study, frailty measurement was defined using the Fried and colleagues Frailty Assessment Scale (32), a rigorously validated and widely used tool. The assessment model of this scale centers around five criteria: feeling exhausted, physical activity, walk time, grip strength, and weight loss. In instances where a participant is unable to ambulate due to a fracture or injury, their pre-fracture or pre-injury activity level should be reported. Satisfying 1–2 of these criteria indicates pre-frailty while meeting 3 or more criteria signifies frailty.
2.4. Statistics analysis
IBM SPSS Statistics 26.0 (IBM Corporation, Armonk, NY, United States) was used for data analysis. First, descriptive statistics were used to examine the baseline characteristics of the study population. Next, the Kruskal-Wallis H test was used for non-parametric analysis of asymmetric continuous count data, while the chi-square test was used for metric data of continuous normal distribution. These assessments were conducted to discern whether variations existed in the distribution of different frailty degrees across diverse conditions, including body habitus, nutritional status, and dietary habits. Then, multiple logistic regression was performed to identify the most significant frailty-related predictors among variables exhibiting statistical significance. Finally, based on parallel line test results, ordinal or nominal multiple logistic regression analyzes were conducted for each variable with statistical differences to examine the relationship between the specific predictor variable and frailty. In the regression analyzes, all variables considered to be potential confounders were meticulously adjusted. All statistical tests conducted within the model were two-tailed and predicated on a significance level of 0.05.
3. Result
3.1. Participants’ sociodemographic characteristics
Table 1 presents the socio-demographic characteristics of the 723 participants. The median age of the sample was 47 years, with a first quartile (Q1) of 29 and a third quartile (Q3) of 67 (SD = 20.217, SE = 0.752). Among the participants, 51.5% were females, while 48.5% were males. Out of the total, 471 individuals (65.1%) were considered healthy, 211 (29.2%) exhibited pre-frailty, and 41 (5.7%) were identified as frail. Regarding occupational distribution, a majority of participants were engaged in company jobs (31.3%) or had retired (34.3%). As for education, 39.6% possessed a college degree. In terms of monthly income, the largest proportion fell within the range of 1,001–3,499 yuan (31.1%). Additionally, 40.1% of the participants were married.
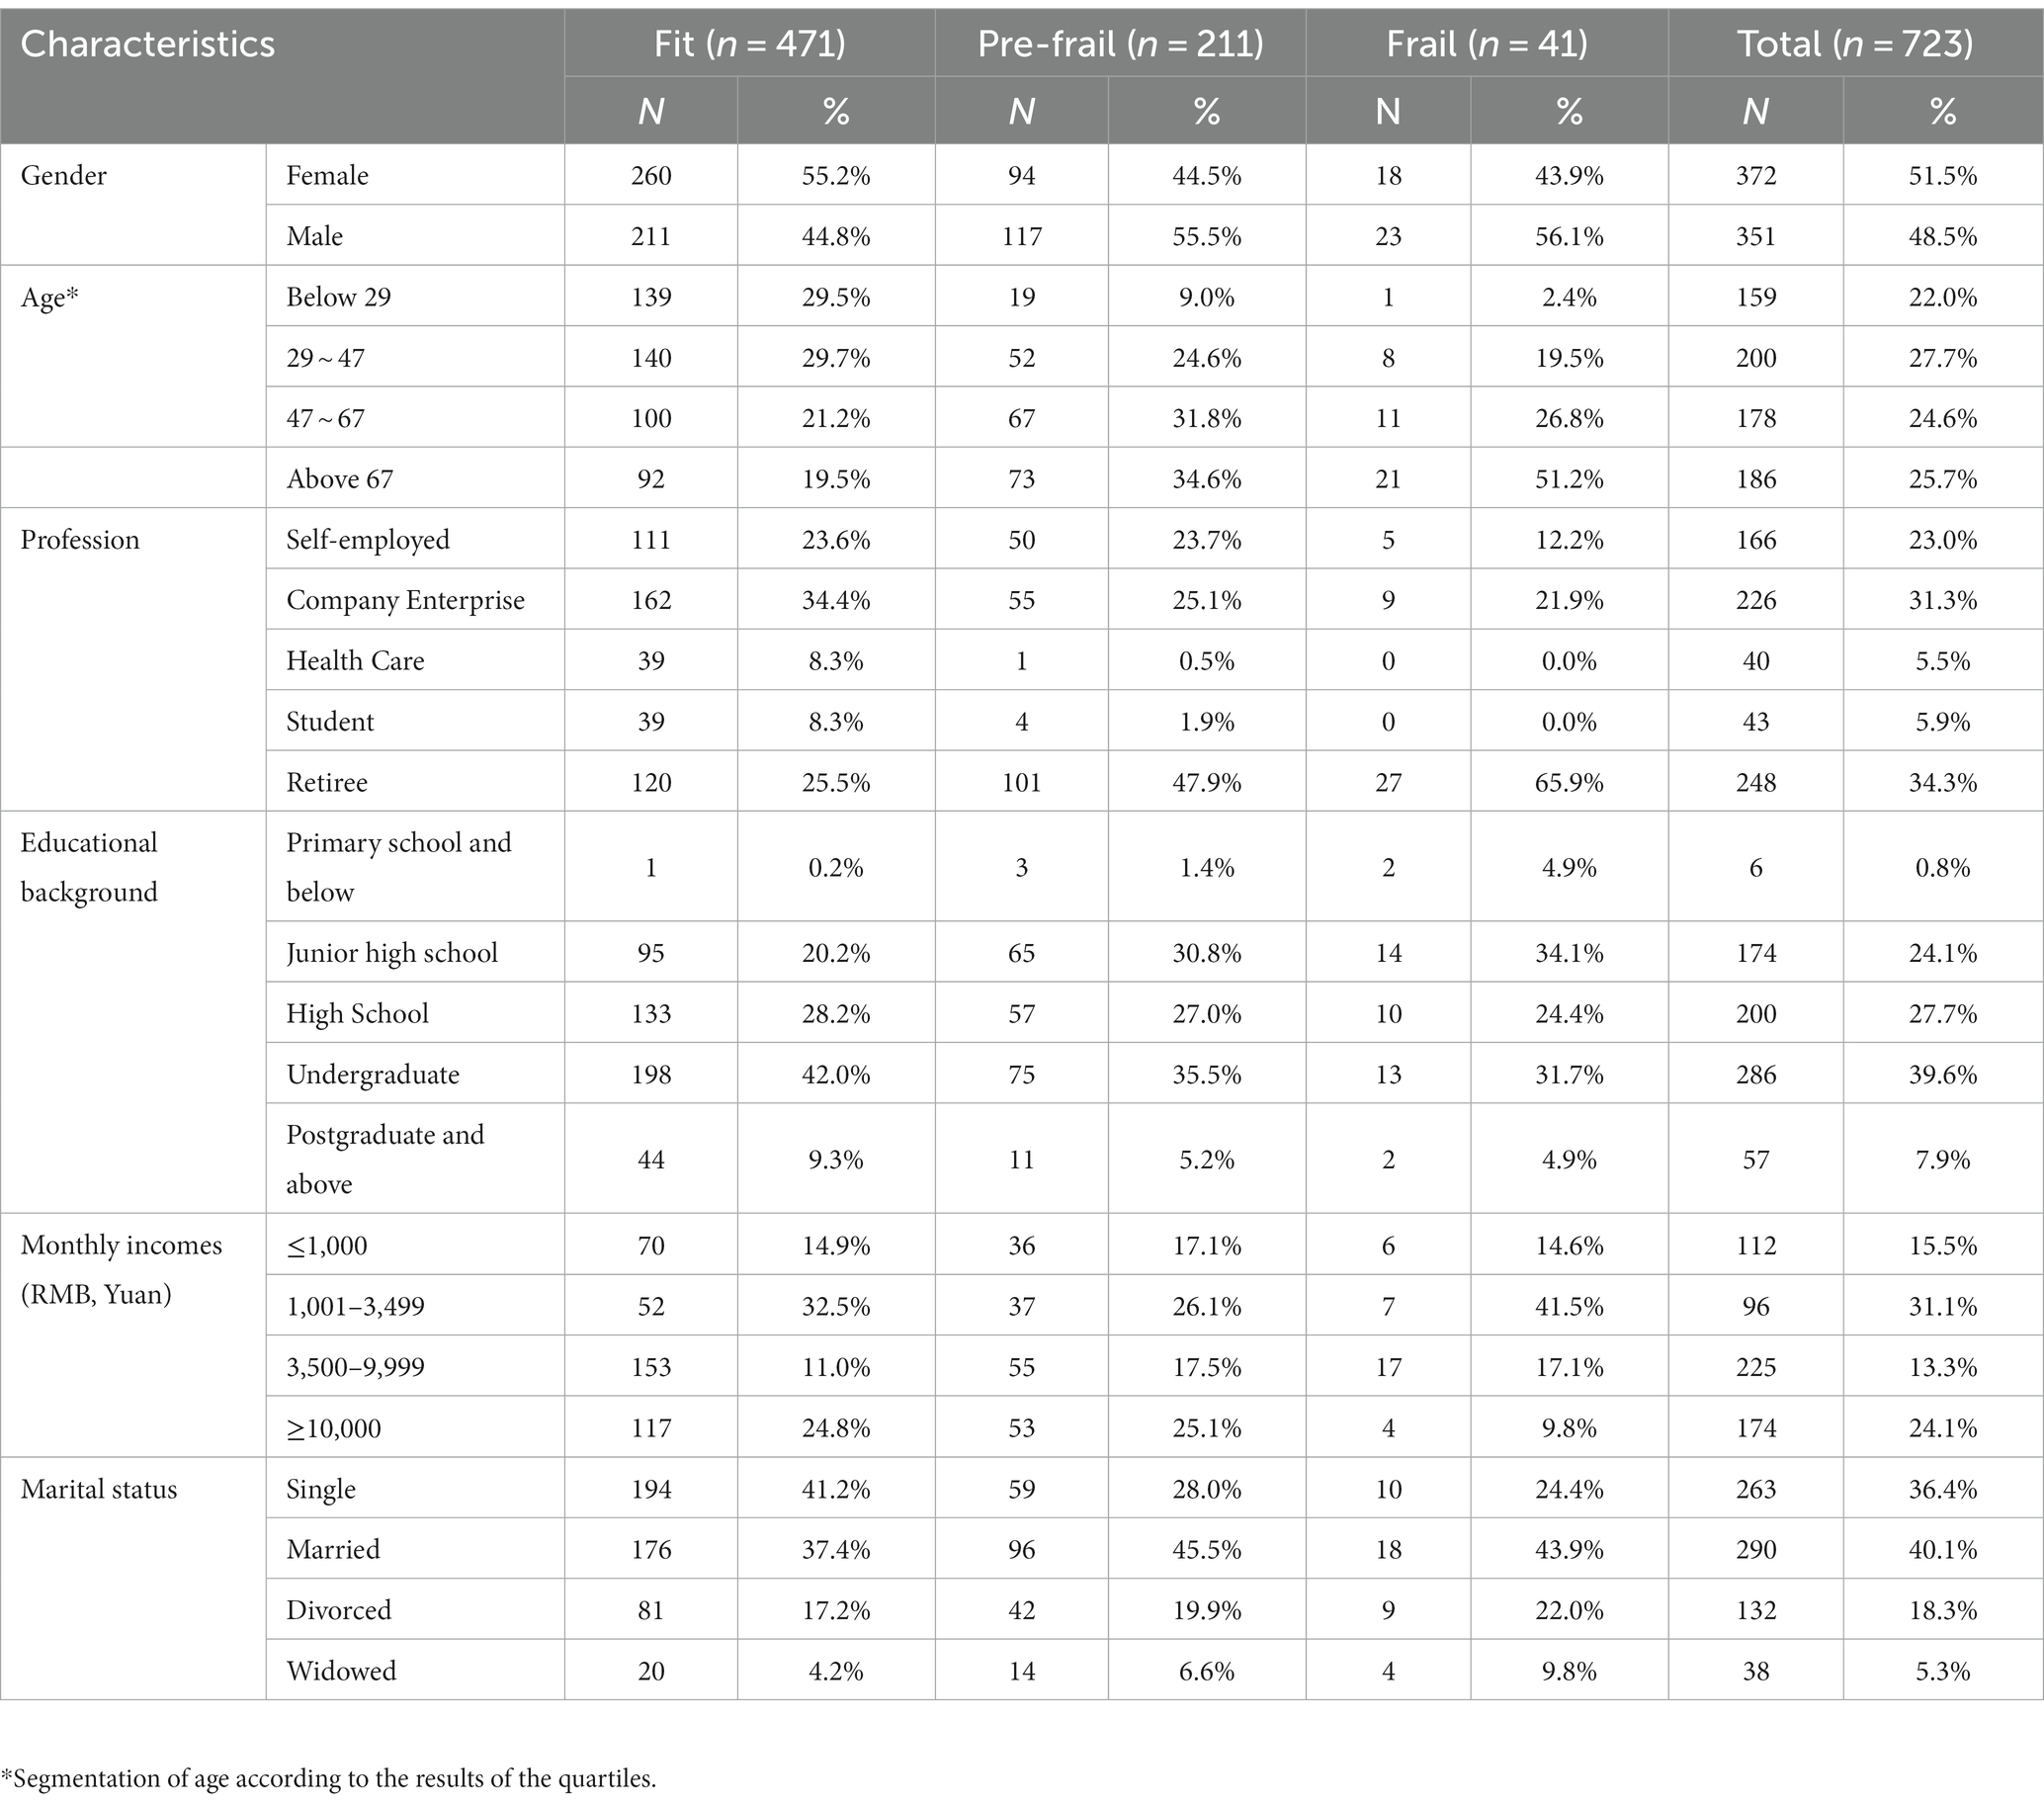
Table 1. Baseline characteristics adjusted for debilitating status (n = 723).
3.2. Comparison of body habitus and influencing factors for frailty
Table 2 demonstrates the comparison and tests conducted between body habitus and levels of frailty. After standardized grouping based on diverse indicators, the populations categorized as frail and pre-frail were primarily concentrated within the overweight population (75.6%). Individuals exhibiting both high and low WHR manifested varying degrees of frailty, with a higher risk of frailty observed in comparison to those with normal WHR. Notably, among individuals with different levels of frailty, BMI, WHR, BRI, and ABSI demonstrated significant inter-group differences (p < 0.05), suggesting their potential influence on frailty degree. Moreover, the results indicated significant group variations within the Nutrition Assessment Scale and the Dietary Habits Assessment Scale, as reflected by distinct total scores (p < 0.05) among individuals with varying degrees of frailty. Specifically, factors such as the acceptance of food taste, regular daily meals, and regular breakfast may become one of the factors affecting the degree of frailty. Additionally, diverse lifestyles were found to have an impact on the degree of frailty. Variables such as smoking, alcohol consumption, active weight loss behavior in the past year, patient age, and the presence of comorbidities were all associated with varying degrees of frailty within different populations.
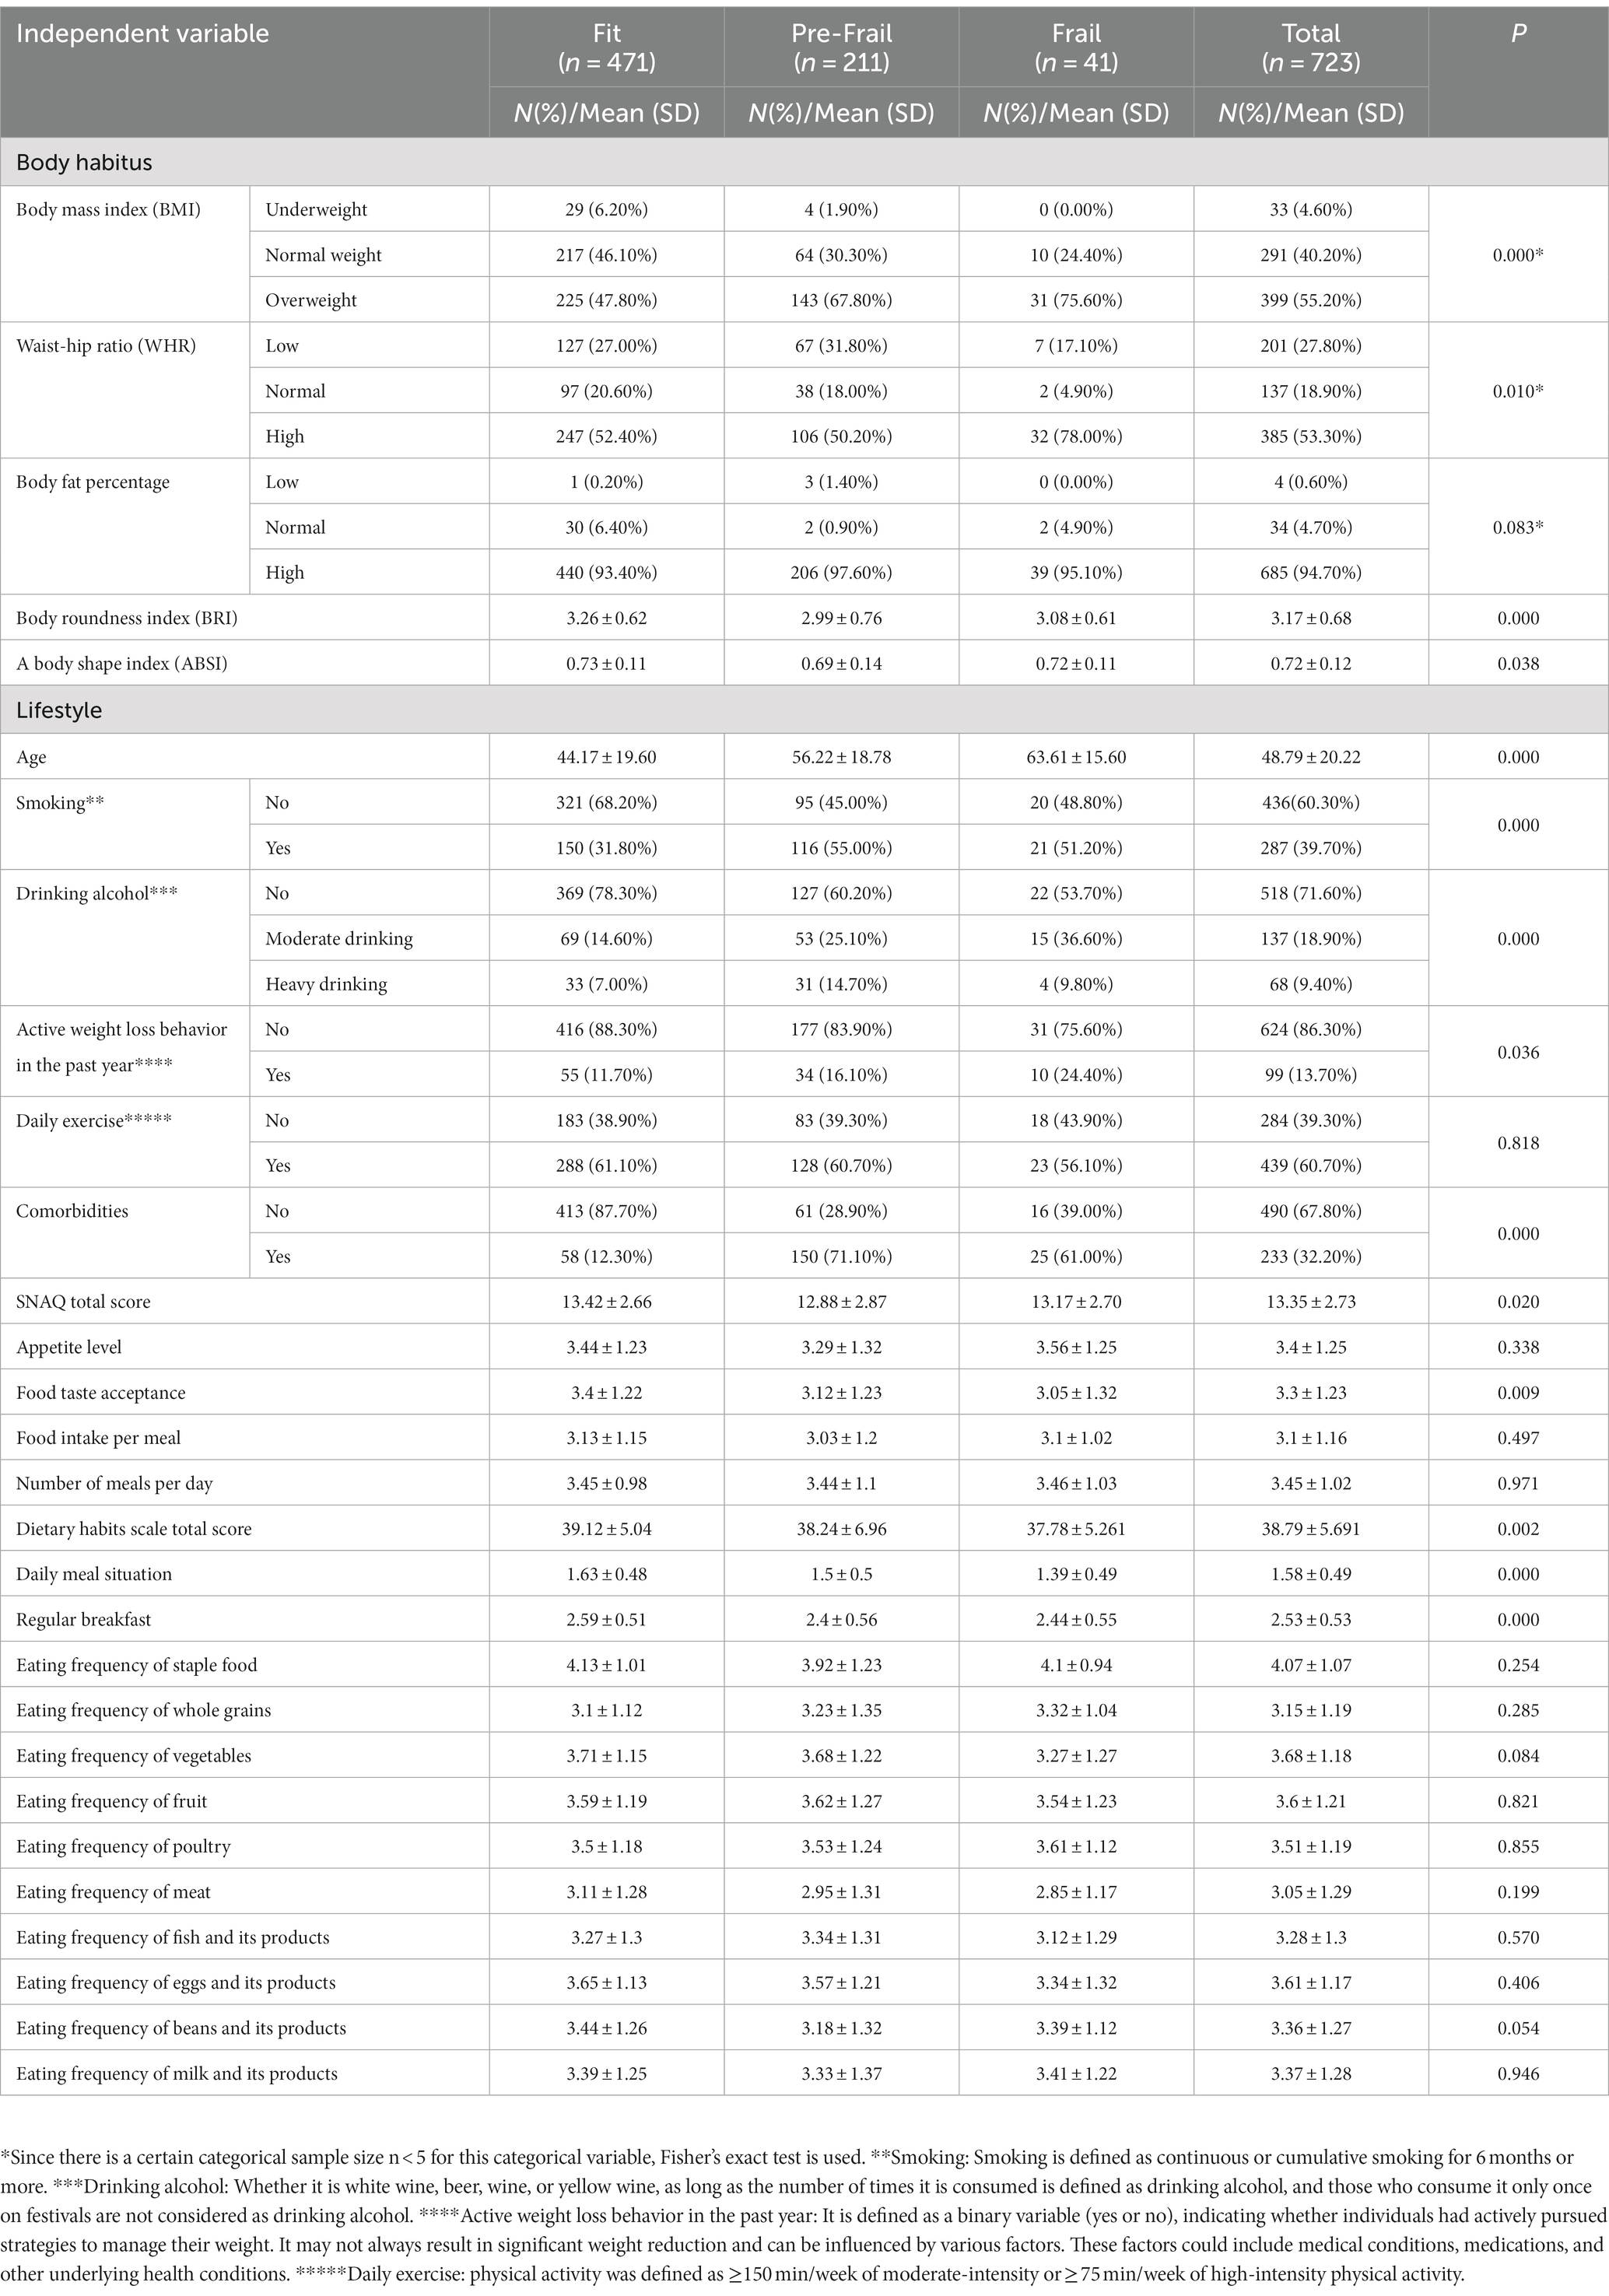
Table 2. Descriptive analysis of body habitus and influencing factors.
3.3. Multivariate logistic regression analysis of factors related to different degrees of frailty
Using frailty, pre-frailty, and fitness as dependent variables, we considered the following factors as independent variables: age, smoking, drinking, active weight loss behavior in the past year, comorbidities, BMI, WHR, BRI, ABSI, food taste acceptance score, daily regular meal score, regular breakfast score, total score of Nutrition Assessment Scale and total score of Dietary Habits Scale. Table 3 shows the variables that exhibited statistical significance in the analysis (p < 0.05). In our study, the application of multivariate logistic regression aims to identify significant contributing factors without establishing linear relationships between variables. This statistical approach is commonly employed in the field (33, 34). owing to its effectiveness in identifying significant predictors among multiple variables. It serves as a valuable tool for assessing associations between various factors and the targeted outcome. The results showed that 11 independent variables were associated with frailty and pre-frailty, including age, moderate and heavy drinking, active weight loss behavior in the last year, comorbidities, BMI, WHR, food taste acceptance score, daily meal score, regular breakfast score, total score of the Short Nutritional Assessment Scale, and total score of the Eating Habits Scale.
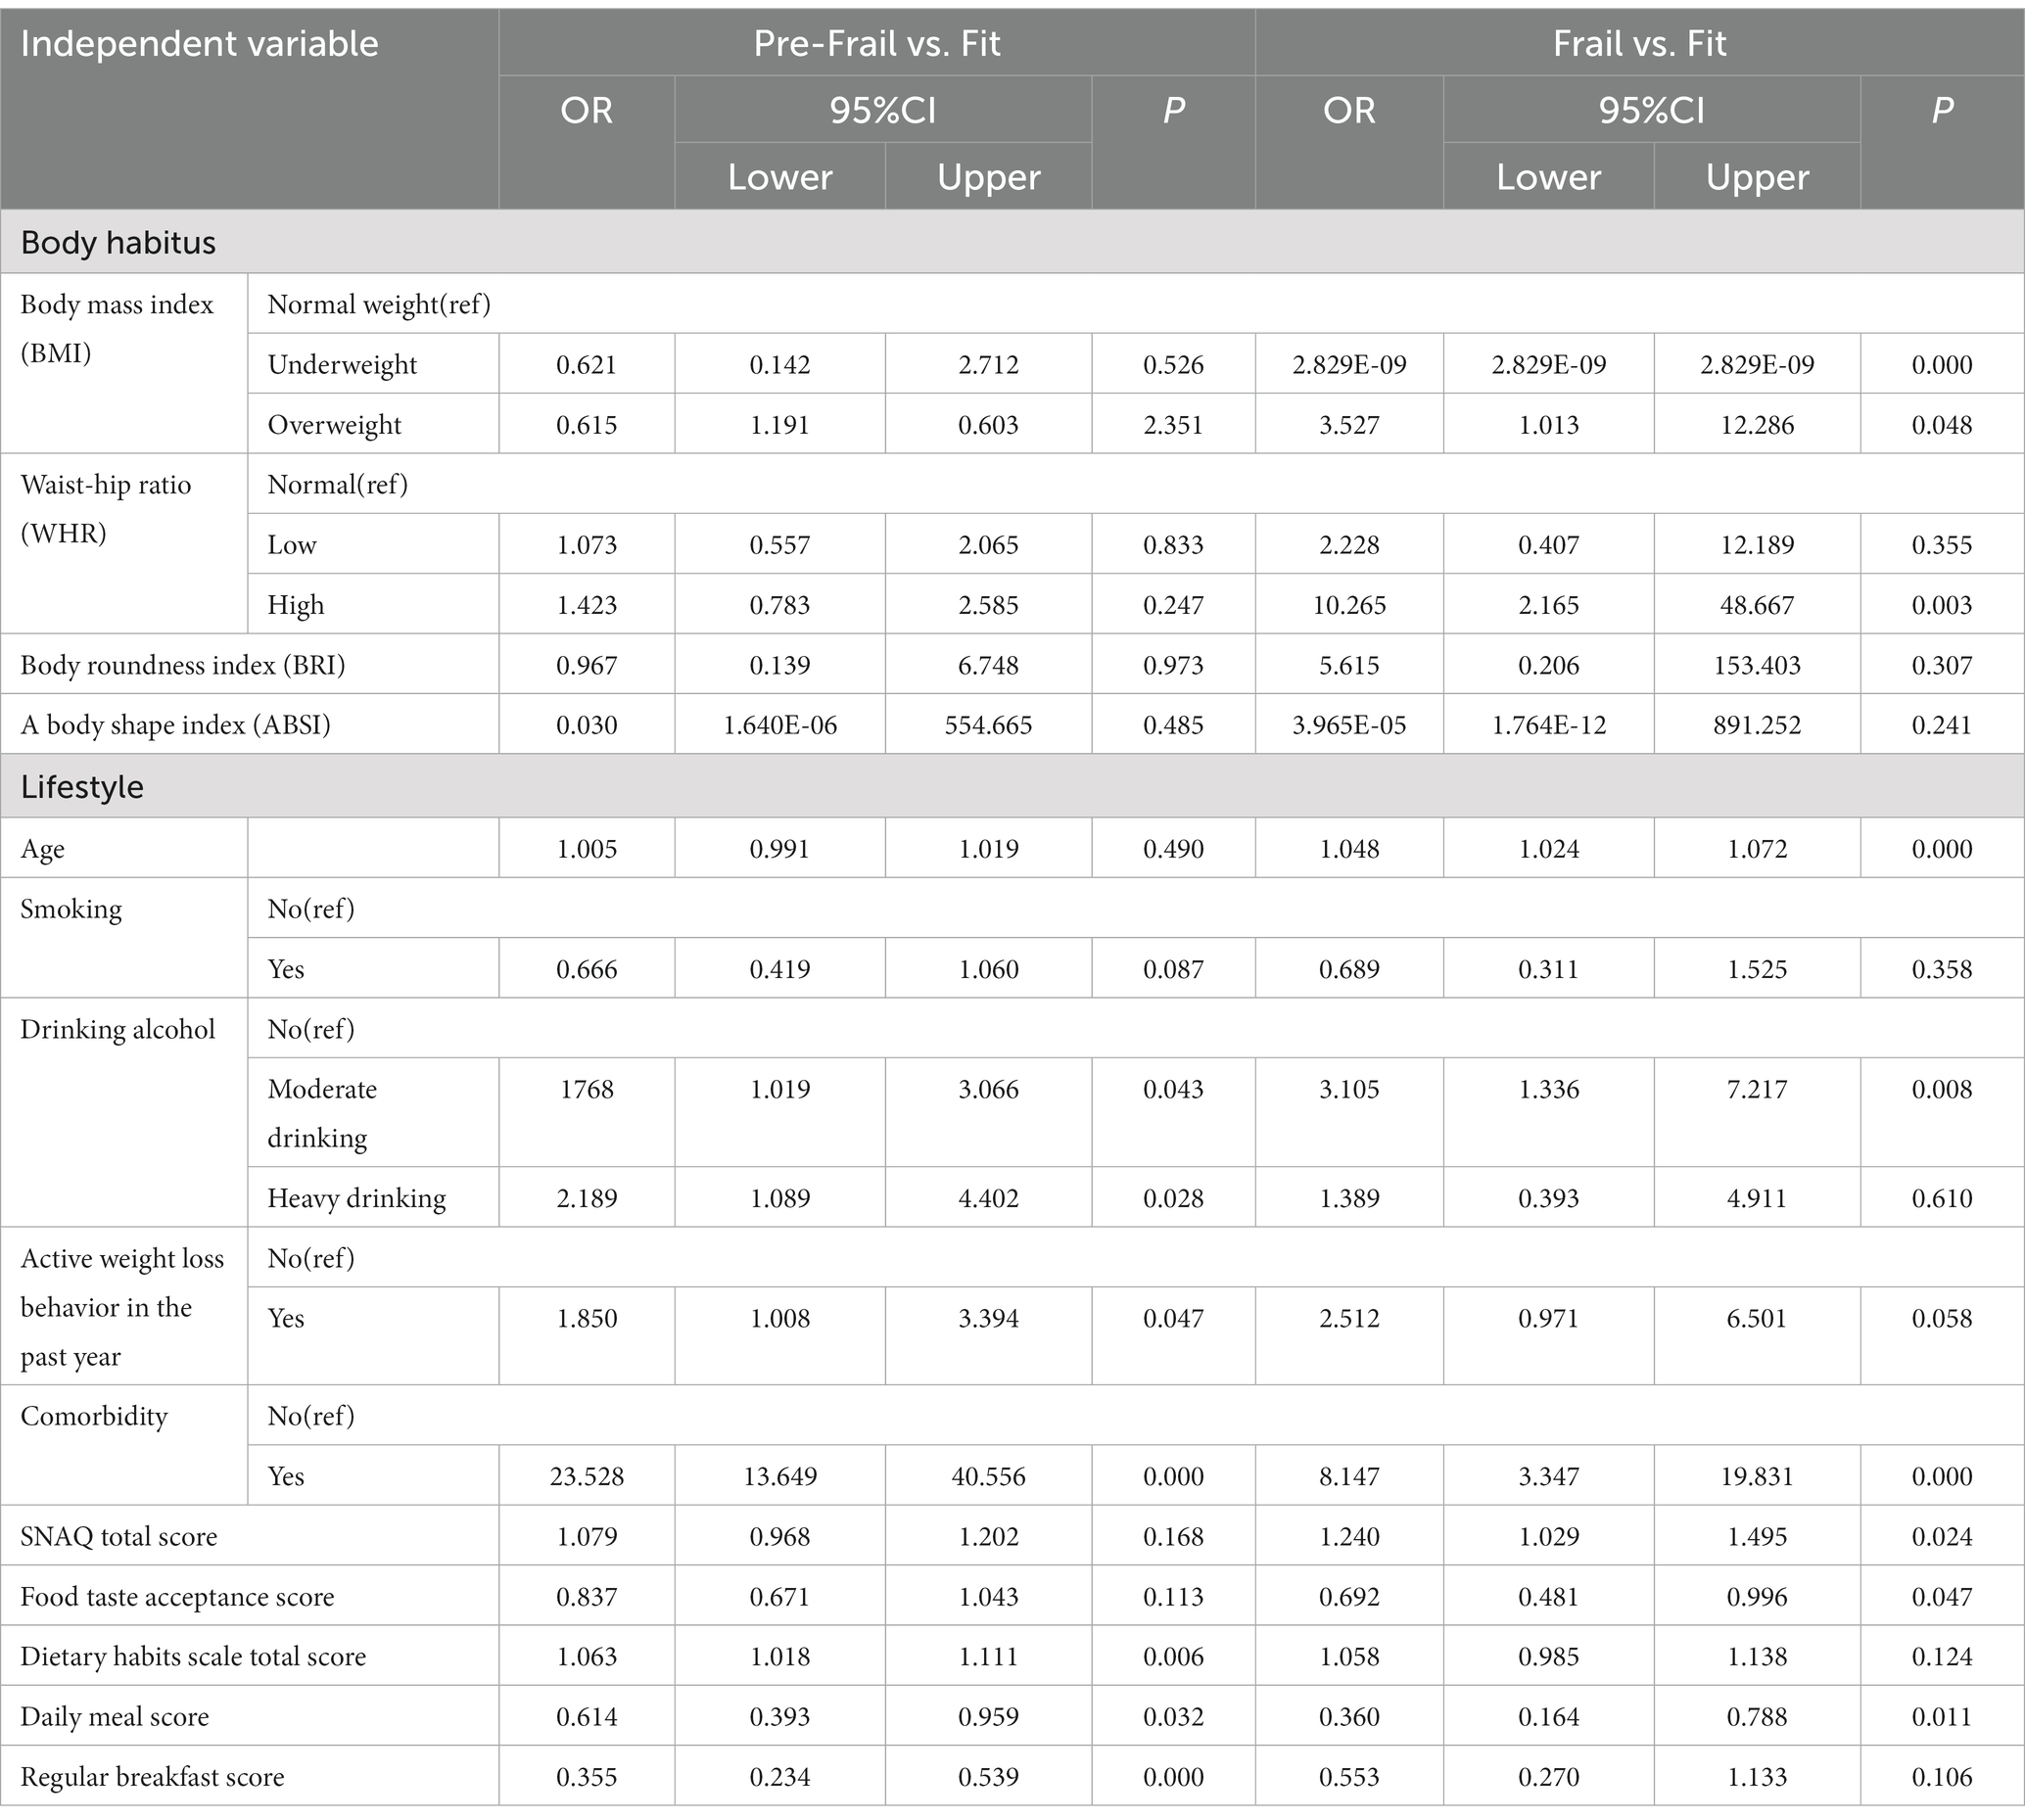
Table 3. Multivariate logistic regression analysis of factors related to different degrees of frailty.
3.4. Logistic regression analysis of the single factor and different degrees of frailty
To prevent mutual influence and interference among independent variables, each independent variable was subjected to separate regression analysis. Previously, a parallel lines assumption test was conducted to ensure the parallelism of the response curves of categorical variables in the ordered logistic regression model. This parallel lines assumption, commonly used in cross-sectional studies (35), signifies that distinct categories of an independent variable maintain a consistent parallel relationship across its entire range. This ensures the reliability of regression models for prediction and interpretation. If the parallel lines assumption is violated (p < 0.05), it suggests that the model may not accurately capture the relationships between different categories. This situation can lead to unstable predictive outcomes and compromise the overall reliability of the model. When p > 0.05, the response curves of each variable at varying levels of categorical variables exhibit parallelism, which can be analyzed using an ordered logistic regression model (36, 37).
As a result, except for WHR and comorbidities analyzed using unordered logistic regression, all other independent variables can be analyzed using ordered logistic regression. The impact of each independent variable on the degree of frailty was statistically different (p < 0.05). The results presented in Tables 4, 5 showed that aging annually increases the log odds value of frailty by 0.035 units (B = 0.035), indicating the significant effect of age on frailty. In terms of body habitus, the degree of frailty increased with increasing BMI values. The coefficient B for the variable “Overweight” with a value of 0.823 (greater than 0) indicates that a positive value signifies an augmented probability ratio of transitioning from lower to higher levels of the dependent variable with an increase in the independent variable. This implies that the degree of frailty is correlated with an elevated BMI. For every unit increase in the BMI value, the odds ratio of transitioning from one level of the dependent variable to the next higher level increases by approximately a factor of 0.823. Individuals with a high WHR had a 6.283-fold increased risk of frailty compared to fitness. Moderate drinking, heavy drinking, and comorbidities, as factors influencing body habitus, all increased the relative probability of frailty (B > 0). Conversely, the relative probability of frailty decreased (B < 0) with each unit increase in active weight loss behavior in the past year, food taste acceptance score, daily meal score, regular breakfast score, simple nutritional assessment scale total score, and dietary habit scale total score. Comorbidity significantly increased the odds of frailty (OR = 11.126) and pre-frailty (OR = 17.510) when compared to the healthy population, and these results were statistically significant (p < 0.01).
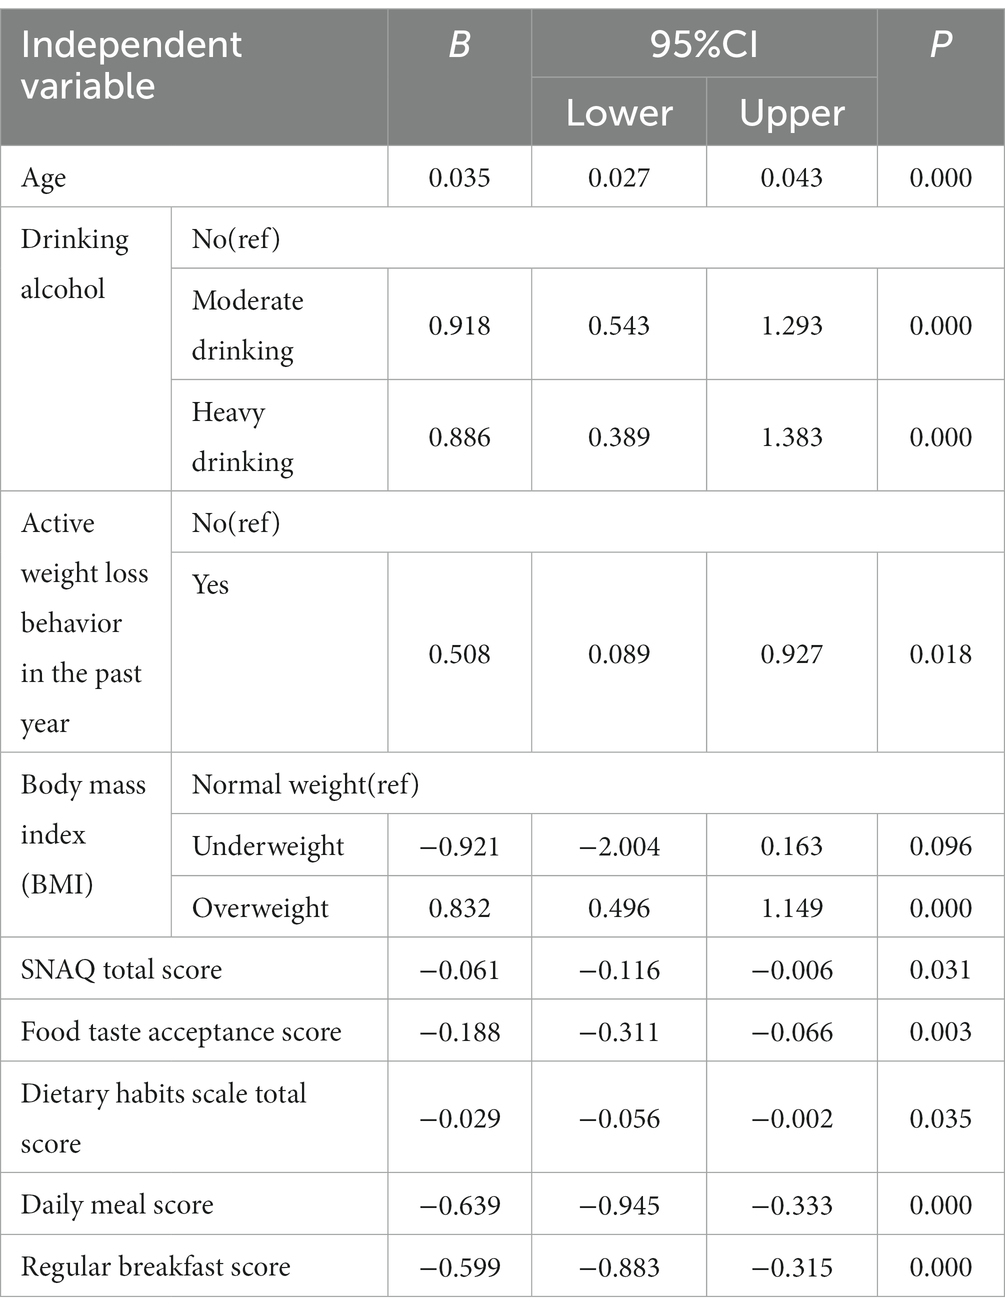
Table 4. Univariate ordinal logistic regression.
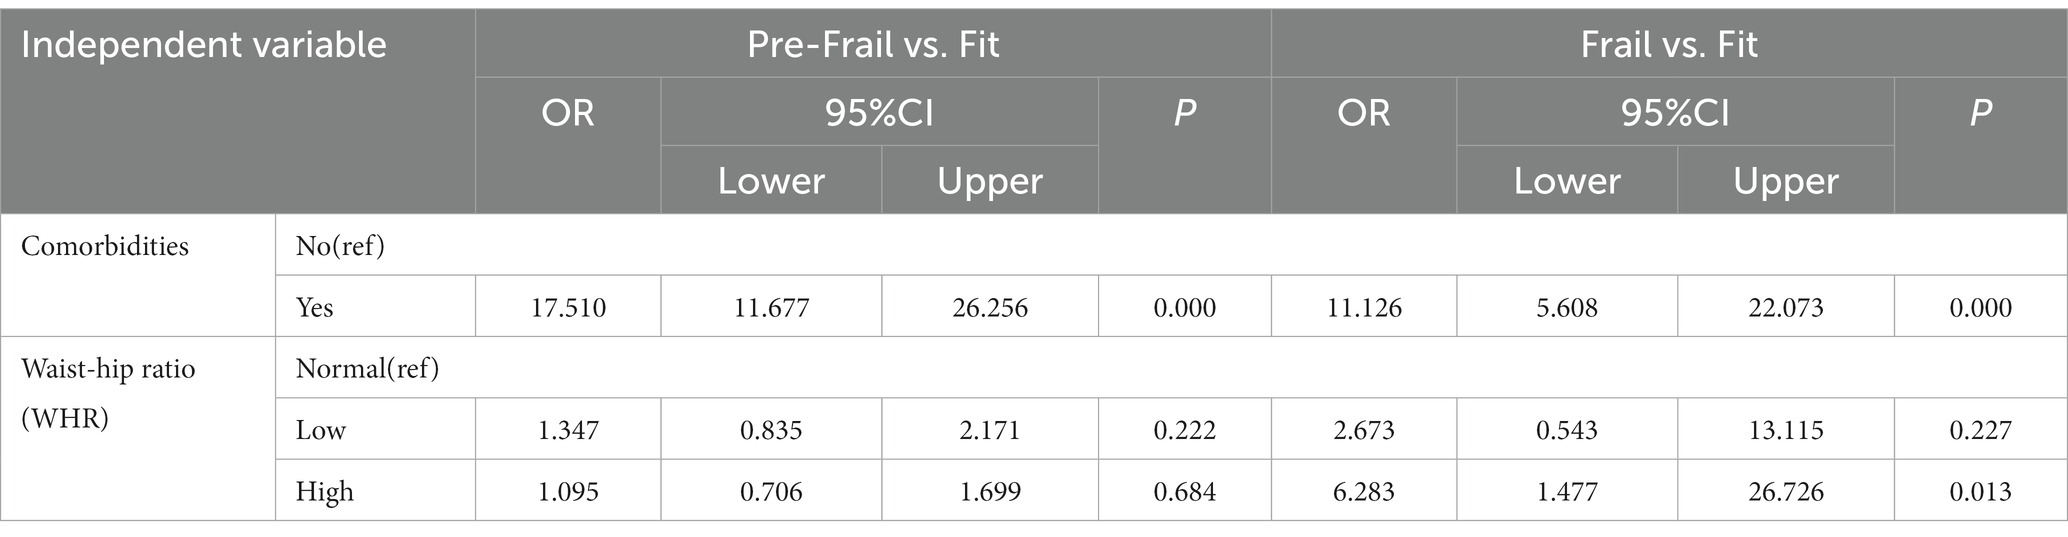
Table 5. Univariate multinomial logistic regression.
4. Discussion
In previous studies, discussions on frailty mainly centered on the older adult population (38, 39). The present study conducted a comprehensive analysis of adult community residents for the first time. The outcomes unveiled a frailty prevalence rate of 5.67% and a pre-frailty prevalence rate of 29.18%, which were consistent with findings from numerous previous studies (40, 41). Moreover, this research delved into body habitus indicators beyond the confines of BMI, opting for a more accurate and comprehensive evaluation through multiple indicators such as WHR, body fat percentage, BRI, and weight index. This multifaceted approach enables a more comprehensive grasp of the relationships between factors such as fat mass, central obesity, and frailty.
In this study, Fried’s frailty scale (32), also known as the phenotype model (42), was utilized as the tool for screening and grading frailty. As the most widely employed method for assessing frailty, this questionnaire adeptly and swiftly portrays participants’ physical frailty statuses. Additionally, it exhibits a robust correlation with BMI and other body habitus indicators, rendering it the most appropriate method for assessing frailty within the scope of this cross-sectional study (43). Although the Fried frailty scale was initially designed for individuals aged 65 and older, recent research has indicated that it maintains a high level of accuracy when applied to the assessment of frailty in the middle-aged population (44). In contrast, the commonly used clinical frailty scale (CFS) (45) and frailty index (FI) (46) lack comprehensive evaluation criteria pertaining to body habitus. Consequently, these tools possess certain limitations when evaluating frailty across diverse body habitus profiles. The CFS primarily assesses frailty based on mobility status, while the FI lacks standardized criteria for variable inclusion. Researchers determine variable inclusion based on their study objectives and available health indicators, leading to variations in the number of variables (ranging from 30 to 70), and the corresponding threshold values (47–49), and researchers from different countries have developed their own versions of the FI. Hence, these two commonly used assessment tools inherently carry limitations that render them unsuitable for the present study.
Nutritional status was evaluated using the Simplified Nutritional Appetite Questionnaire (SNAQ) (50), which encompasses several indicators such as appetite, hunger, and sensory perception. This questionnaire embraces high reliability, sensitivity, and predictability, enabling it to effectively reflect the nutritional status of the population and predict the risk of malnutrition. To evaluate dietary habits, the China Food Guide Pagoda (2016 version) (31) and multiple references were consulted, covering various types of food and frequency of consumption, providing a comprehensive reflection of participants’ dietary preferences and dietary balance.
The findings of this study reaffirmed previously identified risk factors for frailty, including age, alcohol consumption, and comorbidities (4, 9, 14). In comparison to individuals classified as fit, those categorized as frail or pre-frail were older and more likely to engage in moderate or heavy drinking and suffer from comorbidities. Prior research has indicated that exercise can mitigate the risk of frailty and enhance physiological function in older adults (51). However, in this study, 56.10% of frail participants and 60.70% of pre-frail participants reported engaging in regular exercise. This suggests that the manner, frequency, and intensity of their exercise may not be sufficient to effectively prevent or delay frailty. Furthermore, these results imply that the cause of frailty may extend beyond merely insufficient exercise, encompassing other factors such as age, health status, dietary habits, and medication usage.
In the present study, the relationship between BMI and frailty did not fully align with the findings of previous research. According to one study (52), there is a U-shaped association between BMI and frailty, suggesting that both high and low BMI values increase the likelihood of frailty. In our study, overweight individuals had a higher incidence of frailty, but the statistical association between low BMI value and frailty was not fully confirmed. Several factors could contribute to this outcome. Firstly, due to the high prevalence of obesity in China (53), our study had limited representation of individuals with low BMI and instead, had a greater prevalence of overnutrition and high BMI. This trend is consistent with previous research conducted within Chinese communities (54). Moreover, this discrepancy might be explicable through the mechanisms of frailty. Sarcopenia, the key contributor to frailty, primarily involves a decline in muscle mass within the body (55). However, for participants with lower BMI values, the reduction in BMI might not be entirely attributed to the loss of muscle mass; it could also involve loss of fat or calcium (56, 57). Similarly, a high BMI does not necessarily signify muscle gain but may be a sign of fat gain and muscle loss. Numerous studies have highlighted the risk of synergistic complications of sarcopenia and obesity in aging populations (58). Therefore, if frailty is described solely from the perspective of BMI as in previous studies, the relationship between sarcopenia and frailty may not be adequately substantiated. Our study encompassed various body habitus indicators, and both BMI and WHR demonstrated statistical significance. As a descriptive index for waist and hip circumference, WHR can better reflect the distribution of muscle and fat in different parts of the body. It effectively highlights unfavorable fat accumulation around the abdomen and is also easier to calculate than BMI (59). Several studies have demonstrated that the WHR is a more effective predictor of mortality and the incidence of certain diseases in middle-aged and older adults compared to BMI. It has also been adopted as an indicator of health and the presence of significant health risks (60, 61). Our results confirmed that high WHR independently increased the risk of current community frailty. This finding suggests that, in the context of Chinese community populations, low BMI or low WHR no longer constitute major factors in frailty development. Instead, high BMI and high WHR are more closely associated with frailty progression. Furthermore, we propose that WHR can offer a more accurate depiction of the relationship between frailty and sarcopenia compared to BMI. Individuals with high WHR are more likely to shift from fitness to frailty, implying an overlap between our physical condition characterized by high waist fat and low hip circumference fat, and the clinical manifestations of sarcopenia. Unlike BMI, which solely considers height and weight, WHR takes into account critical factors of sarcopenia: muscle mass and fat mass. It is worth noting that the formula for calculating WHR considers gender differences, which is particularly important since females are more susceptible to frailty (3, 62, 63). This gender-specific aspect is often overlooked when calculating BMI. In conclusion, the assessment of frailty can be enhanced by considering multiple body habitus indicators, such as WHR and BMI, to achieve more accurate and comprehensive results.
The absence of a significant correlation between body fat percentage (BFP) and frailty status, as observed in Table 2, presents an intriguing finding. This finding aligns with previous research that has highlighted inconsistencies and even reversals in the significance of WHR and BFP (64). BFP serves as an indicator of the proportion of total body weight attributed to adipose tissue, essentially representing the overall adiposity of the body. While an elevated body fat percentage may indicate a higher overall fat content, it fails to provide insights into the distribution of fat within specific anatomical regions. In the context of our study, the lack of a significant association between body fat percentage and frailty status suggests that the overall fat content might have a relatively minor impact on frailty. Conversely, WHR is regarded as a more refined measure, reflecting the proportion of abdominal fat within the total body fat composition. Elevated WHR is often indicative of abdominal obesity, which has a strong association with various health concerns and displays a significant relationship with frailty status (65). Our study confirms this perspective, underscoring that WHR could be more sensitive than BFP in assessing frailty status, or alternatively, the abdominal fat distribution might play a more pivotal role in determining frailty status. Furthermore, studies have indicated that Asians tend to possess a higher proportion of visceral fat compared to Europeans, which provides an additional perspective to explain the significant WHR result and the non-significant BFP finding in our study (66, 67).
This study also covered some relevant factors affecting body habitus, including lifestyle, nutritional status, and dietary habits. The scoring outcomes of the questionnaire imply that a regimen of regular eating, daily breakfast consumption, high acceptance of food taste, a balanced diet, and adequate nutrition can collectively lower the relative likelihood of developing frailty. This suggests that favorable dietary habits can contribute to weight management, maintaining health status, and diminishing the risk of frailty (68, 69). Additionally, some literature has suggested a relationship between frailty and malnutrition (70–72). Malnutrition has been identified as the primary risk factor for frailty among community-dwelling older adults (73), which has a greater impact on the frailty of the population (70).
5. Limitation
Although we selected the most suitable frailty assessment scale for our study, there is currently no frailty scale available that encompasses all age groups. Hence, there might be some bias in the assessment of frailty among the younger population. In terms of sample selection and collection, this study was limited to community populations in urban areas of China. While we have made considerable efforts to ensure sample representativeness, achieving a 100% representation of the overall situation is challenging. Moreover, factors such as rural areas and ethnicity should be taken into consideration. Additionally, the sample size gathered for some indicators remains moderate. Despite our efforts to rule out collinearity, this might result in some inevitable errors in the outcomes, such as wider confidence intervals. In future investigations, we intend to explore the possibility of employing a multi-center or longitudinal research approach, thereby broadening the spectrum and comprehensiveness of the sample. Furthermore, the percentage of body fat was calculated during the measurement process, without using instruments for obtaining highly accurate results. To enhance the accuracy of body composition measurement, we aim to employ more comprehensive and precise measurement methods. Finally, since our study was cross-sectional in nature, we did not conduct subgroup analyzes of frailty status across different populations or genders. Further research is needed to explore the interplay and influence of BMI and other contributing factors.
6. Conclusion
This cross-sectional analysis elucidated the relationship between body habitus and frailty in community-dwelling adults. The study also incorporated pertinent influencing factors such as lifestyle, nutritional status, and dietary habits. The results demonstrated that compared to previous studies solely focused on BMI, a comprehensive evaluation of body habitus involving BMI, WHR, BFP, BRI, ABSI, and other indicators can provide a more thorough and accurate reflection of the influence of body size and obesity on frailty severity. Furthermore, this approach can help explain the mechanisms underlying frailty caused by sarcopenia, thereby aiding in predicting changes in the prevalence of adult frailty within communities. By fostering good dietary habits, achieving nutritional balance, managing comorbidities, and reducing alcohol consumption, the risk of community frailty can be significantly mitigated. These findings offer novel insights into targeted prevention and even reversal of frailty.
Data availability statement
The raw data supporting the conclusions of this article will be made available by the authors, without undue reservation.
Ethics statement
The studies involving humans were approved by the Ethics Committee of the First Affiliated Hospital of Chongqing Medical University (2023–021) and the Chinese Clinical Trial Registry in 2023 (ChiCTR2300068834). The studies were conducted in accordance with the local legislation and institutional requirements. The participants provided their written informed consent to participate in this study.
Author contributions
AC, FL, and SM conceived the presented idea, developed the framework, and wrote the manuscript. AC, LR, and KW were involved in the data collection. YT and PL provided critical feedback and contributed to the final version. All authors contributed to the article and approved the submitted version.
Funding
This research was funded by Chongqing Social Science Planning Project (2021PY27); Chongqing Graduate Joint Training Base (lpjd202204); Chongqing Medical University Future Medical Youth Innovation Team Development Support Plan (W0006).
Acknowledgments
We thank all the participants for participating in this study.
Conflict of interest
All the authors declare that the research was conducted in the absence of any commercial or financial relationships that could be construed as a potential conflict of interest.
Publisher’s note
All claims expressed in this article are solely those of the authors and do not necessarily represent those of their affiliated organizations, or those of the publisher, the editors and the reviewers. Any product that may be evaluated in this article, or claim that may be made by its manufacturer, is not guaranteed or endorsed by the publisher.
Supplementary material
The Supplementary material for this article can be found online at: https://www.frontiersin.org/articles/10.3389/fpubh.2023.1189173/full#supplementary-material
References
1. Dent, E , Martin, FC , Bergman, H , Woo, J , Romero-Ortuno, R , and Walston, JD . Management of frailty: opportunities, challenges, and future directions. Lancet. (2019) 394:1376–86. doi: 10.1016/S0140-6736(19)31785-4
2. Fan, J , Yu, C , Guo, Y , Bian, Z , Sun, Z , Yang, L, et al. Frailty index and all-cause and cause-specific mortality in Chinese adults: a prospective cohort study. Lancet Public Health. (2020) 5:e650–60. doi: 10.1016/S2468-2667(20)30113-4
3. Collard, RM , Boter, H , Schoevers, RA , and Oude Voshaar, RC . Prevalence of frailty in community-dwelling older persons: A systematic review. J Am Geriatr Soc. (2012) 60:1487–92. doi: 10.1111/j.1532-5415.2012.04054.x
4. He, B , Ma, Y , Wang, C , Jiang, M , Geng, C , Chang, X, et al. Prevalence and risk factors for frailty among community-dwelling older people in China: A systematic review and Meta-analysis. J Nutr Health Aging. (2019) 23:442–50. doi: 10.1007/s12603-019-1179-9
5. Rockwood, K , Hogan, DB , and MacKnight, C . Conceptualisation and measurement of frailty in elderly people. Drugs Aging. (2000) 17:295–302. doi: 10.2165/00002512-200017040-00005
6. Jayanama, K , Theou, O , Godin, J , Mayo, A , Cahill, L , and Rockwood, K . Relationship of body mass index with frailty and all-cause mortality among middle-aged and older adults. BMC Med. (2022) 20:404. doi: 10.1186/s12916-022-02596-7
7. Santos-Eggimann, B , Cuénoud, P , Spagnoli, J , and Junod, J . Prevalence of frailty in middle-aged and older community-dwelling Europeans living in 10 countries. J Gerontol A Biol Sci Med Sci. (2009) 64:675–81. doi: 10.1093/gerona/glp012
8. Hubbard, RE , Lang, IA , Llewellyn, DJ , and Rockwood, K . Frailty, body mass index, and abdominal obesity in older people. J Gerontol A Biol Sci Med Sci. (2010) 65:377–81. doi: 10.1093/gerona/glp186
9. Wang, X , Hu, J , and Wu, D . Risk factors for frailty in older adults. Medicine (Baltimore). (2022) 101:e30169–9. doi: 10.1097/MD.0000000000030169
10. Harper, C , Gopalan, V , and Goh, J . Exercise rescues mitochondrial coupling in aged skeletal muscle: a comparison of different modalities in preventing sarcopenia. J Transl Med. (2021) 19:71. doi: 10.1186/s12967-021-02737-1
11. Jayanama, K , Theou, O , Godin, J , Cahill, L , Shivappa, N , Hébert, JR, et al. Relationship between diet quality scores and the risk of frailty and mortality in adults across a wide age spectrum. BMC Med. (2021) 19:64. doi: 10.1186/s12916-021-01918-5
12. Ghosh, TS , Rampelli, S , Jeffery, IB , Santoro, A , Neto, M , Capri, M, et al. Mediterranean diet intervention alters the gut microbiome in older people reducing frailty and improving health status: the NU-AGE 1-year dietary intervention across five European countries. Gut. (2020) 69:1218–28. doi: 10.1136/gutjnl-2019-319654
13. Almeida, HM , Sardeli, AV , Conway, J , Duggal, NA , and Cavaglieri, CR . Comparison between frail and non-frail older adults’ gut microbiota: A systematic review and meta-analysis. Ageing Res Rev. (2022) 82:101773. doi: 10.1016/j.arr.2022.101773
14. Mijnarends, DM , Schols, JMGA , Meijers, JMM , Tan, FES , Verlaan, S , Luiking, YC, et al. Instruments to assess sarcopenia and physical frailty in older people living in a community (care) setting: similarities and discrepancies. J Am Med Dir Assoc. (2015) 16:301–8. doi: 10.1016/j.jamda.2014.11.011
15. Chen, LK , Woo, J , Assantachai, P , Auyeung, TW , Chou, MY , Iijima, K, et al. Asian working Group for Sarcopenia: 2019 consensus update on sarcopenia diagnosis and treatment. J Am Med Dir Assoc. (2020) 21:300–307.e2. doi: 10.1016/j.jamda.2019.12.012
16. Donini, LM , Busetto, L , Bischoff, SC , Cederholm, T , Ballesteros-Pomar, MD , Batsis, JA, et al. Definition and diagnostic criteria for Sarcopenic obesity: ESPEN and EASO consensus statement. Obes Facts. (2022) 15:321–35. doi: 10.1159/000521241
17. Xu, L , Zhang, J , Shen, S , Hong, X , Zeng, X , Yang, Y, et al. Association between body composition and frailty in elder inpatients. Clin Interv Aging. (2020) 15:313–20. doi: 10.2147/CIA.S243211
18. Yuan, L , Chang, M , and Wang, J . Abdominal obesity, body mass index and the risk of frailty in community-dwelling older adults: a systematic review and meta-analysis. Age Ageing. (2021) 50:1118–28. doi: 10.1093/ageing/afab039
19. Zinn, SL . Body size and habitus. Clinical methods: The history, physical, and laboratory examinations. 3rd ed. Boston: Butterworths (1990).
20. National Health Interview Survey . (2023). Available at: https://www.cdc.gov/nchs/nhis/index.htm.
21. World Health Organization . Global strategy to reduce the harmful use of alcohol. Geneva: World Health Organization (2010). 38 p.
22. World Health Organization . Global recommendations on physical activity for healt. Geneva: World Health Organization (2010). 56 p.
23. Tian, T , Zhang, J , Zhu, Q , Xie, W , Wang, Y , and Dai, Y . Predicting value of five anthropometric measures in metabolic syndrome among Jiangsu Province, China. BMC Public Health. (2020) 20:1317. doi: 10.1186/s12889-020-09423-9
24. Zhang, J , Fang, L , Qiu, L , Huang, L , Zhu, W , and Yu, Y . Comparison of the ability to identify arterial stiffness between two new anthropometric indices and classical obesity indices in Chinese adults. Atherosclerosis. (2017) 263:263–71. doi: 10.1016/j.atherosclerosis.2017.06.031
25. Christakoudi, S , Tsilidis, KK , Muller, DC , Freisling, H , Weiderpass, E , Overvad, K, et al. A body shape index (ABSI) achieves better mortality risk stratification than alternative indices of abdominal obesity: results from a large European cohort. Sci Rep. (2020) 10:14541. doi: 10.1038/s41598-020-71302-5
26. Calderón-García, JF , Roncero-Martín, R , Rico-Martín, S , de Nicolás-Jiménez, JM , López-Espuela, F , Santano-Mogena, E, et al. Effectiveness of body roundness index (BRI) and a body shape index (ABSI) in predicting hypertension: A systematic review and Meta-analysis of observational studies. Int J Environ Res Public Health. (2021) 18:11607. doi: 10.3390/ijerph182111607
27. Lee, X , Gao, Y , Zhang, Y , Feng, Y , Gao, L , Wang, A, et al. Comparison of 10 obesity-related indices for predicting hypertension based on ROC analysis in Chinese adults. Front Public Health. (2022) 202:10–1. doi: 10.1016/j.puhe.2021.01.009
28. Krakauer, NY , and Krakauer, JC . Untangling waist circumference and hip circumference from body mass index with a body shape index, hip index, and anthropometric risk Indicator. Metab Syndr Relat Disord. (2018) 16:160–5. doi: 10.1089/met.2017.0166
29. Chinese Center for Disease Control and Prevention . Anthropometric methods for population health monitoring. (2015). Available at: https://www.chinacdc.cn/jkzt/yyhspws/xzdc/201501/t20150116_109924.html.
30. Kruizenga, HM , Seidell, JC , De Vet, HCW , Wierdsma, NJ , and Van Bokhorst–de van der Schueren, MAE . Development and validation of a hospital screening tool for malnutrition: the short nutritional assessment questionnaire (SNAQ©). Clin Nutr. (2005) 24:75–82. doi: 10.1016/j.clnu.2004.07.015
31. Dietary Guidelines for Chinese Residents . (2016). Available at: http://dg.cnsoc.org/article/2016b.html.
32. Fried, LP , Tangen, CM , Walston, J , Newman, AB , Hirsch, C , Gottdiener, J, et al. Frailty in older adults: evidence for a phenotype. J Gerontol. (2001) 56:M146–57. doi: 10.1093/gerona/56.3.M146
33. Vakrinou, A , Murphy, E , Sisodiya, SM , Vivekananda, U , and Balestrini, S . Risk factors and outcome of hyperammonaemia in people with epilepsy. J Neurol. (2022) 269:6395–405. doi: 10.1007/s00415-022-11304-7
34. Liang, J , Wang, L , Song, S , Dong, M , Xu, Y , Zuo, X, et al. Quality and audience engagement of Takotsubo syndrome–related videos on TikTok: content analysis. J Med Internet Res. (2022) 24:e39360. doi: 10.2196/39360
35. Campillo, JT , Hemilembolo, MC , Pion, SDS , Lebredonchel, E , Dupasquier, V , Boullé, C, et al. Association between blood Loa loa microfilarial density and proteinuria levels in a rural area of the republic of Congo (the MorLo project): a population-based cross-sectional study. Lancet Microb. (2023) 2023:142. doi: 10.1016/S2666-5247(23)00142-8
36. Kasza, J , and Wolfe, R . Interpretation of commonly used statistical regression models. Respirology. (2014) 19:14–21. doi: 10.1111/resp.12221
37. Zhao, DX , Gootee, E , and Johansen, MC . Atrial cardiopathy is associated with cerebral microbleeds in ischemic stroke patients. Front Neurol. (2022) 13:982926. doi: 10.3389/fneur.2022.982926
38. Clegg, A , Young, J , Iliffe, S , Rikkert, MO , and Rockwood, K . Frailty in elderly people. Lancet. (2013) 381:752–62. doi: 10.1016/S0140-6736(12)62167-9
39. Rockwood, K , Fox, RA , Stolee, P , Robertson, D , and Beattie, BL . Frailty in elderly people: an evolving concept. CMAJ. Can Med Assoc J. (1994) 150:489–95.
40. O’Caoimh, R , Sezgin, D , O’Donovan, MR , Molloy, DW , Clegg, A , Rockwood, K, et al. Prevalence of frailty in 62 countries across the world: a systematic review and meta-analysis of population-level studies. Age Ageing. (2021) 50:96–104. doi: 10.1093/ageing/afaa219
41. Tian, P , Yang, N , Hao, Q , and Peng, Z . A systematic review of the prevalence of frailty in the elderly in China. Chin J Evid Based Med. (2019) 19:656–64. doi: 10.1007/s12603-019-1179-9
42. Li, G , Thabane, L , Papaioannou, A , Ioannidis, G , Levine, MAH , and Adachi, JD . An overview of osteoporosis and frailty in the elderly. BMC Musculoskelet Disord. (2017) 18:46. doi: 10.1186/s12891-017-1403-x
43. Picca, A , Coelho-Junior, HJ , Calvani, R , Marzetti, E , and Vetrano, DL . Biomarkers shared by frailty and sarcopenia in older adults: A systematic review and meta-analysis. Ageing Res Rev. (2022) 73:101530. doi: 10.1016/j.arr.2021.101530
44. Wu, S , Yang, Z , Liu, S , Zhang, Q , Zhang, S , and Zhu, S . Frailty status and risk of irritable bowel syndrome in middle-aged and older adults: a large-scale prospective cohort study. EClinicalMedicine. (2023) 56:101807. doi: 10.1016/j.eclinm.2022.101807
45. Sternberg, SA , Schwartz, AW , Karunananthan, S , Bergman, H , and Mark, CA . The identification of frailty: A systematic literature review. J Am Geriatr Soc. (2011) 59:2129–38. doi: 10.1111/j.1532-5415.2011.03597.x
46. Mitnitski, AB , Mogilner, AJ , and Rockwood, K . Accumulation of deficits as a proxy measure of aging. Sci World J. 1:323–36. doi: 10.1100/tsw.2001.58
47. Mitnitski, A , Song, X , Skoog, I , Broe, G , Cox, JL , Grunfeld, E, et al. Relative fitness and frailty of elderly men and women in developed countries and their relationship with mortality. J Am Geriatr Soc. (2005) 53:2184–9. doi: 10.1111/j.1532-5415.2005.00506.x
48. Searle, SD , Mitnitski, A , Gahbauer, EA , Gill, TM , and Rockwood, K . A standard procedure for creating a frailty index. BMC Geriatr. (2008) 8:24. doi: 10.1186/1471-2318-8-24
49. Davis, DHJ , Rockwood, MRH , Mitnitski, AB , and Rockwood, K . Impairments in mobility and balance in relation to frailty. Arch Gerontol Geriatr. (2011) 53:79–83. doi: 10.1016/j.archger.2010.06.013
50. Lau, S , Pek, K , Chew, J , Lim, JP , Ismail, NH , Ding, YY, et al. The simplified nutritional appetite questionnaire (SNAQ) as a screening tool for risk of malnutrition: optimal cutoff, factor structure, and validation in healthy community-dwelling older adults. Nutrients. (2020) 12:2885. doi: 10.3390/nu12092885
51. Sadjapong, U , Yodkeeree, S , Sungkarat, S , and Siviroj, P . Multicomponent exercise program reduces frailty and inflammatory biomarkers and improves physical performance in community-dwelling older adults: A randomized controlled trial. Int J Environ Res Public Health. (2020) 17:3760. doi: 10.3390/ijerph17113760
52. Rietman, ML , van der A, DL , van Oostrom, SH , Picavet, HSJ , Dollé, MET , van Steeg, H, et al. The association between BMI and different frailty domains: A U-shaped curve? J Nutr Health Aging. (2018) 22:8–15. doi: 10.1007/s12603-016-0854-3
53. World Obesity Federation. World Obesity Atlas (2023). Available at: https://www.worldobesity.org/resources/resource-library/world-obesity-atlas-2023.
54. Pan, XF , Wang, L , and Pan, A . Epidemiology and determinants of obesity in China. Lancet Diabetes Endocrinol. (2021) 9:373–92. doi: 10.1016/S2213-8587(21)00045-0
55. Cooper, C , Fielding, R , Visser, M , van Loon, LJ , Rolland, Y , Orwoll, E, et al. Tools in the assessment of sarcopenia. Calcif Tissue Int. (2013) 93:201–10. doi: 10.1007/s00223-013-9757-z
56. Newman, AB , Kupelian, V , Visser, M , Simonsick, E , Goodpaster, B , Nevitt, M, et al. Sarcopenia: alternative definitions and associations with lower extremity function. J Am Geriatr Soc. (2003) 51:1602–9. doi: 10.1046/j.1532-5415.2003.51534.x
57. Feingold, KR . Obesity and dyslipidemia. Feingold, KR , Anawalt, B , Blackman, MR , Boyce, A , Chrousos, G , and Corpas, E , Endotext. South Dartmouth, MA: MDText COM, Inc. (2020).
58. Batsis, JA , and Villareal, DT . Sarcopenic obesity in older adults: aetiology, epidemiology and treatment strategies. Nat Rev Endocrinol. (2018) 14:513–37. doi: 10.1038/s41574-018-0062-9
59. Haufs, MG , and Z-llner, YF . Waist-hip ratio more appropriate than body mass index. Dtsch Arztebl Int. (2020) 117:659–9. doi: 10.3238/arztebl.2020.0659a
60. Price, GM , Uauy, R , Breeze, E , Bulpitt, CJ , and Fletcher, AE . Weight, shape, and mortality risk in older persons: elevated waist-hip ratio, not high body mass index, is associated with a greater risk of death. Am J Clin Nutr. (2006) 84:449–60. doi: 10.1093/ajcn/84.2.449
61. Yusuf, S , Hawken, S , Ôunpuu, S , Bautista, L , Franzosi, MG , Commerford, P, et al. Obesity and the risk of myocardial infarction in 27 000 participants from 52 countries: a case-control study. Lancet. (2005) 366:1640–9. doi: 10.1016/S0140-6736(05)67663-5
62. Choi, J , Ahn, A , Kim, S , and Won, CW . Global prevalence of physical frailty by Fried’s criteria in community-dwelling elderly with National Population-Based Surveys. J Am Med Dir Assoc. (2015) 16:548–50. doi: 10.1016/j.jamda.2015.02.004
63. Almohaisen, N , Gittins, M , Todd, C , Sremanakova, J , Sowerbutts, AM , Aldossari, A, et al. Prevalence of undernutrition, frailty and sarcopenia in community-dwelling people aged 50 years and above: systematic review and Meta-analysis. Nutrients. (2022) 14:1537. doi: 10.3390/nu14081537
64. Xia, L , Dong, F , Gong, H , Xu, G , Wang, K , Liu, F, et al. Association between indices of body composition and abnormal metabolic phenotype in Normal-weight Chinese adults. Int J Environ Res Public Health. (2017) 14:391. doi: 10.3390/ijerph14040391
65. Haapanen, MJ , Mikkola, TM , Kortelainen, L , Jylhävä, J , Wasenius, NS , Kajantie, E, et al. Body composition in late midlife as a predictor of accelerated age-associated deficit-accumulation from late midlife into old age: A longitudinal birth cohort study. J Gerontol A Biol Sci Med Sci. 78:980–7. doi: 10.1093/gerona/glac233
66. Nazare, JA , Smith, JD , Borel, AL , Haffner, SM , Balkau, B , Ross, R, et al. Ethnic influences on the relations between abdominal subcutaneous and visceral adiposity, liver fat, and cardiometabolic risk profile: the international study of prediction of intra-abdominal adiposity and its relationship with Cardiometabolic risk/intra-abdominal adiposity. Am J Clin Nutr. (2012) 96:714–26. doi: 10.3945/ajcn.112.035758
67. Lear, SA , Humphries, KH , Kohli, S , and Birmingham, CL . The use of BMI and waist circumference as surrogates of body fat differs by ethnicity. Obesity. (2007) 15:2817–24. doi: 10.1038/oby.2007.334
68. Yang, J , Wang, A , Shang, L , Sun, C , Jia, X , Hou, L, et al. Study on the association between dietary habits, patterns and frailty of the elderly: A cross-sectional survey from communities in China. Clin Interv Aging. (2022) 17:1527–38. doi: 10.2147/CIA.S378138
69. Osuka, Y , Kojima, N , Yoshida, Y , Kim, M , Won, CW , Suzuki, T, et al. Exercise and/or dietary varieties and incidence of frailty in community-dwelling older women: A 2-year cohort study. J Nutr Health Aging. (2019) 23:425–30. doi: 10.1007/s12603-019-1166-1
70. Wei, K , Nyunt, MSZ , Gao, Q , Wee, SL , and Ng, TP . Frailty and malnutrition: related and distinct syndrome prevalence and association among community-dwelling older adults: Singapore longitudinal ageing studies. J Am Med Dir Assoc. (2017) 18:1019–28. doi: 10.1016/j.jamda.2017.06.017
71. Sieber, CC . Malnutrition and sarcopenia. Aging Clin Exp Res. (2019) 31:793–8. doi: 10.1007/s40520-019-01170-1
72. Roberts, S , Collins, P , and Rattray, M . Identifying and managing malnutrition, frailty and sarcopenia in the community: A narrative review. Nutrients. (2021) 13:2316. doi: 10.3390/nu13072316
Keywords: frailty, body mass index, waist-hip ratio, body habitus, community adult
Citation: Chen A, Ren L, Min S, Li P, Wei K, Cao J, Tao Y and Lv F (2023) Analysis of the relationship between body habitus and frailty of community adults in Chongqing: a cross-sectional survey study. Front. Public Health. 11:1189173. doi: 10.3389/fpubh.2023.1189173
Edited by:
Marco Carlos Uchida, State University of Campinas, BrazilReviewed by:
Woo Jung Kim, Yonsei University, Republic of KoreaJohn Tshon Yit Soong, National University Hospital, Singapore
Copyright © 2023 Chen, Ren, Min, Li, Wei, Cao, Tao and Lv. This is an open-access article distributed under the terms of the Creative Commons Attribution License (CC BY). The use, distribution or reproduction in other forums is permitted, provided the original author(s) and the copyright owner(s) are credited and that the original publication in this journal is cited, in accordance with accepted academic practice. No use, distribution or reproduction is permitted which does not comply with these terms.
*Correspondence: Su Min, MjAxMzcxQGNxbXUuZWR1LmNu; Feng Lv, bHZmZW5nbWF6dWlAc2luYS5jbg==
†These authors share first authorship