 Po-Keng Cheng1Vinoth Kumar Ponnusamy2,3,4,5
 Karthikeyan Prakasham3Hsin-I Huang6Wan-Ting Chang6
 Po-Chin Huang3,6,7*
- 1Department of Finance and Cooperative Management, National Taipei University, New Taipei City, Taiwan
- 2Department of Medicinal and Applied Chemistry, Kaohsiung Medical University, Kaohsiung City, Taiwan
- 3Research Center for Precision Environmental Medicine, and Ph.D. Program in Environmental and Occupational Medicine, College of Medicine, Kaohsiung Medical University, Kaohsiung City, Taiwan
- 4Department of Chemistry, National Sun Yat-Sen University, Kaohsiung City, Taiwan
- 5Department of Medical Research, Kaohsiung Medical University Hospital (KMUH), Kaohsiung City, Taiwan
- 6National Institute of Environmental Health Sciences, National Health Research Institutes, Miaoli, Taiwan
- 7Department of Medical Research, China Medical University Hospital, China Medical University, Taichung, Taiwan
School-age children living near large petrochemical factories may be at high risk of exposure to benzene released during manufacturing processes. We aimed to investigate the urinary concentrations of trans, trans-muconic acid (t,t-MA) in school-age children living near a petrochemical complex and to estimate their cumulative risk of benzene exposure. We examined an established cohort (Taiwan Petrochemical Complex Cohort for Children, TPE3C) of school-age children (aged 6–13 years) who lived near large petrochemical factories in central Taiwan between October 2013 and September 2014. The cohort comprised 297 children from five elementary schools, namely S.-C. Branch (n = 63, school A, ~0.9 km), F.-A. (n = 51, school B, ~2.7 km), C.-T. (n = 63, school C, ~5.5 km), M.-L. (n = 54, school D, ~6.9 km), and L.-F. (n = 66, school E, ~8.6 km). We analyzed the urinary t,t-MA levels of each participant and estimated their daily intake of benzene. We also performed multiple regression analysis to investigate potential risk factors for a high urinary t,t-MA level in the study cohort. The median urinary t,t-MA levels and median estimated benzene daily intake of the children from each school were as follows: school A, 64.07 ng/mL, 11.13 μg/kg/day; school B, 61.01 ng/mL, 15.32 μg/kg/day; school C, 59.38 ng/mL, 14.81 μg/kg/day; school D, 42.35 ng/mL, 11.67 μg/kg/day; school E, undetected, 0.14 μg/kg/day. The distance between a school and a petrochemical complex (greater distance: β = −0.26, 95% confidence interval [CI] = −0.52 to 0.00, p = 0.053), and the age of the children (older age: β = −3.44, 95% CI = −5.90 to −1.46, p < 0.001) were identified as potential risk factors. After confounders were adjusted for, the creatinine adjusted urinary t,t-MA levels of the school-age children tended to be lower when the distance between their school and a petrochemical complex was greater.
1. Introduction
Benzene (molecular formula, C6H6) is a colorless, highly flammable, and toxic chemical compound. It forms naturally in crude oil and coal tar, and it is also a byproduct of incomplete organic matter combustion. Benzene is used in various industrial processes, such as the production of lubricants, plastics, rubber products, dyes, and synthetic fibers. Additionally, benzene is present in substances such as gasoline, paints, solvents, and cigarette smoke, and it is released into the environment through industrial activities such as oil refinement and manufacturing.
Benzene is widely recognized as a human carcinogen that can lead to various health conditions, including leukemia, anemia, and central nervous system damage. International agencies have classified benzene as a Group 1 human carcinogen (IARC) because it is associated with an increased risk of leukemia and blood disorders such as aplastic anemia or myelodysplastic syndrome among individuals with high exposure to benzene [(1, 2)]. Furthermore, acute symptoms associated with high occupational exposure to benzene include dizziness, headache, and nausea (3).
The main sources of benzene exposure are occupational exposure, environmental exposure, and tobacco smoke. Exposure to benzene can occur through inhalation, ingestion, or skin contact, with inhalation being the most common route (4, 5). Benzene in air may originate from various sources, including motor vehicle exhaust, industrial emissions, tobacco smoking, gasoline vapor, or the burning of coal, oil, or wood (6). People can also be exposed to benzene through ingestion, such as by drinking water contaminated with benzene. Additionally, benzene can be absorbed through the skin, although this is an uncommon route of exposure.
Accurately determining the dosage absorbed by a benzene-exposed population is crucial for accurately assessing the health effects of benzene exposure. After benzene is absorbed, it is metabolized in the body to form benzene oxide, which is then converted in the liver and lungs to either trans, trans-muconic acid (t,t-MA) or S-phenylmercapturic acid (SPMA) (7). Because the most frequently used biomarkers for determining occupational benzene exposure are t,t-MA and SPMA (8–10), we used t,t-MA and SPMA as the biomarkers for assessing benzene exposure in the present study.
Few studies have investigated specific populations who are susceptible to benzene exposure, especially children. Individuals who live near to or downwind from production facilities may be exposed to atmospheric levels of benzene that are higher than the ambient background level. Therefore, the objective of the present study was to use t,t-MA and SPMA as biomarkers to investigate whether the benzene exposure of elementary school students decreases when their elementary school was located farther away from a nearby petrochemical complex.
2. Materials and methods
2.1. Ethics statement
The Institutional Review Board of the National Health Research Institutes approved the study protocol (Nos. EC1020607 and EC1110122) of the present study. Prior to study enrollment, informed consent was obtained from all child participants and their parents.
2.2. Participants and study design
We examined a well-established cohort (Taiwan Petrochemical Complex Cohort for Children, TPE3C) of school-age children (6–13 years old) who lived close to vinyl chloride monomer (VCM) and polyvinyl chloride (PVC) factories located within a petrochemical complex in Yunlin County, Taiwan, between October 2013 and September 2014 [(11–13)]. In total, 344 children were enrolled from five elementary schools: Syu-Cuo Branch (n = 69, school A, ~0.9 km), Feng-An (n = 59, school B, ~2.7 km), Ciao-Tou (n = 67, school C, ~5.5 km), Mai-Liao (n = 75, school D, ~6.9 km), and Lung-Feng (n = 74, school E, ~8.6 km) (see Figure 1). Each student was randomly matched by gender on the basis of their school identification number. A student was eligible for inclusion if they were in grade 1–6 of elementary school, had been living at their reported place of residence for at least 1 year, and were aged ≥6 years. In accordance with the guidelines of the World Health Organization (WHO), we excluded children who had urinary creatinine concentrations of <30 mg/dL or > 300 mg/dL as determined through valid urine samples [n = 20; (14)]. Children who consumed vitamin B complexes less than 1 week before the start of the study (n = 5) or those who had chronic hepatitis B or C (n = 1) infection were excluded. We also excluded children with insufficient biochemistry data (n = 21). After the aforementioned inclusion and exclusion criteria were applied, 297 children were enrolled as participants in the present study.
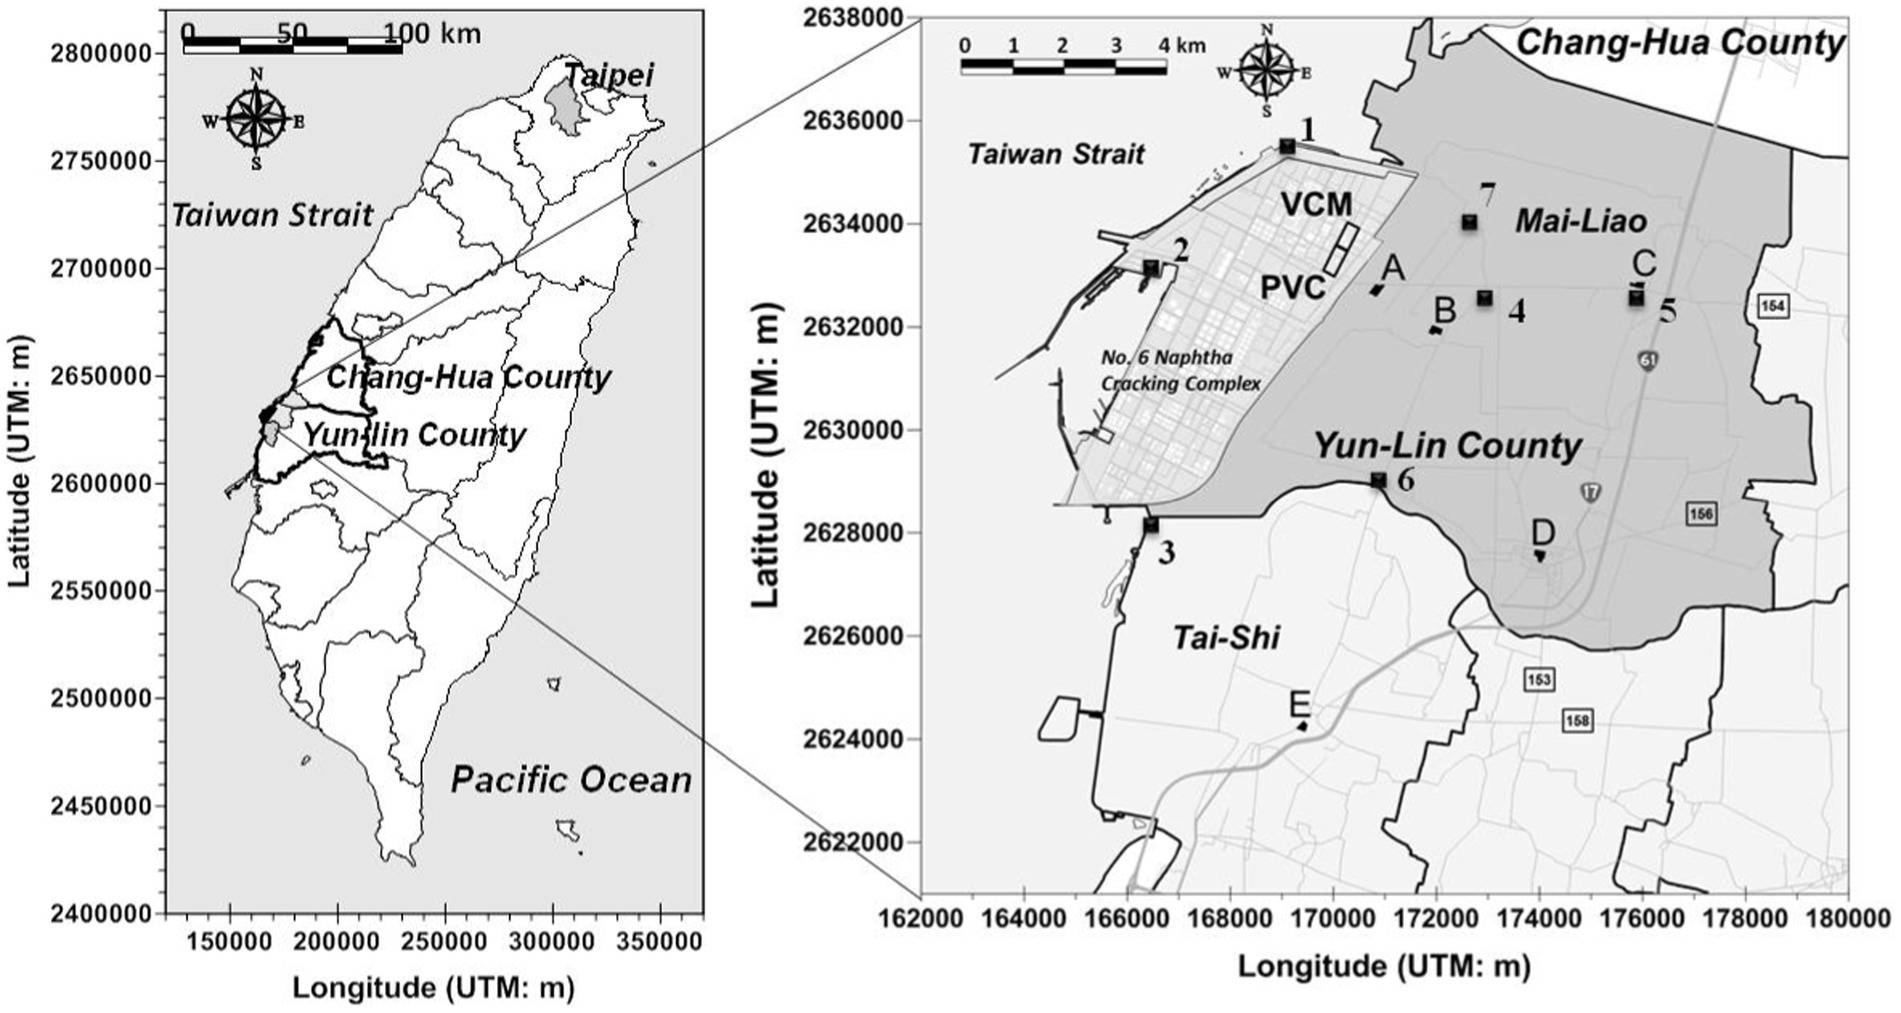
Figure 1. Locations of air VOCs monitoring sites insides (1 ~ 3) and outsides (4 ~ 7) a petrochemical complex (No. 6 Naphtha Cracking Complex) in central Taiwan. The air monitoring data was measured by local EPA of Yun-Lin County, Taiwan during May 2012 to June 2014.
2.3. Sample collection
Our sampling occurred between October 2013 and September 2014. We have described the details in our previous published articles (11–13, 15). Briefly, the sampling dates for each school were as follows: A (October 16, 2013), B (November 16, 2013), C (March 5, 2014), D (April 9, 2014), and E (September 24, 2014). On Wednesday morning, each participant had their first-morning urine sample (< 60 mL) collected using a plastic urine bag (PP), which was then immediately transferred into an amber glass bottle and stored at −80°C.
2.4. Analytical method for trans, trans-muconic acid
We employed an established method (16) to analyze all samples. In brief, analytical grade standard analytes, such as SPMA, D5-S-phenylmercapturic acid, and D4-t,t-Muconic acid, were purchased from Toronto Research Chemicals, Canada, and Thiodiglycolic acid and t,t-muconic acid (TTMA) were purchased from Alfa Aesar (MA, United States). Ultra-high liquid chromatography with tandem mass spectrometry was performed using a Shimadzu UHPLC–MS/MS system (Shimadzu, Kyoto, Japan) with a low-pressure gradient mixer that was equipped with a quaternary pump (Model: Nexera I 2040) and had an autosampler capacity of 20 μL (injector loop). The mass spectrometer was coupled with a mixed-mode ESI source (8,045 LCMS). Liquid chromatography–mass spectrometry and the processing of results were performed using LabSolutions software (Version 2.6). Chromatographic separation was achieved at 35°C on a C18 column (150 mm × 4.6 mm I.D.; particle size, 2.7 μm; sun shell brand) in an oven. Chromatographic analysis was conducted in gradient mode and initiated with a mobile phase at an 80:20 concentration ratio (A [0.1% formic acid in water] to B [methanol]) for 3.5 min. During the second step, the ratio was changed to 35:65 and kept constant for approximately 4.0 min. During the third step, the ratio was changed to 25:75 over 5 min and kept constant for 6 min (6.1 to 9 min). For the entirety of the analysis process, the flow rate was set to 0.4 mL min−1 with a pretreated-sample injection volume of 3 μL. To measure five internal standards and their corresponding internal standards, ESI-MS/MS parameters were optimized in a negative multiple-reaction monitoring mode. A novel fast-urinary-metabolites-extraction technique was employed to perform urine sample pretreatment by using two syringes in tandem in a liquid–liquid microextraction (LLME) and micro solid-phase extraction (μSPE) setup. Subsequently, 0.5 mL of urine sample was spiked with 20 μL of internal standard solution; 1 mL acidified methanol (using 0.1% formic acid pH 3) was then added as an extraction solvent in the LLME extraction syringe setup, and the resulting mixture was vortexed for 2 min. During the second step, the LLME setup was connected to a μSPE syringe, which was prepacked with a top layer comprising 500-mg anhydrous MgSO4 between the two frits (top and the middle). In the second layer, 50 mg of C18 and SiO2 were added between the middle and bottom frits. During the third step, the LLME and μSPE setups were placed in an auto-plunging device, the extractant was allowed to pass through the μSPE syringe column at a flow speed of 0.25 mL/min, and the cleaned extractants were collected in a 10-mL glass tube. During the fourth step, the collected extractants obtained after the clean-up process were dried using a high-pressure parallel vacuum evaporator (HPPE-40, GE Tech, Kaohsiung, Taiwan) at 35°C. Finally, the residues were dissolved in 100 μL of methanol for the subsequent UHPLC–MS/MS analysis. The recovery and relative difference percentage of the spiked (1, 5, and 20 ng/mL) and repeated (precision) sample was defined as within ±15% and ± 30%, respectively, for each batch. For low concentration t,t-MA, the quality control accuracy was between 97.9 and 108.0%; and for high concentration t,t-MA, the quality control accuracy was between 96.2 and 107.6%.
2.5. Estimation of daily benzene intake and hazard quotients
We estimated the daily intake (DI) of benzene on the basis of urinary t,t-MA levels. In the formula for calculating the DI of benzene [equation 1; (17–19)], UE is the urinary excretion of the measured urinary metabolites per gram of creatinine; CEsmoothed is the smoothed creatinine excretion rate, which is based on participants’ age, body weight (BW) and height (ht) as well as gender-based values associated with the rate of urinary creatinine excretion (20, 21); FUE is the fractional urinary excretion of benzene [i.e., t,t-MA (3.9%)] levels in humans (18, 22, 23); MWd is the molar weight of benzene (78.1); and MWm is the molar weight of t,t-MA (142.1).
We utilized the hazard quotient (HQ) to calculate each participant’s risk from benzene. The formula for HQ is as follows (17). Reference doses (RfDs) of benzene by the US Environmental Protection Agency (US EPA) is 4 μg/kg/day, by Agency for Toxic Substances and Disease Registry (ATSDR) is 0.5 μg/kg/day, and by Firth (24) is 400 μg/kg/day.
2.6. Statistical analysis
We conducted a Kruskal–Wallis test to compare the urinary t,t-MA and benzene DI levels of the participants from the five elementary schools. We also conducted analysis of covariance (ANCOVA, after adjustment for confounders) and the Jonckheere–Terpstra test to identify the differences in the urinary t,t-MA and benzene DI levels of the participants. In addition, we compared the urinary t,t-MA and SPMA levels of the children in relation to several factors (e.g., passive smoking, home close to main road, and factories within 1 km near living environment) by Mann–Whitney U test. Multiple regression analysis was performed to assess the association between the creatinine-adjusted urinary t,t-MA (μg/g creatinine) levels of the participants and the location of their elementary schools after adjustments were made for several covariates (e.g., age, gender, passive smoking, close proximity of a person’s home to a main road). Creatinine adjusted urinary t,t-MA levels of the participants were natural logarithm transformed to approximate normal distribution. We used school A as a reference and the order of other schools were increased by the increasing distance to the source. We used a girl, non-smoker, never served in petrochemical complex, and home not close to main road as a reference of gender, passive smoking, father’s job, and home close to main road, respectively. We applied stepwise regression in our multiple regression analysis. We also conducted sensitivity analysis using only the children who were not passively exposed to smoking or their fathers were not employed at the petrochemical complex to assess the robustness of the reported associations. All statistical analyses were conducted using R version 4.1.2 (R Foundation for Statistical Computing, Vienna, Austria).
3. Results
3.1. Demographic characteristics of participants
Table 1 lists the demographic characteristics of the study participants. Their mean age and body mass index (BMI) score were 9.8 ± 1.7 years (range, 6.1–12.5 years) and 19.0 ± 4.1 kg/m2 (range, 12.2–32.7 kg/m2), respectively. The participants were evenly balanced in terms of gender (boys, 50.2%), and approximately half of the study participants were from households with annual income of less than US$15,600 (50.5%). Nearly half of the study participants’ fathers were working at a petrochemical complex (48.8%), and approximately 20% of their mothers were working at a petrochemical complex (19.5%). Approximately 80% of the study participants reported a mild-to-moderate physical activity level (80.5%), and 65% of them were exposed to passive smoking.
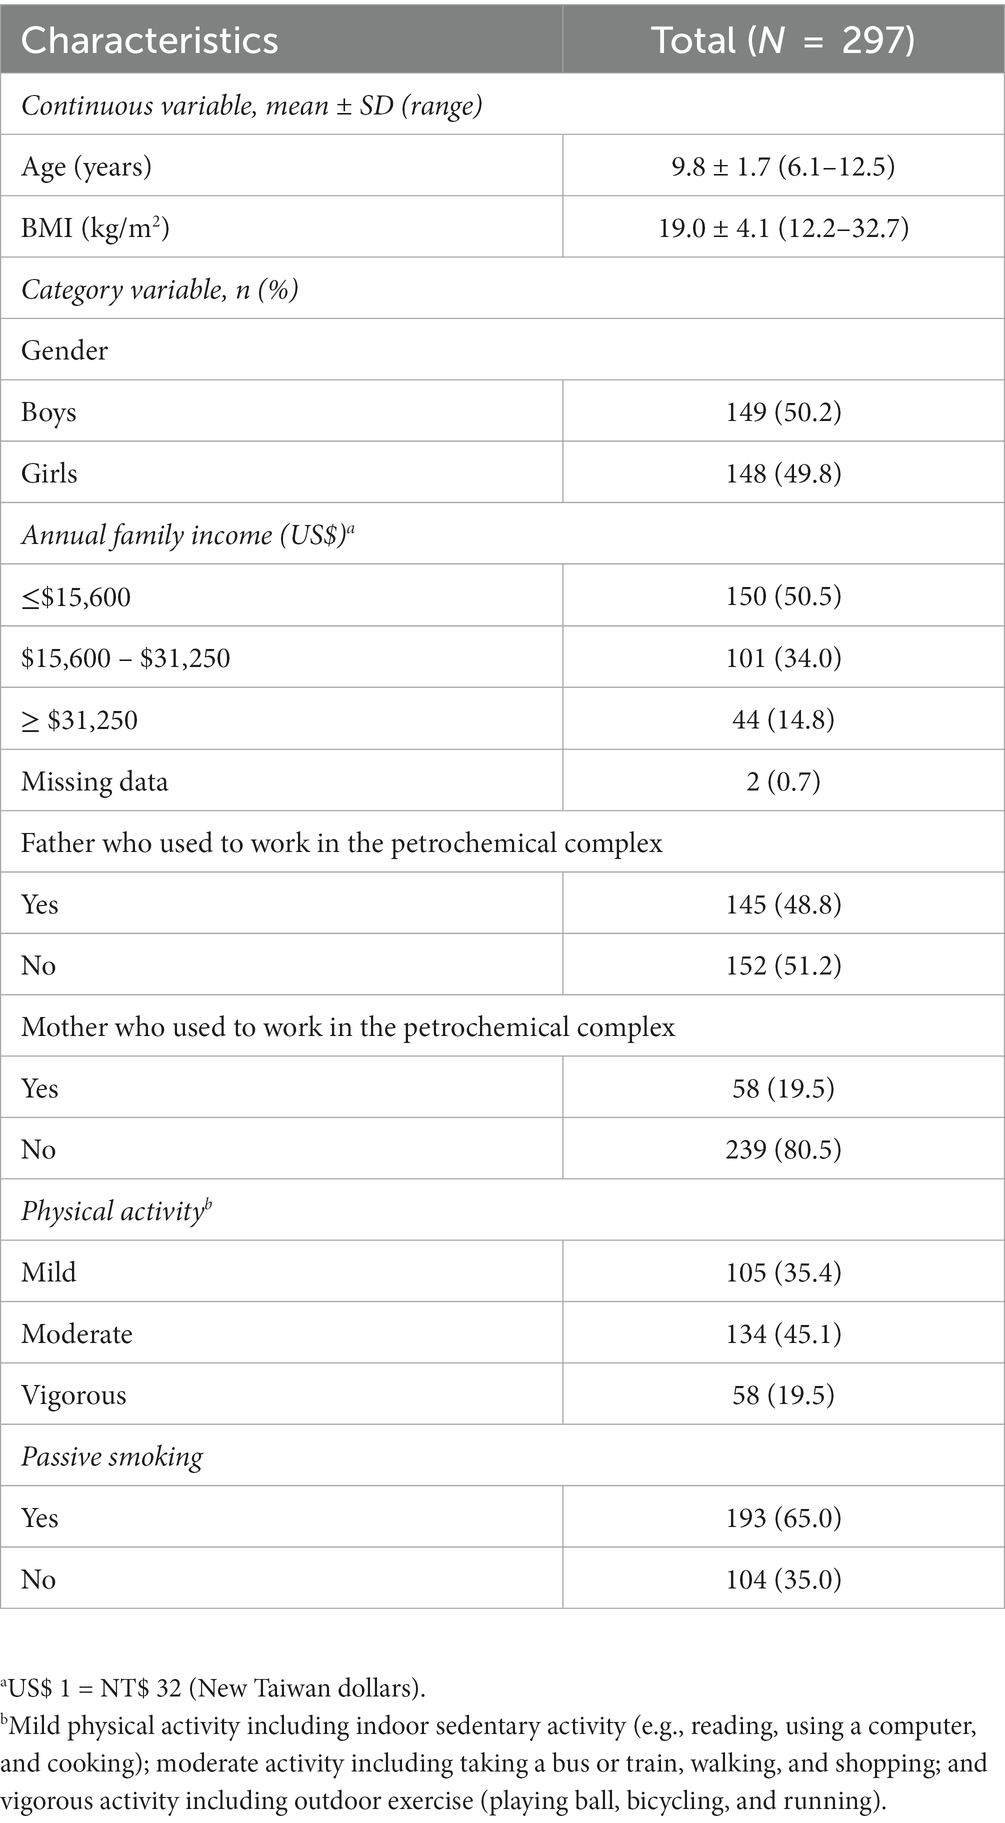
Table 1. Sociodemographic characteristics of the participating children.
3.2. Distributions of urinary trans, trans-muconic acid, and SPMA
The distribution of the urinary t,t-MA results are presented in Table 2. For urinary t,t-MA concentration, the geometric mean (GM) of the study participants from each school was as follows: school A, 12.18 ng/mL; school B, 15.52 ng/mL; school C, 10.45 ng/mL; school D, 7.48 ng/mL; school E, 5.28 ng/mL. The median urinary t,t-MA level of the study participants from each school was as follows: school A, 64.07 ng/mL; school B, 61.01 ng/mL; school C, 59.38 ng/mL; school D, 42.35 ng/mL; school E, ND (not detectable). The detection rate of urinary t,t-MA ranged from 48.5% (school E) to 70.6% (school B), with 0.3 ng/mL being the limit of detection for urinary t,t-MA. The results of the Kruskal–Wallis test did not reveal any significant difference in the median urinary t,t-MA levels of students in the five schools.
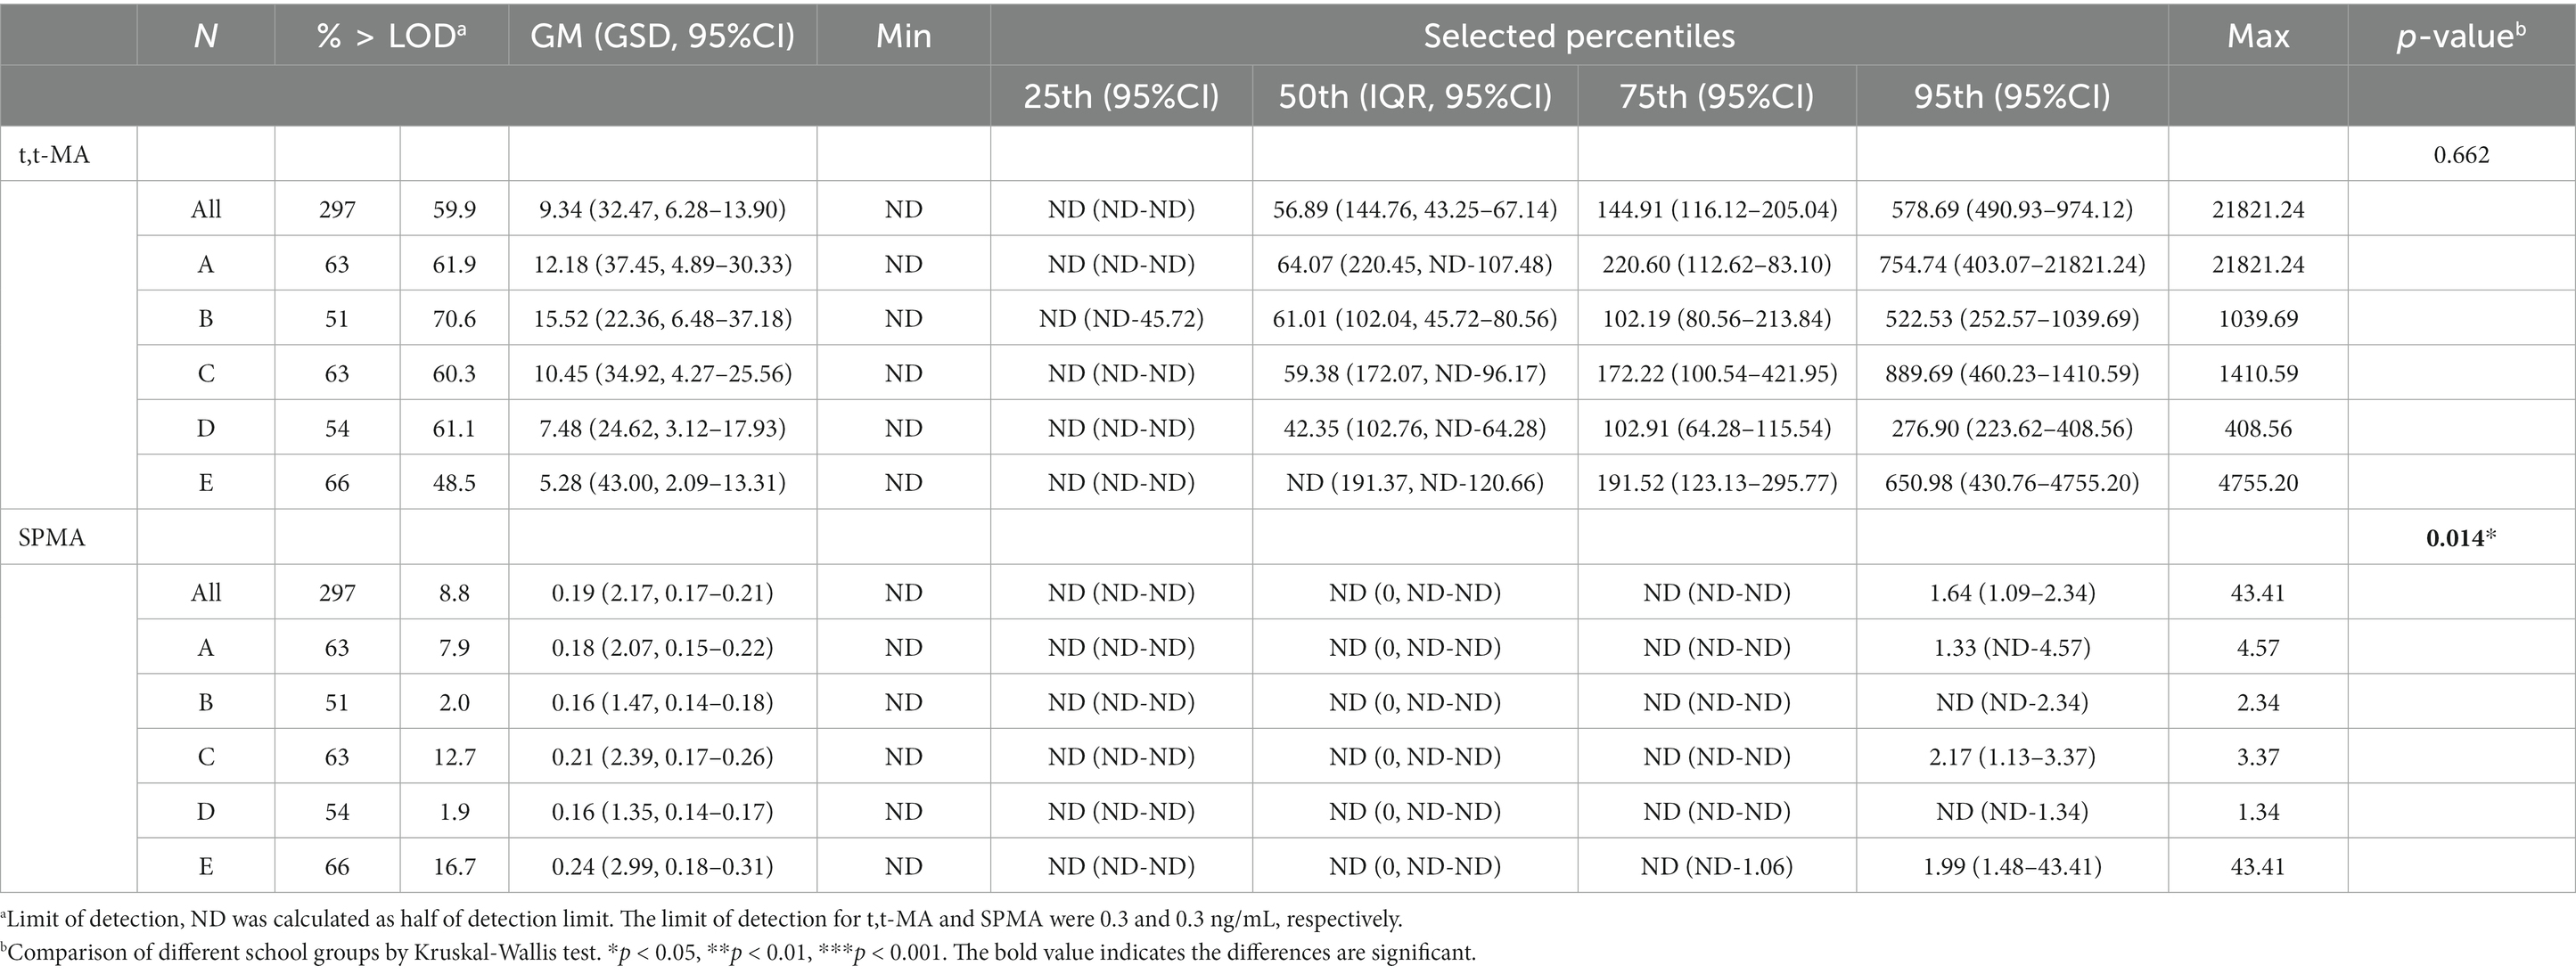
Table 2. Distributions of t,t-MA (ng/mL) and SPMA (ng/mL) in participants by different school groups (N = 297).
The distribution of the urinary SPMA results are presented in Table 2. For urinary SPMA concentration, the GM of the study participants from each school was as follows: school A, 0.18 ng/mL; school B, 0.16 ng/mL; school C, 0.21 ng/mL; school D, 0.16 ng/mL; school E, 0.24 ng/mL. Median urinary SPMA levels were ND (A), ND (B), ND (C), ND (D), and ND (E), respectively. The detection rate for urinary SPMA ranged from 1.9% (school D) to 16.7% (school E), with 0.3 ng/mL being the limit of detection for SPMA. Significant differences in the median urinary SPMA levels of the five schools was identified through the Kruskal–Wallis test.
3.3. Distribution of estimated DI and HQ of benzene
The distribution of the estimated DI of benzene is presented in Table 3. The GM of the estimated benzene DI of the study participants from each school was as follows: school A, 2.96 μg/kg/day; school B, 4.16 μg/kg/day; school C, 2.39 μg/kg/day; school D, 2.01 μg/kg/day; school E, 1.38 μg/kg/day. The median (95th percentile, P95) estimated DI of benzene of the study participants from each school was as follows: school A, 11.13 (275.95) μg/kg/day; school B, 15.32 (95.04) μg/kg/day; school C, 14.81 (112.44) μg/kg/day; school D, 11.67 (40.87) μg/kg/day; school E, 0.14 (234.23) μg/kg/day. The results of the Kruskal–Wallis test did not reveal any significant difference in the estimated DI of benzene in the participants from the five schools.
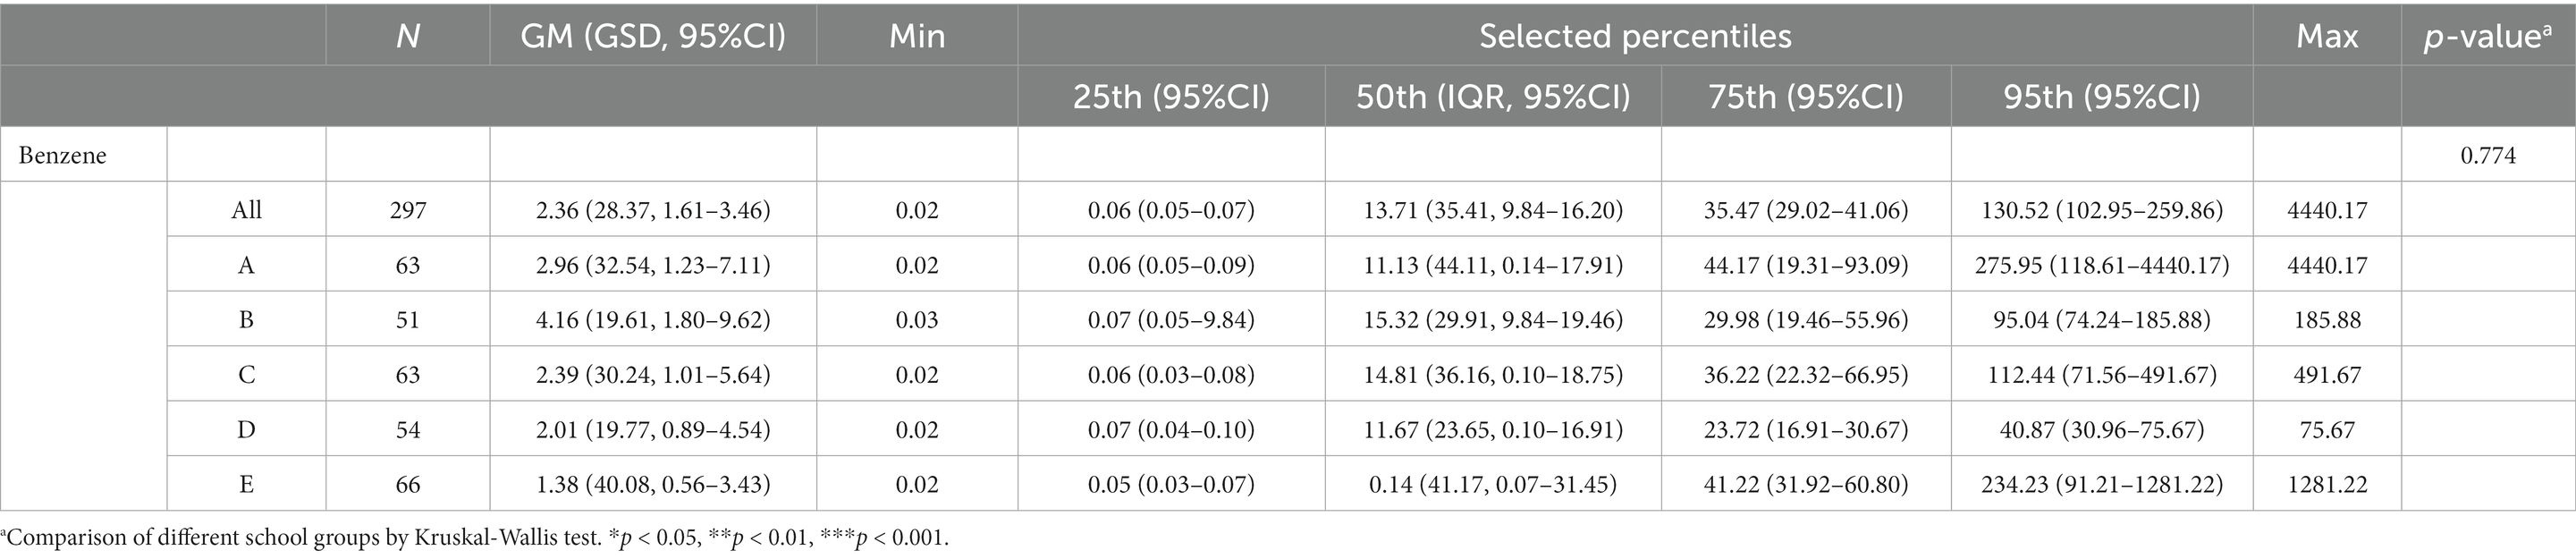
Table 3. Distributions of estimated daily intake (μg/kg/day) for benzene in participants by different school groups (N = 297).
The distribution of the HQ of benzene is presented in Table 4. The median (P95) HQ of benzene with RfD proposed by the US EPA of the study participants from each school was as follows: school A, 2.78 (68.99); school B, 3.83 (23.76); school C, 3.70 (28.11); school D, 2.92 (10.22); school E, 0.03 (58.56). The median (P95) HQ of benzene with RfD proposed by ATSDR of the study participants from each school was as follows: school A, 22.26 (551.91); school B, 30.63 (190.08); school C, 29.63 (224.88); school D, 23.34 (81.73); school E, 0.27 (468.46). The median (P95) HQ of benzene with RfD proposed by Firth (24) of the study participants from each school was as follows: school A, 0.03 (0.69); school B, 0.04 (0.24); school C, 0.04 (0.28); school D, 0.03 (0.10); school E, 0.00 (0.59). We could see that more than half of the children have HQ higher than 1 when the RfDs proposed by the US EPA and ATSDR was applied.
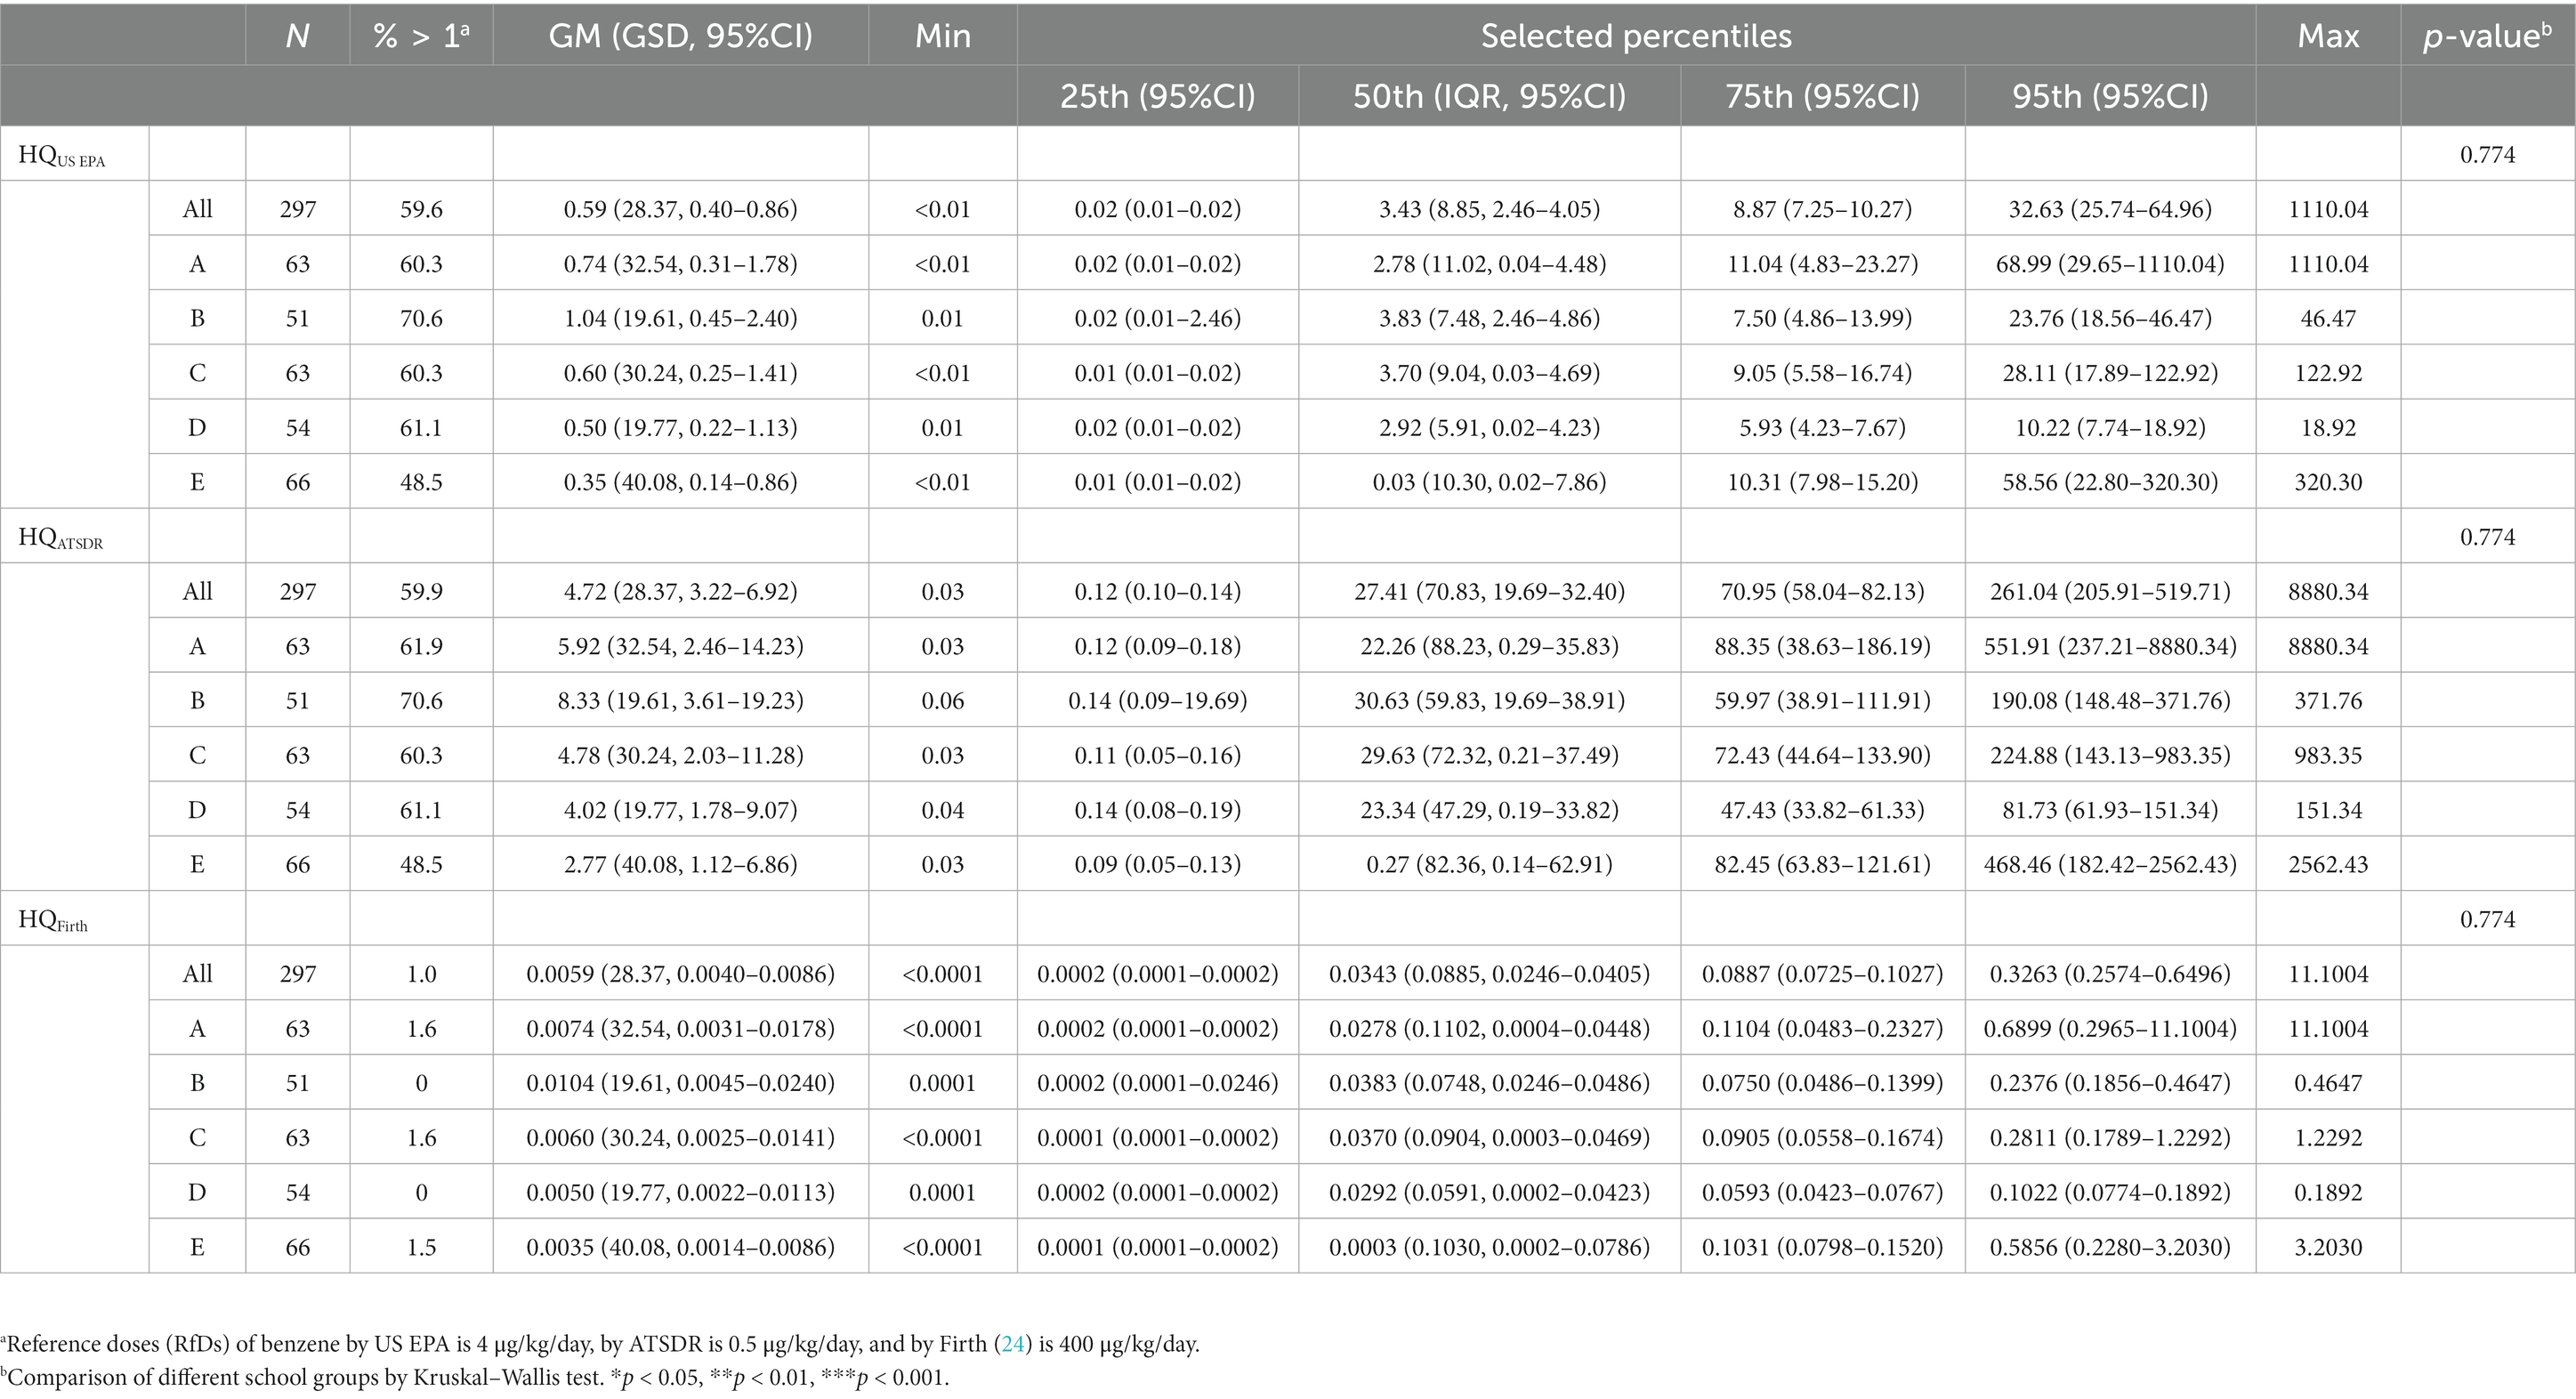
Table 4. Distributions of hazard quotient for benzene in participants by different school groups (N = 297).
3.4. Comparison of urinary trans, trans-muconic acid concentrations, and benzene DI of participants from five schools
Table 5 and Figures 2, 3 compare the urinary t,t-MA levels and estimated benzene DI of the participants from the five elementary schools. After ANCOVA adjustments were made for urinary creatinine, age, gender, passive smoking, BMI, having a father employed at a petrochemical complex, and close proximity of a student’s home to a main road, we could not identify a significant difference among the five schools for mean urinary t,t-MA level and estimated benzene DI; a Jonckheere–Terpstra test also did not reveal any significant difference with respect to these results.
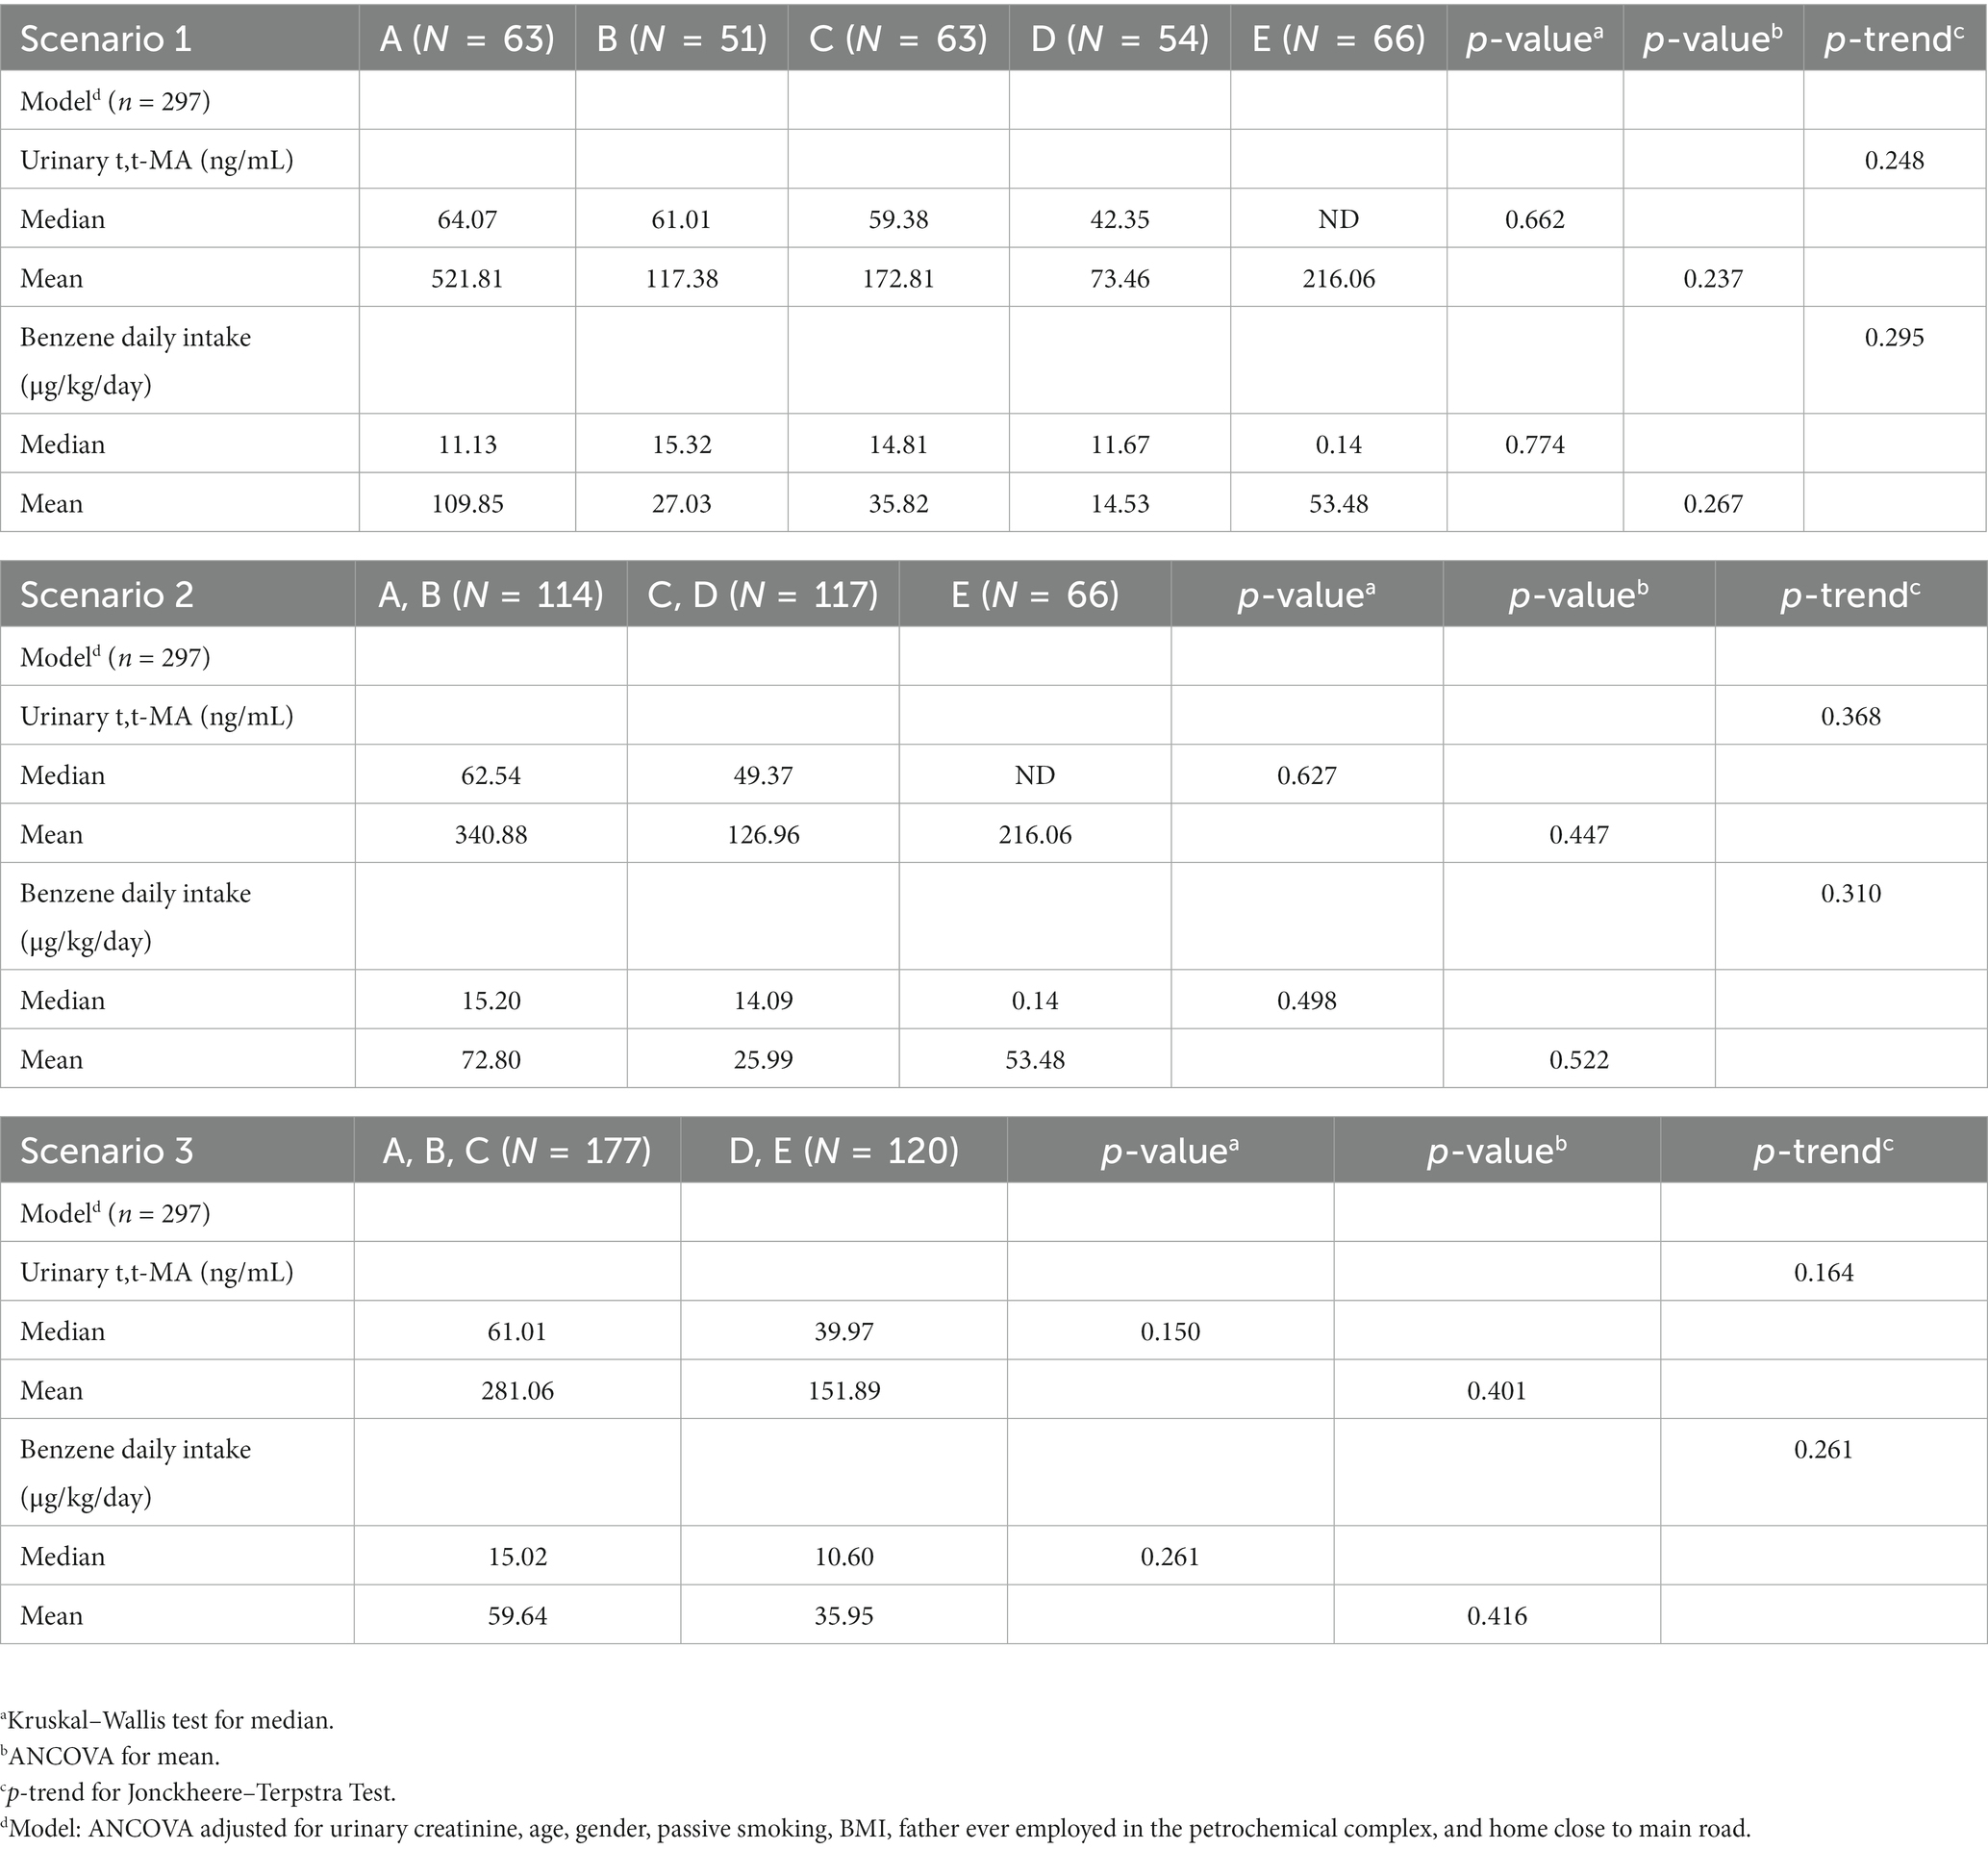
Table 5. Comparison of urinary t,t-MA levels and estimated benzene daily intake for participants (N = 297) from different elementary schools after adjusting for covariance.
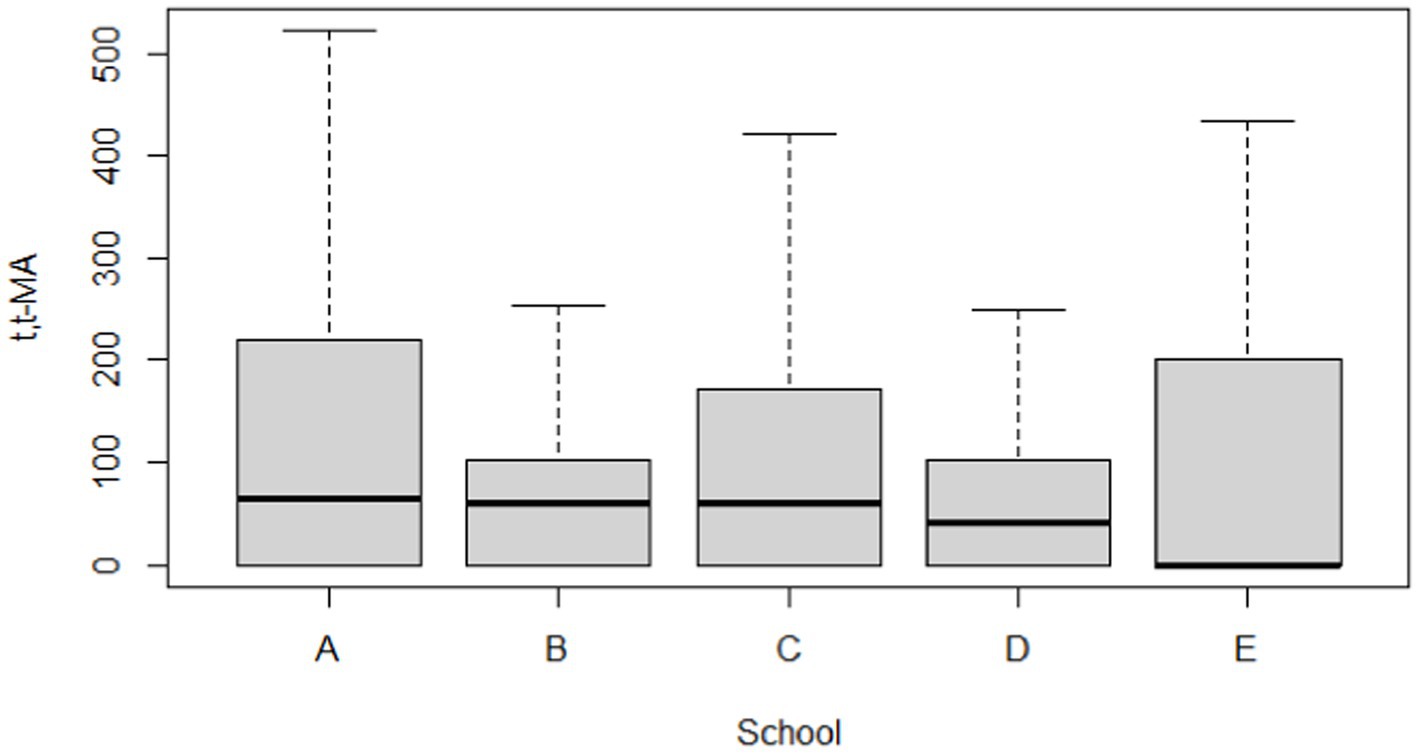
Figure 2. Boxplot of t,t-MA (ng/mL) in participants by different school groups (N = 297).
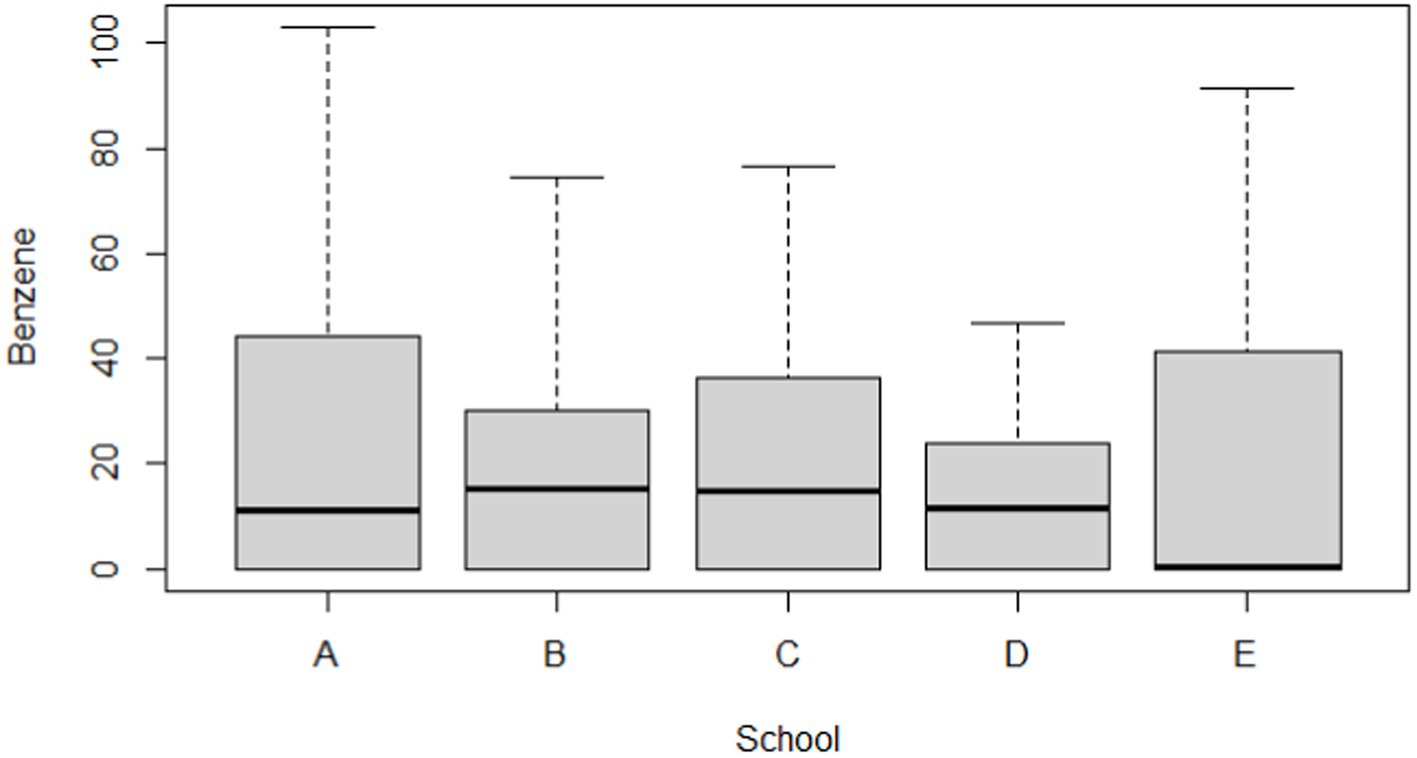
Figure 3. Boxplot of estimated daily intake (μg/kg/day) for benzene in participants by different school groups (N = 297).
3.5. Multiple regression results
Table 6 presents the multiple regression results for the urinary t,t-MA levels of the participants from the five elementary schools after adjustments were made for covariates. We found that the creatinine-adjusted urinary t,t-MA- levels of the participants was marginally significantly and negatively associated with the distance between their school and the closest petrochemical complex after adjustments were made for urinary creatinine, gender, and age (school is located farther away from a nearby petrochemical complex: β = −0.26, 95% CI = −0.52 to 0.00, p = 0.053). In addition, the creatinine-adjusted urinary t,t-MA levels of the participants was significantly and negatively associated with their age (being older: β = −3.44, 95% CI = −5.46 to −1.41, p < 0.001). As for sensitivity analysis, we used only the children who (i) were not passively exposed to smoking and (ii) their fathers were not employed at the petrochemical complex as risk factors to assess the robustness of the reported associations. However, these two factors were all not significant after model adjusted for urinary creatinine (Supplementary Table S5).
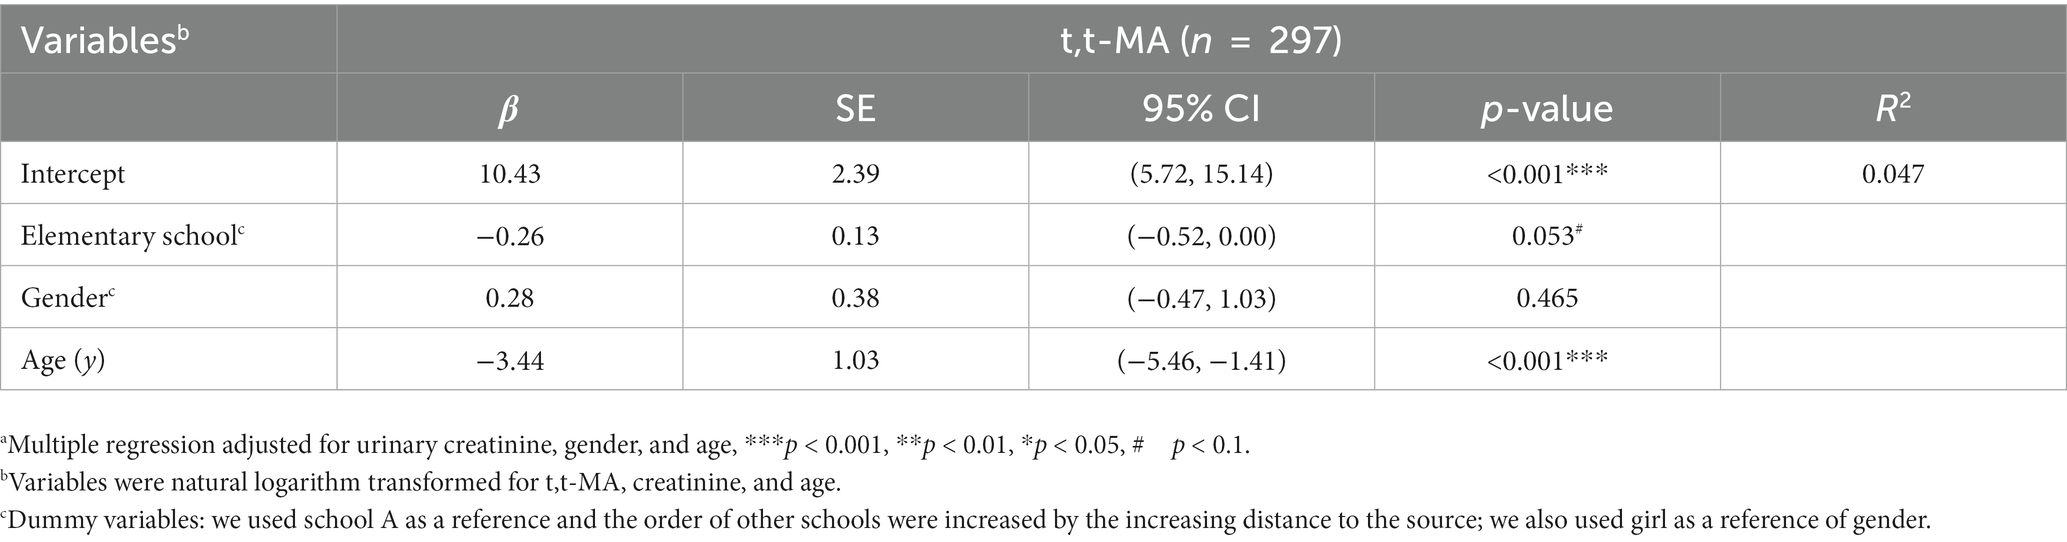
Table 6. Multiple regressiona of urinary t,t-MA levels for the participating students attending 5 elementary schools in central Taiwan (N = 297).
4. Discussion
In the present study, we assessed the urinary t,t-MA and SPMA levels of children from five elementary schools located close to VCM and PVC factories in central Taiwan. After adjustments were made for urinary creatinine, gender and age, the creatinine-adjusted urinary t,t-MA levels of the school-age children were revealed to be marginally significantly higher when the distance between their elementary school and a VCM or PVC factory was shorter.
Cigarette smoke was the main source of benzene exposure for smokers, whereas automobile exhaust or gasoline vapor emissions were the main sources for nonsmokers. Additionally, environmental tobacco smoke also contributed to people’s benzene exposure, with a small portion of the exposure originating from major point sources of benzene, such as petrochemical plants or refineries (6). Therefore, we compared the urinary t,t-MA and SPMA levels of the children in relation to several factors that could increase benzene exposure, and we discovered that the children who lived within 1 km of a VCM or PVC factory had a significantly higher level of benzene exposure (Supplementary Table S6).
The hazard quotient (HQ) refers to the ratio of the potential exposure to a substance to the level at which no adverse effects are expected. An HQ of >1 indicates potential adverse health effects. The HQ of our child participants with respect to benzene exposure was calculated on the basis of various RfDs. When the RfD proposed by the US EPA and ATSDR was applied, more than half of the children were at risk of adverse health effects caused by exposure to benzene (Table 4).
Human biomonitoring is a helpful method for differentiating environmental exposure by age, gender, region, and nationality; it can also generate foundational scientific evidence for developing public health policies. For urinary t,t-MA and SPMA, we compared the medians and P95 levels of populations in the United States (based on data retrieved from NHANES) and Canada (based on data retrieved from CHMS) and discovered that the benzene exposure level of our participants (aged 6–13 years) was close to those of similarly aged populations in the United States and Canada (Table 7). However, our participants were living in suburban area with low traffic, which would imply low benzene exposure from automobile exhaust or gasoline vapor emissions. The similar benzene exposure levels between our participants and similarly aged populations in the United States and Canada indicated that there could be other source of benzene exposure in our participants. Fustinoni et al. (25) reported that personal airborne exposure was a key risk factor for benzene exposure. Tsangari et al. (26) reported that participants living closer to the industrial cluster had higher benzene exposure. Therefore, living close to petrochemical complex could be the possible reason why our participants had high benzene exposure as similarly aged populations in the United States and Canada. Future research would be to determine the sources of benzene exposure from traffic, chemical transport vehicles, and industrial emissions in populations living near petrochemical complex.
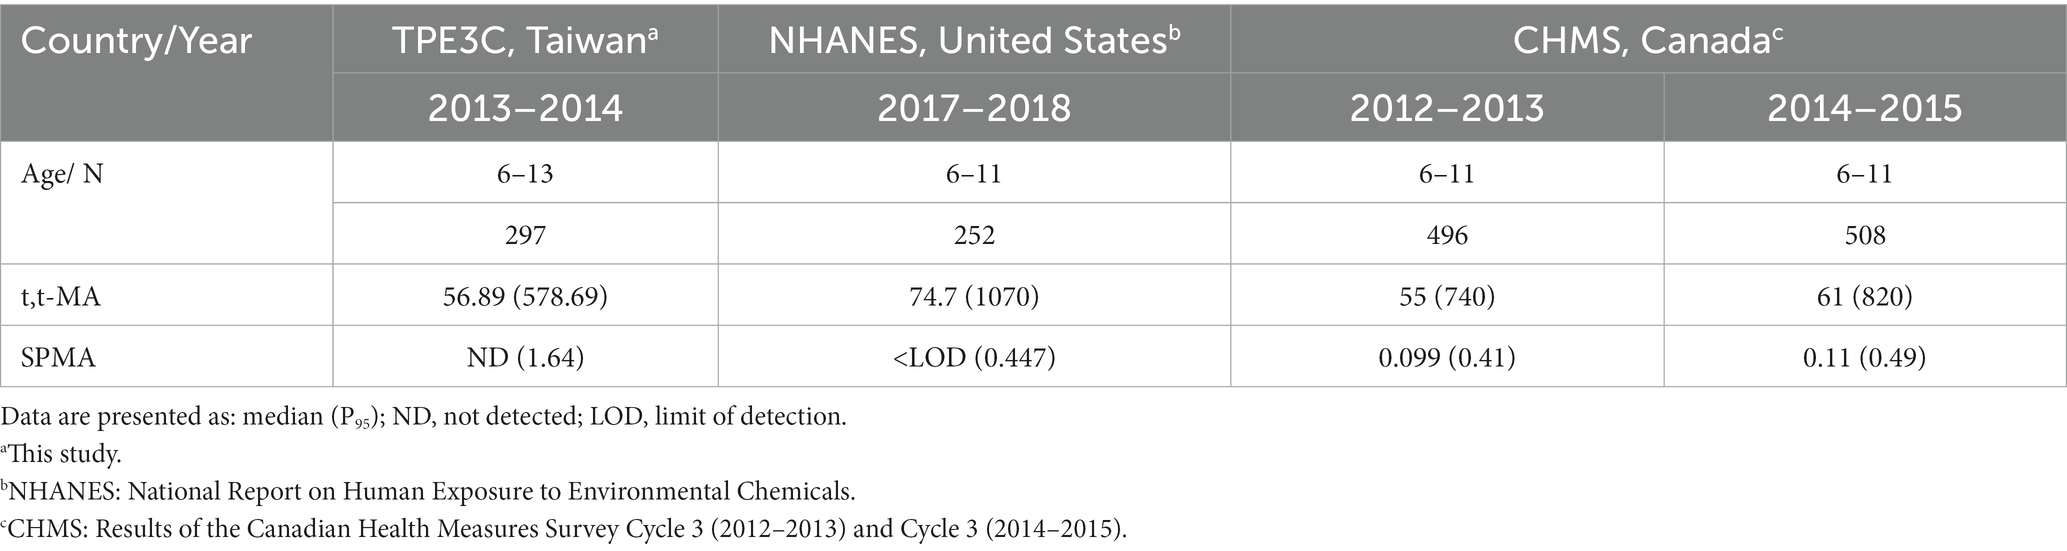
Table 7. Comparison of urinary levels of t,t-MA (μg/L) and SPMA (μg/L) in general population among national surveys.
We collected urine samples from the children to investigate their potential benzene exposure because the results from urine sample analysis can serve as an excellent indicator of recent exposure and the collection of urine samples is noninvasive. However, the present study has several limitations with respect to data interpretation. This was a cross-sectional study. The collected data only reflected the children’s exposure immediately before the survey. In addition, the collection of urine samples was conducted only once.
5. Conclusion
We concluded that most of the children who studied and lived close to a petrochemical complex may have been exposed to benzene. A follow-up study is required to further investigate their levels of benzene exposure and the potential health effects of such exposure.
Data availability statement
The original contributions presented in the study are included in the article/Supplementary material, further inquiries can be directed to the corresponding author.
Ethics statement
The studies involving humans were approved by Institutional Review Board of the National Health Research Institutes. The studies were conducted in accordance with the local legislation and institutional requirements. Written informed consent for participation in this study was provided by the participants’ legal guardians/next of kin.
Author contributions
P-CH: conceptualization, methodology, software, writing – original draft, writing – review and editing, resources, and supervision. V-KP: methodology and writing – review and editing. KP: investigation and writing – review and editing. W-TC and H-IH: investigation and methodology. P-KC: investigation, methodology, and writing – original draft. All authors contributed to the article and approved the submitted version.
Funding
This study was supported by Kaohsiung Municipal Siaogang Hospital, Kaohsiung Medical University, KMHK-H-109-007, KMHK-H-109-003, KMHK-H-110-009, KMHK-S-110-004, MOST 109-2314-B-037-141, MOST 110-2314-B-037-021, and NHRIKMU-111-I004-3. This work was supported partially by the Research Center for Precision Environmental Medicine, Kaohsiung Medical University, Kaohsiung, Taiwan from The Featured Areas Research Center Program within the framework of the Higher Education Sprout Project by the Ministry of Education (MOE) in Taiwan and by Kaohsiung Medical University Research Center Grant (KMU-TC111A01 and KMUTC111IFSP01). The authors thank the National Health Research Institutes for grants: EM-105-PP-16, EM-112-PP-11, NHRIKMU-111-I004-1, and EM-111-SP03.
Conflict of interest
The authors declare that the research was conducted in the absence of any commercial or financial relationships that could be construed as a potential conflict of interest.
Publisher’s note
All claims expressed in this article are solely those of the authors and do not necessarily represent those of their affiliated organizations, or those of the publisher, the editors and the reviewers. Any product that may be evaluated in this article, or claim that may be made by its manufacturer, is not guaranteed or endorsed by the publisher.
Supplementary material
The Supplementary material for this article can be found online at: https://www.frontiersin.org/articles/10.3389/fpubh.2023.1234823/full#supplementary-material
References
1. International Agency for Research on Cancer (IARC, Lyon, France). Overall evaluations of carcinogenicity: an updating of IARC monographs volumes 1 to 42. IARC monographs on the evaluation of carcinogenic risks to humans. Supplement. (1987) 7:120–2.
2. Kim, S, Lan, Q, Waidyanatha, S, Chanock, S, Johnson, BA, Vermeulen, R, et al. Genetic polymorphisms and benzene metabolism in humans exposed to a wide range of air concentrations. Pharmacogenet Genomics. (2007) 17:789–1. doi: 10.1097/FPC.0b013e3280128f77
3. Duarte-Davidson, R, Courage, C, Rushton, L, and Levy, L. Benzene in the environment: an assessment of the potential risks to the health of the population. Occup Environ Med. (2001) 58:2–13. doi: 10.1136/oem.58.1.2
4. Hoet, P, De Smedt, E, Ferrari, M, Imbriani, M, Maestri, L, Negri, S, et al. Evaluation of urinary biomarkers of exposure to benzene: correlation with blood benzene and influence of confounding factors. Int Arch Occup Environ Health. (2009) 82:985–5. doi: 10.1007/s00420-008-0381-6
5. Weisel, CP. Benzene exposure: an overview of monitoring methods and their findings. Chem Biol Interact. (2010) 184:58–6. doi: 10.1016/j.cbi.2009.12.030
6. Wallace, L. Environmental exposure to benzene: an update. Environ Health Perspect. (1996) 104:1129–36.
7. Kim, S, Vermeulen, R, Waidyanatha, S, Johnson, BA, Lan, Q, Rothman, N, et al. Using urinary biomarkers to elucidate dose-related patterns of human benzene metabolism. Carcinogenesis. (2006) 27:772–1. doi: 10.1093/carcin/bgi297
8. Farmer, PB, Kaur, B, Roach, J, Levy, L, Consonni, D, Bertazzi, PA, et al. The use of S-phenylmercapturic acid as a biomarker in molecular epidemiology studies of benzene. Chem Biol Interact. (2005) 153-154:97–2. doi: 10.1016/j.cbi.2005.03.013
9. Fustinoni, S, Consonni, D, Campo, L, Buratti, M, Colombi, A, Pesatori, AC, et al. Monitoring low benzene exposure: comparative evaluation of urinary biomarkers, influence of cigarette smoking, and genetic polymorphisms. Cancer Epidemiol Biomark Prev. (2005) 14:2237–44. doi: 10.1158/1055-9965.EPI-04-0798
10. Qu, Q, Melikian, AA, Li, G, Shore, R, Chen, L, Cohen, B, et al. Validation of biomarkers in humans exposed to benzene: urine metabolites. Am J Ind Med. (2000) 37:522–1. doi: 10.1002/(SICI)1097-0274(200005)37:5<522::AID-AJIM8>3.0.CO;2-G
11. Huang, PC, Liu, LH, Shie, RH, Tsai, CH, Liang, WY, Wang, CW, et al. Assessment of urinary thiodiglycolic acid exposure in school-aged children in the vicinity of a petrochemical complex in Central Taiwan. Environ Res. (2016) 150:566–72. doi: 10.1016/j.envres.2015.11.027
12. Wang, CW, Liao, KW, Chan, CC, Yu, ML, Chuang, HY, Chiang, HC, et al. Association between urinary thiodiglycolic acid level and hepatic function or fibrosis index in school-aged children living near a petrochemical complex. Environ Pollut. (2019a) 244:648–6. doi: 10.1016/j.envpol.2018.10.012
13. Wang, CW, Chuang, HY, Liao, KW, Yu, ML, Dai, CY, Chang, WT, et al. Urinary thiodiglycolic acid is associated with increased risk of non-alcoholic fatty liver disease in children living near a petrochemical complex. Environ Int. (2019b) 131:104978. doi: 10.1016/j.envint.2019.104978
14. WHO. International program on chemical safety: Vinyl chloride. Geneva: World Health Organization (1999).
15. Wang, CW, Cheng, PK, Ponnusamy, VK, Chiang, HC, Chang, WT, et al. Exposure characteristics and cumulative risk assessment for phthalates in children living near a petrochemical complex. Toxics. (2023) 11:57. doi: 10.3390/toxics11010057
16. Gurrani, S, Prakasham, K, Huang, PC, Wu, MT, Wu, CF, Lin, YC, et al. Simultaneous biomonitoring of volatile organic compounds' metabolites in human urine samples using a novel in-syringe based fast urinary metabolites extraction (FaUMEx) technique coupled with UHPLC-MS/MS analysis. Chemosphere. (2023) 329:138667. doi: 10.1016/j.chemosphere.2023.138667
17. Chang, JW, Lee, CC, Pan, WH, Chou, WC, Huang, HB, Chiang, HC, et al. Estimated daily intake and cumulative risk assessment of phthalates in the general Taiwanese after the 2011 DEHP food scandal. Sci Rep. (2017) 7:45009. doi: 10.1038/srep45009
18. Cui, S, Pang, B, Yan, H, Wu, B, Li, M, Xing, C, et al. Using urinary biomarkers to estimate the benzene exposure levels in individuals exposed to benzene. Toxics. (2022) 10:636. doi: 10.3390/toxics10110636
19. Koch, HM, Drexler, H, and Angerer, J. An estimation of the daily intake of di(2-ethylhexyl) phthalate (DEHP) and other phthalates in the general population. Int J Hyg Environ Health. (2003) 206:77–3. doi: 10.1078/1438-4639-00205
20. Mage, DT, Allen, RH, Gondy, G, Smith, W, Barr, DB, and Needham, LL. Estimating pesticide dose from urinary pesticide concentration data by creatinine correction in the third National Health and nutrition examination survey (NHANES-III). J Expo Anal Environ Epidemiol. (2004) 14:457–5. doi: 10.1038/sj.jea.7500343
21. Mage, DT, Allen, RH, and Kodali, A. Creatinine corrections for estimating children's and adult's pesticide intake doses in equilibrium with urinary pesticide and creatinine concentrations. J Expo Sci Environ Epidemiol. (2008) 18:360–8. doi: 10.1038/sj.jes.7500614
22. Boogaard, PJ, and van Sittert, NJ. Biological monitoring of exposure to benzene: a comparison between S-phenylmercapturic acid, trans,trans-muconic acid, and phenol. Occup Environ Med. (1995) 52:611–11. doi: 10.1136/oem.52.9.611
23. Boogaard, PJ, and van Sittert, NJ. Suitability of S-phenyl mercapturic acid and trans-trans-muconic acid as biomarkers for exposure to low concentrations of benzene. Environ Health Perspect. (1996) 104:1151–7.
24. Firth, MJ. Derivation of a chronic reference dose and reference concentration for trimethylbenzenes and C9 aromatic hydrocarbon solvents. Regul Toxicol Pharmacol. (2008) 52:248–6. doi: 10.1016/j.yrtph.2008.08.017
25. Fustinoni, S, Rossella, F, Campo, L, Mercadante, R, and Bertazzi, PA. Urinary BTEX, MTBE and naphthalene as biomarkers to gain environmental exposure profiles of the general population. Sci Total Environ. (2010) 408:2840–9. doi: 10.1016/j.scitotenv.2010.03.017
Keywords: benzene, children, petrochemical complex, trans, trans-muconic acid, urine
Citation: Cheng P-K, Ponnusamy VK, Prakasham K, Huang H-I, Chang W-T and Huang P-C (2023) Exposure and risk assessment of urinary trans, trans-Muconic acid in school-age children in the vicinity of a petrochemical complex in Central Taiwan. Front. Public Health. 11:1234823. doi: 10.3389/fpubh.2023.1234823
Edited by:
Mahaveer Golechha, Indian Institute of Public Health Gandhinagar (IIPHG), IndiaReviewed by:
Yun Tao, Wuhan University, ChinaKonstantinos C. Makris, Cyprus University of Technology, Cyprus
Copyright © 2023 Cheng, Ponnusamy, Prakasham, Huang, Chang and Huang. This is an open-access article distributed under the terms of the Creative Commons Attribution License (CC BY). The use, distribution or reproduction in other forums is permitted, provided the original author(s) and the copyright owner(s) are credited and that the original publication in this journal is cited, in accordance with accepted academic practice. No use, distribution or reproduction is permitted which does not comply with these terms.
*Correspondence: Po-Chin Huang, cGNodWFuZ0BuaHJpLmVkdS50dw==