- 1Eye Institute and Affiliated Xiamen Eye Center, School of Medicine, Xiamen University, Xiamen, Fujian, China
- 2Chongqing Key Laboratory of Development and Utilization of Genuine Medicinal Materials in Three Gorges Reservoir Area, Chongqing Three Gorges Medical College, Wanzhou, China
- 3Department of Pharmacy, Shanghai Pudong Hospital, Fudan University Pudong Medical Center, Shanghai, China
- 4Department of Pancreatobiliary Surgery, State Key Laboratory of Oncology in South China, Guangdong Key Laboratory of Nasopharyngeal Carcinoma Diagnosis and Therapy, Guangdong Provincial Clinical Research Center for Cancer, Sun Yat-sen University Cancer Center, Guangzhou, China
- 5Department of Orthopedics, The First Affiliated Hospital of Xi’an Jiaotong University, Xi'an, Shaanxi, China
Background: Glaucoma, a leading global cause of blindness, has garnered increasing research attention in recent years concerning its potential association with environmental factors. This study investigates the influence of various environmental pollutants on glaucoma prevalence among middle-aged and older adult populations in China, a country with a high incidence of the disease.
Methods: Using data from 17,184 participants in the 2015 China Health and Retirement Longitudinal Study (CHARLS), individuals were grouped based on glaucoma diagnosis. Environmental pollutant exposure levels were derived from satellite-based spatiotemporal models. Standardized linear regression and restricted cubic spline (RCS) analysis were applied to evaluate the impact of pollutants on glaucoma across different covariate-adjusted models, while logistic regression was used to assess significant variables for constructing and evaluating a predictive model.
Results: After adjusting for covariates, six pollutants (PM2.5, PM10, PM1, NH4, Cl, and NO3) demonstrated significant associations with glaucoma incidence. Subsequent logistic regression revealed that the occurrence of glaucoma may be influenced by a combination of environmental pollutants (NH4 and NO3), regional categories, gender, age, educational level, and diabetes history.
Conclusion: In conclusion, this study offers a novel perspective on glaucoma risk prediction by integrating environmental pollutants, potentially contributing to enhanced preventive strategies for this condition.
Introduction
Glaucoma is a leading cause of irreversible blindness worldwide, characterized by degenerative changes in the optic nerve head and progressive loss of visual field (1). According to the Global Burden of Disease study, glaucoma has been identified as the primary blinding eye disease globally, placing an increasing health burden on human populations. The rising Disability-Adjusted Life Years (DALYs) further underscores this issue. Public data reveal that in China, the prevalence of glaucoma reaches 2.58%, with approximately 21.8 million patients in 2020, accounting for nearly a quarter of the global glaucoma population, and blindness affecting up to 5.67 million individuals (2). Although glaucoma primarily affects the older adult, it is gradually manifesting in younger age groups, posing a significant public health challenge in China with far-reaching social and economic implications. Identifying potential risk factors for glaucoma is therefore essential for early prevention, intervention, and control (3, 4).
Due to its constant exposure to the external environment, the eye is susceptible to external factors such as air pollutants. In recent years, with the worsening of air pollution, researchers have increasingly focused on its potential impact on glaucoma incidence (5, 6). Studies have found that glaucoma incidence is markedly higher in urban than in rural areas, suggesting that air pollution may be a contributing factor (7). Two hospital-based studies indicate that short-term increases in air pollutants (such as PM2.5, PM10, nitrogen dioxide and carbon monoxide) are significantly associated with increased outpatient visits for acute glaucoma. However, there is a lack of systematic research on the effects of long-term exposure to various air pollutants on glaucoma incidence (8, 9). Existing evidence predominantly stems from isolated urban settings or short-term exposure analyses, often focusing on single pollutants. Such fragmented approaches limit the generalizability of findings and obscure the cumulative effects of complex air pollution mixtures over extended periods.
The China Health and Retirement Longitudinal Study (CHARLS) is a nationally representative dynamic cohort study, recruiting community-dwelling adults aged 45 and older in China (10). In this nationwide cross-sectional study, we aim to utilize CHARLS data to systematically investigate association between long-term exposure to air pollution and glaucoma incidence. Unlike previous fragmented approaches, our study innovatively integrates multi-year environmental exposure data (including PM2.5, PM10, NO2, and CO) with nationally representative health metrics, enabling simultaneous assessment of multiple pollutants’ cumulative effects across diverse geographic regions. By integrating extensive environmental pollution data with population health data, this study provides new evidence to elucidate the potential link between air pollution and glaucoma. Compared to previous studies limited to a single city or short-term exposure, our research offers broader temporal and spatial coverage, lending greater representativeness and validity. Additionally, we aim to develop a predictive model to identify individuals at higher risk of glaucoma, incorporating a range of factors, including air pollution exposure. By integrating these variables into a predictive framework, this model seeks to enhance early detection and risk stratification, providing a practical tool to guide targeted prevention and intervention efforts for high-risk populations. This pioneering study is expected to generate crucial scientific evidence for glaucoma prevention and control in China, while offering valuable insights for environmental protection policy development.
Methods
Study design
We utilized publicly available data from CHARLS1. Given its large sample size and high quality, the CHARLS data provides robust support for the analyses in this study. CHARLS 2015 data was selected, which originally included 21,038 participants. After excluding individuals with missing data on glaucoma diagnosis, air pollutant exposures, or essential covariates (including age, gender, diabetes, and hypertension), 17,184 participants with complete and analyzable data were retained for the final analysis.
Assessment of air pollution exposure
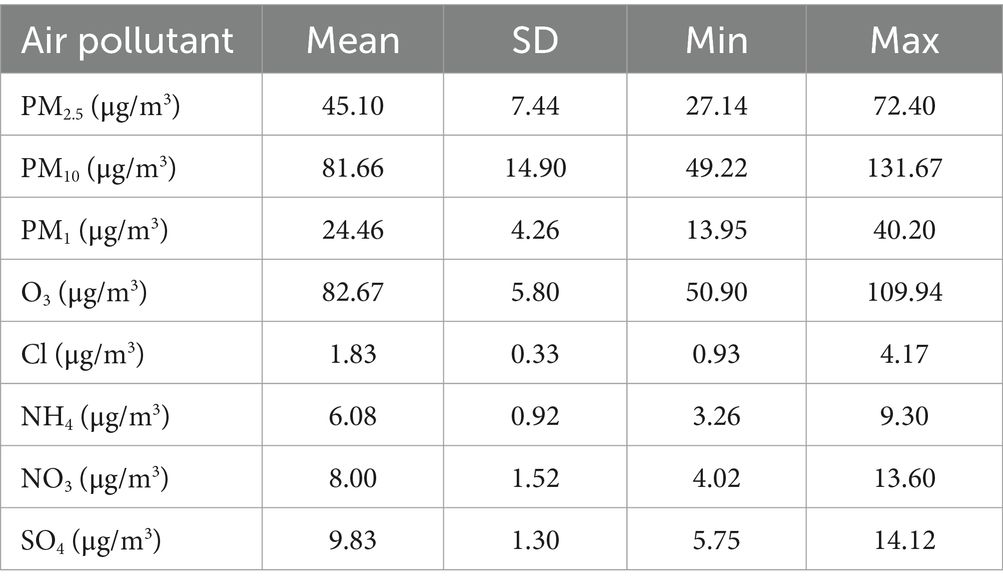
Full-coverage ground-level air pollution concentrations (PM2.5, PM10, PM1, O3, Cl, NH4, NO3 and SO4) for each individual was assessed by artificial intelligence at 0.1° (≈10 km) gridded spatial resolution from 2015, which were collected from the China High Air Pollutants (CHAP) dataset2. Briefly, ground-based measurements, remote sensing products, atmospheric reanalysis, and model simulations were all employed and the space–time extremely randomized trees (STET) model was used to estimate the daily concentrations of ambient PM2.5, PM10, PM1, O3, Cl, NH4, NO3 and SO4. Annual air pollution exposure of each participant was estimated based on their county-level residential address. We calculated the mean value, standard deviation, minimum value and maximum value of each air pollutant in 28 provinces included in CHARLS (Supplementary Table S1), and averaged the above data in Table 1. Due to missing data for NH4, SO4, NO3, and Cl in Qinghai and Xinjiang provinces (less than 10%), we applied multiple imputation using the mice package in R to address these gaps. This allowed us to fill in the missing values based on observed data, ensuring a more complete and consistent exposure assessment for these regions in the follow-up analysis.
Covariates
The study included numerous covariates covering demographic, socioeconomic, and chronic disease-related factors. Demographic variables comprised age (in years) and sex (“male” or “female”). Socioeconomic variables included residence (“rural” or “urban”), education level (“elementary school or below,” “secondary school,” “high school,” or “university/college”), marital status (“married” or “unmarried”), and region (“east,” “midland,” or “west”). Health behaviors and lifestyles included smoking status (“non-smoker” or “smoker”) and drinking status (“non-drinker” or “drinker”). Chronic disease-related variables covered hypertension, diabetes, and hyperlipidemia, each recorded as “yes” or “no.”
Diagnostic criteria for glaucoma, hypertension and diabetes
Glaucoma was assessed through self-reports. The presence of glaucoma was defined by the response to the question, “Has a doctor, nurse, or paramedic ever treated you for glaucoma?” If the participant answered “yes, “they were classified as having glaucoma (3). Diabetes was defined based on self-reported physician diagnosis, use of hypoglycemic drugs, fasting blood glucose ≥ 126 mg/dL, and/or glycated hemoglobin ≥ 6.5% at baseline, in line with established diagnostic criteria (11). Hypertension was classified according to the following criteria: (1) self-report of a physician diagnosis in response to the question, “Have you ever been diagnosed with hypertension?”; (2) self-reported use of antihypertensive medications, as indicated by the response to the question, “Are you currently using any antihypertensive medications to manage your blood pressure?”; or (3) confirmation from two or more readings of systolic blood pressure (SBP) ≥ 140 mmHg and/or diastolic blood pressure (DBP) ≥ 90 mmHg (12).
Statistical analysis of glaucoma and air pollutants
Descriptive statistics were conducted, with continuous variables expressed as mean ± standard deviation (SD) and categorical variables as counts (percentages). Differences in continuous and categorical variables between non-glaucoma and glaucoma participants were analyzed using the t-test. Generalized linear models (GLM) were applied to examine relationship between air pollution and glaucoma. We reported effect estimates and 95% confidence intervals (95%CI) as odds ratios (OR). The initial model (Model 1) was unadjusted, while Model 2 adjusted for demographic (age and gender) and socioeconomic variables (regional categories, education, marital status, and drinking status). These factors were selected based on their potential influence on both the exposure to air pollution and the risk of glaucoma, as well as their role as known confounders in health research. Finally, Model 3 further adjusts for the presence of diabetes and hypertension, which are both chronic diseases with well-established links to an increased risk of glaucoma. Given the chronic nature of these conditions, we considered them important confounders, as they may interact with air pollution exposure to influence the development of glaucoma. This model thus provides a more comprehensive adjustment for factors that could affect the observed association between air pollution and glaucoma. Additionally, standardized concentrations of air pollutants were used to compare OR values, identifying the air pollution components most strongly associated with glaucoma. All statistical analyses were conducted using R software (Version 4.4.1). A two-tailed p-value < 0.05 was considered statistically significant. To explore the relationship between environmental pollutants and glaucoma, restricted cubic splines (RCS) were employed following standardized linear regression analysis. RCS allows for non-linear relationships while maintaining local structure, revealing pollutant concentration effects on glaucoma risk.
Evaluation of logistic regression analysis for predictive model construction
Due to the relatively small number of glaucoma cases in our study, we used a p-value < 0.10 as a screening threshold in the univariate analysis to avoid prematurely excluding potentially meaningful variables. This more inclusive approach is commonly used in the early stages of model development. For the final multivariate logistic regression model, a p-value < 0.05 was used to determine statistical significance. The cohort was divided into training (70%) and validation (30%) datasets. Logistic regression was performed using R (Version 4.4.1).
Development and validation of predictive model
Given the imbalanced nature of the dataset—with only 1.4% of participants diagnosed with glaucoma—accuracy was not used as a primary evaluation metric due to its limited interpretability in such settings. Instead, we assessed model performance using more robust metrics such as AUC, sensitivity, specificity, and the Brier score. These measures are more appropriate in reflecting the discriminatory power of the model under class imbalance. These metrics provide insights into the ability of model to correctly identify both glaucoma cases and non-cases. To ensure model robustness and avoid overfitting, we employed bootstrapping, where the original dataset was repeatedly sampled 1,000 times for model calibration. Model calibration was further evaluated using the Brier score, calibration curve, and the Hosmer-Lemeshow test, which assess the accuracy of predicted probabilities versus actual outcomes.
Finally, we employed Nomogram and Decision Curve Analysis (DCA) to visualize the prediction of model and assess its clinical utility. The nomogram provides a visual representation of how each variable contributes to the predicted probability of glaucoma, while DCA evaluates the model’s performance in decision-making by considering the net benefit of applying the model across different threshold probabilities. Specifically, for the construction of the nomogram, each variable (including age, gender, education level, diabetes, regional category, NH4 and NO3) was converted into a point value on a standardized “Points” axis. These values were derived from the regression coefficients of the final multivariate logistic model. The total score was then mapped onto a probability scale to estimate the risk of glaucoma. This approach allows variables with different units and scales to be incorporated into a unified predictive model.
Results
Descriptive statistics
A total of 21,038 middle-aged and older adults from 28 provinces were initially included, with 17,184 remaining after exclusions. The mean age was 61.48 ± 9.97 years, and 247 participants (1.4%) were diagnosed with glaucoma. Significant differences (p < 0.05) between glaucoma and non-glaucoma groups were found in age, marital status, education, drinking status, regional categories, hypertension, and diabetes (Table 2).
Table 1 present the average concentrations of eight air pollutants. A average ambient PM2.5, PM10, PM1, O3, Cl, NH4, NO3 and SO4 exposure were 45.10 ± 7.44 μg/m3, 81.66 ± 14.90 μg/m3, 24.46 ± 4.26 μg/m3, 82.67 ± 5.80 μg/m3, 1.83 ± 0.33 μg/m3, 6.08 ± 0.92 μg/m3, 8.00 ± 1.52 μg/m3 and 9.83 ± 1.30 mg/m3, respectively. We found that the annual PM2.5 and PM10 exposure were far greater than the standards of the World Health Organization (AQG 2015: PM2.5: 10 μg/m3, PM10:20 μg/m3) and the secondary standard of Chinese ambient air quality guideline (GB 3095–2012, PM2.5: 35 μg/m3, PM10:70 μg/m3).
Association between air pollution and the prevalence of glaucoma
The associations between each air pollutant and the prevalence of glaucoma are shown in Figure 1. Only O3 was associated with increased prevalence of glaucoma in the crude model (model 1). After adjusting for gender, age, marital status, drinking status, education status and regional categories, long-term exposures to ambient PM1, PM2.5, PM10, NH4, Cl and NO3 were all associated with the increased prevalence of glaucoma in the model 2. Moreover, in the basis of model 2, chronic disease including hypertension and diabetes was added (model 3). Our results found that PM1, PM2.5, PM10, NH4, Cl and NO3 also associated with glaucoma. Detailed results are shown in Supplementary Table S2. Thus, following analysis based on the model 3 and above six air pollutants.
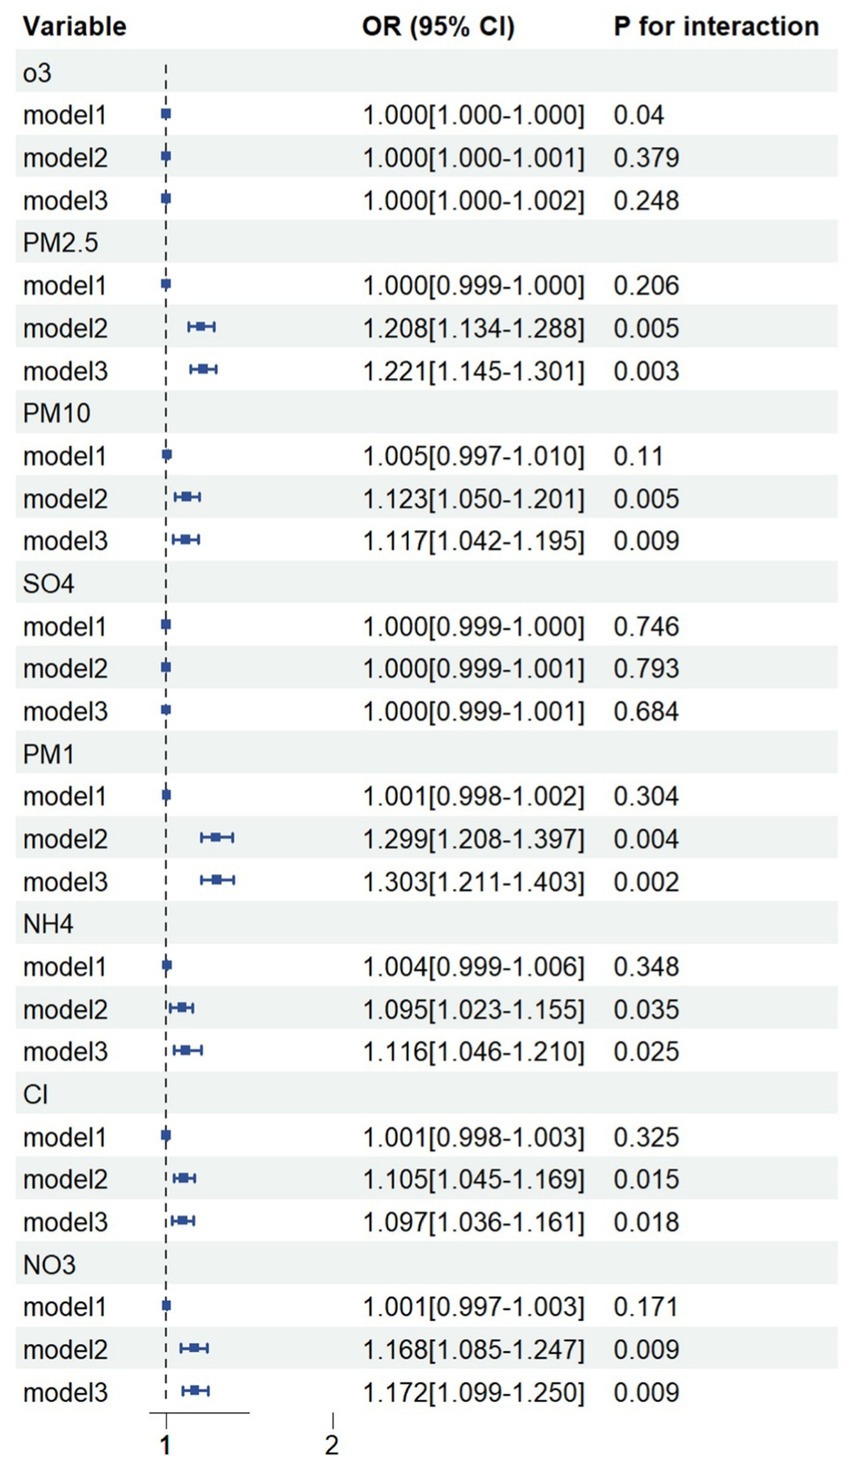
Figure 1. Generalized linear models on exploring associations between air pollution and glaucoma. Model 1, crude model, without adjustment; Model 2, adjusted for gender, age, marital status, drinking status, education status and regional categories; Model 3, adjusted for gender, age, marital status, drinking status, education status and regional categories, diabetes and hypertension.
Restricted cubic splines
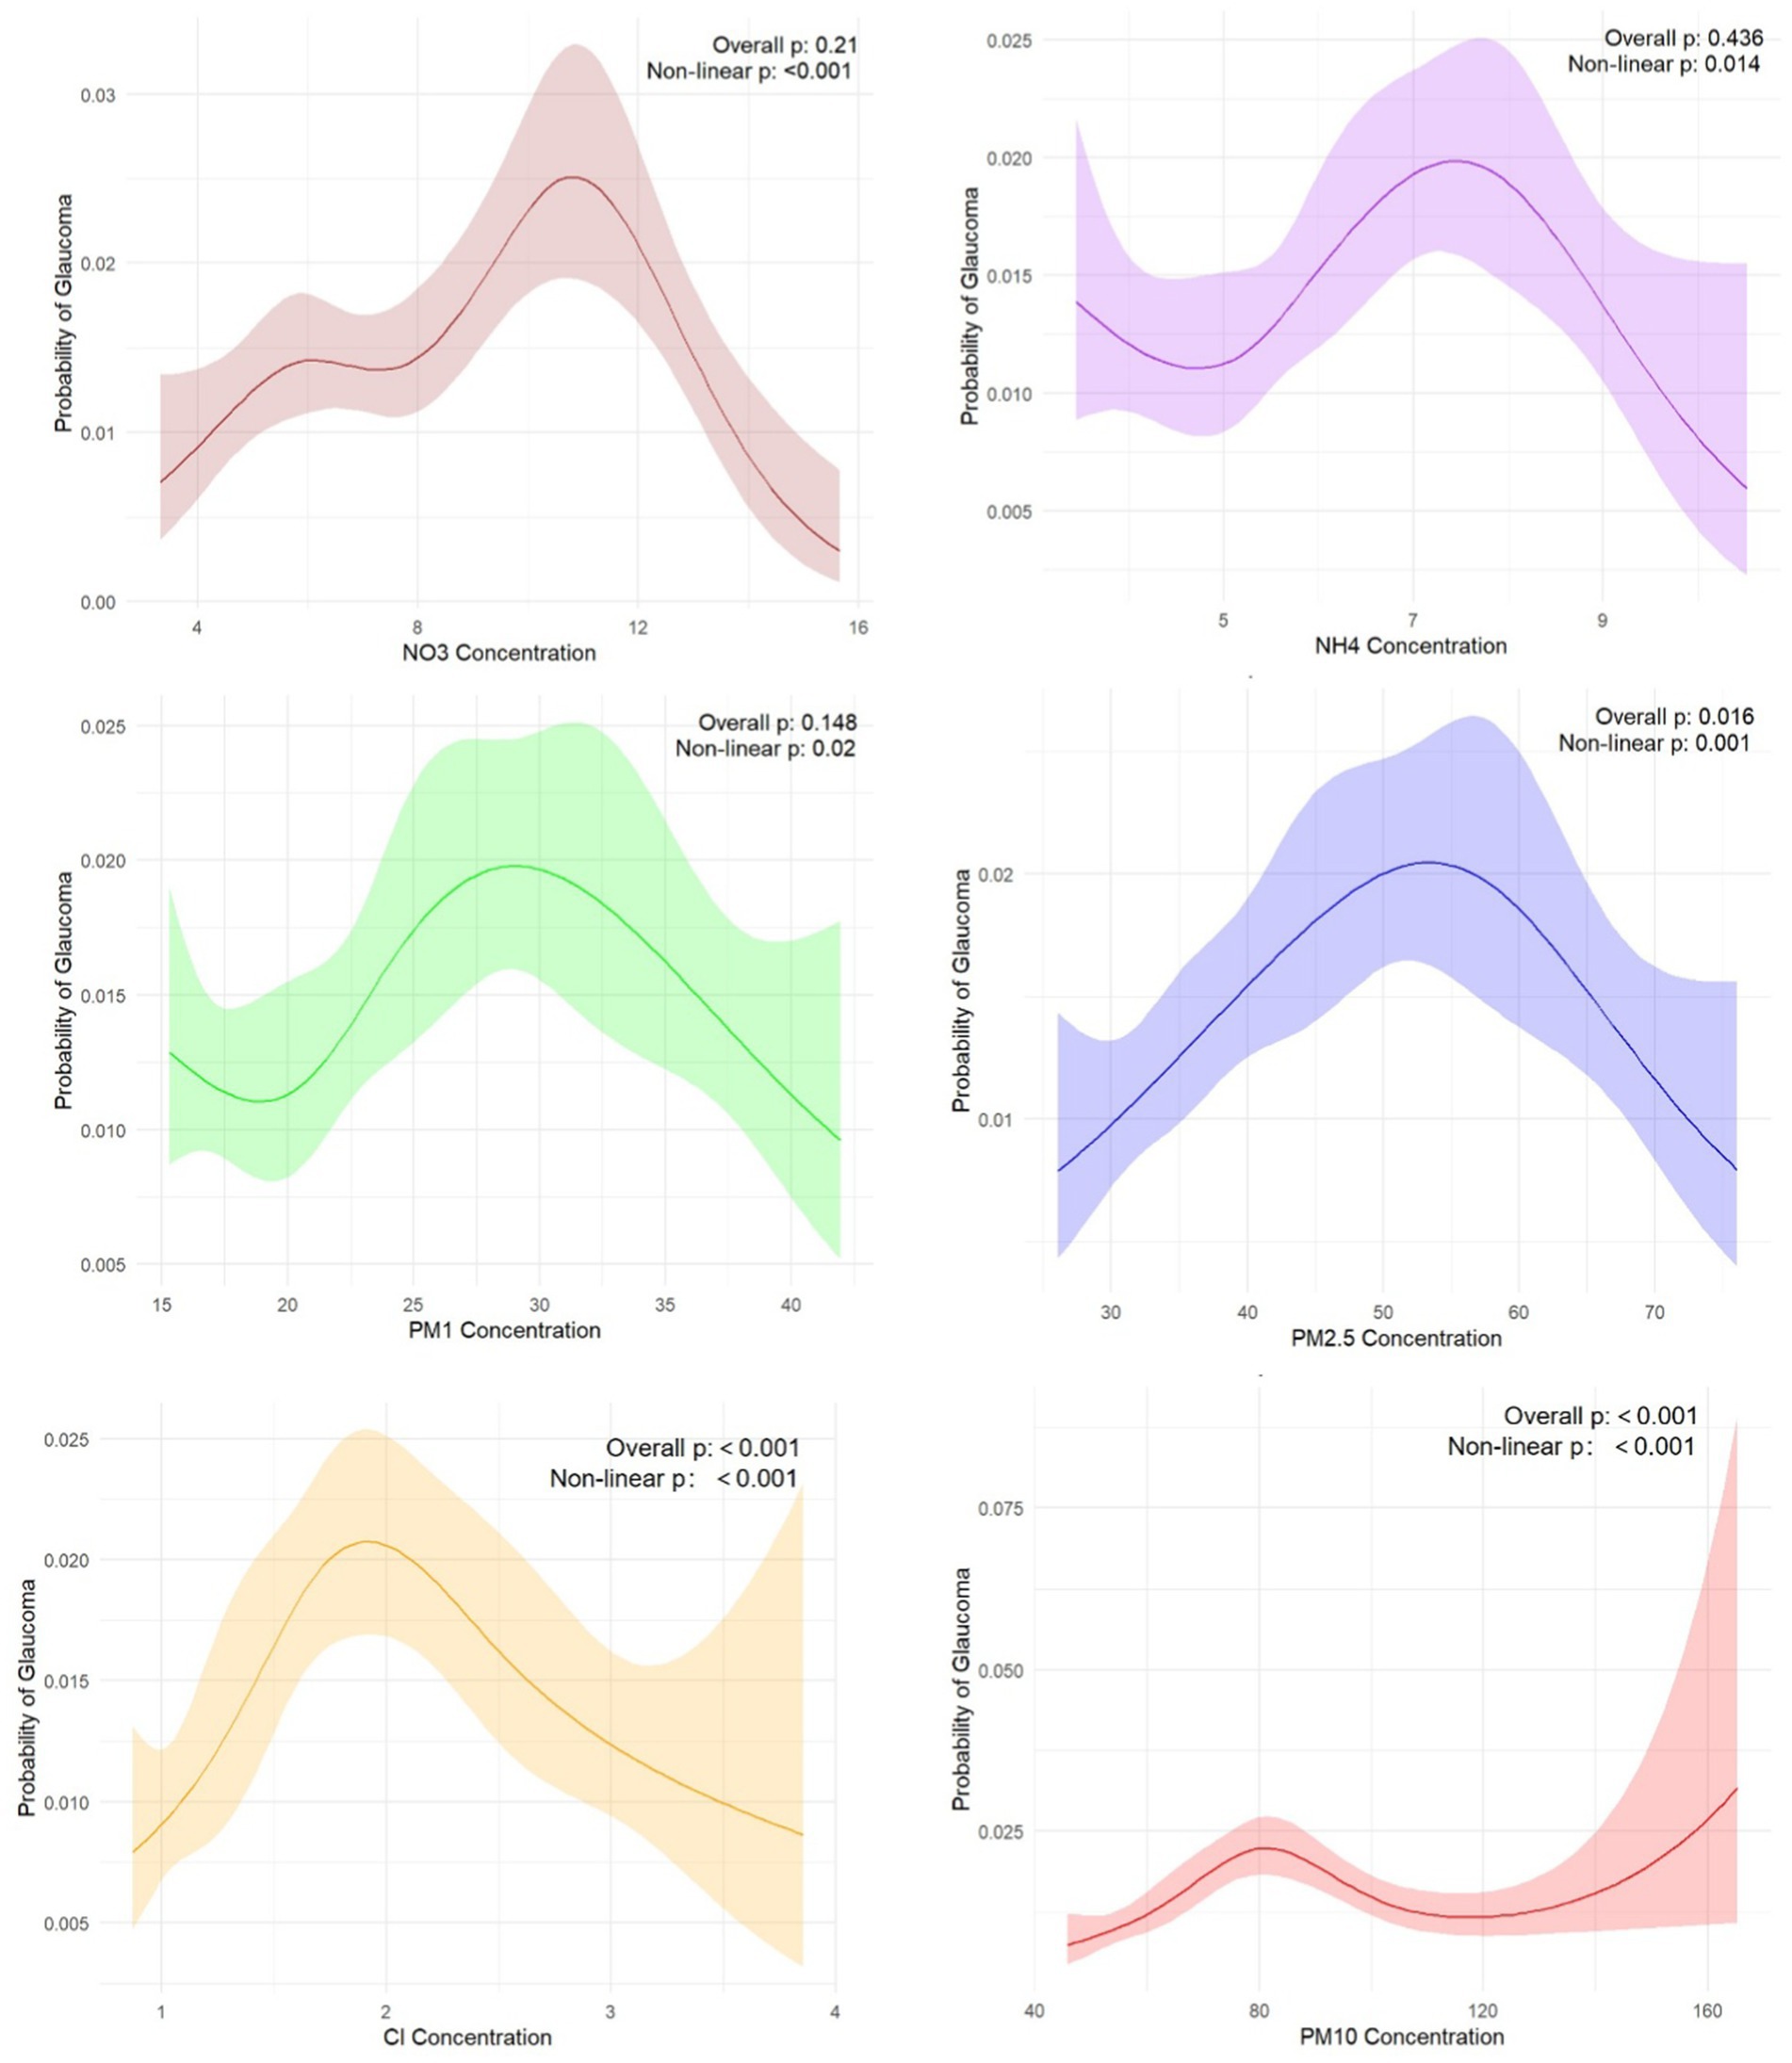
PM1 (for non-linearity, p = 0.02), PM2.5 (for non-linearity, p < 0.001)., PM10 (for non-linearity, p < 0.001), NH4 (for non-linearity, p = 0.014), Cl (for non-linearity, p < 0.001) and NO3 (for non-linearity, p < 0.001) all had an effect on the risk of glaucoma, and the relationship was non-linear. The concentration of different pollutants has different effects on the risk of glaucoma, but overall, the risk of glaucoma increases within a certain range as the concentration increases. However, since most confidence intervals are wide, this may be due to small number of positive samples for glaucoma, increasing the uncertainty in prediction of RCS (Figure 2).
Construction of predictive model
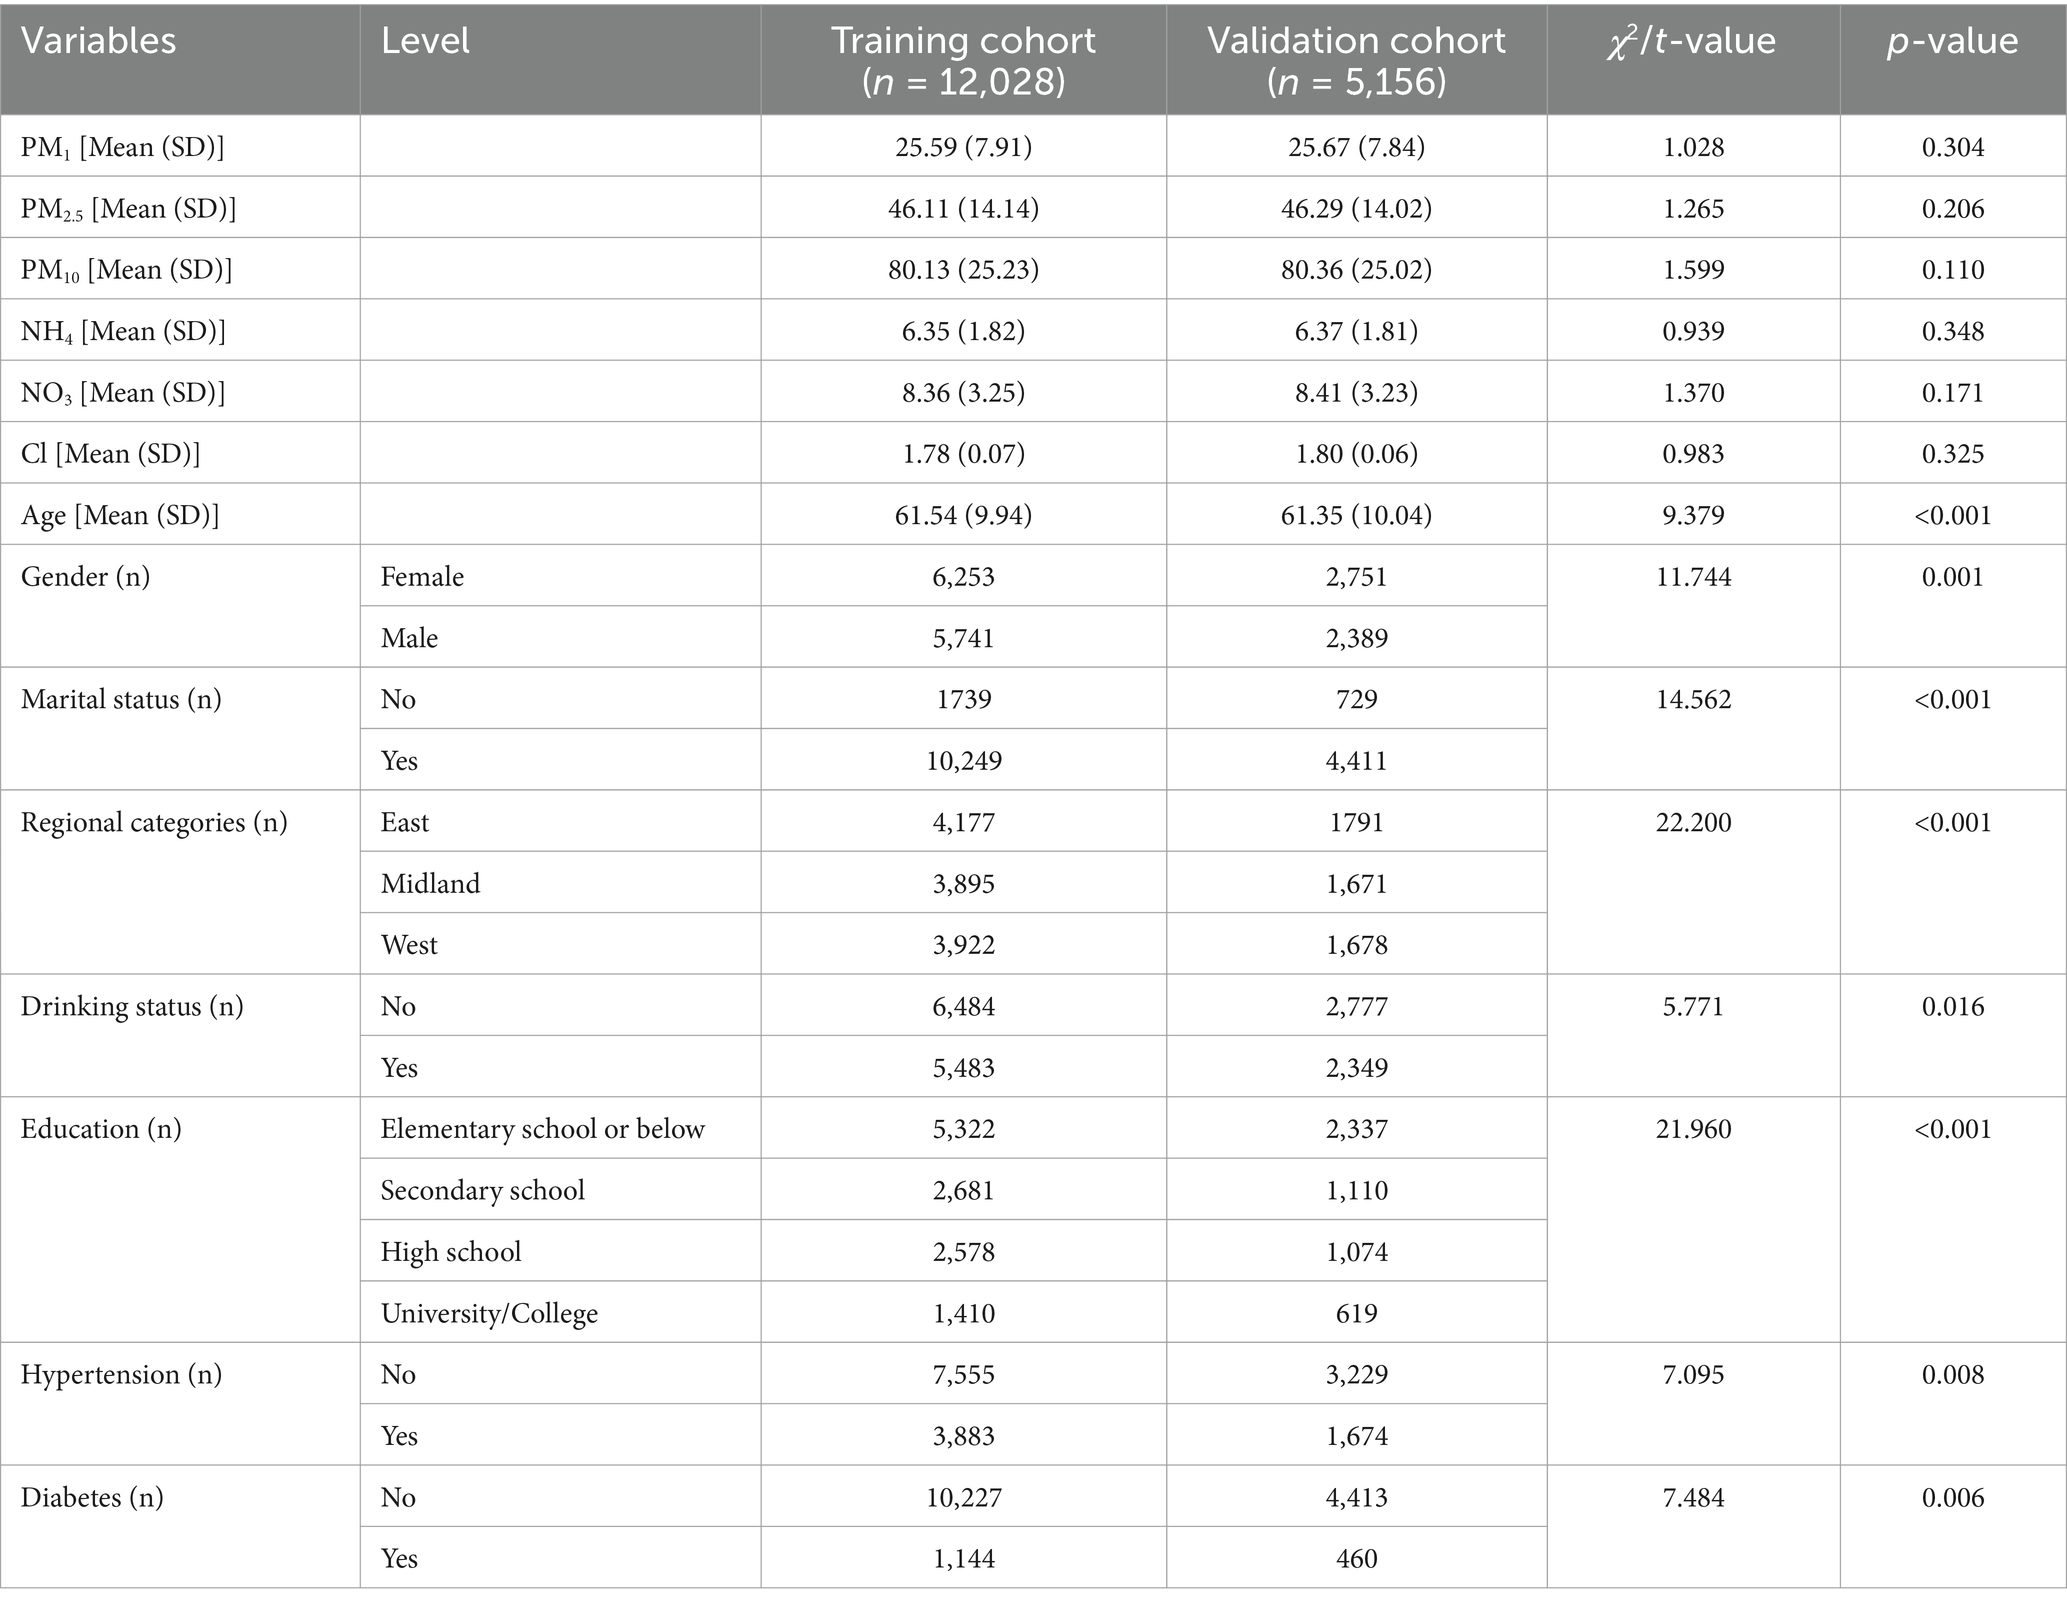
After determining the factors ultimately included in the model, we conducted logistic regression to explore whether there was a significant relationship between the factors. The specific information of participants in predictive model was listed in Table 3 with 12,108 participants in the training cohort and 5,156 participants in the validation cohort. The results by univariate and multivariate logistic regression analysis in Table 4 showed that gender, age, diabetes, regional categories, education, NH4 and NO3 were predictors (p < 0.1).
Efficiency analysis and internal validation of logistic regression model
As shown in Figure 3, in the training cohort, the AUC of the algorithm was 0.701 (95%CI: 0.6447–0.7581), the sensitivity was 0.650, and the specificity was 0.775. In the validation cohort, the AUC of the algorithm was 0.7 (95%CI, 0.6582–0.7424), the sensitivity was 0.658, and the specificity was 0.733. Subsequently, we perform internal validation by calibration curve. The internal validation of the model was carried out by the Bootstrap method. The original data were repeatedly sampled for 1,000 times. The AUC of the training cohort was 0.712, χ2 = 9.4249 in Hosmer-Lemeshow test (p = 0.308) and the Brier index was 0.013; the AUC of the validation cohort was 0.695, χ2 = 5.3161 in Hosmer–Lemeshow test (p = 0.723) and the Brier index was 0.015 (Figure 4), which showed that prediction model for glaucoma participants established by the present study had good performance among training cohort and validation cohort. These results indicate good discriminative and calibration performance of the model despite the inherent class imbalance in the dataset.
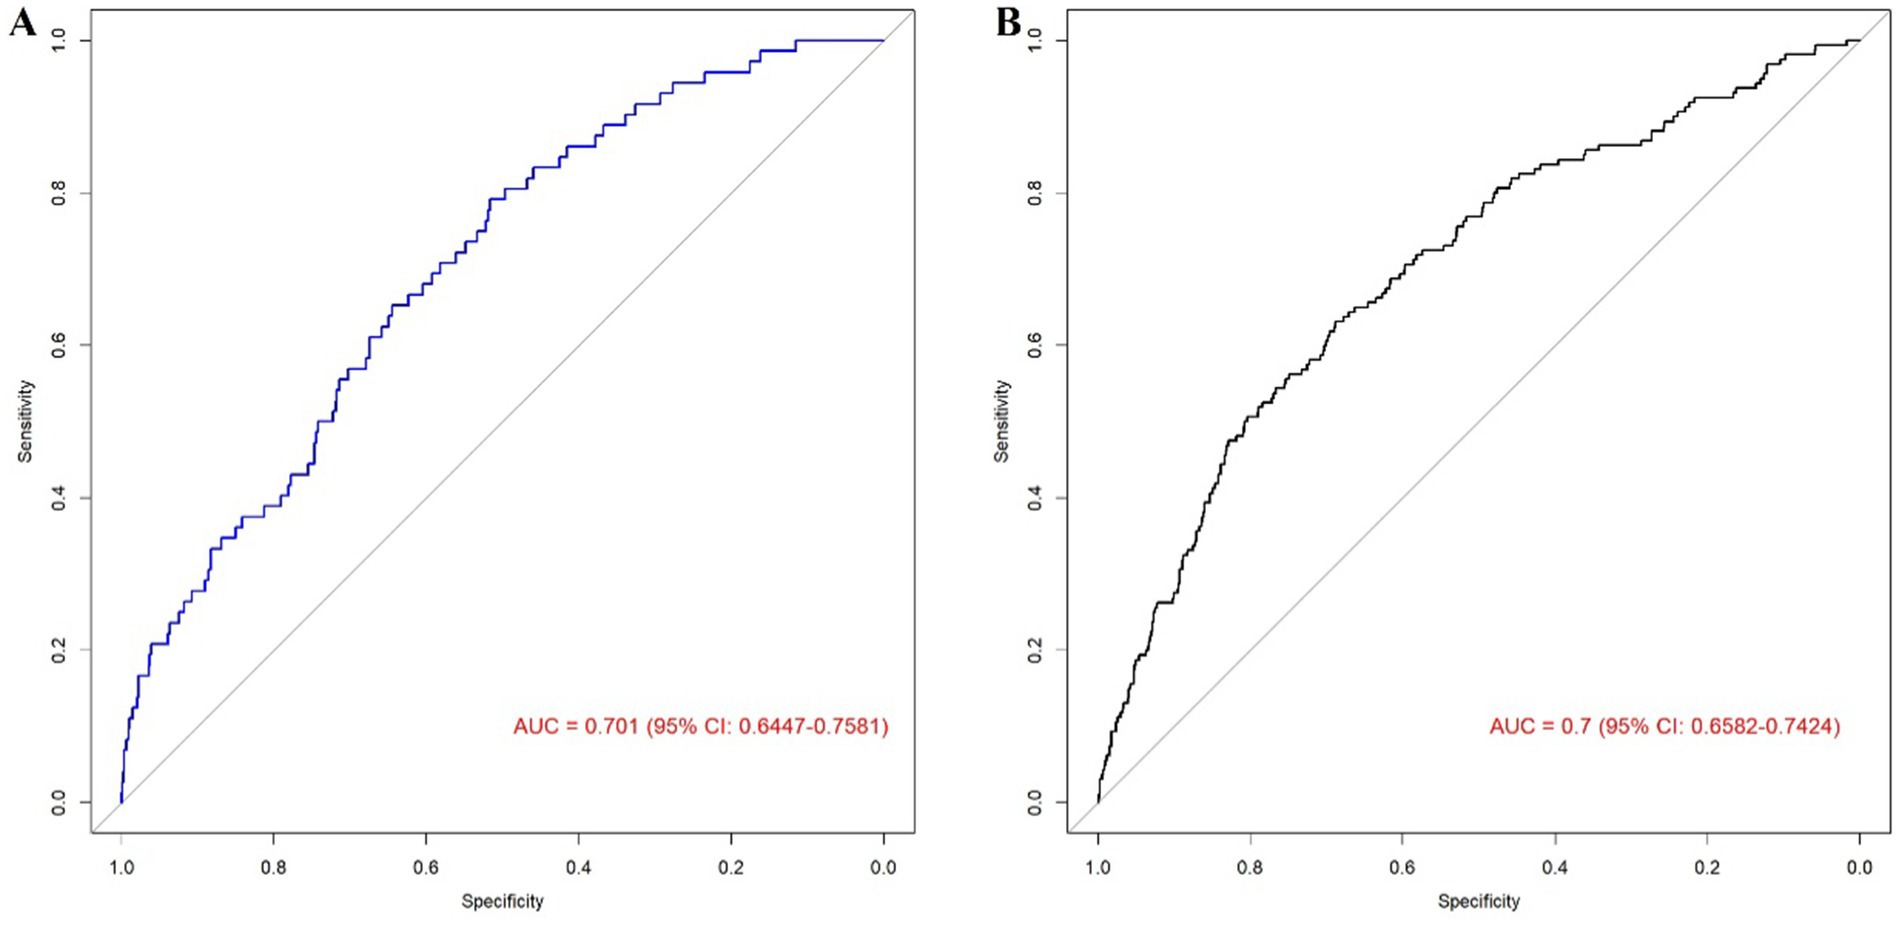
Figure 3. ROC curves: (A) Training, (B) Validation. (A) ROC curve of a logistic regression model in training cohort is used to test the ability of the model to distinguish between the glaucoma group and the non-glaucoma group. (B) ROC curve of a logistic regression model in validation cohort is used to test the ability of the model to distinguish between the glaucoma group and the non-glaucoma group.
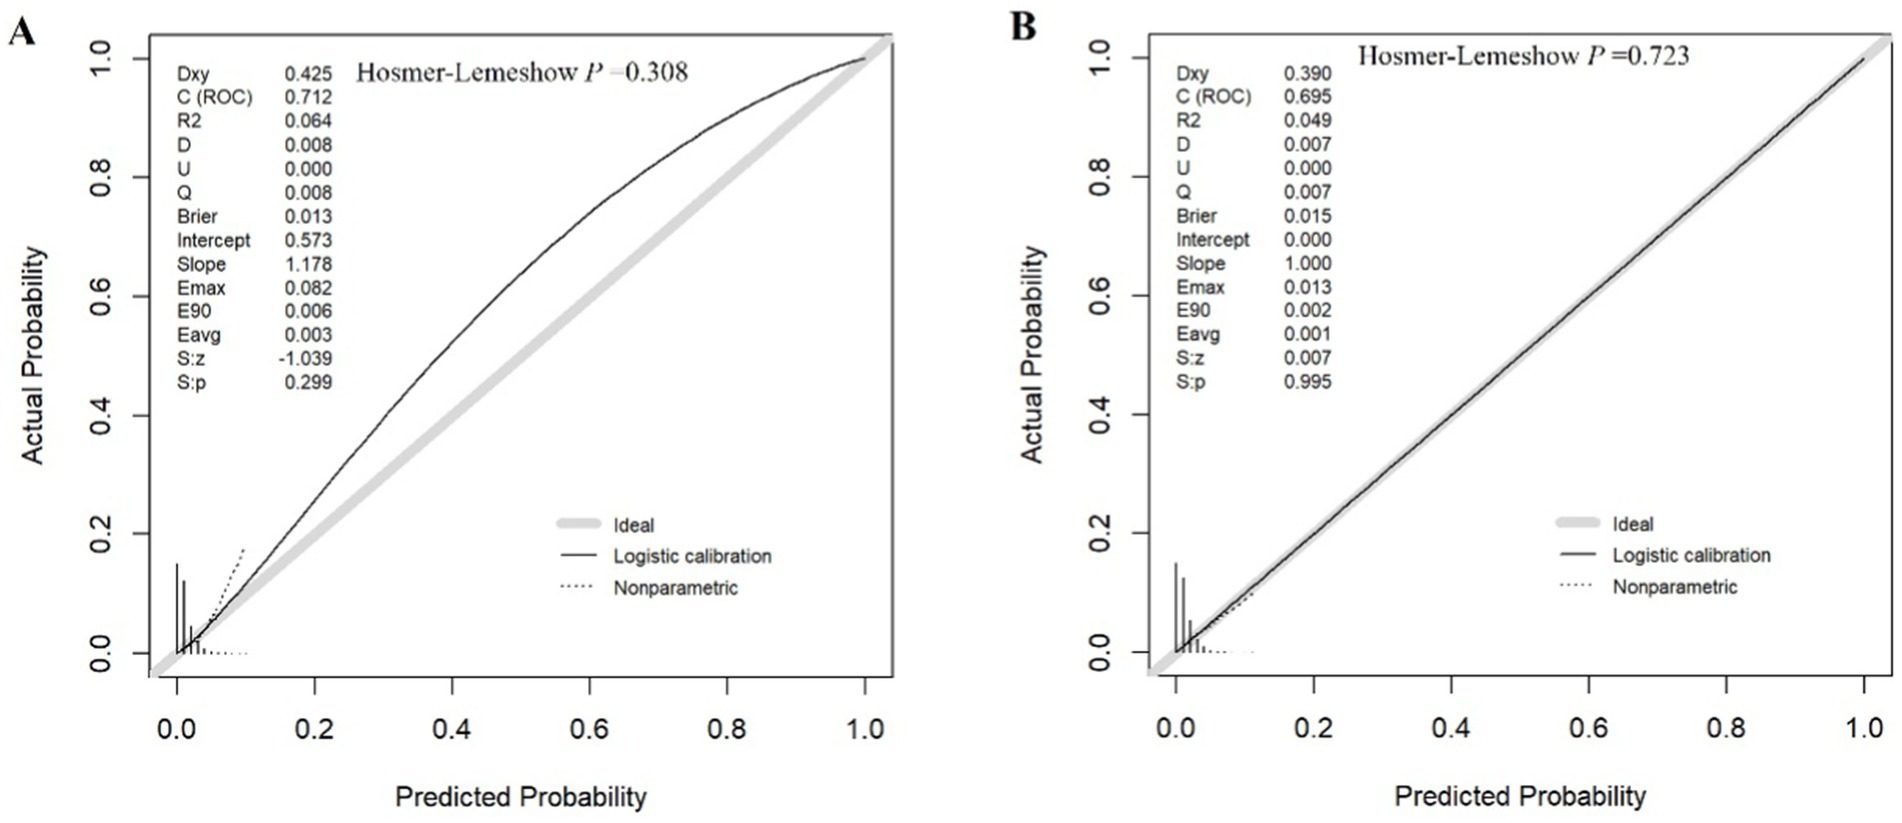
Figure 4. Calibration curves: (A) Training, (B) Validation. (A) The calibration curve of the training cohort of logistic regression model based on the bootstrap method, which is used to evaluate the probability accuracy of the model. (B) The calibration curve of the validation cohort of logistic regression based on the bootstrap method, which is used to evaluate the probability accuracy of the model.
Nomogram for estimating association between glaucoma and air pollutants as well as other factors
The scores of each independent influencing factor were determined based on the CHARLS data, which was plotted in the nomogram of the association between glaucoma and air pollutants as well as other factors (Figure 5). The depicted DCA was used to determine whether decisions based on the predictive model had clinical applicability compared to the default strategy. The graphically DCA indicated the expected net benefit (red curve) per patient for predicting the risk of glaucoma. Within the threshold risk range of 0–80%, intervention decisions based on the predictive model are clearly beneficial (Figure 6).
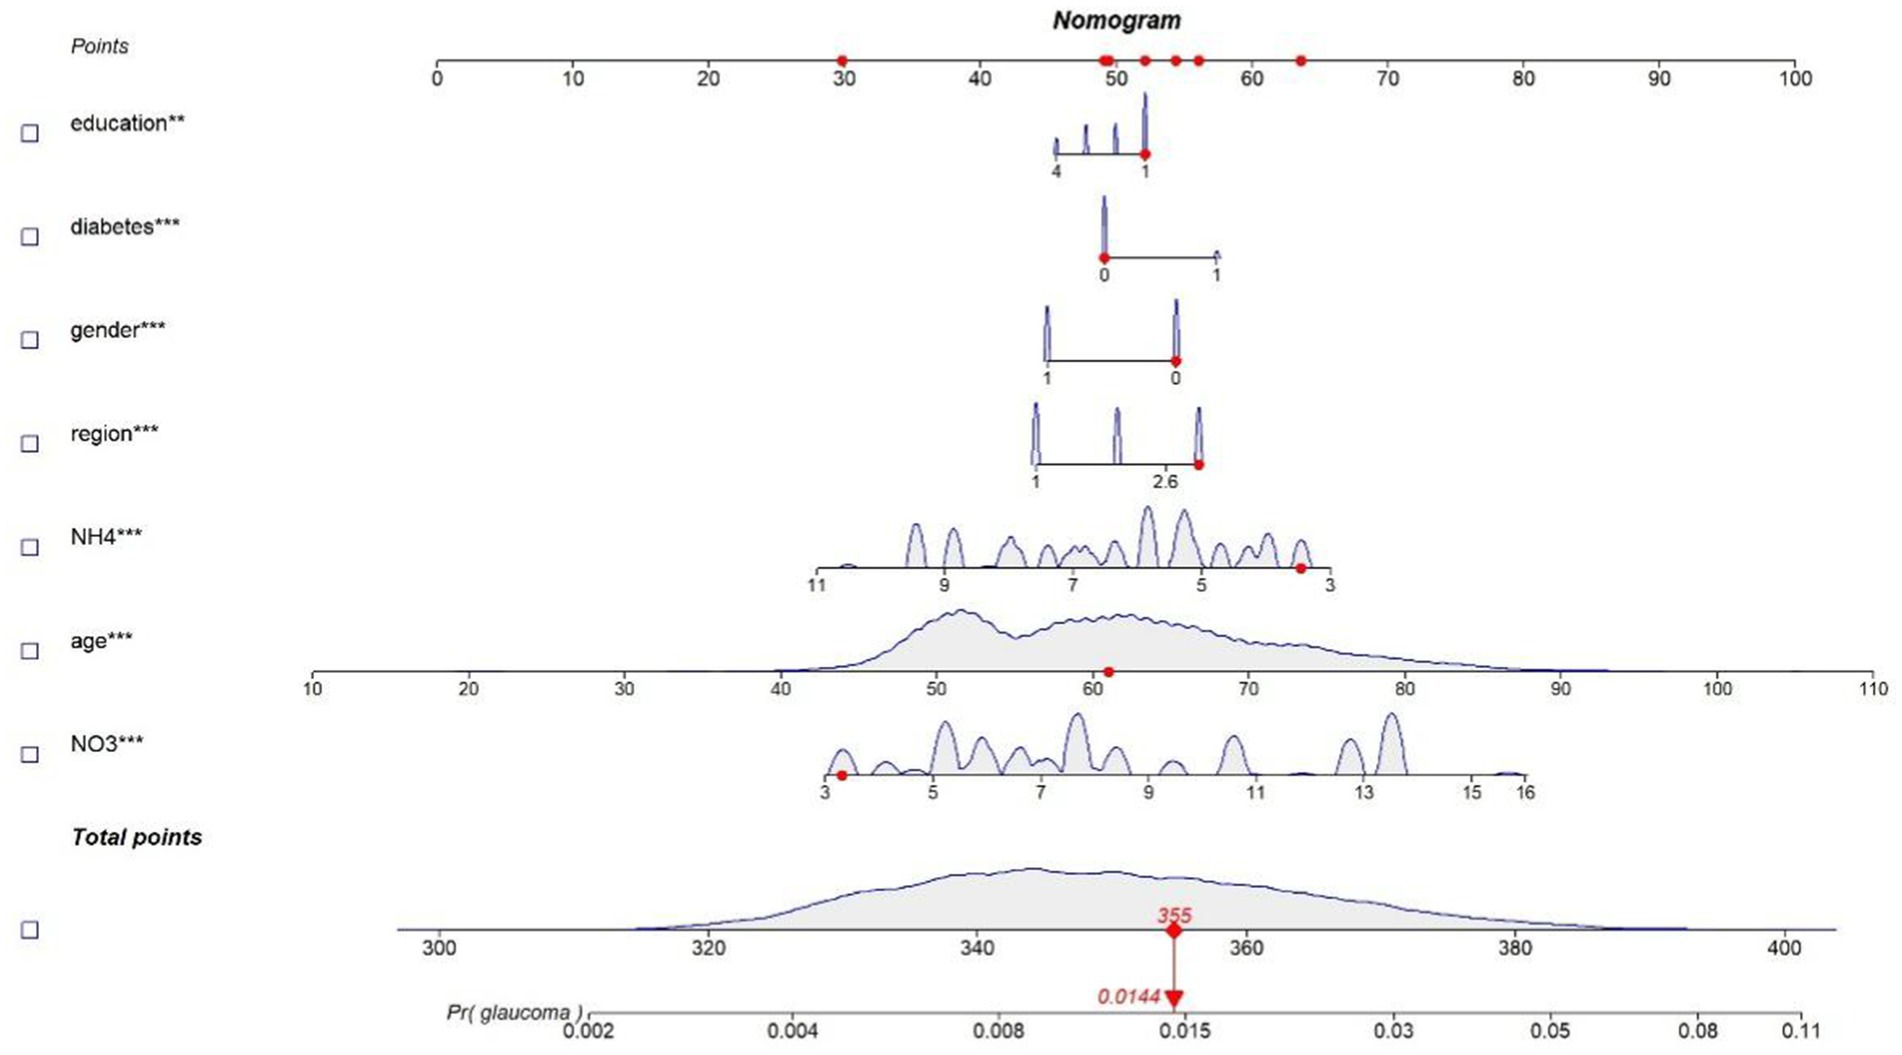
Figure 5. Nomogram of the predictive model. A novel nomogram to predict the prevalence of glaucoma. The nomogram provides a visual point system where each predictor variable is assigned a corresponding score on a common “Points” scale (top axis). The total score is calculated by summing the points for all variables, and this total is then mapped to the bottom scale to estimate the predicted probability of glaucoma. To calculate the probability of glaucoma, the points of seven variables determined on the scale were added to obtain the total points. Draw a vertical line from the total points scale to the last axis to obtain the corresponding probability of glaucoma.
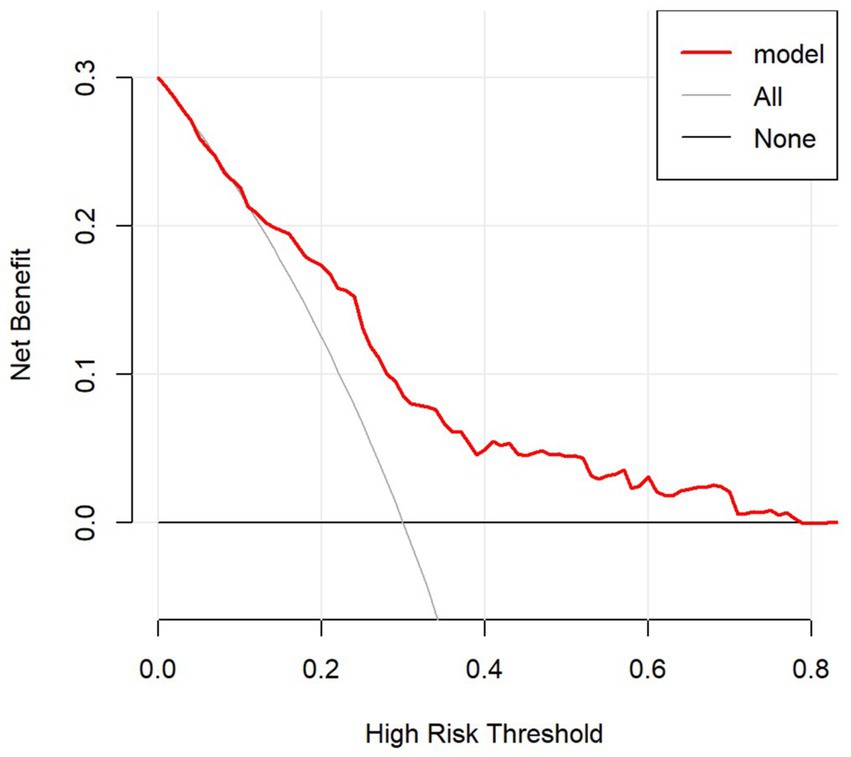
Figure 6. Decision curve analysis (DCA) for the nomogram. The DCA shows the clinical usefulness of the nomogram. The Y-axis represents net benefit. The bold solid black line is a nomogram predicting the risk of glaucoma. The solid gray line indicates that all patients occurred glaucoma, while the fine solid black line indicates that no patient occurred glaucoma. This DCA could provide a larger net benefit, with ranges of 0–80%.
Discussion
Based on current knowledge, this study represents the first attempt to assess the association between air pollution, specifically particulate matter, and glaucoma among middle-aged and older adult populations. Air pollution exposure was estimated using satellite-based models, which provide regional estimates of pollution levels. Results indicate that environmental components of particulate matter, specifically NH₄ and NO₃, adversely impact glaucoma incidence. These substances are secondary inorganic aerosols that contribute to the overall composition of PM2.5. Furthermore, factors such as gender, age, educational level, diabetes, and regional categories may serve as predictive factors for glaucoma.
Epidemiological studies are increasingly focusing on the impact of air pollution exposure on various diseases. However, existing research predominantly centers on PM2.5 (13, 14), with fewer studies examining smaller particles such as NH4 and NO3. Sulfate (SO42−), nitrate (NO3−), and ammonium (NH4+)—collectively termed SNA—account for 30 to 50% of PM2.5 concentration (15). NH4 and NO3 are PM2.5 components, formed as ammonia and nitric acid molecules transition from the gas phase to the liquid phase, ionizing to create ammonium nitrate (NH4NO3) (16). Approximately 70–80% of PM2.5 arises from secondary formation, with ammonium nitrate constituting a significant component, critical for particulate matter pollution control in several areas (17). Current research suggests a potential association between air pollution, particularly fine particulate matter (PM2.5), and glaucoma onset and progression (5, 18). Ammonium nitrate, as part of PM2.5, may be linked to glaucoma incidence. One possible mechanism is that ammonium nitrate combustion or atmospheric exposure releases nitrogen oxides, increasing oxidative stress and chronic inflammation—key factors in glaucoma pathology, especially regarding optic nerve damage (19, 20). Exposure to PM2.5 has been shown to elevate systemic oxidative stress and ocular inflammatory response (21), potentially exacerbating damage to the trabecular meshwork and retinal ganglion cells, thereby accelerating glaucoma progression. An in vitro study on human trabecular meshwork cells supports the biological plausibility of this association (18). Anatomically, particulate matter may induce the closure of a narrow anterior chamber angle, prompting angle-closure glaucoma (22).
In our model, regional classification functions as a crucial predictive factor among covariates. It is well-known that air pollutant density varies significantly by region, making it instructive to emphasize region-specific relationships between air pollutants and glaucoma. NH4 and NO3, as co-indicators, exhibit consistent regional distribution, with Tianjin, Shandong, and Jiangsu ranking as the most polluted cities (Supplementary Table S1). Air pollutant density positively correlates with industrialization levels, particularly in regions with heavy industries such as steel, chemicals, and petroleum processing (23, 24). In low-and middle-income countries industrialization often leads to significant environmental damage, which in turn drives social, economic, and lifestyle changes. These changes contribute to the rising prevalence of chronic diseases such as diabetes, myopia, and high blood pressure, particularly among the older adult population. Importantly, these chronic conditions are closely associated with an increased risk of glaucoma (25). Thus, industrialization indirectly elevates glaucoma risk by fostering environmental and lifestyle factors that predispose individuals to these chronic diseases. Geographically, Tianjin, Shandong, and Jiangsu are located in North and East China, situated on the eastern plains characterized by relatively flat terrain. This topography limits pollutant dispersion, particularly in winter when reduced cold air activity often leads to temperature inversions. During these inversions, temperature rises with altitude, causing pollutants to accumulate at lower altitudes and exacerbating air pollution. Furthermore, the humid air and coastal sea breezes in these areas can carry pollutants further inland, compounding pollution levels (26, 27). It is worth noting that Tianjin, the city with the highest concentration of NH4 and NO3, may also experience elevated glaucoma risk due to socioeconomic factors in addition to environmental pollution. Studies have shown that socioeconomic deprivation is an independent risk factor for advanced glaucoma, associated with poor education, limited access to healthcare, and perceived medical costs (28). As a city with a lower GDP index, Tianjin is particularly susceptible to these economic factors, which may interact synergistically with environmental pollution to further increase glaucoma risk.
Covariates such as age, gender, educational level, and diabetes play significant roles in glaucoma occurrence and progression, each contributing through distinct yet interconnected mechanisms. Age is a well-established risk factor, with glaucoma incidence rising exponentially after 40 (29). This is attributed to age-related degenerative changes in the optic nerve and reduced trabecular meshwork function, which impair aqueous humor outflow and elevate intraocular pressure (IOP) (30). Additionally, age-related vascular changes, such as reduced ocular blood flow, may exacerbate optic nerve damage (31). These findings align with global trends showing aging populations as a key driver of glaucoma prevalence. Gender-related effects vary by region and glaucoma subtype. For example, women may have a higher prevalence of primary open-angle glaucoma in some populations, potentially due to hormonal influences (32). In East Asia, women show higher rates of angle-closure glaucoma, likely due to shallower anterior chambers (33). These variations highlight the need for region-specific research to clarify gender’s role in glaucoma risk. Educational level indirectly influences glaucoma outcomes by shaping health behaviors and access to care. Higher education is associated with greater health literacy and participation in screening programs, enabling earlier detection (34). Conversely, lower educational attainment is linked to delayed diagnosis and advanced disease, underscoring the role of socioeconomic factors in glaucoma disparities. Diabetes impacts glaucoma risk through vascular and metabolic pathways. Reduced ocular blood flow and hyperglycemia-induced oxidative stress can impair optic nerve perfusion and elevate IOP (35). A meta-analysis showed that the overall relative risk of glaucoma in patients with and without diabetes was 1.48 (95% CI, 1.29–1.71), suggesting a bidirectional relationship where glaucoma may also hinder diabetes management (36). The interaction between environmental factors and regional characteristics is an important consideration. In highly industrialized regions like Tianjin, Shandong, and Jiangsu, environmental pollution and socioeconomic factors may synergistically increase glaucoma risk. Air pollutants such as PM2.5 and PM10 are linked to systemic inflammation and oxidative stress (37), potentially exacerbating glaucoma-related vascular and metabolic dysregulation (38). Regional disparities in healthcare access further compound these risks, particularly for vulnerable populations (39). In conclusion, these covariates interact through biological, behavioral, and environmental pathways to influence glaucoma risk. A deeper understanding of these mechanisms, particularly in understudied populations, is essential for developing targeted prevention and intervention strategies.
Although this study offers a novel perspective on the relationship between air pollutants and glaucoma, some limitations exist. First of all, although the investigator’s address is used to match the exposure indicators, the change of residence may lead to matching errors. Second, although our study controls for several important confounders, it fails to account for potential confounders such as household clean fuel use. Finally, this study was cross-sectional in nature, using exposure and health outcome data from a single year (2015). As a result, we could not assess temporal relationships or causal inferences. Future longitudinal studies with repeated measures of both air pollution and glaucoma diagnoses are warranted to confirm our findings and further explore the temporal dynamics of the association.
Conclusion
In our study, we examined the role of environmental pollutants, specifically NH4 and NO3, which are key components of secondary inorganic aerosols contributing to PM2.5. These compounds form through atmospheric reactions involving NH₃ and NO4, particularly in areas with high industrial and agricultural activities. Our findings reveal a significant association between elevated levels of NH₄ and NO₃ and increased glaucoma incidence among middle-aged and older adult populations in China. This association is most pronounced in industrialized regions like Tianjin, Shandong, and Jiangsu. By focusing on NH₄ and NO₃ as components of PM2.5, our study underscores the need to address secondary inorganic aerosols in air pollution control strategies. Reducing emissions of their precursors, such as NH₃ and NO4, could significantly lower PM2.5 levels and, in turn, reduce associated health risks, including glaucoma. Future research should investigate the specific mechanisms by which these components contribute to glaucoma pathogenesis, as well as explore potential synergistic effects with other air pollutants and environmental factors.
Patient and public involvement
It was not appropriate or possible to involve patients or the public in the design, or conduct, or reporting, or dissemination plans of our research.
Data availability statement
Publicly available datasets were analyzed in this study. This data can be found: https://charls.pku.edu.cn/.
Ethics statement
The studies involving humans were approved by CHARLS study conformed to the Declaration of Helsinki and gained approval for interviewing respondents and collecting data from the Biomedical Ethics Review Committee of Peking University (IRB00001052-11015). The studies were conducted in accordance with the local legislation and institutional requirements. Written informed consent for participation was not required from the participants or the participants’ legal guardians/next of kin in accordance with the national legislation and institutional requirements.
Author contributions
XL: Conceptualization, Data curation, Formal analysis, Funding acquisition, Investigation, Methodology, Project administration, Resources, Software, Supervision, Validation, Visualization, Writing – original draft, Writing – review & editing. Z-YL: Data curation, Investigation, Methodology, Software, Writing – original draft, Writing – review & editing. SL: Investigation, Methodology, Software, Supervision, Validation, Writing – original draft, Writing – review & editing. Z-JZ: Formal analysis, Investigation, Project administration, Validation, Writing – original draft, Writing – review & editing. J-fT: Conceptualization, Data curation, Formal analysis, Funding acquisition, Investigation, Methodology, Project administration, Resources, Software, Supervision, Validation, Visualization, Writing – original draft, Writing – review & editing. Y-qS: Conceptualization, Data curation, Formal analysis, Funding acquisition, Investigation, Methodology, Project administration, Resources, Software, Supervision, Validation, Visualization, Writing – original draft, Writing – review & editing.
Funding
The author(s) declare that financial support was received for the research and/or publication of this article. The study described was supported by grants from a Key Project and a Lab Project at Chongqing Three Gorges Medical College, China (SYS20210021), and a project supported by the Chongqing Education Commission Science and Technology Research Program (KJQN202302715).
Acknowledgments
The authors would like to thank the CHARLS team for collecting the data and providing an open access platform for the data and the respondents.
Conflict of interest
The authors declare that the research was conducted in the absence of any commercial or financial relationships that could be construed as a potential conflict of interest.
Generative AI statement
The authors declare that no Gen AI was used in the creation of this manuscript.
Publisher’s note
All claims expressed in this article are solely those of the authors and do not necessarily represent those of their affiliated organizations, or those of the publisher, the editors and the reviewers. Any product that may be evaluated in this article, or claim that may be made by its manufacturer, is not guaranteed or endorsed by the publisher.
Supplementary material
The Supplementary material for this article can be found online at: https://www.frontiersin.org/articles/10.3389/fpubh.2025.1541803/full#supplementary-material
Abbreviations
CHARLS, China Health and Retirement Longitudinal Study; RCS, restricted cubic spline; DALYs, rising Disability-Adjusted Life Years; CHAP, China High Air Pollutants; STET, space–time extremely randomized trees; GLM, Generalized linear models; 95%CI, 95% confidence intervals; OR, odds ratios; AUC, area under the receiver operator characteristic curve; DCA, decisive curve analysis; PM, particulate matter.
Footnotes
References
1. Davis, BM, Crawley, L, Pahlitzsch, M, Javaid, F, and Cordeiro, MF. Glaucoma: the retina and beyond. Acta Neuropathol. (2016) 132:807–26. doi: 10.1007/s00401-016-1609-2
2. Lin, Y, Jiang, B, Cai, Y, Luo, W, Zhu, X, Lin, Q, et al. The global burden of Glaucoma: findings from the global burden of disease 2019 study and predictions by Bayesian age-period-cohort analysis. J Clin Med. (2023) 12:1828. doi: 10.3390/jcm12051828
3. Huang, X, Xu, M, Zhou, M, Liu, W, Zhao, X, and Sun, X. The association between glaucoma and all-cause mortality in middle-aged and elderly Chinese people: results from the China health and retirement longitudinal study. Epidemiol Health. (2023) 45:e2023066. doi: 10.4178/epih.e2023066
4. Zhou, X, Zhu, Q, Yi, J, Li, J, Li, Q, Kuang, J, et al. The prevalence of Glaucoma and its related factors in rural residents: a cross-sectional study in Jiangxi. China J Ophthalmol. (2021) 2021:5551837. doi: 10.1155/2021/5551837
5. Grant, A, Leung, G, Aubin, M-J, Kergoat, M-J, Li, G, and Freeman, EE. Fine particulate matter and age-related eye disease: the Canadian longitudinal study on aging. Invest Ophthalmol Vis Sci. (2021) 62:7. doi: 10.1167/iovs.62.10.7
6. Lin, C-C, Chiu, C-C, Lee, P-Y, Chen, K-J, He, C-X, Hsu, S-K, et al. The adverse effects of air pollution on the eye: a review. Int J Environ Res Public Health. (2022) 19:1186. doi: 10.3390/ijerph19031186
7. Alryalat, SA, Toubasi, AA, Patnaik, JL, and Kahook, MY. The impact of air pollution and climate change on eye health: a global review. Rev Environ Health. (2024) 39:291–303. doi: 10.1515/reveh-2022-0209
8. Zhao, R, Chen, S, Wang, W, Huang, J, Wang, K, Liu, L, et al. The impact of short-term exposure to air pollutants on the onset of out-of-hospital cardiac arrest: a systematic review and meta-analysis. Int J Cardiol. (2017) 226:110–7. doi: 10.1016/j.ijcard.2016.10.053
9. Wang, M, Aaron, CP, Madrigano, J, Hoffman, EA, Angelini, E, Yang, J, et al. Association between long-term exposure to ambient air pollution and change in quantitatively assessed emphysema and lung function. JAMA. (2019) 322:546–56. doi: 10.1001/jama.2019.10255
10. Xu, T, Ye, X, Lu, X, Lan, G, Xie, M, Huang, Z, et al. Association between solid cooking fuel and cognitive decline: three nationwide cohort studies in middle-aged and older population. Environ Int. (2023) 173:107803. doi: 10.1016/j.envint.2023.107803
11. Jiang, L, Li, L, Xu, Z, Tang, Y, Zhai, Y, Fu, X, et al. Non-linear associations of atherogenic index of plasma with prediabetes and type 2 diabetes mellitus among Chinese adults aged 45 years and above: a cross-sectional study from CHARLS. Front Endocrinol. (2024) 15:1360874. doi: 10.3389/fendo.2024.1360874
12. Niu, Z-J, Cui, Y, Wei, T, Dou, M, Zheng, B-X, Deng, G, et al. The effect of insulin resistance in the association between obesity and hypertension incidence among Chinese middle-aged and older adults: data from China health and retirement longitudinal study (CHARLS). Front Public Health. (2024) 12:1320918. doi: 10.3389/fpubh.2024.1320918
13. Feng, S, Gao, D, Liao, F, Zhou, F, and Wang, X. The health effects of ambient PM2.5 and potential mechanisms. Ecotoxicol Environ Saf. (2016) 128:67–74. doi: 10.1016/j.ecoenv.2016.01.030
14. Gamble, JF. PM2.5 and mortality in long-term prospective cohort studies: cause-effect or statistical associations? Environ Health Perspect. (1998) 106:535–49. doi: 10.1289/ehp.98106535
15. Li, C, Martin, RV, van Donkelaar, A, Boys, BL, Hammer, MS, Xu, J-W, et al. Trends in chemical composition of global and regional population-weighted fine particulate matter estimated for 25 years. Environ Sci Technol. (2017) 51:11185–95. doi: 10.1021/acs.est.7b02530
16. Wei, Y, Tian, X, Huang, J, Wang, Z, Huang, B, Liu, J, et al. New insights into the formation of ammonium nitrate from a physical and chemical level perspective. Front Environ Sci Eng. (2023) 17:137. doi: 10.1007/s11783-023-1737-6
17. Liu, M, Huang, X, Song, Y, Tang, J, Cao, J, Zhang, X, et al. Ammonia emission control in China would mitigate haze pollution and nitrogen deposition, but worsen acid rain. Proc Natl Acad Sci. (2019) 116:7760–5. doi: 10.1073/pnas.1814880116
18. Li, L, Xing, C, Zhou, J, Niu, L, Luo, B, Song, M, et al. Airborne particulate matter (PM2.5) triggers ocular hypertension and glaucoma through pyroptosis. Part Fibre Toxicol. (2021) 18:10. doi: 10.1186/s12989-021-00403-4
19. Jayaram, H, Kolko, M, Friedman, DS, and Gazzard, G. Glaucoma: now and beyond. Lancet. (2023) 402:1788–801. doi: 10.1016/S0140-6736(23)01289-8
20. Jassim, AH, Fan, Y, Pappenhagen, N, Nsiah, NY, and Inman, DM. Oxidative stress and hypoxia modify mitochondrial homeostasis during Glaucoma. Antioxid Redox Signal. (2021) 35:1341–57. doi: 10.1089/ars.2020.8180
21. Gu, Y, Sheng, F, Gao, M, Zhang, L, Hao, S, Chen, S, et al. Acute and continuous exposure of airborne fine particulate matter (PM2.5): diverse outer blood–retinal barrier damages and disease susceptibilities. Part Fibre Toxicol. (2023) 20:50. doi: 10.1186/s12989-023-00558-2
22. Leshno, A, Kenigsberg, A, Peleg-Levy, H, Piperno, S, Skaat, A, and Shpaisman, H. Acoustic manipulation of intraocular particles. Micromachines. (2022) 13:1362. doi: 10.3390/mi13081362
23. Wang, S, Liu, J, Yi, H, Tang, X, Yu, Q, Zhao, S, et al. Trends in air pollutant emissions from the sintering process of the iron and steel industry in the Fenwei plain and surrounding regions in China, 2014–2017. Chemosphere. (2022) 291:132917. doi: 10.1016/j.chemosphere.2021.132917
24. Cao, L, Zhai, D, Kuang, M, and Xia, Y. Indoor air pollution and frailty: a cross-sectional and follow-up study among older Chinese adults. Environ Res. (2022) 204:112006. doi: 10.1016/j.envres.2021.112006
25. Wang, L, Zhang, X, Cai, S, Ma, J, Liu, X, and Wang, N. Correlated or not: Glaucoma prevalence and modern industrialization. Med Hypotheses. (2011) 76:220–4. doi: 10.1016/j.mehy.2010.10.001
26. Liu, L, Wang, Y, and Zhao, Y. Air pollutant emissions caused by receiving international industrial transfer in southeast Asian developing countries from 1990 to 2018. Sci Total Environ. (2024) 921:171110. doi: 10.1016/j.scitotenv.2024.171110
27. Cheng, L, Ye, Z, Wei, W, Wang, K, Wang, R, Yang, L, et al. Study on the establishment of air pollutant and carbon emission inventory and collaborative emission reduction potential of China’s coking industry from 2012 to 2022. Sci Total Environ. (2024) 951:175183. doi: 10.1016/j.scitotenv.2024.175183
28. Wong, TL, Ang, JL, Deol, S, Buckmaster, F, McTrusty, AD, and Tatham, AJ. The relationship between multiple deprivation and severity of glaucoma at diagnosis. Eye Lond Engl. (2023) 37:3376–81. doi: 10.1038/s41433-023-02508-w
29. Weinreb, RN, Aung, T, and Medeiros, FA. The pathophysiology and treatment of glaucoma: a review. JAMA. (2014) 311:1901–11. doi: 10.1001/jama.2014.3192
30. Li, G, van Batenburg-Sherwood, J, Safa, BN, Fraticelli Guzmán, NS, Wilson, A, Bahrani Fard, MR, et al. Aging and intraocular pressure homeostasis in mice. Aging Cell. (2024) 23:e14160. doi: 10.1111/acel.14160
31. Stein, JD, Khawaja, AP, and Weizer, JS. Glaucoma in adults—screening, diagnosis, and management: a review. JAMA. (2021) 325:164–74. doi: 10.1001/jama.2020.21899
32. Kai, J-Y, Zhou, M, Li, D-L, Zhu, K-Y, Zhang, X-F, and Pan, C-W. Reproductive factors and the risk of open angle Glaucoma in women. J Glaucoma. (2023) 32:954–61. doi: 10.1097/IJG.0000000000002292
33. Zhang, N, Wang, J, Chen, B, Li, Y, and Jiang, B. Prevalence of primary angle closure Glaucoma in the last 20 years: a meta-analysis and systematic review. Front Med. (2020) 7:624179. doi: 10.3389/fmed.2020.624179
34. Williams, AM, Theophanous, C, Muir, KW, Rosdahl, JA, Woolson, S, Olsen, M, et al. Within-trial cost-effectiveness of an adherence-enhancing educational intervention for glaucoma. Am J Ophthalmol. (2022) 244:216–27. doi: 10.1016/j.ajo.2022.08.011
35. Nakamura, M, Kanamori, A, and Negi, A. Diabetes mellitus as a risk factor for glaucomatous optic neuropathy. Ophthalmologica. (2005) 219:1–10. doi: 10.1159/000081775
36. Zhao, D, Cho, J, Kim, MH, Friedman, DS, and Guallar, E. Diabetes, fasting glucose, and the risk of glaucoma: a meta-analysis. Ophthalmology. (2015) 122:72–8. doi: 10.1016/j.ophtha.2014.07.051
37. Liu, K, Hua, S, and Song, L. PM2.5 exposure and asthma development: the key role of oxidative stress. Oxidative Med Cell Longev. (2022) 2022:3618806–12. doi: 10.1155/2022/3618806
38. Cao, F, Liu, Z-R, Ni, Q-Y, Zha, C-K, Zhang, S-J, Lu, J-M, et al. Emerging roles of air pollution and meteorological factors in autoimmune eye diseases. Environ Res. (2023) 231:116116. doi: 10.1016/j.envres.2023.116116
Keywords: glaucoma, air pollutant, CHARLS, machine learning, middle-aged and older adults
Citation: Li X, Luo Z-Y, Lei S, Zhang Z-J, Tang J-f and Sun Y-q (2025) Exploring association between ambient air pollution and glaucoma in China: a nationwide analysis with predictive modeling based on the China Health and Retirement Longitudinal Study. Front. Public Health. 13:1541803. doi: 10.3389/fpubh.2025.1541803
Edited by:
Arthit Phosri, Mahidol University, ThailandReviewed by:
Anindya Sen, Heritage Institute of Technology, IndiaMohd Faiz Ibrahim, Ministry of Health, Malaysia
Enping Huang, Southern Medical University, China
Copyright © 2025 Li, Luo, Lei, Zhang, Tang and Sun. This is an open-access article distributed under the terms of the Creative Commons Attribution License (CC BY). The use, distribution or reproduction in other forums is permitted, provided the original author(s) and the copyright owner(s) are credited and that the original publication in this journal is cited, in accordance with accepted academic practice. No use, distribution or reproduction is permitted which does not comply with these terms.
*Correspondence: Jia-feng Tang, NTcwOTQ2NDRAcXEuY29t; Yi-qing Sun, U3VubjE5OTlAMTYzLmNvbQ==
†These authors have contributed equally to this work
 Xiang Li
 Zhan-Yang Luo
 Sen Lei
 Zhi-Jie Zhang
 Jia-feng Tang
 Yi-qing Sun