 Hui Yang
 Juan Cao2†
 Lin Huang
 Zhijun Xie
 Yuejun Zhou
 Chengping Wen
- 1College of Basic Medical Sciences, Zhejiang Chinese Medical University, Hangzhou, China
- 2Medical College of Zhejiang University, Hangzhou, China
- 3College of Basic Medical Sciences, Shanghai University of Traditional Chinese Medicine, Shanghai, China
Background: The relationship between lung function and depression in middle-aged and older adults remains poorly understood. To address this knowledge gap, we conducted cross-sectional and longitudinal analyses using data from the nationally representative China Health and Retirement Longitudinal Study (CHARLS) to examine the association between peak expiratory flow (PEF) status and depression among middle-aged and older Chinese adults.
Methods: A total of 15,137 participants aged 45 years and older were included from the 2015 China Health and Retirement Longitudinal Study (CHARLS). Participants were categorized into three PEF status groups based on their percentage of predicted PEF: severe impairment (<80%), average lung function (80–100%), and good lung function (≥100%). A total of 12,304 participants were included in the longitudinal analysis from 2015 to 2018. To address potential confounding, propensity score matching was employed using a gradient-boosting model to balance covariates between participants with and without depression. Logistic regression analyses as well as restricted cubic spline (RCS) regression analyses were performed to examine the association between (PEF) status and depression incidence.
Findings: The prevalence of depression was 9.53% (n = 1,044) in the cross-sectional sample, with higher rates observed in participants with poorer lung function (9.53, 7.11, and 5.03% for good, moderately good, and poorer lung function, respectively). During a 3.6-year follow-up, 6.73% (n = 130) of participants developed depression. Fully adjusted logistic regression analysis demonstrated a significant inverse linear association between PEF percentage and depression risk (OR: 0.898, 95% CI: 0.862–0.935, per 1 SD increase). These findings were corroborated by restricted cubic spline (RCS) regression analysis, which revealed a linear relationship without evidence of nonlinearity (P for nonlinearity = 0.631).
Conclusion: Our study revealed a noteworthy correlation between PEF percentage and depression among the middle-aged and older population. The PEF percentage emerges as a valuable tool that may enhance the primary prevention and treatment of depression.
Introduction
Depression is a common mental disorder worldwide and a leading cause of disability (1). Mental health problems, especially depression, among the old people, represent a significant public health challenge in aging societies (2). Moreover, the prevalence of depression tends to increase with age (3, 4). In China, where the old people population is projected to reach 400 million by 2050 (5–7), depression affects over 95 million individuals nationwide, making it a major mental health concern (8).
Depression may be a complex outcome, particularly in the onset process among old people individuals. A multivariate logistic regression analysis showed that depressive symptoms in old people patients are associated with education level, financial status, exercise habits, occurrence of chronic diseases, and loneliness (9). Social isolation in particular is a significant issue among the old people population in today’s world. A cohort study involving 25,482 people in Japan found that the prevalence of social isolation increased from 21 to 28% during the COVID-19 pandemic (10).
Previous studies have found that the occurrence of depression in the old people may be associated with major risk factors for late-life depression including gender, rural residence, living alone, low monthly income, unhealthy lifestyle, major medical conditions, and psychosocial problems. The incidence of depressive disorders is significantly higher in women than in men, and higher in rural areas than in urban areas. This includes disparities between rural and urban areas in terms of economic levels, social services, and healthcare access (11–13).
Systematic review evidence has confirmed the antidepressant effects of exercise on late-life depression (14, 15), while the association between lung function and the occurrence of depression remains unclear. A comprehensive review of 1,161,632 individuals showed that moderate to high pulmonary fitness correlates with reduced depression risk (16). Supporting this finding, a longitudinal study of middle-aged and older Chinese adults demonstrated that increased depressive symptoms significantly correlated with reduced PEF (b = −1.85, p < 0.001), with men experiencing a notably steeper decline (b = −2.36, p < 0.001) compared to women (b = −1.46, p < 0.001) during periods of heightened depressive symptoms (17). These findings suggest that better psychological health could help minimize the impact of reduced pulmonary function and decrease depression risk. Depression often occurs alongside cognitive impairments, indicating that disrupted interactions in cognition-related brain networks may underlie its varied symptoms (18).
Using data from the China Health and Retirement Longitudinal Study (CHARLS), we examined the relationship between lung function and depression in middle-aged and older Chinese adults.
While previous studies have examined the relationship between depressive symptoms and lung function, their findings have been inconsistent (19, 20).
Furthermore, unlike Western countries, the treatment rate for depression among old people in China is extremely low, which may be related to the high level of stigma that old people attach to depression, which is tied to Chinese social and cultural factors (21). For example, in a sample of urban Chinese primary care old people patients, the treatment rate for major depression was less than 1% (22). This indicates that there are substantial unmet mental health needs among old people Chinese patients. Analysis of the CHARLS cohort helps examine the overall situation of depression among China’s old people population.
Therefore, our study aims to address this knowledge gap by using a larger sample size to investigate the effects of depressive symptoms on lung function in Chinese adults without pulmonary diseases. Through both cross-sectional and longitudinal analyses, we investigated how impaired lung function contributes to depression prevalence. Our findings indicate that peak expiratory flow (PEF), an easily measurable indicator of lung function, could serve as a useful biomarker for early depression detection.
Methods
Data and study participants
CHARLS is a nationally representative longitudinal study following Chinese adults aged 45 and older since its inception in 2011. The study captures detailed information on participants’ health, socioeconomic conditions, and lifestyle through regular in-person interviews and standardized questionnaires.
A nationally representative sample of 17,708 individuals from 10,257 households across China’s 28 provinces was selected using a multi-stage stratified probability proportional sampling method. Participants have been followed up every 2 years since the study began. The data incorporates weighting variables to maintain national representativeness. Detailed information about the study design of the CHARLS has been previously reported (23).
This study retrospectively analyzed data from the 2015 and 2018 waves of the CHARLS survey. Inclusion criteria were: (1) being aged 45 or older in the 2015 CHARLS survey; and (2) having complete data on peak expiratory flow rate. Exclusion criteria were: (1) missing data on peak expiratory flow rate in the 2015 CHARLS survey; (2) missing age information; (3) being younger than 45 years old; (4) lacking essential data from the cognitive and depression assessments; and (5) pre-existing diagnosis of respiratory diseases.
A two-part study was conducted. The cross-sectional analysis involved a retrospective review of data from the 2015 wave of the CHARLS. Of the 21,801 participants, 5,958 were excluded due to missing PEF data (n = 6,257), age less than 45 years (n = 325), or missing data on key cognitive and depression variables (n = 31). The final analytic sample for the cross-sectional analysis consisted of 15,188 participants.
For the longitudinal analysis, a subset of the CHARLS cohort was selected. Participants with a diagnosis of depression in 2015 were excluded. After excluding those lost to follow-up in 2018 (n = 2,671) and those without IC scores in 2018 (n = 211), the final analytic sample for the longitudinal analysis consisted of 12,304 participants. The selection process is depicted in Figure 1.
Figure 1. Study cohort. Inclusion and exclusion criteria for the study cohort (n = 12,304).
This study adhered to the Declaration of Helsinki and relevant ethical standards. All participants provided written informed consent after receiving detailed information about the study. The study protocol was approved by the Institutional Review Board of Peking University (IRB00001052-11,015). To ensure methodological rigor, this study strictly followed the STROBE guidelines.
Interview procedures and quality control
The CHARLS survey employs a rigorous and standardized questionnaire administration process to ensure data quality. Trained interviewers (undergraduate/graduate students) conducted in-person, computer-assisted personal interviews (CAPI) using standardized questionnaires. Interviewers underwent rigorous training, including mock interviews and examinations, to ensure protocol adherence. For participants unable to respond (e.g., due to cognitive impairment), proxy informants provided answers. Supervisors monitored fieldwork to resolve technical issues and ensure data accuracy. The CAPI system enabled real-time error detection and correction. Detailed methodology and quality control measures are described elsewhere (24).
Measurement of peak expiratory flow
Peak expiratory flow (PEF) was measured using a portable peak flow meter (Everpure™, Shanghai, China) and a disposable mouthpiece. Trained technicians obtained three PEF measurements per participant, using the highest value for analysis. Participants were instructed to stand upright, inhale deeply, and exhale forcefully into the mouthpiece. A 30-s rest period was observed between measurements.
To account for the unique characteristics of the Chinese population, we employed the peak expiratory flow (PEF) prediction equations proposed by Zhong Nanshan et al (25). Based on the Chinese national census data. These equations apply to adults aged 18–80 years and are expressed as follows: for males, PEF (L/min) = 75.6 + 20.4 × A - 0.41 × A2 + 0.002 × A3 + 1.19 × H; for females, PEF (L/min) = 282.0 + 1.79 × A - 0.046 × A2 + 0.68 × H, where A represents age and H represents height.
Our main analyses used a widely accepted fixed cutoff point of 80% of predicted PEF, with scores less than 80% of predicted PEF indicating low PEF values (26). We classified participants into three groups based on their percentage of predicted PEF: severe impairment (<80%), Average lung function (80–100%), and good lung function (≥100%). These categories were used to characterize the status of airflow obstruction.
Assessment of depression
Depressive symptoms were assessed at baseline using the Chinese version of the Center for Epidemiologic Studies Depression Scale (CES-D-10), a validated instrument for measuring depression in Chinese old people populations (27, 28). The CES-D-10 consists of 10 items assessing depressive symptoms experienced in the past week, with two positively worded items. The total score ranged from 0 to 30, with higher scores indicating more severe depressive symptoms.
Assessment of sarcopenia
Sarcopenia was assessed using the AWGS 2019 algorithm, incorporating muscle strength, appendicular skeletal muscle mass (ASM), and physical performance. Grip strength was measured in both hands using the Yuejian TM WL-1000 dynamometer (Nantong Yuejian Physical Fitness Measuring Instrument Co., Ltd., Nantong, China). ASM was estimated using validated anthropometric equations specific to the Chinese population. Low muscle mass was defined as an ASM/height2 value below 5.63 kg/m2 for women and 7.05 kg/m2 for men.
Assessment of intrinsic capacity score
An intrinsic capacity (IC) score was computed, encompassing physical capacity (1 km walk completion), vitality (self-rated health), sensory function (vision and hearing), psychological well-being (depressive symptoms), and cognitive function (word memory, calculation, episodic memory, drawing). The IC score was structured into an overall domain and five subdomains (physical, cognitive, vitality, sensory, psychological), for each subdomain, a binary score was assigned: 1 if there was evidence of impairment and 0 if there was no impairment. The total IC score was calculated by summing the scores across all five subdomains.
Covariates
Baseline sociodemographic data (age, gender, education, marital status, residence) and health-related information were collected through structured interviews conducted by trained interviewers. To comprehensively explore the multifaceted etiology of depression, a Gradient Boosting Machine (GBM) model was employed. A wide range of covariates, including individual-level biological, psychological, and social factors (e.g., marital status, childhood adversities, socioeconomic indicators), were incorporated into the GBM model to examine their intricate relationships with depression. Although the amount of missing data was relatively small, multiple imputation was performed using the mice package in R to address potential biases. The algorithm was configured with m = 5 imputations, balancing statistical efficiency and computational feasibility, and maxit = 20 iterations to ensure convergence (verified via trace plots). Predictive mean matching (PMM) was applied for continuous variables, while binary variables were imputed using logistic regression, with variable-specific methods explicitly defined in the meth argument. A detailed overview of the missing data pattern is presented in Supplementary Figure S1.
Statistical analysis
A gradient boosting model (GBM) was employed to estimate propensity scores for depression, mitigating covariate imbalance between depression and non-depression groups. GBM iteratively constructs new models, forming an ensemble that optimizes a loss function. We chose to use the Gradient Boosting Machine (GBM) method because it’s good at finding complex patterns in data without needing detailed instructions. This is especially useful for studying depression because depression has many different causes - from physical and mental health factors to social and economic conditions, as well as early life experiences. Other methods that Random Forests, while capable of handling complex relationships, offer less precision than GBM; Support Vector Machines (SVM) perform well but present challenges in setup and scalability with large datasets; and logistic regression, though more interpretable, is less effective at analyzing complex variable interactions.
Baseline characteristics of cross-sectional and longitudinal study participants were summarized according to the percentage of predicted peak expiratory flow rate. Categorical variables were compared using Chi-square or Fisher’s exact tests, as appropriate. Continuous variables were compared using one-way ANOVA followed by Tukey’s post hoc test if normally distributed, or the Kruskal-Wallis test otherwise. Continuous variables are presented as mean (SD), and categorical variables as percentages.
Cross-sectional associations between lung function status (potential impairment, average, good) and depression were assessed using logistic regression analysis. Additionally, a longitudinal analysis was conducted to estimate the incidence rate of depression per 1,000 person-years using the 2018 wave of the CHARLS dataset. The relationship between baseline lung function and incident depression was evaluated using relative risks (RRs) and 95% confidence intervals (CIs), with subsequent subgroup analyses.
To assess the impact of demographic, health, and socioeconomic factors on the outcome, three models were estimated in both cross-sectional and longitudinal analyses. Model 1 adjusted for gender and age. Model 2 was further adjusted for marital status, self-reported health status, and childhood health. Model 3 included all variables from Model 2, plus satisfaction with marriage, ASMHt2, satisfaction with local services, physical impairments (eyesight and hearing), economic factors (pension insurance), self-rated memory, sleep duration, difficulty with stooping, kneeling, and crouching, sleeping time, systolic blood pressure, and pulse.
The statistical analyses were performed using SPSS version 25.0 (SPSS, Inc., Chicago, IL) and R version 4.3.2 (R Foundation for Statistical Computing) for the retrospective analysis. A p-value of less than 0.05 was considered statistically significant in all cases.
Result
Characteristics of participants in the cross-sectional and longitudinal studies
Baseline characteristics of the study population are presented in Table 1. A total of 15,188 participants were included, with a mean age of 68.53 (SD 10.08) years.
Table 1. Baseline characteristics of all participants stratified by ratio of peak expiratory flow rate.
Participants were categorized into three groups based on their peak expiratory flow (PEF) percentage: restricted, average, and good. The restricted, average, and good groups comprised 4,449, 3,837, and 6,902 participants, respectively. Depression prevalence was significantly higher in the restricted group 424 (9.53) compared to the average 273 (7.11) and good 347 (5.03) groups (p < 0.001).
Compared to the restricted group, participants in the good group were older (69.64 vs. 66.56 years, p < 0.001), had a higher proportion of males (51.52% vs. 48.48%, p < 0.001), lower sarcopenia prevalence (3.39% vs. 8.90%, p < 0.001), higher physical activity levels (rec score: 13.83 vs. 11.97, p < 0.001), and better body composition, higher ASM/Ht2 score and lower TyG BMI.
The IC score, a composite measure of overall health, was significantly lower in the good group (mean IC score ± SD: 4.13 ± 1.38) compared to the restricted (4.49 ± 1.35) and average (4.27 ± 1.38) groups (p < 0.001). Typically, higher IC scores indicate better overall health.
Cross-Sectional Associations of Potential Airflow Limitation with Depression and Cognition.
A Gradient Boosting Machine (GBM) model was developed using regression trees as base learners and trained on a dataset of 15,188 observations and 53 covariates. The model demonstrated strong discriminative power in predicting depression, achieving an AUC of 0.8438. To assess model stability, 3-fold cross-validation, and early stopping were implemented. Additional performance metrics included accuracy (0.784), precision (0.803), recall (0.888), and F1-score (0.843). The relative importance of covariates in predicting propensity scores is illustrated in Figure 2.
Figure 2. Illustrates the relative importance of these covariates in predicting propensity scores.
Key factors influencing propensity scores were self-reported health, functional limitations (e.g., difficulty with toileting, and sitting), and self-reported health-related quality of life (including life satisfaction, health satisfaction, and sleep quality, encompassing both nighttime and midday sleep).
Notably, physical health factors, including respiratory function (peak expiratory flow, relative importance: 0.931) and muscle mass (ASM/Ht2, relative importance: 1.030), were strongly associated with propensity scores. Socioeconomic factors, such as the demanding nature of household agricultural work (relative importance: 1.453) and marital satisfaction (relative importance: 3.919), significantly influenced propensity scores. Additionally, childhood health (relative importance: 1.184) emerged as a crucial determinant.
These findings underscore the complex interplay of factors influencing propensity scores for depression in older adults. A comprehensive approach addressing physical, psychological, social, economic, and early life factors is essential for effective prevention and management strategies.
Association between the PEF percentages and depression incidence
The prevalence of depression in the cross-sectional sample was 9.53% (1,044/15,188) overall, with rates of 9.53% (424/4,449), 7.11% (273/3,837), and 5.03% (347/6,902) observed in participants with good, moderately good, and poorer lung function, respectively (Table 2). Fully adjusted logistic regression models demonstrated an inverse association between higher levels of PEF percentage and depression risk. Compared to those with lower PEF percentages, individuals with higher levels had lower odds of depression (OR = 0.812, 95% CI: 0.740–0.891, respectively). Moreover, when treating PEF percentage as a continuous variable, a one standard deviation increase in PEF percentage was associated with lower odds of depression (OR = 0.898, 95% CI: 0.862–0.935).
Table 2. Stratified analysis of PEF percentage and depression stratified by different levels of PEF in baseline.
Longitudinal associations between baseline PEF and depression/cognitive dysfunction
Table 3 presents the incidence rates of depression and cognitive dysfunction from 2015 to 2018, stratified by baseline PEF (peak expiratory flow) percentage status (restricted, average, good). The table shows the number of new cases, the incidence rate per 1,000 individuals, and relative ratios (RR) with 95% CI from three different models (Model 1a, Model 2b, Model 3c). The reference group for PEF percentage is ‘Restricted’. Statistical significance is denoted by *** (p < 0.001).
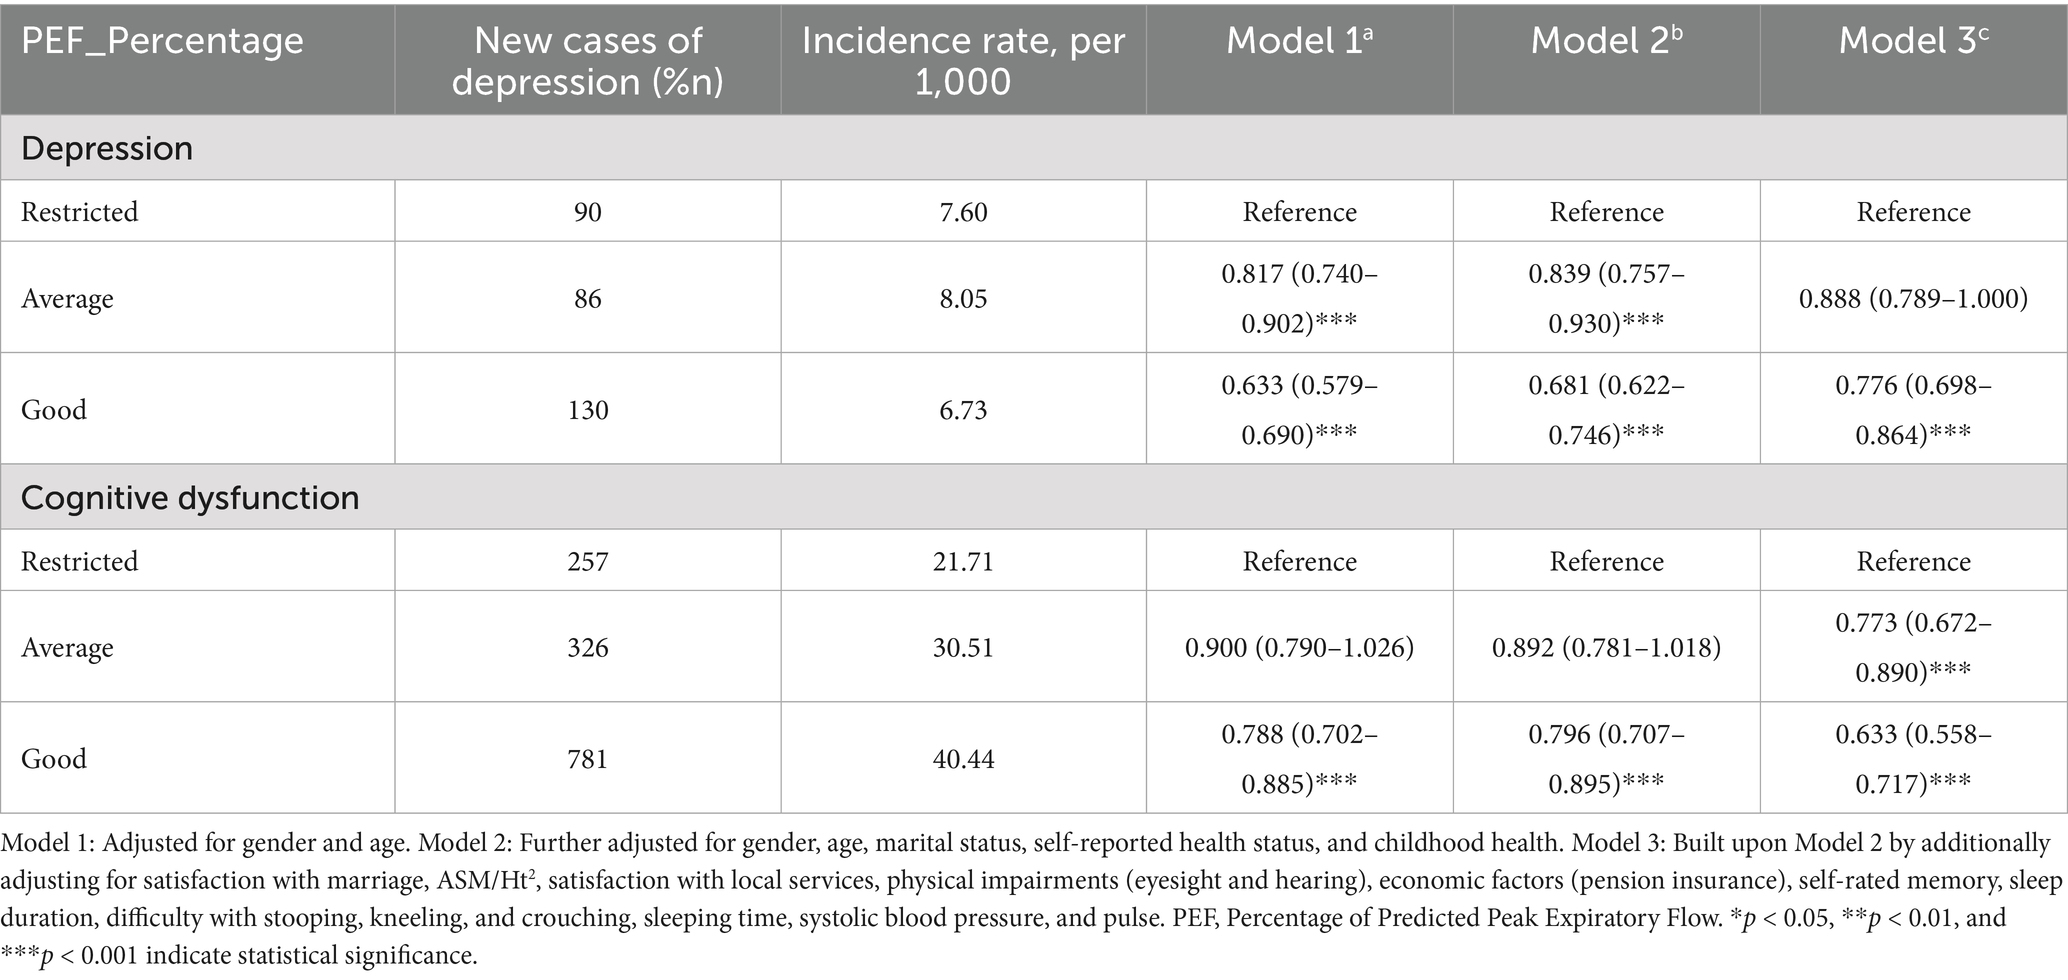
Table 3. Depression incidence rates from 2015 to 2018 stratified by baseline PEF percentage status.
As shown in the table, the incidence rate of depression was the lowest in the good PEF group (6.73 per 1,000) and highest in the restricted PEF group (7.60 per 1,000). The incidence rate of cognitive dysfunction was highest in the good PEF group (40.44 per 1,000) and lowest in the restricted PEF group (21.71 per 1,000). While a linear association between PEF and depression was observed, the relationship between PEF and cognitive dysfunction was more complex, exhibiting a non-linear pattern.
Compared to the restricted group, individuals in the average and good PEF groups had significantly lower risks of depression across all three models (Model 1a, Model 2b, and Model 3c; p < 0.001), with estimated risk reductions ranging from 11 to 37%.
To evaluate the stability of our findings, we conducted sensitivity analyses across three progressively adjusted logistic regression models using unimputed data. The results demonstrated remarkable consistency in the inverse association between pulmonary function (PEF groups) and depression risk, even without imputation for missing values. The related analysis is shown in Supplementary Table S7.
Restricted PEF demonstrated the strongest inverse association with depression across models (ORs: 0.63–0.81). Good PEF showed protective effects (ORs: 0.80–0.87), though weaker than Restricted PEF. Marital dissatisfaction levels showed a clear dose–response relationship with risk.
In all three models, both Average and Good PEF Groups consistently showed lower odds of depression compared to the Restricted PEF Group. These associations persisted after adjusting for multiple covariates, strengthening our confidence in the findings.
The analysis of unimputed data showed clear relationships between PEF groups and depression. Despite limitations from missing data, the consistent results across adjustment levels supported our conclusions. The fully adjusted model, which included health-related and socioeconomic factors, highlighted both the depression risk’s complexity and the protective role of better pulmonary function.
Figures 3A,B present restricted cubic spline (RCS) analyses assessing the association between peak expiratory flow (PEF) percentage and incident depression (Figure 3A) and cognitive function (Figure 3B), respectively. After adjusting for potential confounders, a significant nonlinear association was observed between PEF percentage and incident depression (p < 0.001), while no significant association was found between PEF percentage and cognitive function (p = 0.888). In Figure 3A, the trend reveals that in the lower range of PEF percentages, the risk of depression decreases noticeably as PEF values rise. This suggests that even modest improvements in lung function among those with poorer lung function could yield significant mental health benefits. The curve displays a steadily declining trend, emphasizing the importance of maintaining good lung function, particularly in preventing depression. In Figure 3B, Overall Significance Level: The relationship between PEF percentage and cognitive dysfunction is not statistically significant (p = 0.888), and the non-linear trend is also not significant (P for nonlinearity = 0.742). However, the curve depicts a nuanced pattern of odds ratios (ORs) as the PEF percentage varies. In the lower PEF percentage range, there seems to be a rise in the risk of cognitive dysfunction, though this trend does not achieve statistical significance. As the PEF percentage increases, the curve shows fluctuations, but no consistent trend emerges in the higher PEF percentage range to suggest that improved lung function significantly lowers the risk of cognitive dysfunction. This pattern implies that other factors—such as social isolation, nutritional status, and physical activity levels—may also play pivotal roles in the development of cognitive dysfunction.
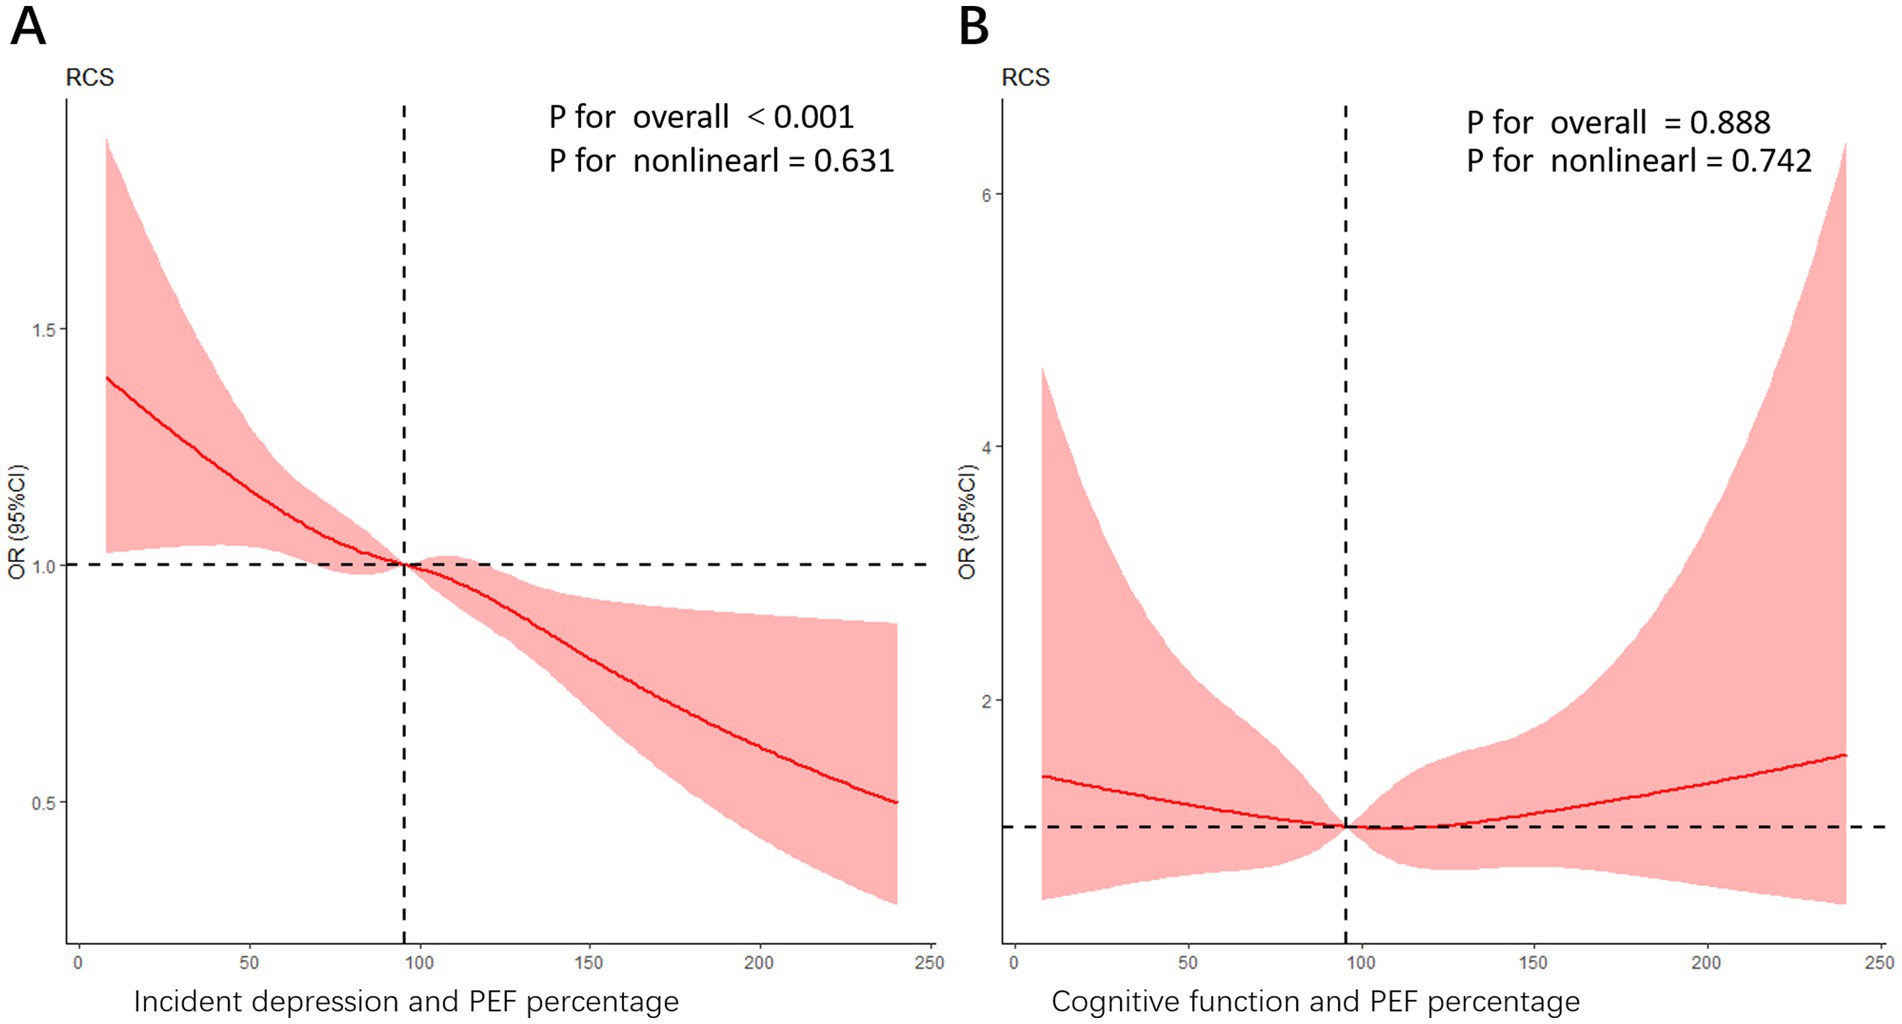
Figure 3. (A) An RCS curve illustrating the association between PEF percentage and incident depression. The model was adjusted for potential confounders including age, gender, baseline depression status, health satisfaction, childhood health, marriage satisfaction, ASM/Ht2, systolic blood pressure, pulse rate, eyesight, hearing, local service satisfaction, pension insurance, memory function, sleep duration (hours), difficulty with stooping and sitting difficulties. The overall significance level for the association is highly significant (p < 0.001), while the nonlinear trend is not significant (P for nonlinearity = 0.631). (B) An RCS curve depicting the relationship between cognitive function and PEF percentage. In this model, the overall p-value is 0.888, indicating that the association is not statistically significant, while the nonlinear trend p-value is 0.742, suggesting some nonlinearity in the relationship. The curve demonstrates a complex pattern of ORs as the PEF percentage changes. However, further interpretation should be made in light of the study design and other statistical analyses.
Subgroup analyses were conducted to examine factors associated with depression (Figure 4). Depression prevalence varied significantly across demographic, socioeconomic, and health-related characteristics. Individuals with lower socioeconomic status, characterized by lower education and income, exhibited elevated odds of depression. Additionally, those with poorer physical health, including chronic diseases and disabilities, demonstrated increased risk. Psychosocial factors such as limited social support, stressful life events, and adverse childhood experiences were associated with higher depression prevalence. Women, older adults, and individuals with impaired vision or hearing were also at increased risk. These findings highlight the complex interplay of multiple factors contributing to depression in this population.
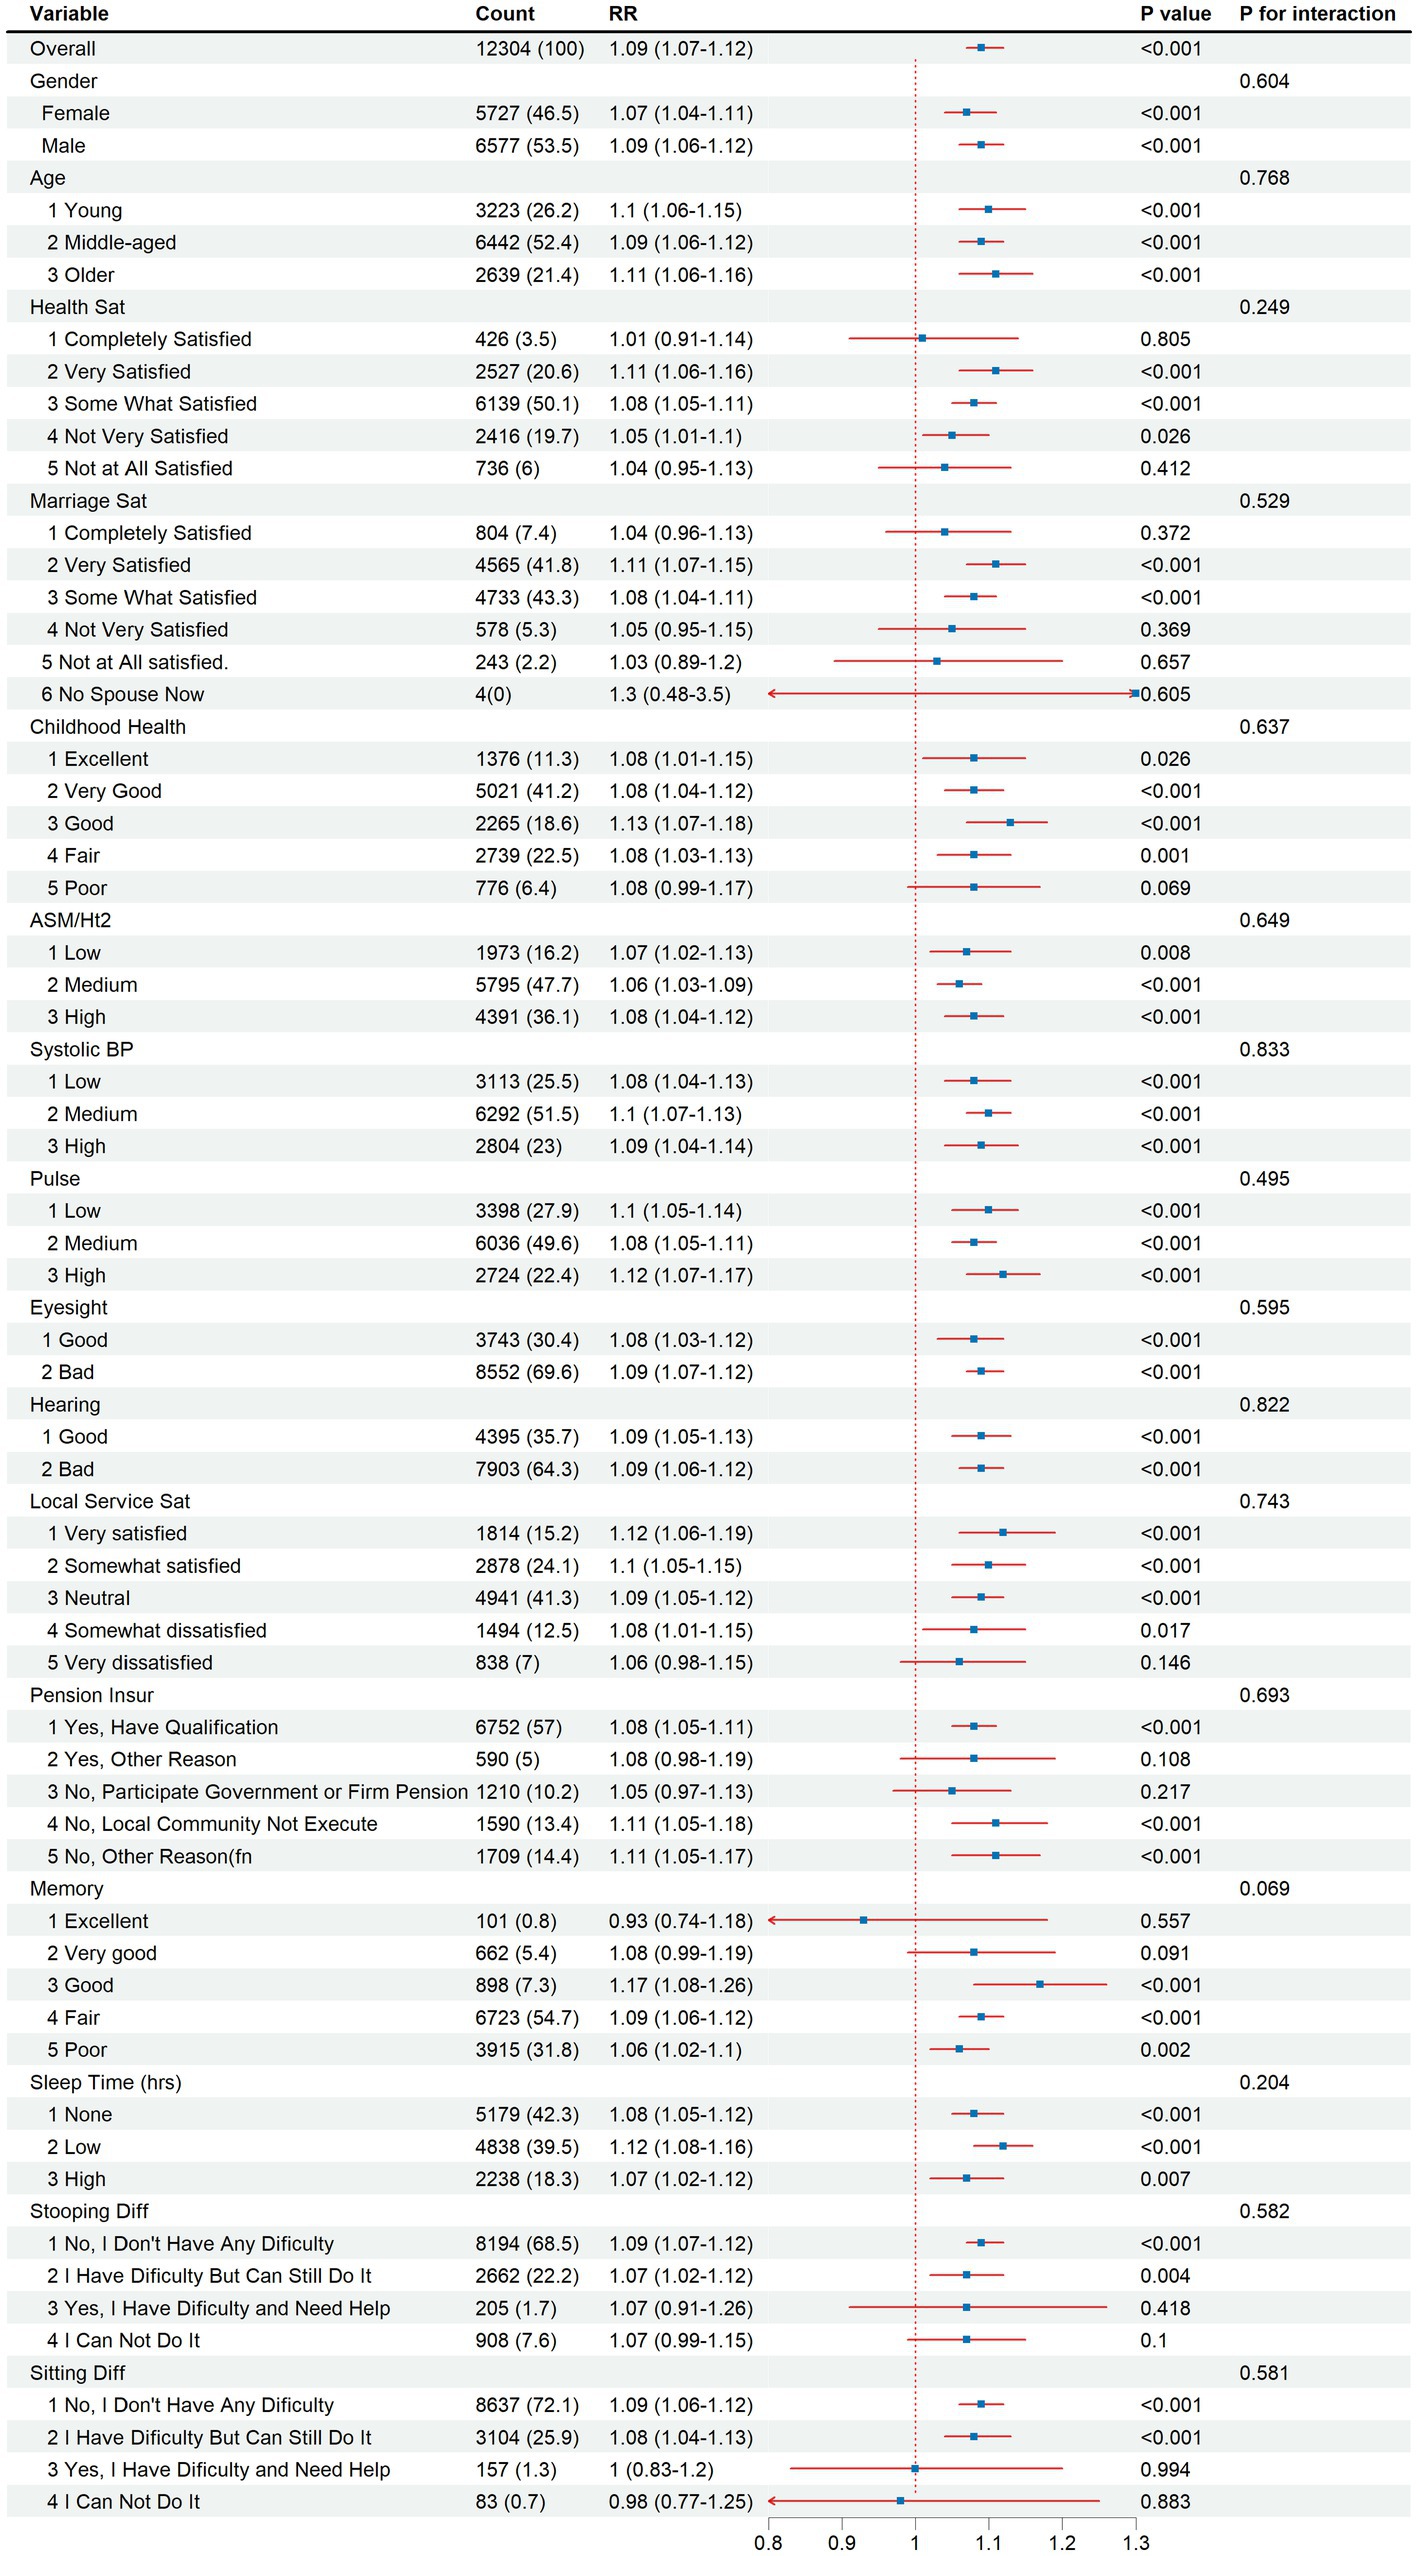
Figure 4. Subgroup analysis of depression risk by demographic, socioeconomic, and health-related factors, 2015–2018.
Discussion
This study utilized extensive longitudinal data from CHARLS, a nationally representative cohort, to examine the relationship between peak expiratory flow (PEF) and depression. Through controlling for multiple potential confounders and performing comprehensive subgroup analyses, we established evidence linking impaired lung function to depression.
We employed a Gradient Boosting Machine (GBM) to analyze depression risk factors (29). GBM proved ideal for handling confounding variables and precisely estimating each variable’s contribution to model predictions. In our study, we employed the Random Forest methodology for initial variable screening. Additionally, we have attached documentation describing our Random Forest screening methodology. This comprehensive approach ensures a rigorous and well-documented variable selection process. We considered a broad range of predictors across psychological, socioeconomic, relational, and physical domains, ultimately incorporating 53 variables in our analyses. Our findings support existing literature that emphasizes self-worth’s vital role in mental health (30, 31), People with higher self-esteem typically develop better coping mechanisms, maintain stronger social support networks, and exercise greater life control—all helping prevent depression. Additionally, early childhood experiences significantly influence self-concept and emotional regulation, affecting later depression vulnerability (32–35). Our study highlights how intimate relationships protect against depression, as quality marriages offer love, support, and companionship that buffer against stress and adversity (25, 36, 37). These insights suggest approaches to depression prevention and treatment by focusing on building self-esteem, fostering healthy attachment patterns, and strengthening social bonds.
Our cross-sectional analysis showed a strong correlation between the model’s predicted depression probability and actual depression prevalence, aligning with prior research (38, 39). Longitudinal analyses further revealed that old people individuals with respiratory impairment had a heightened risk of developing depression and cognitive decline, supporting previous findings (40–42).
Subgroup analyses revealed that depression risk was significantly influenced by multiple factors. Demographic variables (gender, age), socioeconomic conditions (income, education), and health-related factors (physical health status, chronic conditions) all played crucial roles in determining depression susceptibility (43, 44).
Women, older adults, and those with lower socioeconomic status or adverse psychosocial experiences demonstrated particularly elevated risks (45, 46), these comprehensive findings emphasize that depression prevention and treatment strategies must adopt an integrated approach that addresses multiple risk factors simultaneously.
Our findings demonstrate a significant association between pulmonary function and depression risk. A one standard deviation increase in PEF percentage was associated with lower odds of depression (OR = 0.898, 95% CI: 0.862–0.935, p < 0.001). Furthermore, individuals with lower PEF levels (restricted) showed a significantly higher risk of depression compared to those with higher PEF levels (good), with incidence rates of 7.60 and 6.73 per 1,000 (Table 3), respectively. This association remained robust after adjusting for potential confounders. These results support the novel concept of “pulmonary dysfunction-related depression,” suggesting that impaired lung function may contribute to depression development.
Participants were divided into seven regions based on where they lived: (1) Main City Zone, (2) Urban–Rural Combination Zone, (3) Town Center, (4) ZhenXiang Area, (5) Special Area, (6) Township Central, and (7) Village. There were big differences in how people were distributed across these areas (p < 0.001). Villages had the most participants (73.00%), while the Main City Zone had the fewest (12.56%).
These regional differences may affect the results because living conditions, medical care, and social support vary between urban and rural areas (47). For example, people in rural areas might have a higher risk of depression because they face more air pollution and worse living conditions. In contrast, people in cities might deal with more stress from work and competition, even though they have better access to healthcare.
Smoking, which harms the lungs directly and causes inflammation, was also linked to lower lung function (PEF) and higher depression risk. Current smokers had worse lung function and higher depression risk compared to former smokers and non-smokers, who had better lung health and lower depression rates (48).
Individuals with restricted cognitive function showed a significantly higher incidence rate of depression compared to those with good cognitive function (21.71 vs. 40.44 per 1,000). This association remained statistically significant after adjusting for covariates in all three models (Model 1a: OR = 0.773, 95% CI: 0.672–0.890, p < 0.001; Model 2b: OR = 0.796, 95% CI: 0.707–0.895, p < 0.001; Model 3c: OR = 0.633, 95% CI: 0.558–0.717, p < 0.001).
A complex relationship emerged between cognitive function and pulmonary function, as shown by the Restricted Cubic Spline (RCS) curve in Figure 3B. While the overall linear association between PEF percentage and cognitive function was not statistically significant (p = 0.880), the nonlinear trend (p = 0.731) indicated a possible non-linear relationship.
Regarding the inverse relationship between PEF and depression and the non-linear trend of cognitive dysfunction observed in our longitudinal analysis (2015–2018), we hypothesize that unmeasured factors such as social isolation, medication adherence, and nutritional status may contribute to this divergence. Social isolation is consistently linked to cognitive decline, particularly in older adults (49). Otherwise, medications with anticholinergic properties are commonly prescribed to older adults. The cumulative anticholinergic effect of all the medications a person takes is referred to as the anticholinergic burden, because of its potential to cause adverse effects (50). In humans, chronic malnutrition is associated with global cognitive decline and accelerated brain aging (51). However, changes in nutritional status during chronic illness may lead to cognitive decline, which could be associated with various factors such as the progression rate of the disease, cognitive state, and dietary patterns (52). This heterogeneity could contribute to non-linear patterns in our data.
Our first-wave data showed that 4,246 individuals (65.05%) were smokers. Among these participants, we found a significant correlation between poorer lung function and higher rates of severe depression. Though smoking rates were high across all lung function groups, those with moderate or poor lung function had notably higher rates of severe depression (9.53 and 7.11%, respectively) compared to those with good lung function (5.03%).
People with poorer lung function typically experience more severe chronic inflammation, leading to systemic inflammation—a known risk factor for depression (53). The oxidative stress from smoking, which worsens in those with poor lung function, can damage both lung tissue and the nervous system, increasing depression risk (54, 55). Poor cardiopulmonary function also limits physical activity and reduces quality of life, potentially causing feelings of helplessness that contribute to depression (56, 57). The higher rates of severe depression among smokers with poor lung function likely stem from multiple factors: chronic inflammation, oxidative stress, limited physical capacity, lack of social support, and medication side effects (58, 59). Our GBM model therefore included various factors beyond smoking status. While smoking was identified as an important contributor to depression, other factors such as marital status and socioeconomic conditions also played significant roles.
Prior studies have consistently linked low PEF with a higher risk of depression, though the mechanisms remain complex (60). Neuroimmune pathways, such as systemic inflammation—evidenced by elevated interleukin-6 (IL-6) and tumor necrosis factor-alpha (TNF-α) levels in respiratory limitations patients—may play a key role by disrupting hippocampal neurogenesis and impairing prefrontal cortex function (61, 62). Furthermore, age-related declines in lung function may amplify these effects through oxidative stress and dysregulation of brain-derived neurotrophic factor (BDNF), especially of BDNF/TrkB signaling (63). These findings underscore the importance of integrated strategies—such as combining pulmonary rehabilitation with anti-inflammatory therapies—to address both physiological and mental health outcomes.
Emerging evidence identifies the gut-lung-brain axis as a significant amplifier of the low PEF-depression connection. Chronic lung dysfunction, such as in chronic obstructive pulmonary disease (COPD), disrupts gut microbiota, leading to increased intestinal permeability and systemic inflammation. This inflammation is marked by elevated levels of pro-inflammatory cytokines like IL-6 and TNF-α (64). These cytokines can cross the blood–brain barrier, activating microglia and impairing hippocampal neuroplasticity—a process worsened by lipopolysaccharide (LPS) from dysbiotic gut bacteria (65). This axis-driven mechanism suggests that gut-targeted interventions, including probiotics or dietary adjustments, could complement pulmonary therapies to mitigate depression risk in vulnerable populations (66).
Our study has several limitations. First, we used PEF measurements to assess lung function rather than FEV1, the gold standard. This choice was driven by practical constraints in conducting large-scale epidemiological surveys in rural China. PEF devices are portable and easy to use, making them suitable for resource-limited settings and enabling broader testing coverage. Second, depression diagnoses may vary across populations, and our study focused specifically on an Asian population. Third, we lacked detailed biomarker data, which limited our exploration of underlying biological mechanisms. Fourth, due to incomplete physical examination data from the fourth wave, we could not analyze associations between depression and additional blood biomarkers, including relevant neurotransmitters like serotonin, and the longitudinal follow-up was relatively short (3.6 years). Otherwise, we used the CES-D-10 scale, a reliable tool for measuring depressive symptoms. However, self-reported data can introduce bias, as participants may underreport or over report symptoms due to social pressure or memory errors. Cultural differences might also influence how individuals interpret and respond to the questions(despite varying levels of cultural background, the cognitive scores that need to be achieved differ), and regional disparities in living conditions and healthcare access might have confounded the results, though the study adjusted for some socioeconomic factors (67). Future studies should consider exploring these regional disparities in more detail to better understand their potential impact on the relationship between lung function and depression. In our study, 2,671 participants dropped out during the follow-up period, potentially introducing bias. Those who dropped out may have been at higher risk of depression or faced other unmeasured health challenges. Future research should also prioritize diverse populations to enhance the reliability of findings, strengthen the link between PEF and mental health, and identify group-specific factors that may require tailored interventions.
Future studies should use different ways to measure mental health, like talking to patients directly, testing blood samples, and doing thorough mental health checks. This would give us a better understanding of how mental health problems develop. Despite these limitations, our findings offer valuable insights into the relationship between respiratory limitations and depression, highlighting the need for further research to understand the underlying mechanisms and develop targeted interventions. Our study demonstrates that lung function assessment could serve as a useful tool for identifying individuals at risk of depression and cognitive decline.
In summary, our research establishes an association between impaired lung function and increased depression risk among middle-aged and old people Chinese individuals. These findings underscore the importance of addressing respiratory health as a strategy for depression prevention in this population. Our results indicate that interventions targeting lung function improvement may have significant public health benefits.
Conclusion
Our findings show that impaired lung function significantly increases depression risk in middle-aged and older adults — a level of risk comparable to well-established psychosocial factors. To put this evidence into action, we propose:
1. Routine PEF screening as part of mental health assessments for aging populations, especially for those with unexplained depressive symptoms.
2. Integrated pulmonary-psychosocial treatments, such as combining breathing retraining with cognitive behavioral therapy, tailored to individuals.
3. Validation of the “pulmonary dysfunction-related depression” concept through mechanistic studies investigating nerve-mediated lung-brain communication.
The key findings of the research
1. Prevalence of depression: Depression was more prevalent among individuals with poorer lung function compared to those with better lung function.
2. Longitudinal association: Lower peak expiratory flow (PEF) was significantly associated with an increased risk of developing depression over a 3.6-year follow-up period.
3. A linear relationship: A linear relationship was observed between PEF and depression risk, with lower PEF levels associated with higher odds of depression.
Data availability statement
The raw data supporting the conclusions of this article will be made available by the authors, without undue reservation.
Ethics statement
The studies involving humans were approved by the study was approved by the ethics review committee (institutional review board) of Peking University. All participants granted formal written consent for their involvement. The studies were conducted in accordance with the local legislation and institutional requirements. Written informed consent for participation was not required from the participants or the participants’ legal guardians/next of kin in accordance with the national legislation and institutional requirements.
Author contributions
HY: Conceptualization, Formal analysis, Methodology, Writing – original draft. JC: Data curation, Formal analysis, Investigation, Writing – review & editing. LH: Data curation, Resources, Writing – review & editing. ZX: Software, Validation, Writing – review & editing. YZ: Project administration, Supervision, Writing – review & editing. YW: Supervision, Validation, Writing – review & editing. CW: Supervision, Writing – review & editing.
Funding
The author(s) declare that financial support was received for the research and/or publication of this article. This article was supported by the National Key R&D Program of China (Grant No. 2022YFC3501201).
Conflict of interest
The authors declare that the research was conducted in the absence of any commercial or financial relationships that could be construed as a potential conflict of interest.
Generative AI statement
The authors declare that no Gen AI was used in the creation of this manuscript.
Publisher’s note
All claims expressed in this article are solely those of the authors and do not necessarily represent those of their affiliated organizations, or those of the publisher, the editors and the reviewers. Any product that may be evaluated in this article, or claim that may be made by its manufacturer, is not guaranteed or endorsed by the publisher.
Supplementary material
The Supplementary material for this article can be found online at: https://www.frontiersin.org/articles/10.3389/fpubh.2025.1551356/full#supplementary-material
References
1. GBD 2019 Mental Disorders Collaborators. Global, regional, and national burden of 12 mental disorders in 204 countries and territories, 1990-2019: a systematic analysis for the global burden of disease study 2019. Lancet Psychiatry. (2022) 9:137–50. doi: 10.1016/S2215-0366(21)00395-3
2. Wilkinson, P, Ruane, C, and Tempest, K. Depression in older adults. BMJ. (2018) 363:k4922. doi: 10.1136/bmj.k4922
3. Alexopoulos, GS. Depression in the elderly. Lancet. (2005) 365:1961–70. doi: 10.1016/S0140-6736(05)66665-2
4. Almeida, OP. Prevention of depression in older age. Maturitas. (2014) 79:136–41. doi: 10.1016/j.maturitas.2014.03.005
5. Fang, EF, Scheibye-Knudsen, M, Jahn, HJ, Li, J, Ling, L, Guo, H, et al. A research agenda for aging in China in the 21st century. Ageing Res Rev. (2015) 24:197–205. doi: 10.1016/j.arr.2015.08.003
6. Chen, R, Xu, P, Li, F, and Song, P. Internal migration and regional differences of population aging: an empirical study of 287 cities in China. Biosci Trends. (2018) 12:132–41. doi: 10.5582/bst.2017.01246
7. Jiang, D, Chen, X, Huang, J, Wu, L, Chen, Y, Feng, H, et al. Associations of sarcopenia, sarcopenia parameters and motoric cognitive risk syndrome in Chinese older adults. Front Aging Neurosci. (2023) 15:1302879. doi: 10.3389/fnagi.2023.1302879
8. Lu, J, Xu, X, Huang, Y, Li, T, Ma, C, Xu, G, et al. Prevalence of depressive disorders and treatment in China: a cross-sectional epidemiological study. Lancet Psychiatry. (2021) 8:981–90. doi: 10.1016/S2215-0366(21)00251-0
9. Zhong, BL, Xu, YM, Xie, WX, Liu, XJ, and Huang, ZW. Depressive symptoms in elderly Chinese primary care patients: prevalence and sociodemographic and clinical correlates. J Geriatr Psychiatry Neurol. (2019) 32:312–8. doi: 10.1177/0891988719862620
10. Cai, H, Jin, Y, Liu, R, Zhang, Q, Su, Z, Ungvari, GS, et al. Global prevalence of depression in older adults: a systematic review and meta-analysis of epidemiological surveys. Asian J Psychiatr. (2023) 80:103417. doi: 10.1016/j.ajp.2022.103417
11. Weyerer, S, Eifflaender-Gorfer, S, Kohler, L, et al. Prevalence and risk factors for depression in non-demented primary care attenders aged 75 years and older. J Affect Disord. (2008) 111:153–63. doi: 10.1016/j.jad.2008.02.008
12. Sozeri-Varma, G. Depression in the elderly: clinical features and risk factors. Aging Dis. (2012) 3:465–71. Available online at: https://pubmed.ncbi.nlm.nih.gov/23251852/
13. Zhong, BL, Ruan, YF, Xu, YM, Chen, WC, and Liu, LF. Prevalence and recognition of depressive disorders among Chinese older adults receiving primary care: a multi-center cross-sectional study. J Affect Disord. (2020) 260:26–31. doi: 10.1016/j.jad.2019.09.011
14. Schuch, FB, Vancampfort, D, Richards, J, Rosenbaum, S, Ward, PB, and Stubbs, B. Exercise as a treatment for depression: a meta-analysis adjusting for publication bias. J Psychiatr Res. (2016) 77:42–51. doi: 10.1016/j.jpsychires.2016.02.023
15. Seo, JY, and Chao, YY. Effects of exercise interventions on depressive symptoms among community-dwelling older adults in the United States: a systematic review. J Gerontol Nurs. (2018) 44:31–8. doi: 10.3928/00989134-20171024-01
16. Kandola, A, Ashdown-Franks, G, Stubbs, B, Osborn, DPJ, and Hayes, JF. The association between cardiorespiratory fitness and the incidence of common mental health disorders: a systematic review and meta-analysis. J Affect Disord. (2019) 257:748–57. doi: 10.1016/j.jad.2019.07.088
17. Guo, L, Yang, L, Rao, L, Luo, F, Gao, N, Jia, X, et al. Too depressed to breathe: the longitudinal association between depressive symptoms and lung function among general middle-aged and older adults. Arch Gerontol Geriatr. (2022) 103:104797. doi: 10.1016/j.archger.2022.104797
18. Gruber, M, Mauritz, M, Meinert, S, Grotegerd, D, de Lange, SC, Grumbach, P, et al. Cognitive performance and brain structural connectome alterations in major depressive disorder. Psychol Med. (2023) 53:6611–22. doi: 10.1017/S0033291722004007
19. Ochs-Balcom, HM, Lainhart, W, Mnatsakanova, A, Charles, LE, Violanti, JM, Andrew, ME, et al. The association of depressive symptoms and pulmonary function in healthy adults. Psychosom Med. (2013) 75:737–43. doi: 10.1097/PSY.0b013e3182a15672
20. Yoon, S, Kim, JM, Kang, HJ, Bae, KY, Kim, SW, Shin, IS, et al. Associations of pulmonary function with dementia and depression in an older Korean population. Psychiatry Investig. (2015) 12:443–50. doi: 10.4306/pi.2015.12.4.443
21. Phillips, MR, Zhang, J, Shi, Q, Song, Z, Ding, Z, Pang, S, et al. Prevalence, treatment, and associated disability of mental disorders in four provinces in China during 2001-05: an epidemiological survey. Lancet. (2009) 373:2041–53. doi: 10.1016/S0140-6736(09)60660-7
22. Chen, S, Conwell, Y, Vanorden, K, Lu, N, Fang, Y, Ma, Y, et al. Prevalence and natural course of late-life depression in China primary care: a population based study from an urban community. J Affect Disord. (2012) 141:86–93. doi: 10.1016/j.jad.2012.02.027
23. Zhao, Y, Hu, Y, Smith, JP, Strauss, J, and Yang, G. Cohort profile: the China health and retirement longitudinal study (CHARLS). Int J Epidemiol. (2014) 43:61–8. doi: 10.1093/ije/dys203
24. Zhang, HG, Fan, F, Zhong, BL, and Chiu, HF. Relationship between left-behind status and cognitive function in older Chinese adults: a prospective 3-year cohort study. Gen Psychiatr. (2023) 36:e101054. doi: 10.1136/gpsych-2023-101054
25. Waring, EM, and Patton, D. Marital intimacy and depression. Br J Psychiatry. (1984) 145:641–4. doi: 10.1192/bjp.145.6.641
26. Roberts, MH, and Mapel, DW. Limited lung function: impact of reduced peak expiratory flow on health status, health-care utilization, and expected survival in older adults. Am J Epidemiol. (2012) 176:127–34. doi: 10.1093/aje/kwr503
27. Boey, KW. Cross-validation of a short form of the CES-D in Chinese elderly. Int J Geriatr Psychiatry. (1999) 14:608–17. doi: 10.1002/(SICI)1099-1166(199908)14:8<608::AID-GPS991>3.0.CO;2-Z
28. Chen, H, and Mui, AC. Factorial validity of the Center for Epidemiologic Studies Depression Scale short form in older population in China. Int Psychogeriatr. (2014) 26:49–57. doi: 10.1017/S1041610213001701
29. Natekin, A, and Knoll, A. Gradient boosting machines, a tutorial. Front Neurorobot. (2013) 7:21. doi: 10.3389/fnbot.2013.00021
30. Liu, CH, and Huang, PS. Contingencies of self-worth on positive and negative events and their relationships to depression. Front Psychol. (2018) 9:2372. doi: 10.3389/fpsyg.2018.02372
31. Harrison, P, Lawrence, AJ, Wang, S, Liu, S, Xie, G, Yang, X, et al. The psychopathology of worthlessness in depression. Front Psych. (2022) 13:818542. doi: 10.3389/fpsyt.2022.818542
32. Hayashi, Y, Okamoto, Y, Takagaki, K, Okada, G, Toki, S, Inoue, T, et al. Direct and indirect influences of childhood abuse on depression symptoms in patients with major depressive disorder. BMC Psychiatry. (2015) 15:244. doi: 10.1186/s12888-015-0636-1
33. LeMoult, J, Humphreys, KL, Tracy, A, Hoffmeister, JA, Ip, E, and Gotlib, IH. Meta-analysis: exposure to early life stress and risk for depression in childhood and adolescence. J Am Acad Child Adolesc Psychiatry. (2020) 59:842–55. doi: 10.1016/j.jaac.2019.10.011
34. Childhood Trauma Meta-Analysis Study G. Treatment efficacy and effectiveness in adults with major depressive disorder and childhood trauma history: a systematic review and meta-analysis. Lancet Psychiatry. (2022) 9:860–73. doi: 10.1016/S2215-0366(22)00227-9
35. Giampetruzzi, E, Tan, AC, LoPilato, A, Kitay, B, Riva Posse, P, McDonald, WM, et al. The impact of adverse childhood experiences on adult depression severity and treatment outcomes. J Affect Disord. (2023) 333:233–9. doi: 10.1016/j.jad.2023.04.071
36. Rehman, US, Gollan, J, and Mortimer, AR. The marital context of depression: research, limitations, and new directions. Clin Psychol Rev. (2008) 28:179–98. doi: 10.1016/j.cpr.2007.04.007
37. Whisman, MA, Sbarra, DA, and Beach, SRH. Intimate relationships and depression: searching for causation in the sea of association. Annu Rev Clin Psychol. (2021) 17:233–58. doi: 10.1146/annurev-clinpsy-081219-103323
38. Chen, B, Wang, W, and Yang, S. The relationship between academic stress and depression among college students during the COVID-19 pandemic: a cross-sectional study from China. BMC Psychiatry. (2024) 24:46. doi: 10.1186/s12888-024-05506-8
39. Wu, P, Feng, R, and Zhang, J. The relationship between loneliness and problematic social media usage in Chinese university students: a longitudinal study. BMC Psychol. (2024) 12:13. doi: 10.1186/s40359-023-01498-4
40. Dodd, JW. Lung disease as a determinant of cognitive decline and dementia. Alzheimers Res Ther. (2015) 7:32. doi: 10.1186/s13195-015-0116-3
41. Sasannejad, C, Ely, EW, and Lahiri, S. Long-term cognitive impairment after acute respiratory distress syndrome: a review of clinical impact and pathophysiological mechanisms. Crit Care. (2019) 23:352. doi: 10.1186/s13054-019-2626-z
42. Yuan, Y, Peng, C, Burr, JA, and Lapane, KL. Frailty, cognitive impairment, and depressive symptoms in Chinese older adults: an eight-year multi-trajectory analysis. BMC Geriatr. (2023) 23:843. doi: 10.1186/s12877-023-04554-1
43. Hoebel, J, Maske, UE, Zeeb, H, and Lampert, T. Social inequalities and depressive symptoms in adults: the role of objective and subjective socioeconomic status. PLoS One. (2017) 12:e0169764. doi: 10.1371/journal.pone.0169764
44. Isik, K, Cengiz, Z, and Dogan, Z. The relationship between self-care agency and depression in older adults and influencing factors. J Psychosoc Nurs Ment Health Serv. (2020) 58:39–47. doi: 10.3928/02793695-20200817-02
45. Yan, XY, Huang, SM, Huang, CQ, Wu, WH, and Qin, Y. Marital status and risk for late life depression: a meta-analysis of the published literature. J Int Med Res. (2011) 39:1142–54. doi: 10.1177/147323001103900402
46. Buckman, JEJ, Saunders, R, Stott, J, Arundell, LL, O'Driscoll, C, Davies, MR, et al. Role of age, gender and marital status in prognosis for adults with depression: an individual patient data meta-analysis. Epidemiol Psychiatr Sci. (2021) 30:e42. doi: 10.1017/S2045796021000342
47. Witvliet, MI, Kunst, AE, Stronks, K, and Arah, OA. Variations between world regions in individual health: a multilevel analysis of the role of socio-economic factors. Eur J Pub Health. (2012) 22:284–9. doi: 10.1093/eurpub/ckr001
48. Paperwalla, KN, Levin, TT, Weiner, J, and Saravay, SM. Smoking and depression. Med Clin North Am. (2004) 88:1483–94 x-xi. doi: 10.1016/j.mcna.2004.06.007
49. Cardona, M, and Andres, P. Are social isolation and loneliness associated with cognitive decline in ageing? Front Aging Neurosci. (2023) 15:1075563. doi: 10.3389/fnagi.2023.1075563
50. Taylor-Rowan, M, Edwards, S, Noel-Storr, AH, McCleery, J, Myint, PK, Soiza, R, et al. Anticholinergic burden (prognostic factor) for prediction of dementia or cognitive decline in older adults with no known cognitive syndrome. Cochrane Database Syst Rev. (2021) 5:CD013540. doi: 10.1002/14651858.CD013540.pub2
51. Feng, L, Chu, Z, Quan, X, Zhang, Y, Yuan, W, Yao, Y, et al. Malnutrition is positively associated with cognitive decline in centenarians and oldest-old adults: a cross-sectional study. EClinicalMedicine. (2022) 47:101336. doi: 10.1016/j.eclinm.2022.101336
52. Sanders, C, Behrens, S, Schwartz, S, Wengreen, H, Corcoran, CD, Lyketsos, CG, et al. Nutritional status is associated with faster cognitive decline and worse functional impairment in the progression of dementia: the Cache County dementia progression Study1. J Alzheimers Dis. (2016) 52:33–42. doi: 10.3233/JAD-150528
53. van Manen, JG, Bindels, PJ, and Dekker, FW, CJIJ, van der Zee, JS, and Schade, E. Risk of depression in patients with chronic obstructive pulmonary disease and its determinants. Thorax (2002);57:412–416.
54. Donohue, JF. Ageing, smoking and oxidative stress. Thorax. (2006) 61:461–2. doi: 10.1136/thx.2005.053058
55. Seo, YS, Park, KH, Park, JM, Jeong, H, Kim, B, Jeon, JS, et al. Short-term inhalation exposure to cigarette smoke induces oxidative stress and inflammation in lungs without systemic oxidative stress in mice. Toxicol Res. (2024) 40:273–83. doi: 10.1007/s43188-023-00223-y
56. Harshfield, EL, Pennells, L, Schwartz, JE, Willeit, P, Kaptoge, S, Bell, S, et al. Association between depressive symptoms and incident cardiovascular diseases. JAMA. (2020) 324:2396–405. doi: 10.1001/jama.2020.23068
57. Wang, C, Chen, H, and Shang, S. Association between depression and lung function in college students. Front Public Health. (2023) 11:1093935. doi: 10.3389/fpubh.2023.1093935
58. Guo, Y, and Yan, J. Association between tobacco smoke exposure and depression: the NHANES 2005-2018 and Mendelian randomization study. Arch Public Health. (2024) 82:100. doi: 10.1186/s13690-024-01322-4
59. Hu, W, Liu, BP, and Jia, CX. Association and biological pathways between lung function and incident depression: a prospective cohort study of 280,032 participants. BMC Med. (2024) 22:160. doi: 10.1186/s12916-024-03382-3
60. Giltay, EJ, Nissinen, A, Giampaoli, S, Zitman, FG, and Kromhout, D. Low respiratory function increases the risk of depressive symptoms in later life in men. Psychosom Med. (2010) 72:53–60. doi: 10.1097/PSY.0b013e3181c2ca39
61. Al-shair, K, Kolsum, U, Dockry, R, Morris, J, Singh, D, and Vestbo, J. Biomarkers of systemic inflammation and depression and fatigue in moderate clinically stable COPD. Respir Res. (2011) 12:3. doi: 10.1186/1465-9921-12-3
62. Du, YJ, Yang, CJ, Li, B, et al. Association of pro-inflammatory cytokines, cortisol and depression in patients with chronic obstructive pulmonary disease. Psychoneuroendocrinology. (2014) 46:141–52. doi: 10.1016/j.psyneuen.2014.04.020
63. Numakawa, T, and Odaka, H. The role of Neurotrophin signaling in age-related cognitive decline and cognitive diseases. Int J Mol Sci. (2022) 23:726. doi: 10.3390/ijms23147726
64. Bajinka, O, Simbilyabo, L, Tan, Y, Jabang, J, and Saleem, SA. Lung-brain axis. Crit Rev Microbiol. (2022) 48:257–69. doi: 10.1080/1040841X.2021.1960483
65. Azzoni, R, and Marsland, BJ. The lung-brain axis: a new frontier in host-microbe interactions. Immunity. (2022) 55:589–91. doi: 10.1016/j.immuni.2022.03.015
66. Martin, C, Mahan, KS, Wiggen, TD, Gilbertsen, AJ, Hertz, MI, Hunter, RC, et al. Microbiome and metabolome patterns after lung transplantation reflect underlying disease and chronic lung allograft dysfunction. Microbiome. (2024) 12:196. doi: 10.1186/s40168-024-01893-y
Keywords: depression, peak expiratory flow, CHARLS, prospective cohort study, cognitive
Citation: Yang H, Cao J, Huang L, Xie Z, Zhou Y, Wang Y and Wen C (2025) Associations between pulmonary function and depression: evidence from the CHARLS cohort 2015–2018. Front. Public Health. 13:1551356. doi: 10.3389/fpubh.2025.1551356
Edited by:
Muralikrishnan Dhanasekaran, Auburn University, United StatesReviewed by:
Yan-Min Xu, Wuhan Mental Health Center, ChinaXun Luo, Kerry Rehabilitation Medicine Research Institute, China
Vince Hooper, SPJ GLOBAL, United Arab Emirates
Copyright © 2025 Yang, Cao, Huang, Xie, Zhou, Wang and Wen. This is an open-access article distributed under the terms of the Creative Commons Attribution License (CC BY). The use, distribution or reproduction in other forums is permitted, provided the original author(s) and the copyright owner(s) are credited and that the original publication in this journal is cited, in accordance with accepted academic practice. No use, distribution or reproduction is permitted which does not comply with these terms.
*Correspondence: Hui Yang, eWFuZ2h1aUB6Y211LmVkdS5jbg==; Yuejun Zhou, emhvdXlqNjY2NkAxMjYuY29t; Yiqing Wang, d2FuZ3lpcWluQHNodXRjbS5lZHUuY24=; Chengping Wen, Y2hlbmdwdzIwMTBAMTI2LmNvbQ==
†These authors share first authorship