 Chenyu Jiang1†
 Yaojian Shao
- 1Department of Geriatric, Taizhou Central Hospital (Taizhou University Hospital), Taizhou, Zhejiang, China
- 2Department of Critical Care Medicine, Taizhou Hospital of Zhejiang Province Affiliated to Wenzhou Medical University, Taizhou, Zhejiang, China
- 3Department of Gastroenterology, Taizhou Central Hospital (Taizhou University Hospital), Taizhou, Zhejiang, China
Purpose: Socioeconomic inequality is closely related to the incidence of Helicobacter pylori (H. pylori) infection and mortality outcomes. Accordingly, this study was designed with the goal of exploring the relationship between familial poverty, H. pylori seropositivity, and all-cause mortality among adults in the United States.
Methods: Data from National Health and Nutrition Examination Survey (1999–2000) was used to conduct analysis. Family poverty to income ratio (PIR) was applied to evaluate socioeconomic status. The interplay between H. pylori serostatus and PIR was evaluated through univariate and multivariable approaches. The relationship between PIR, H. pylori serostatus, and the incidence of all-cause mortality was further assessed through Cox regression analysis, restricted cubic spline, and survival analysis.
Results: A total of 3,573 individuals were included in this study. PIR values were found to be negatively associated with H. pylori seropositivity incidence after adjusting for potential covariates. Smooth curve fitting suggested that the relationship between these two variables was largely linear. Subgroup analyses confirmed that PIR values were still closely associated with H. pylori seropositivity independently. Moreover, multivariate Cox regression analysis demonstrated that lower PIR was associated with an increase in all-cause mortality in both H. pylori seropositivity and seronegative group, whereas H. pylori serostatus showed no association with all-cause mortality. Additional analysis using smooth curve fitting indicated a nonlinear relationship between PIR and all-cause mortality. The survival analysis further indicated that individuals with higher PIR values exhibited lower mortality rates, regardless of H. pylori serostatus.
Conclusion: The present analyses reveal an inverse association between PIR values and H. pylori seropositivity and all-cause mortality. The relationship between PIR and all-cause mortality was not affected by H. pylori seropositivity. H. pylori serostatus is not a major risk factor for all-cause mortality. However, additional studies will be essential to better clarify the clinical relevance of these findings and to elucidate the underlying findings.
1 Introduction
Helicobacter pylori is a Gram-negative bacterium that can infect the stomach of humans, contributing to the incidence of a range of severe gastrointestinal disorders including peptic ulcers, gastritis, and gastric cancer (1). The estimated global prevalence of H. pylori infections is 44.3% (2), and the incidence of these infections differs markedly between developing and developed nations, with substantially higher odds in the former, particularly in countries in Latin America and Africa (3, 4). Recent epidemiological studies have indicated the prevalence of H. pylori has been declining globally between 2011 and 2022, particularly in African and Europe region (3, 5–7). However, the prevalence has remained relatively stable in Middle East (8). These observed differences in infection odds were associated with economic and social conditions (9, 10).
Socioeconomic status (SES) refers to an individual or group’s position in society and is often measured based on their education, income, or occupation (11). Lower SES is generally associated with higher H. pylori infection odds as it typically coincides with poorer dietary health, less sanitary conditions, and a worse overall living environment, all of which are risk factors for such infection (8, 10, 12). The complex nature of SES is reflected by the many different indicators used to assess this parameter, each of which is subject to certain limitations (13). Compared to other SES measures, like education level and occupational stratifications, household income better reflects living standards and access to services. The poverty-to-income ratio (PIR) is one such index that can be computed by dividing household income by the poverty threshold, and it is widely used in many reports (14–16). For the present analysis, the PIR was selected for use when examining the association between SES and H. pylori infection status in a nationally representative population of adults in the United States based on data collected through the National Health and Nutrition Examination Survey (NHANES).
Many researchers have also explored the association between SES and mortality outcomes, revealing that lower SES tends to be associated with a shorter life expectancy (17). Low SES is also established as a major risk factor related to the development of cancer and premature cancer-related mortality throughout the world. The World Health Organization (WHO) classified H. pylori as a Group 1 carcinogen associated with a high risk of gastric cancer and consequent mortality (18). In addition to gastric cancer and ulcers, H. pylori infection has been claimed to be associated with nearly 90 different systemic conditions, including cardiovascular, including cardiovascular and metabolic diseases, and other metabolic diseases (19, 20). In light of the above considerations, the present analyses sought to clarify the relationship between PIR values, H. pylori serostatus, and all-cause mortality based on the NHANES dataset.
2 Materials and methods
2.1 Data source and study population
The cross-sectional NHANES study was a large, nationally representative survey implemented by the National Center for Health Statistics (NCHS) with the goal of assessing the nutritional and health status of adults in the United States. The Ethics Review Committee of the NCHS approved this study, and all participants gave informed written consent to participate. For the present study, adults 20 + years of age with H. pylori IgG levels information from the NHANES 1999–2000 cycle who participated in subsequent survey cycles were included. Participants lacking PIR data, education level information, or H. pylori IgG levels were also excluded from these analyses.
The 1999–2000 NHANES cycle included 9,965 subjects of whom 3,753 were found to meet the established inclusion criteria (Figure 1). The analyses conducted with the available data were representative of the population, so we did not deal with missing values in the covariates.
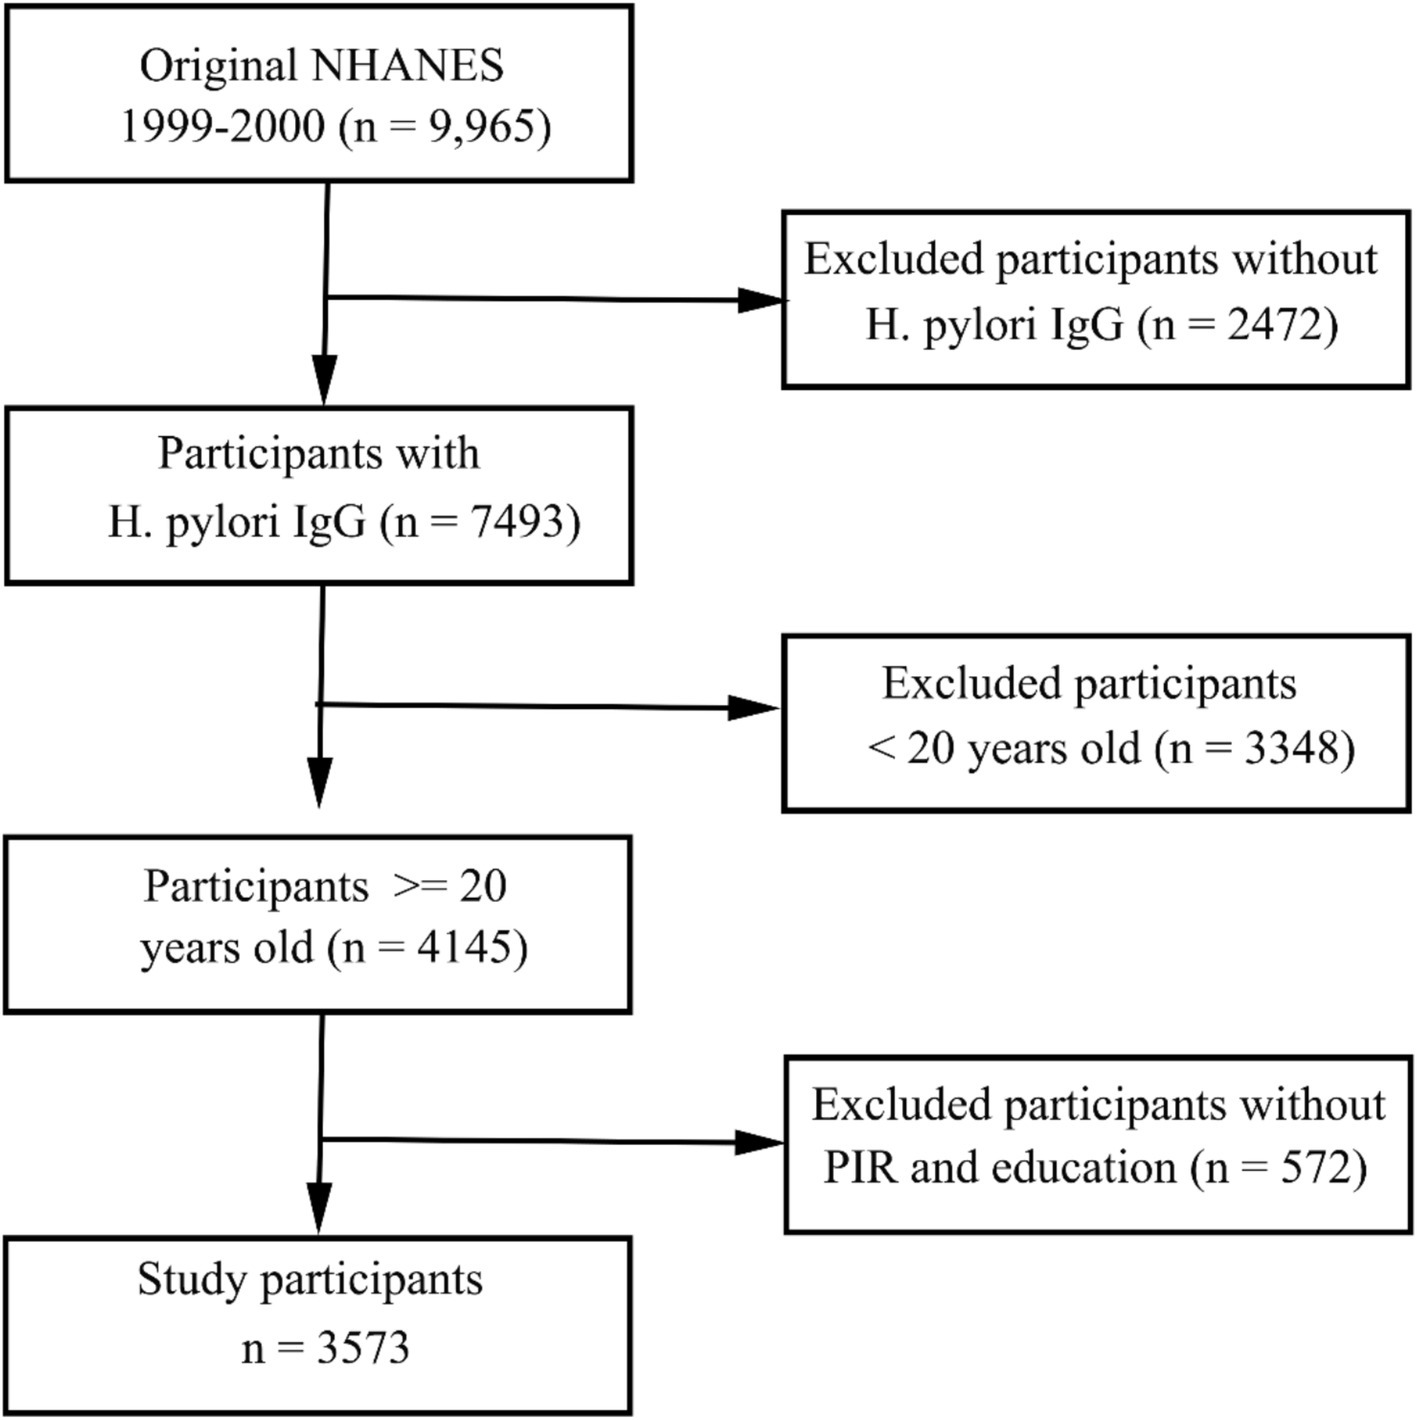
Figure 1. Flow chart overview of the selection of eligible patients from the NHANES 1999–2000 cohort.
2.2 Socioeconomic status analyses
PIR values were selected as the primary index when evaluating SES in the present study. PIR values are based upon the poverty guidelines released by the Department of Health and Human Services, taking into consideration both household size and the relevant poverty threshold of the appropriate year and state when assessing the SES of a given individual to provide a more precise reflection of actual poverty status. PIR is adjusted for the size and composition of the household, and the age of family members, and is updated annually for inflation. PIR = 1 means the income equals the federal poverty level. To ensure adequate participant representation in each category for analytical purposes, the PIR was stratified into three levels based on tertiles. Education level was regarded as another important covariate for SES analyses, with participants being classified into those with an education level of less than high school, high school or equivalent, or college and above.
2.3 Helicobacter pylori serostatus
Human serum samples were analyzed for H. pylori-specific IgG via ELISA (Wampole Laboratories) (21). These ELISAs offer similar sensitivity, specificity, and repeatability to those afforded by other serological assays based on hemagglutination, complement fixation, immunofluorescence, or other factors (22–25). Serum IgG antibody levels below 0.9 were considered negative, while any values above this threshold were considered seropositive for H. pylori as in prior reports (23, 26). Note that seropositivity encompasses both current and past infections. The serologic methods exhibited a sensitivity above 90% and a specificity of around 80% (27–29). Although H pylori serology has lower specificity compared to other noninvasive tests, its superior sensitivity and low-cost make it a suitable noninvasive test for ruling out H pylori infection (30–32). Specific measurement methods and validity can be found at https://wwwn.cdc.gov/Nchs/Nhanes/1999-2000/LAB11.htm#LBXHP1.
2.4 Participant follow-up
Records for study participants were linked to the National Death Index files1 to assess patient mortality outcomes. Participants were followed from the baseline interview until death or December 31, 2019. The median follow-up durations for H. pylori seropositivity and seronegative patients were 233 (IQR: 177, 242) and 234 (IQR: 224, 241) months, respectively.
2.5 Other covariates
Covariates with the potential to impact H. pylori serostatus were taken into consideration when conducting these analyses. These included demographic variables such as age (years), gender (male/female), and race/ethnicity (Mexican American, Other Hispanic, Non-Hispanic White, Non-Hispanic Black, Other race/ethnicity). Relevant lifestyle variables included smoking status (never [<100 cigarettes lifetime], former [>100 cigarettes lifetime and smoke not at all now], now [>100 cigarettes lifetime and smoke some days or everyday]) and drinking status (never [<12 lifetime drinks], former [12 + drinks per year but none in the last year], current light/moderate drinker [≤1 or ≤2 daily drinks for females and males, respectively, over the past 12 months], current heavy drinker [>1 or >2 daily drinks for females and males, respectively, over the past 12 months]). Health-related variables included body mass index (BMI; normal [< 25 kg/m2], overweight [25–30 kg/m2], obese [≥30 kg/m2]), diabetes, and hypertension. Individuals were considered hypertensive if they were using antihypertensive drugs, self-reported a hypertension diagnosis, or exhibited systolic (diastolic) blood pressure values ≥140 mm Hg (≥90 mm Hg). Individuals were considered to have diabetes if they self-reported a diagnosis of diabetes, were using insulin or any other antidiabetic medications, exhibited a fasting glucose ≥ 126 mg/dL, an HbA1c ≥ 6.5%, or a serum glucose level 2 h after a 75 g glucose load (OGTT) ≥ 200 mg/dL. Analyzed laboratory parameters included triglycerides (mg/dL), total cholesterol (mg/dL), uric acid levels (mg/dL), albumin levels (g/dL), creatinine levels (mg/dL), and blood urea nitrogen (mg/dL).
2.6 Statistical analyses
To account for the complex multi-stage cluster design of the NHANES study, appropriate sample weight values were employed to ensure that the adjusted data reflects the characteristics of the U. S. population. The baseline characteristics of the participants by H. pylori serologic status classifications were compared using chi-square tests or t-tests. Categorical variables were reported as numbers (weighted percentage) and analyzed using chi-square tests. Continuous variables were reported as means ± standard error (SE) and analyzed using t-tests.
Associations between PIR values and H. pylori seropositivity were assessed through survey-weighted univariate and multivariable logistic regression analyses that were used to compute odds ratios (ORs) and 95% confidence intervals (CIs). Three different models were used to conduct these analyses. In Model 1, education, another SES factor were adjusted. In Model 2, the demographic characteristics of the general population, including age, gender, race/ethnicity, and BMI were additionally adjusted. Considering the potential impact of chronic underlying diseases and living conditions, smoking, alcohol intake, hypertension, diabetes mellitus, and albumin levels (g/dL) were further adjusted in Model 3. The potential non-linearity of the association between PIR and H. pylori serostatus was assessed using restricted cubic spline (RCS) analyses adjusted for relevant confounding variables. Associations between these variables were also assessed in different demographic subgroups. Relationship between PIR values, H. pylori serostatus, and all-cause mortality were assessed through univariate and multivariable Cox regression analyses. To optimize data use and reduce overadjustment for mediating variables, two models were estimated: in model 1, the demographic characteristics including age, gender, education, race/ethnicity, and BMI were adjusted; in model 2, chronic underlying diseases and living conditions including hypertension, and diabetes mellitus were further adjusted. PIR was further transformed into tertiles and used as a categorical variable to conduct survival analyses using Kaplan–Meier curves and log-rank tests evaluating event-free survival rates as a function of PIR level and H. pylori seropositivity. R (v 4.2.2) was used to conduct all analyses, with a two-sided p < 0.05 as the threshold used to define significance.
3 Results
3.1 Participant characteristics
This study ultimately enrolled 3,573 subjects (weighted n = 161,312,594). Main characteristics and laboratory parameters for these participants stratified according to H. pylori serostatus are presented in Table 1. In total, 45.0% (weighted percentage = 31.01%) of this study cohort exhibited H. pylori seropositivity, and seropositive individuals were more likely to be older, current smokers, former drinkers, individuals with a lower education level, individuals with a lower PIR and individuals with hypertension, diabetes, and lower albumin levels. There was no association found between H. pylori serostatus and gender, BMI, total cholesterol, triglyceride, creatinine, uric acid, or blood urea nitrogen level.
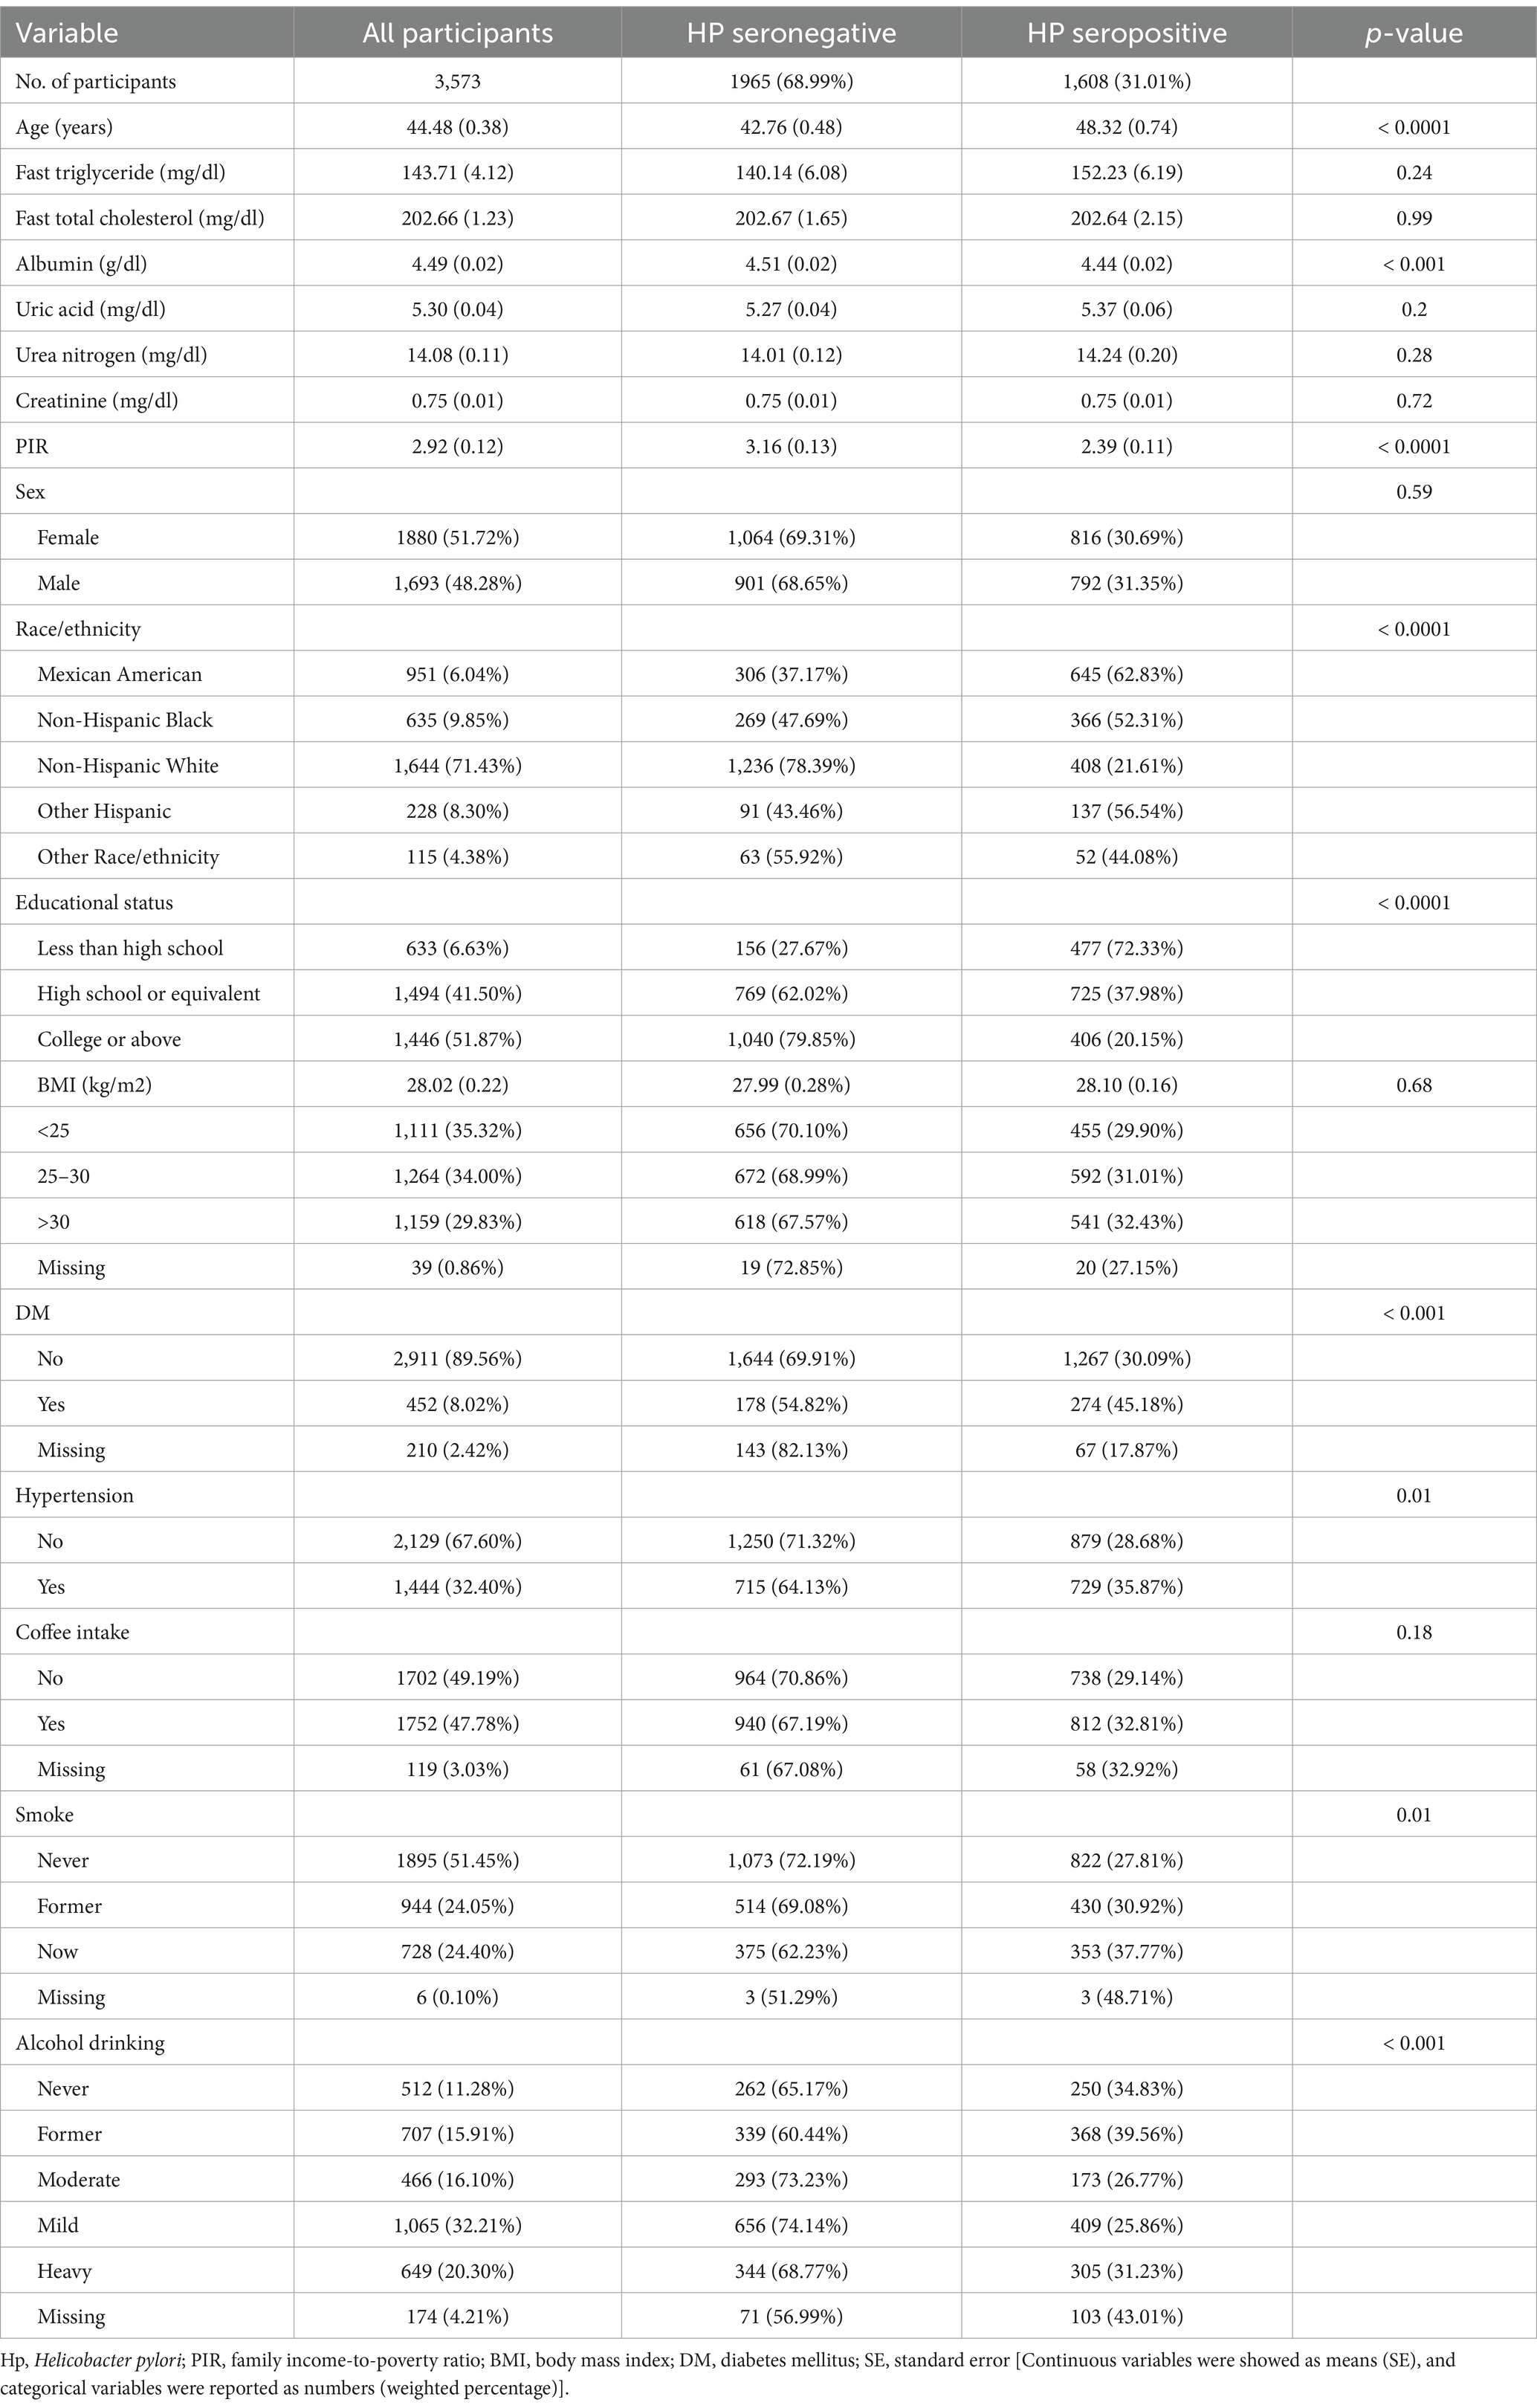
Table 1. Baseline weighted participant characteristics and laboratory parameters grouped according to Helicobacter pylori serostatus.
3.2 Relationships between PIR levels and Helicobacter pylori seropositivity
H. pylori seropositivity was not meaningfully associated with gender, BMI, or coffee consumption, but was strongly associated with decreasing values of PIR (OR 0.74 [95% CI: 0.70, 0.79], Table 2) and very strongly associated with lower levels of educational status (HS or equivalent OR 0.23 [95% CI: 0.14, 0.34]; College or above OR 0.10 [0.06, 0.15]). In multivariable logistic regression analyses of the association between PIR and H. pylori serostatus (Table 3), a crude unadjusted model revealed that elevated PIR levels were associated with the decline in the odds of H. pylori seropositivity (OR = 0.74 95% CI: (0.70, 0.79), p < 0.0001). This inverse association persisted after adjustment for education in Model 1 (OR = 0.83, 95% CI: (0.79, 0.88), p < 0.0001) and adjustment for education, age, gender, race/ethnicity, and BMI in Model 2 (OR = 0.88, 95% CI: (0.82, 0.95), p < 0.01). Under Model 3, the corresponding OR was 0.90 (95% CI, 0.85–0.95), such that each unit increase in PIR values was associated with a 10% reduction in the odds of H. pylori seropositivity. When assessing PIR tertiles, in the crude model, participants in the two higher PIR tertiles (T2/3) had higher odds of H. pylori seropositivity (T2: OR = 0.63, 95% CI, 0.47–0.84; T3: OR = 0.33, 95% CI, 0.25–0.43) as compared to patients in the lowest tertile (T1). This relationship remained intact after adjusting for educational status in Model 1 and additionally adjusting for age, gender, race/ethnicity, and BMI in Model 2. There was no statistical difference in T2 after further adjustment for smoking, alcohol intake, hypertension, diabetes mellitus, and albumin levels (g/dL) in Model 3, whereas, the ORs of T3 were 0.69 (95%CI, 0.56–0.85, P for tend = 0.001). Smooth curve fitting analyses adjusted for relevant covariates demonstrated that the inverse association between PIR levels and H. pylori serostatus was largely linear (P-overall = 8.00 × 10⁻⁴ and P-nonlinear = 0.30). In the educational status stratification, a negative non-linear association was noted between PIR level and H. pylori seropositivity for subjects with college or higher levels of education. The RCS analyses revealed U-shaped curves for less than high school and high school or equivalent education levels subjects, with inflection points at 1.96 and 3.82, respectively (Figure 2). RCS analyses performed when stratifying subjects according to gender, BMI, hypertension, and diabetes status are presented in Supplementary Figure 1.
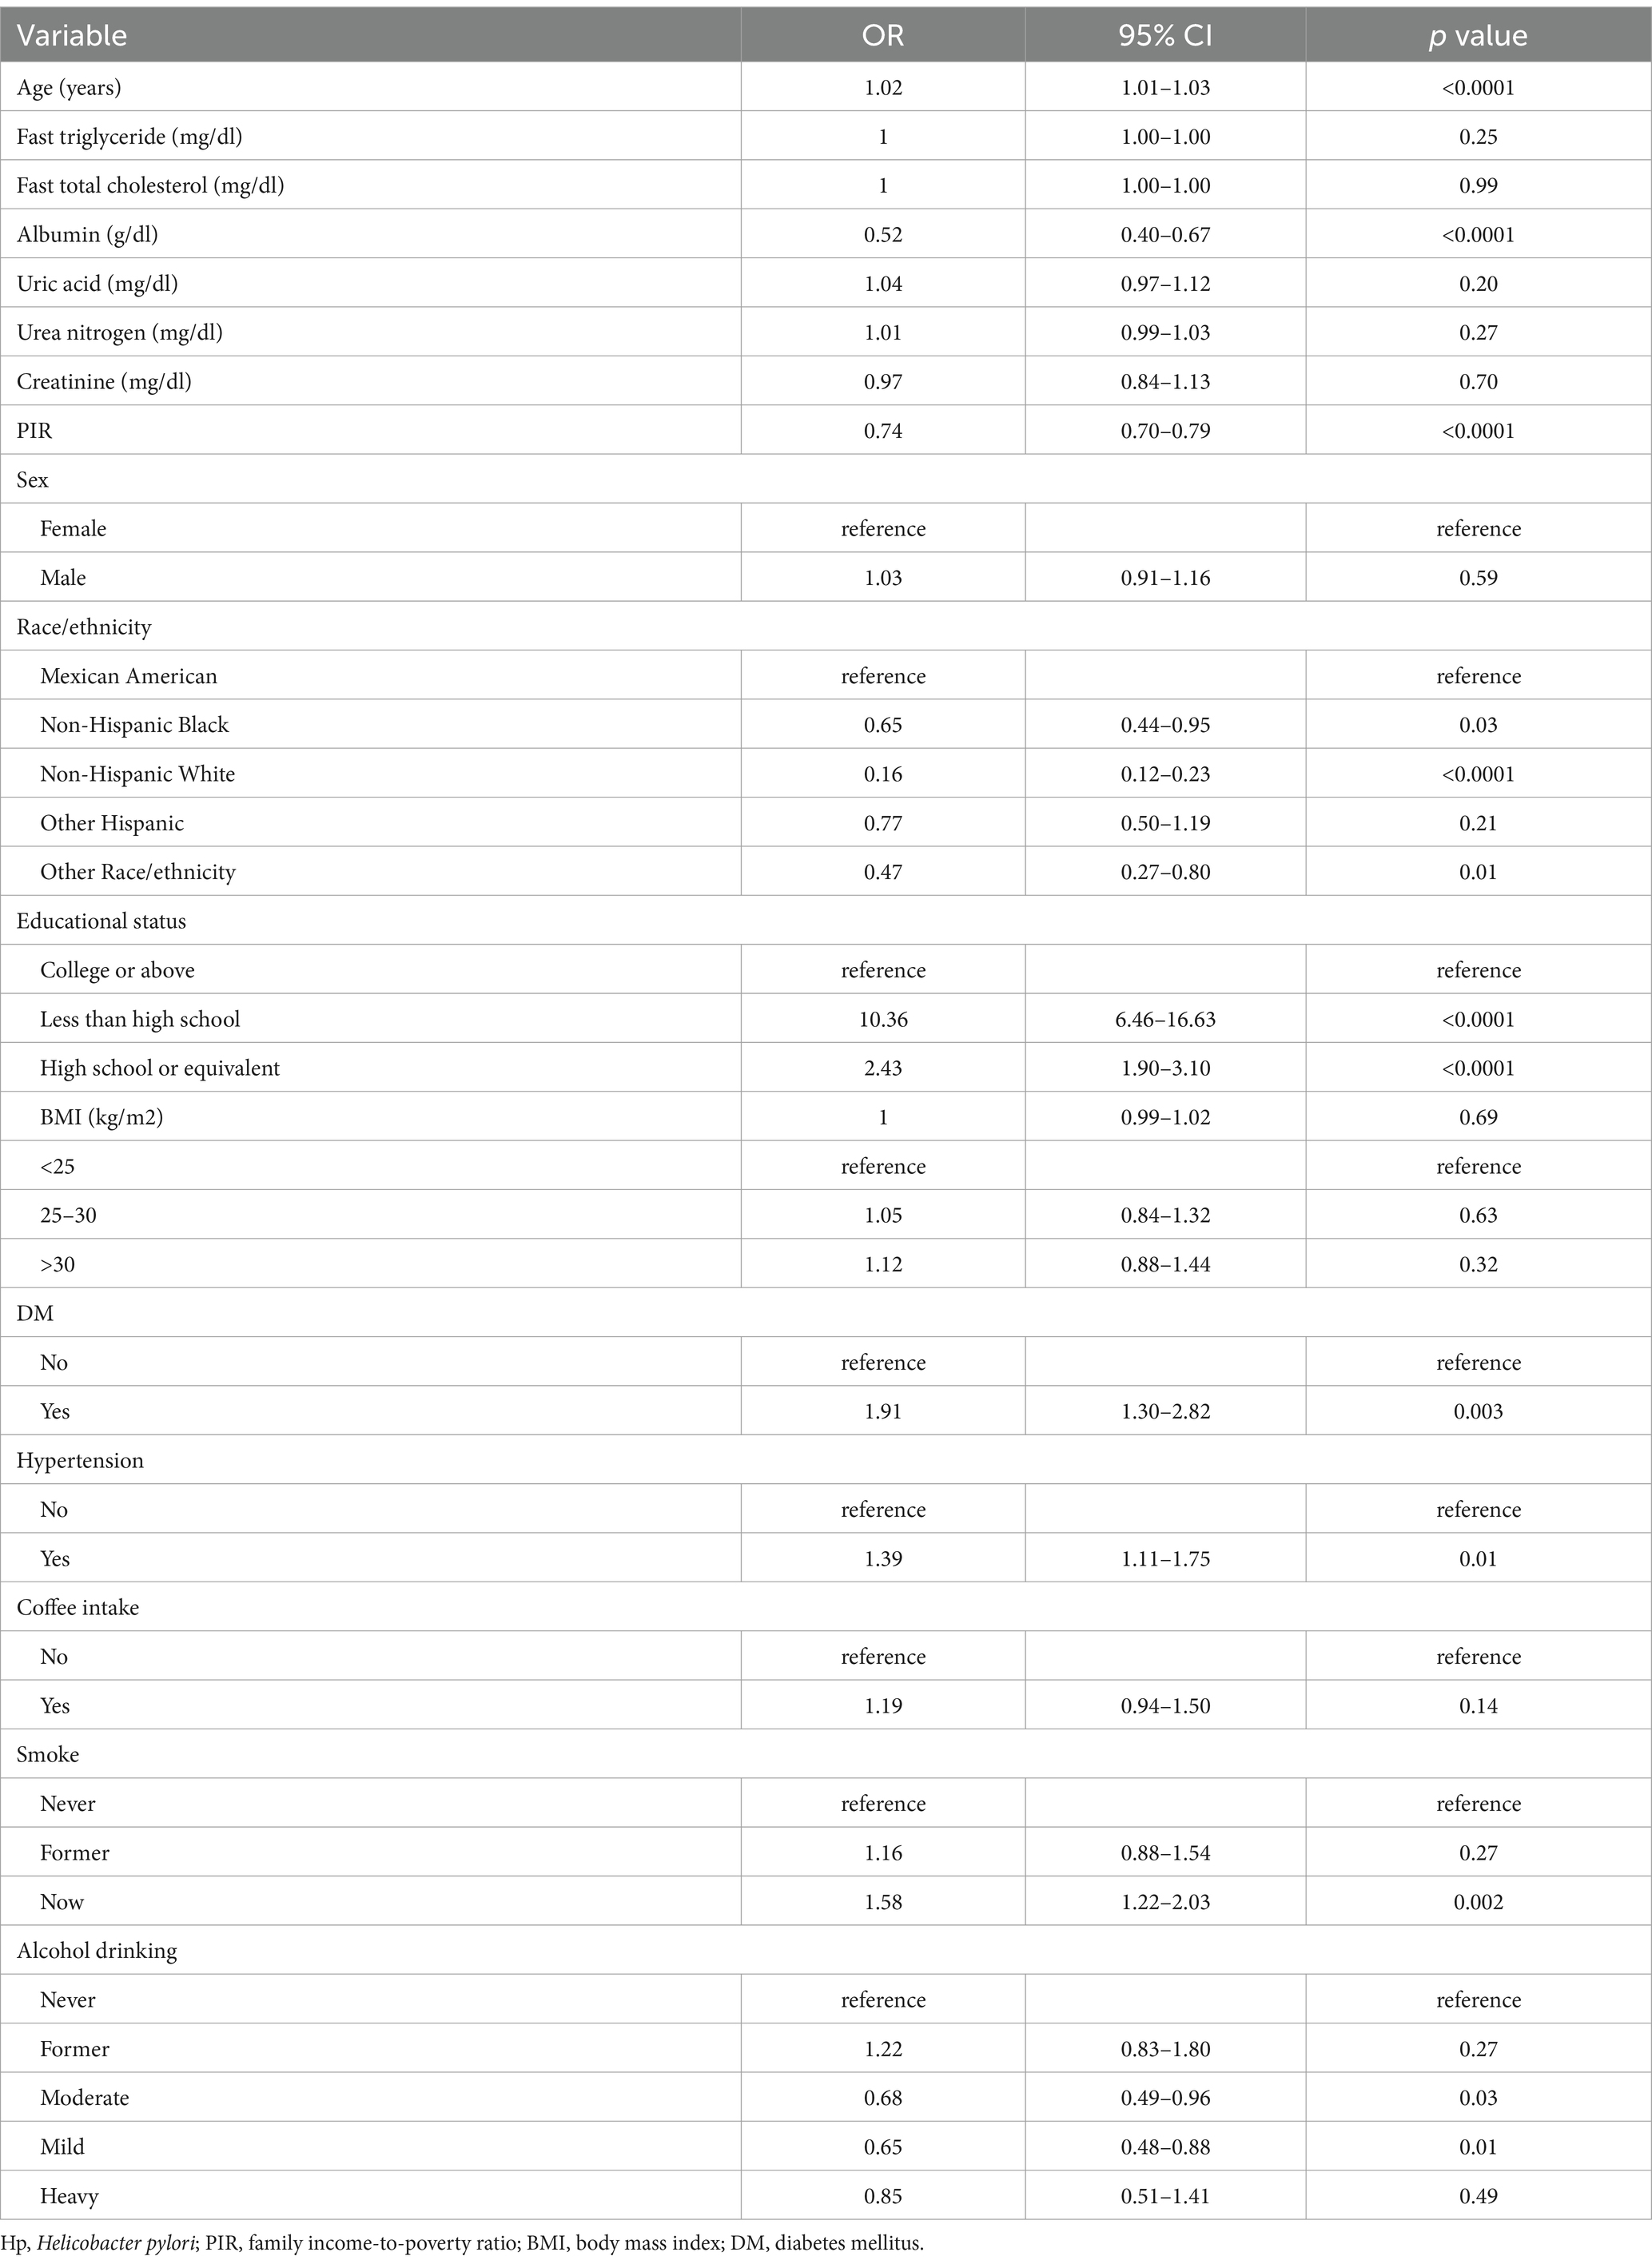
Table 2. Sample-weighted univariate analysis of the factors associated with the odds of H. pylori seropositivity in the national health and nutrition examination survey 1999–2000 cohort.
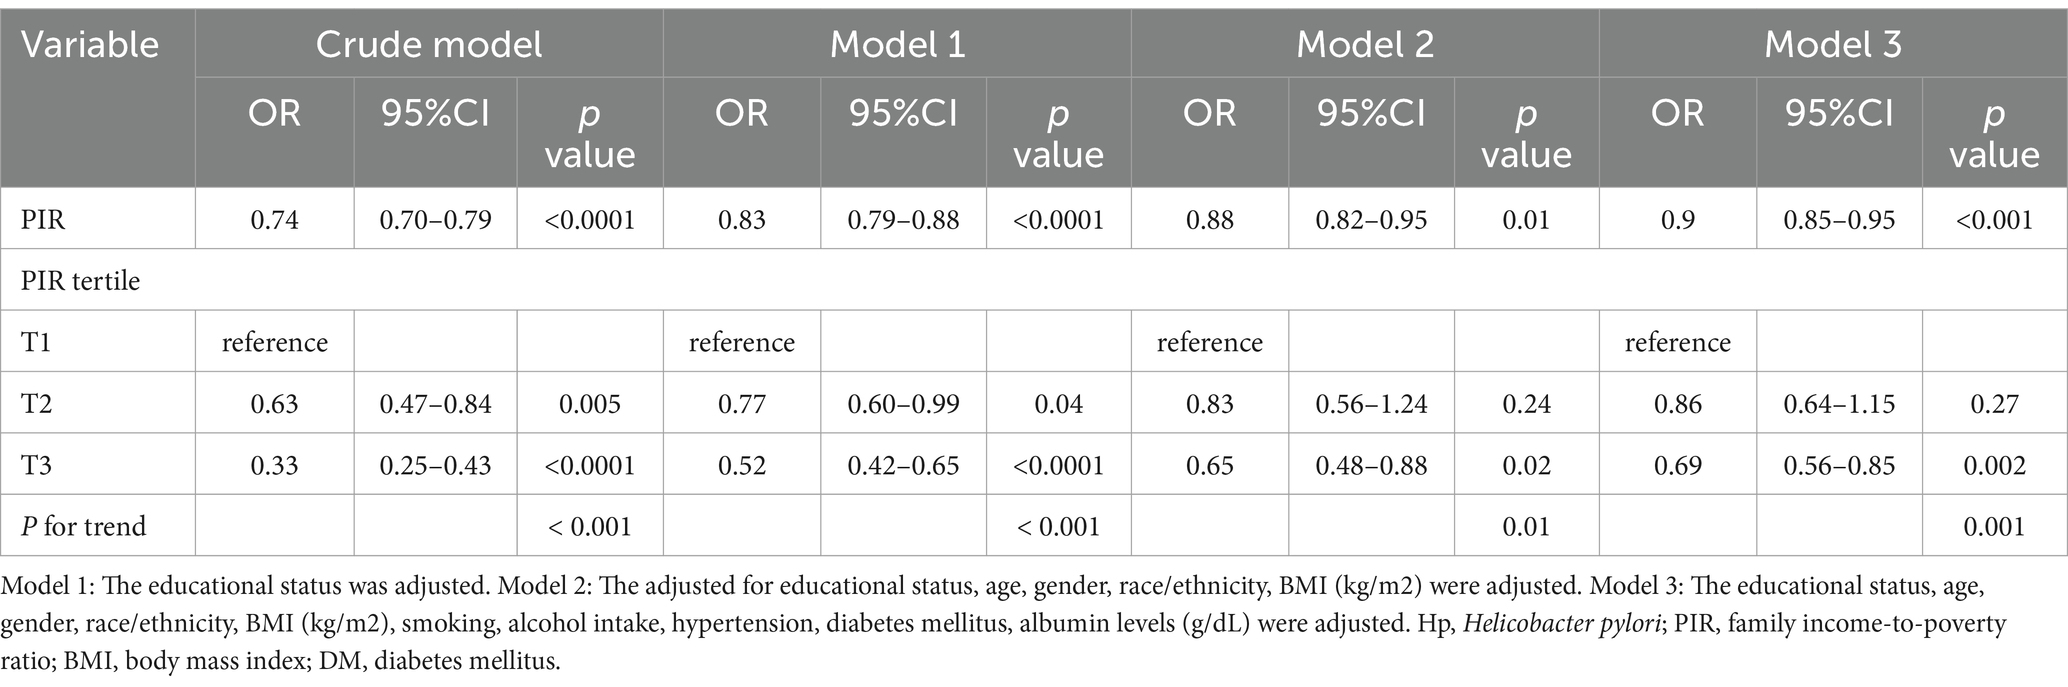
Table 3. Sample-weighted multivariable logistic regression analyses of the relationships between poverty-to-income ratio values and H. seropositivity.
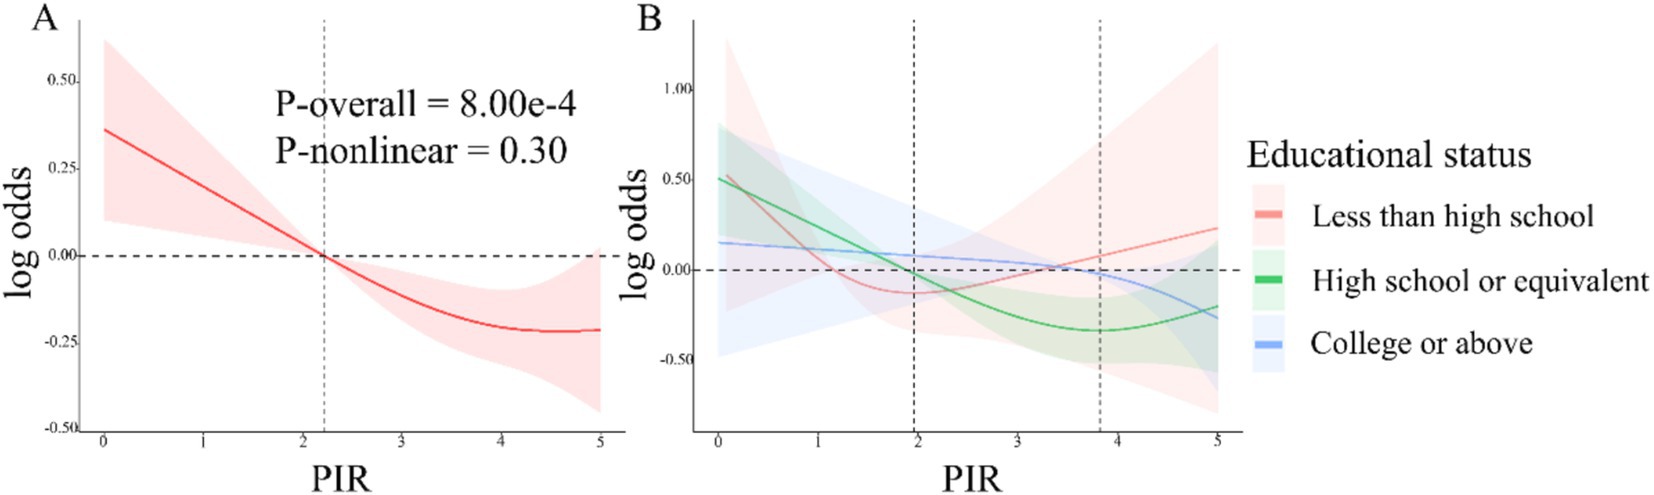
Figure 2. (A) RCS analyses of the association between PIR values and Helicobacter pylori serostatus under model 3. Red shaded area represent 95% confidence intervals. (B) Associations between PIR levels and H. pylori serostatus stratified according to educational status. The shaded areas in orange, green and blue represent the confidence intervals for less than high school, high school or equivalent, and college or above educational status.
3.3 Subgroup analysis
The robustness of the above results was next evaluated through a series of subgroup analyses (Table 4). This approach revealed associations between PIR values and H. pylori seropositivity among subjects with high school or equivalent (OR = 0.78, 95% CI, 0.71–0.86) and college or above (OR = 0.86, 95% CI, 0.77–0.95) educational status relative to other subgroups. These associations were similarly noted for participants of Mexican American (OR = 0.86, 95% CI, 0.75–0.99), Non-Hispanic Black (OR = 0.87, 95% CI, 0.79–0.96), non-Hispanic White (OR = 0.78, 95% CI, 0.71–0.86), and other race/ethnicity (OR = 0.79, 95% CI, 0.64–0.97), whereas these associations were not detected in individuals of other Hispanic race/ethnicity or participants with less than a high school education. No significant interactions between PIR and H. pylori were detected in these subgroup analyses (P for interaction > 0.05).
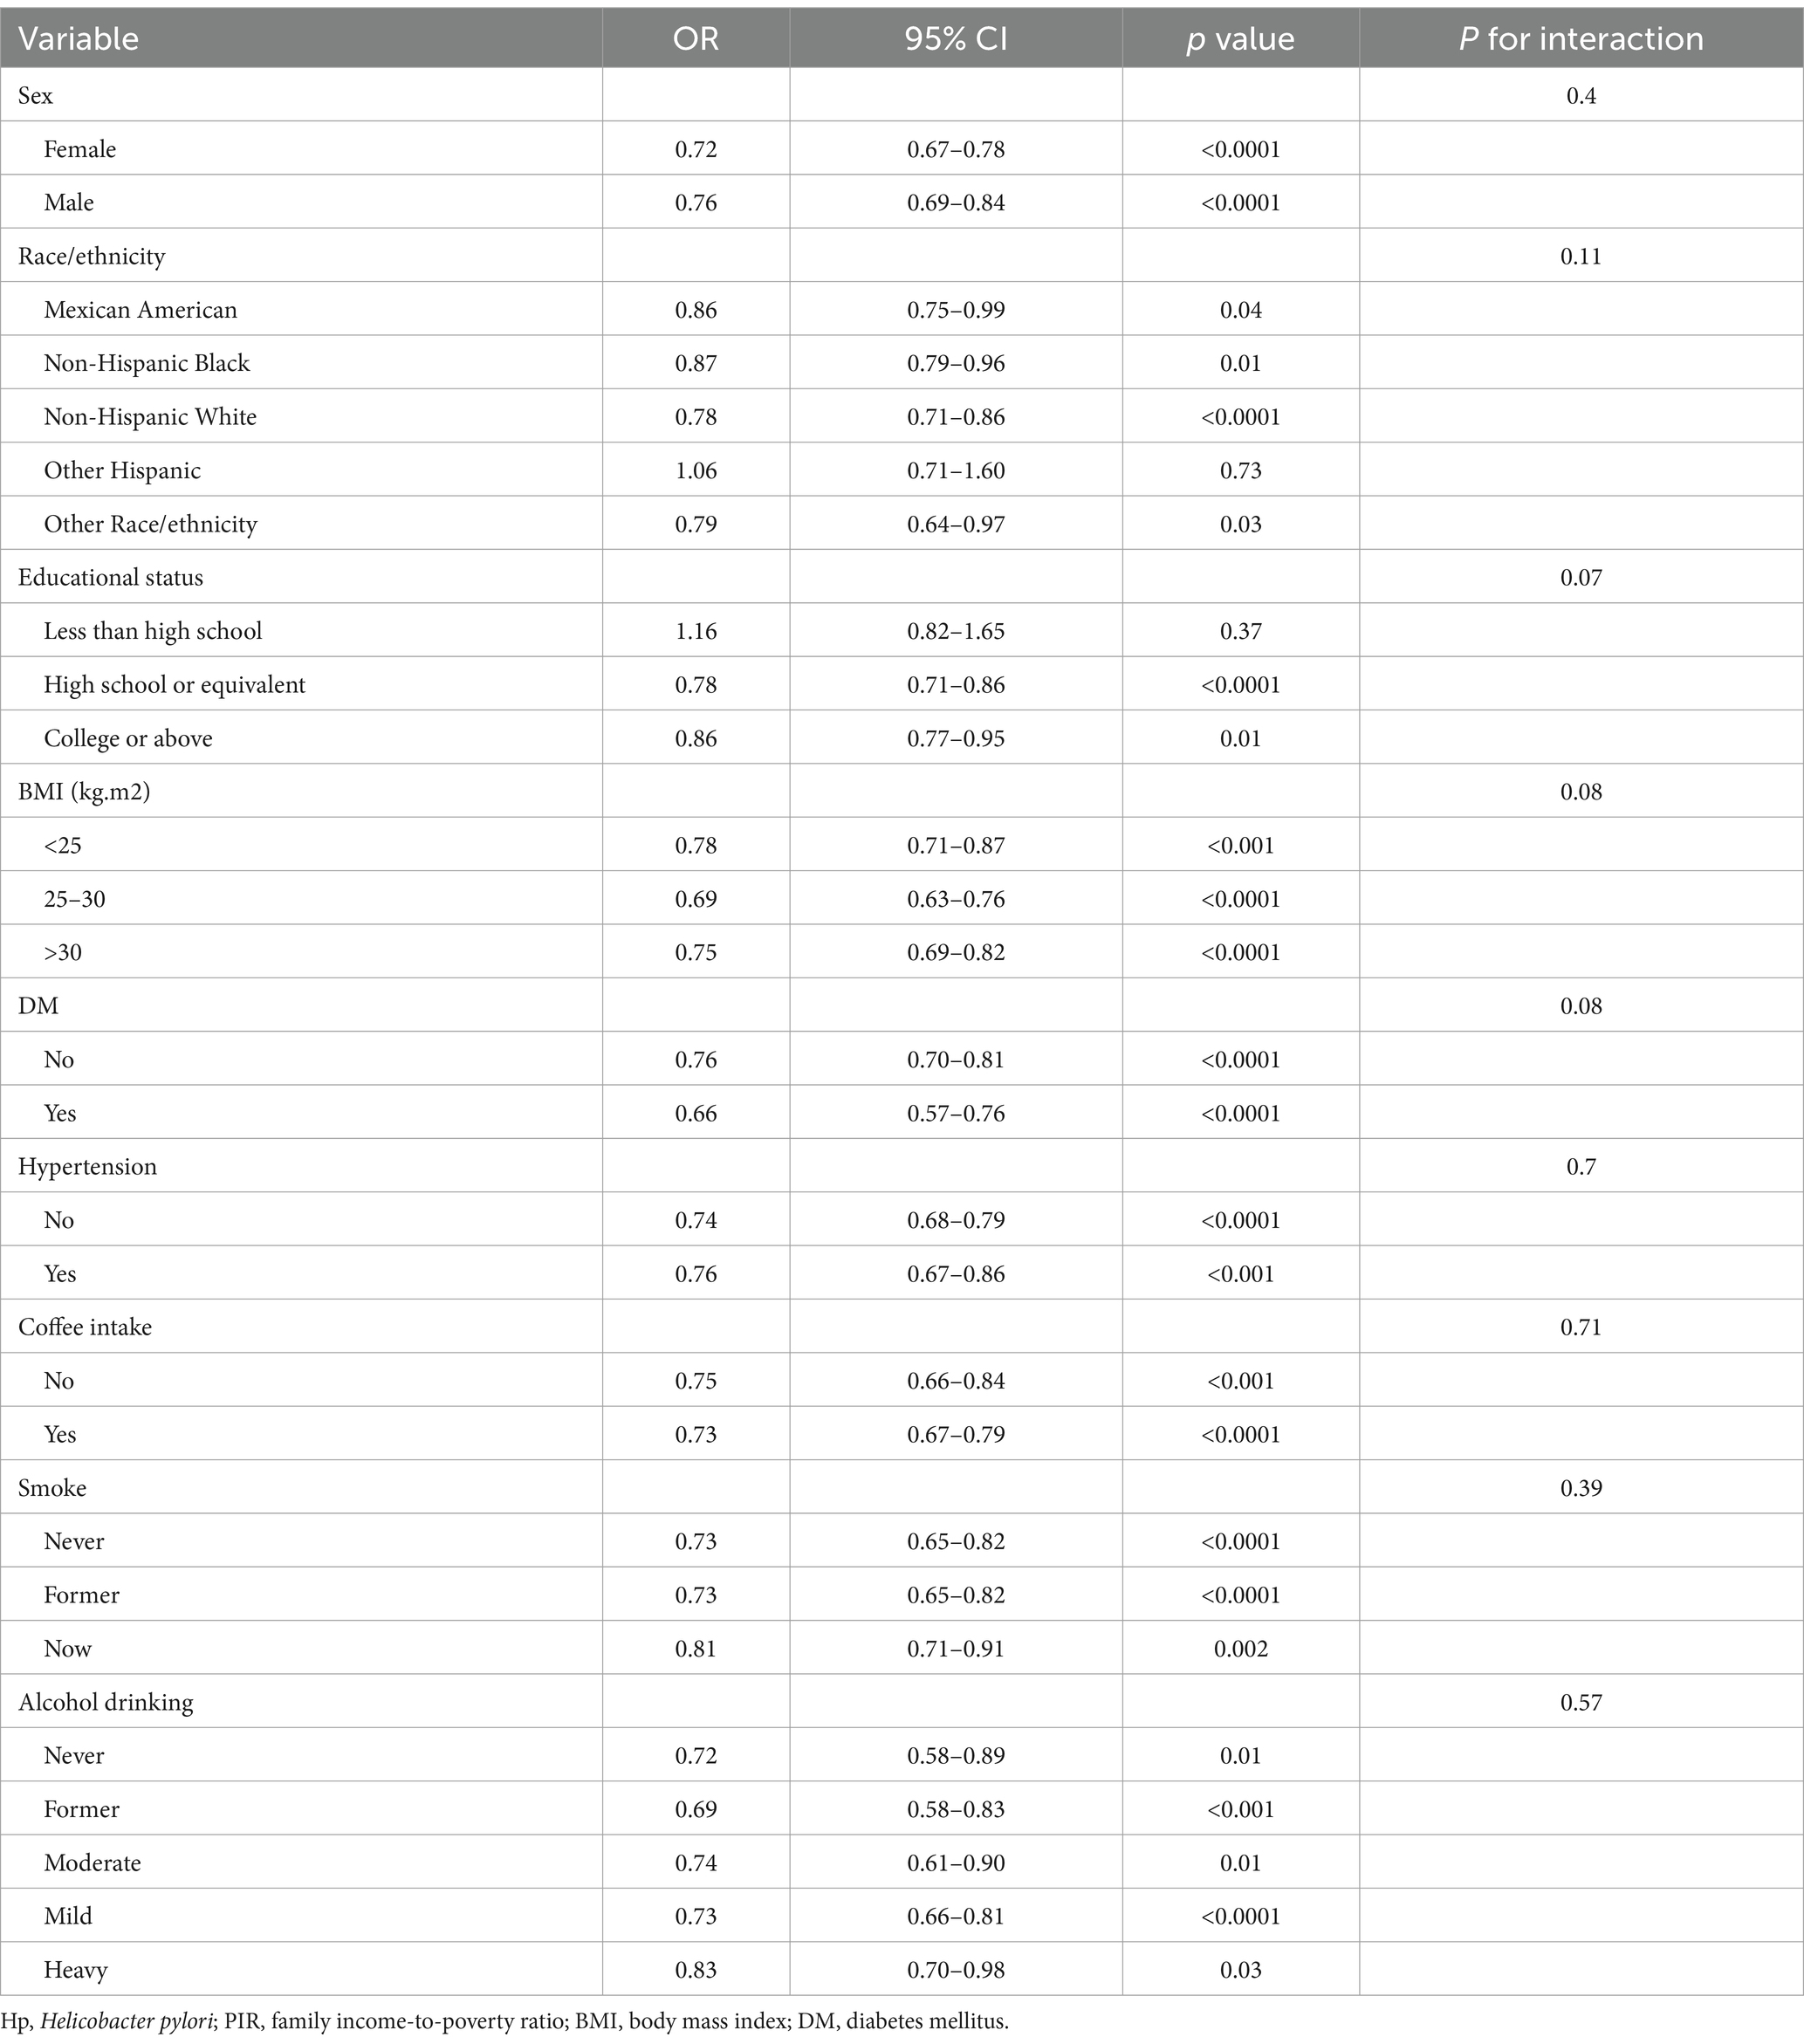
Table 4. Sample-weighted subgroup analyses of the association between poverty-to-income ratio values and H. pylori seropositivity.
3.4 Association with all-cause mortality
During the median 243 months of follow-up, 1,104 (31%, weighted percentage = 21.08%) deaths were recorded and one subject was lost to follow-up. As continuous variable, in Model 2, for each unit increase in the PIR, adjusted hazard ratio (HR) for all-cause mortality was 0.87 (95% CI: 0.77–0.99) in H. pylori seropositivity participants and 0.81 (95% CI: 0.74–0.88) in H. pylori seronegative population (Table 5). When assessing PIR as categorical variable, after adjusting age, gender, education, race/ethnicity, BMI, hypertension, and diabetes mellitus, compared to the T1 group, both H. pylori seropositivity and seronegative participants in the T3 group exhibited a lower risk of death (respectively, H. pylori seropositivity HR: 0.58, 95% CI: 0.35–0.95; p = 0.04; H. pylori seronegative HR: 0.45, 95% CI: 0.31–0.65; p < 0.001; Table 5). The subgroup analyses showed that the relationship between PIR and all-cause mortality remained consistent across all subgroups (Supplementary Table 1). Coffee intake and smoke modified the relationship between PIR and all-cause mortality (P for interaction < 0.05). In crude model, H. pylori seropositivity was associated with an increased risk of all-cause mortality (Table 6). However, there was no association observed between H. pylori serostatus and all-cause mortality after adjusting for correlated covariates in Model 1 and Model 2. Based on the subgroup analyses, we found that the associations of H. pylori serostatus and all-cause mortality was still existed in some subsets of the population (Supplementary Table 2). The relationship between H. pylori serostatus and all-cause mortality was influenced by sex (P for interaction < 0.001). RCS curves indicated the nonlinear relations between PIR values and all-cause mortality risk in this cohort (P-nonlinear = 2.84 × 10⁻³ Figure 3A). In the H. pylori serostatus subgroup, a negative relationship was observed between PIR and all-cause mortality in H. pylori seropositivity and seronegative group (Figure 3B). When regarding PIR values as a categorical variable, Kaplan–Meier curves revealed that both lower PIR values and H. pylori seropositivity were linked to an increase in all-cause mortality risk (Figures 4A,B). Relative to PIR tertiles 1 and 2, participants in tertile 3 presented with a lower risk of mortality irrespective of H. pylori seropositivity (Figures 4C,D).
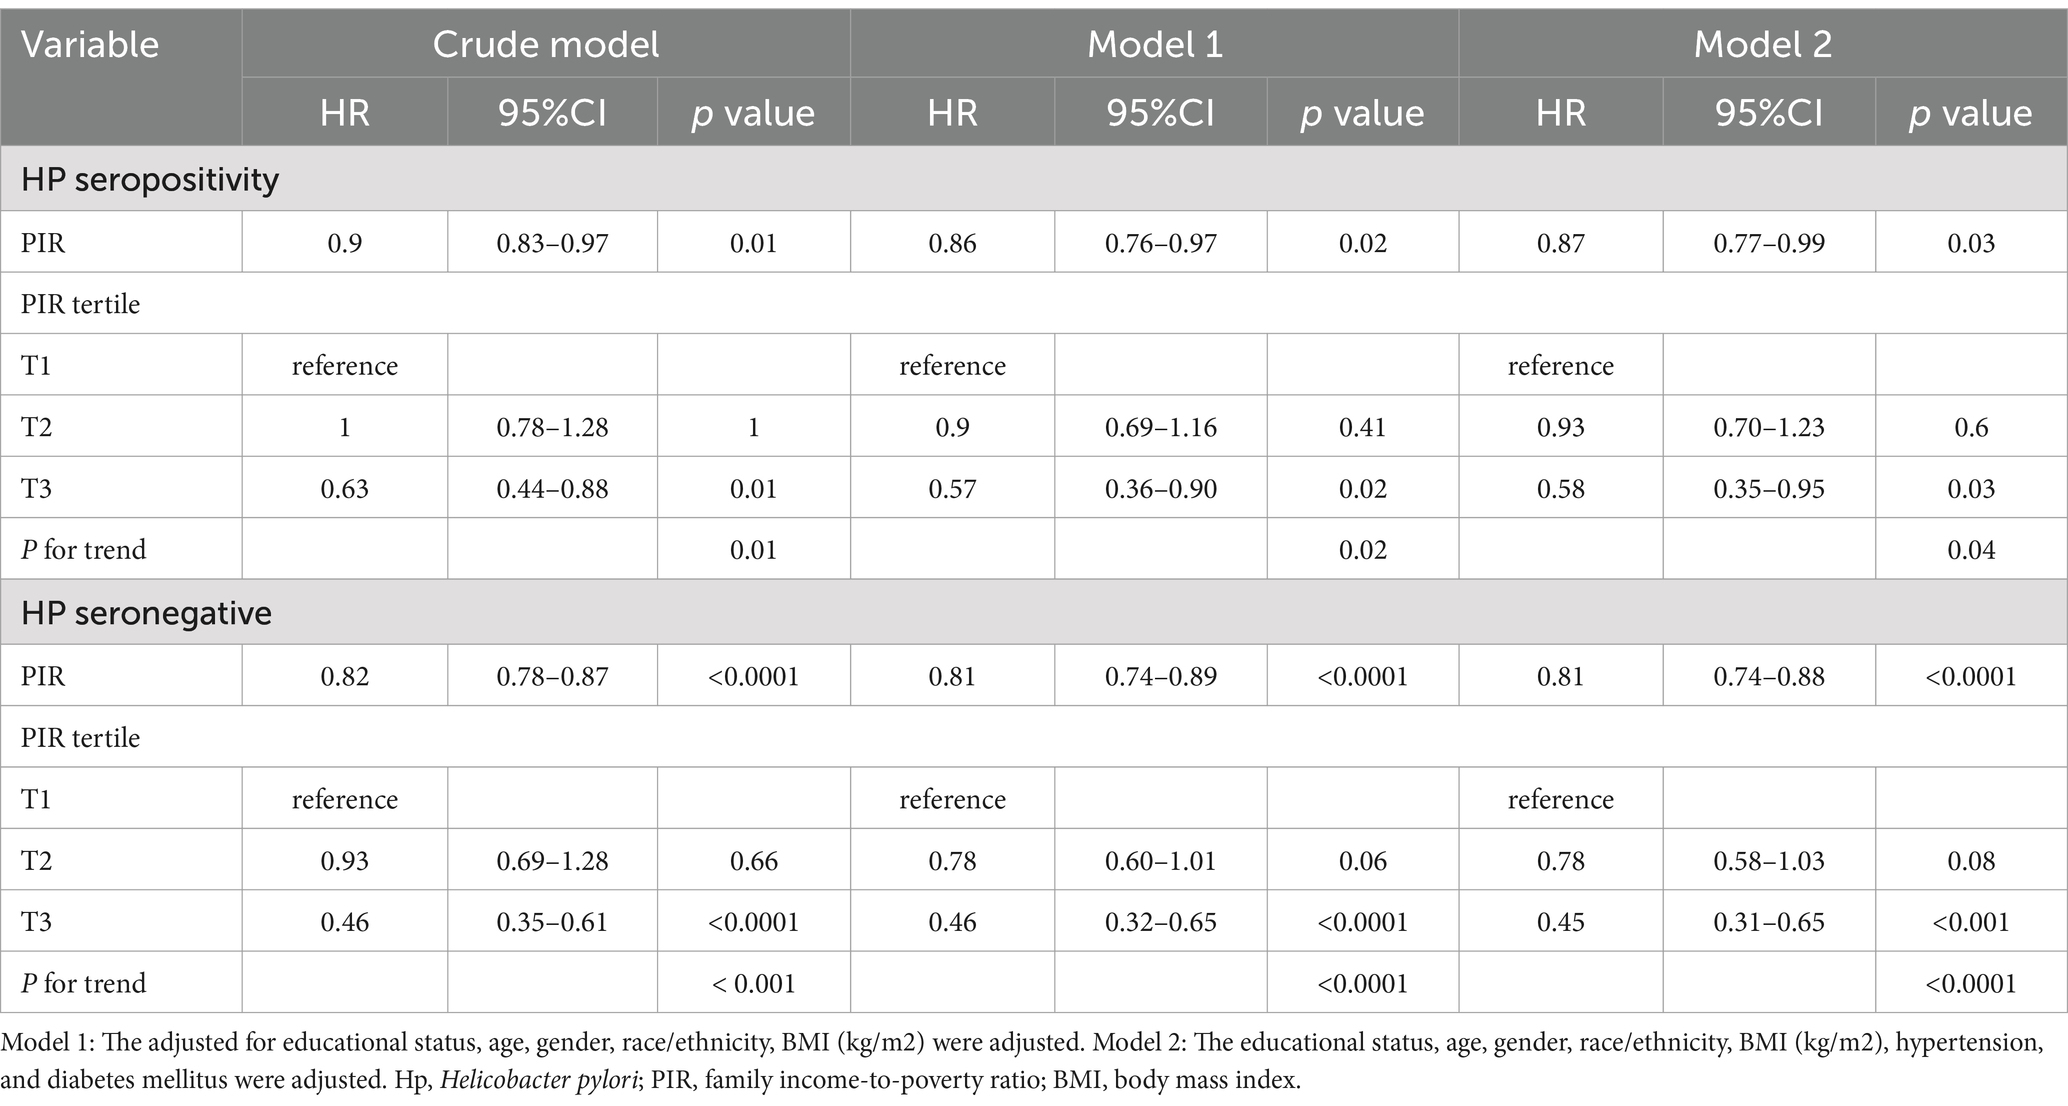
Table 5. Sample-weighted multivariable Cox regression analyses of the relationships between poverty-to-income ratio values and all-cause mortality stratified according to H. pylori serostatus.
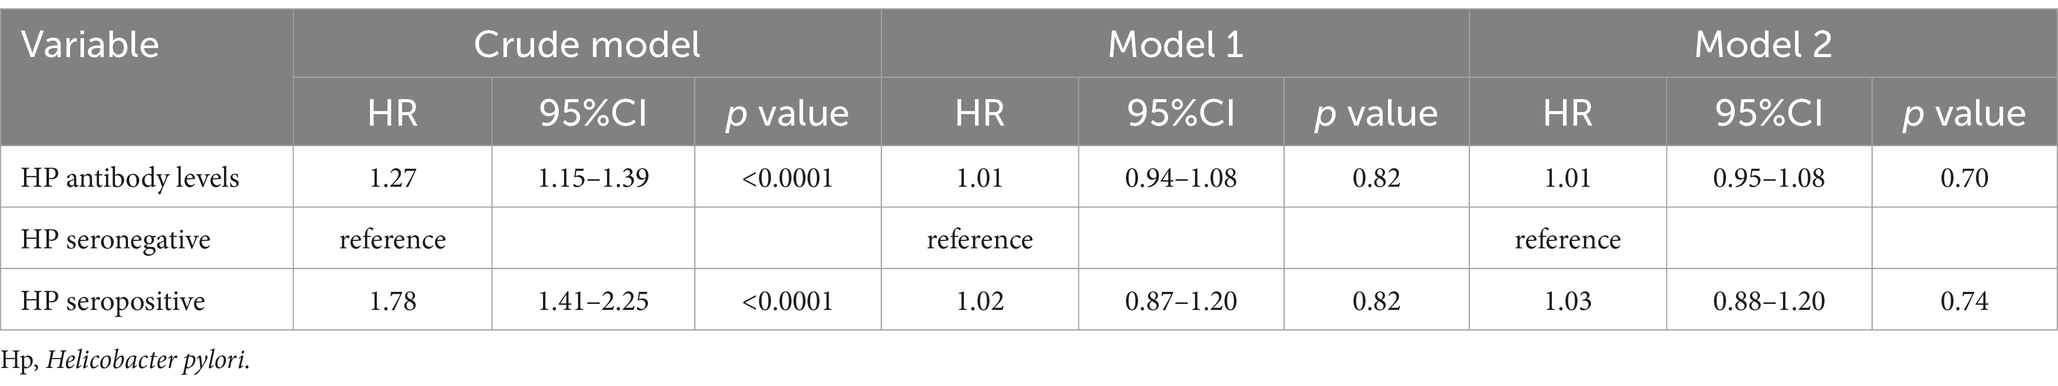
Table 6. Sample-weighted multivariable Cox regression analyses of the relationships between H. pylori serostatus and all-cause mortality.
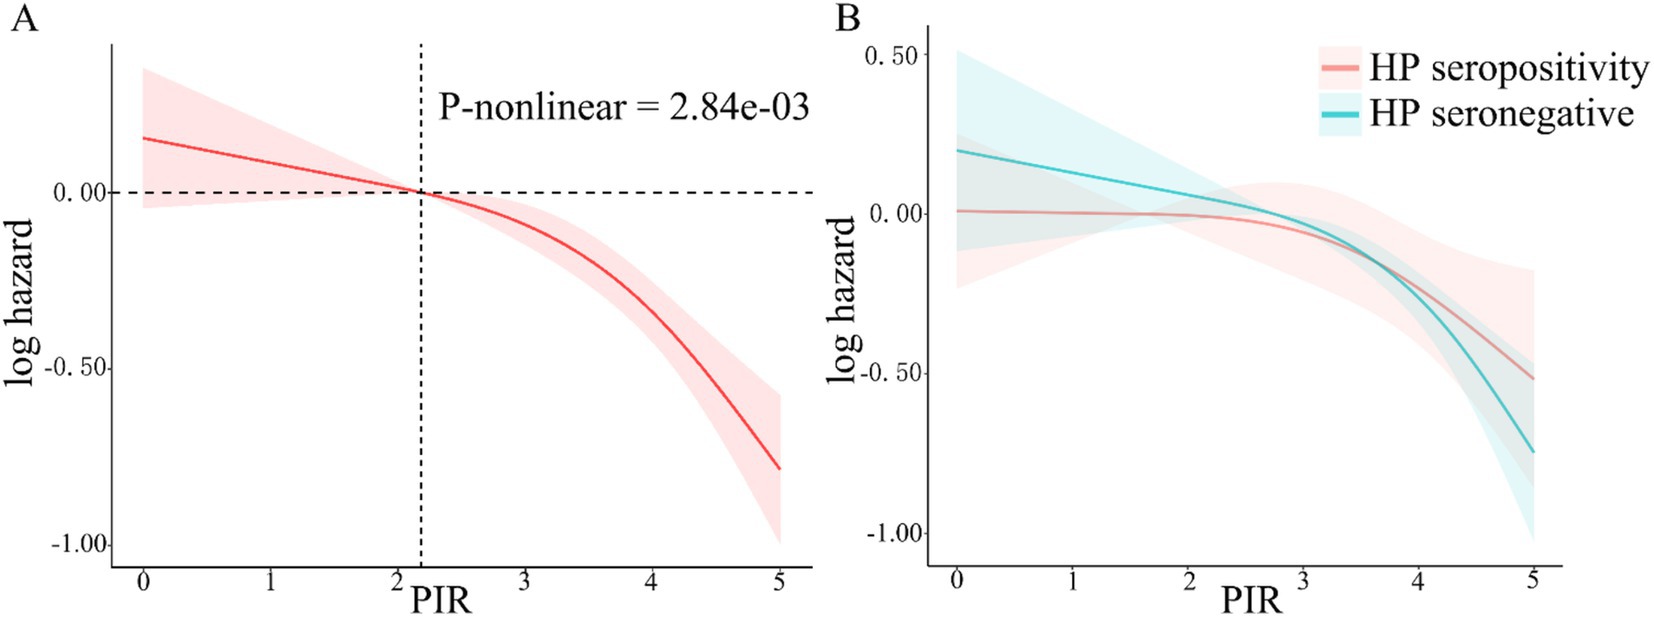
Figure 3. RCS analyses of the relationship between PIR values and all-cause mortality risk in total participant (A, the red shaded area represent 95% confidence intervals) and stratified according to H. pylori serostatus (B, the red and green shaded area, respectively, represent 95% confidence intervals of H. pylori seropositivity and seronegative).
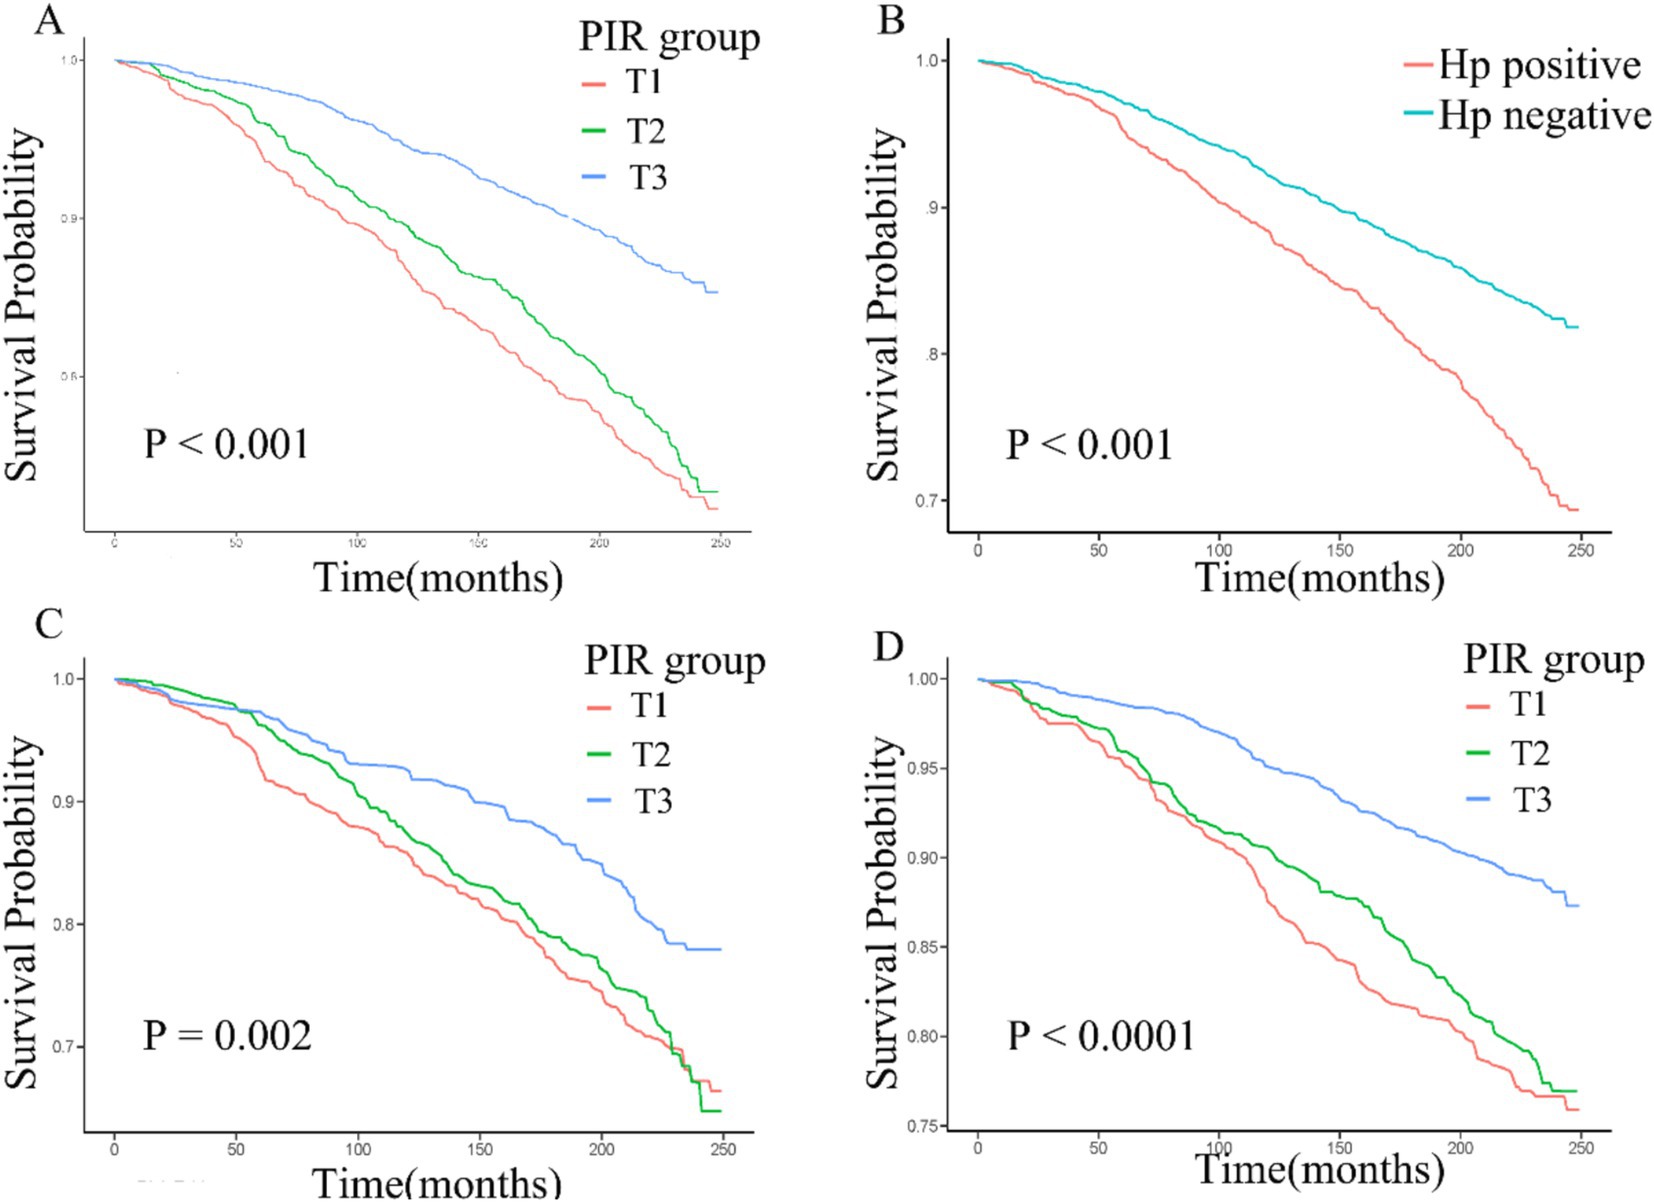
Figure 4. (A–D) Kaplan–Meier curves corresponding to different PIR tertiles in the overall cohort (A), H. pylori seropositivity groups in the overall cohort (B), PIR tertiles in H. pylori seropositivity individuals (C), and PIR tertiles in H. pylori seronegative individuals (D).
4 Discussion
In the present analyses, the associations between SES, H. pylori seropositivity, and all-cause mortality were assessed based on data from individuals included in the NHANES 1999–2000 cohort. PIR values and H. pylori seropositivity were applied as proxy variables for SES and H. pylori seropositivity. Overall, rising PIR levels were associated with a decline in H. pylori seropositivity. In subgroup analyses, this relationship remained stable across demographic groups. PIR was also associated with participant mortality irrespective of H. pylori seropositivity status. There is an association between H. pylori serostatus and all-cause mortality; however, this association is affected by numerous confounding factors.
An estimated 31.01% (weighted percentage) of the participant population in this study was infected with H. pylori. The proportion for H. pylori seropositivity in this study is similar to another study, which found that the seropositivity rate of H. pylori among general US adult population was 30.7% (33). The seroprevalence of H. pylori exhibited variations across different age groups, with a reported prevalence of 26.4% among US children aged 6–16 (34). During the same period, the highest prevalence was reported in Eastern Mediterranean region (82.7%), and the lowest in European region (46.2%) (7). While odds of such infections have been declining markedly in industrialized Western nations in recent years, they remain particularly high in developing nations (4, 35). In addition, our findings demonstrate racial and ethnic disparities in HP seroprevalence, with higher rates among minority groups, consistent with results from related studies (36, 37). The observed variations in H pylori prevalence across different age groups, race/ethnicity, and geography were associated with SES (38, 39). In Japan, living in crowded environments with many siblings was reported to be associated with a greater risk of H. pylori infection in younger individuals (10). This suggests that this bacterium can be transmitted within families such that children in impoverished and crowded areas face particularly elevated odds of infection owing to poorer hygienic conditions (40, 41).
Epidemiological research has shown that higher household income levels are associated with the adoption of healthier but more costly lifestyles at an early point in life (42). Those from lower-income household groups are more frequently exposed to infections due to factors including a lack of quality health service access, overcrowding and poor neighborhood environments (43, 44). Previous research has demonstrated that the lowest SES group suffered from the highest mean pathogen burden (45, 46). Once infection has been established, these individuals may lack the ability to control it (47). Our findings indicated decreased PIR was associated with H. pylori seropositivity. It is important to acknowledge the limitations of PIR values, including variations in income and wealth among different regions, as well as the potential influence of income instability on PIR fluctuations. Additionally, the PIR percentile classification may not reflect roughly homogenous standards of living within each category, particularly in comparison to the categorization scheme recommended in the NHANES Guidelines (48). This disparity in classification methods could introduce bias in our findings, as individuals may be misclassified based on differing categorization criteria. Nevertheless, PIR serves as a reasonably objective indicator of socioeconomic status and is commonly employed in investigating associations with chronic illnesses (14, 49, 50). Educational status is another SES indicator that is closely associated with measures of personal hygiene-related factors. In this study, H. pylori seropositivity odds were consistently found to be higher among individuals with lower educational status, whereas they were markedly lower among individuals with a college education or higher. Higher level of education are associated with improved knowledge of sanitation and approaches to eliminating unsanitary conditions, which may account for the reduced odds of H. pylori seropositivity in individuals with higher educational attainment (17, 51). The present results align well with prior evidence indicating that PIR values are inversely associated with H. pylori seropositivity (7, 34, 51). Smooth curve fitting and RCS approaches also confirmed that the relationship between PIR values and H. pylori serostatus was largely linear. Subgroup analyses additionally revealed that this association was maintained in all analyzed demographic groups with no significant interactions. PIR was independently associated with H. pylori seropositivity, and Cox regression analysis and survival analyses additionally revealed an increase in all-cause mortality risk with decreasing PIR values. These data are consistent with past reports identifying lower socioeconomic status as a major risk factor associated with the incidence of premature mortality (52–54). The disproportionate burden of persistent infection among disadvantaged groups may be an important determinant of disparities in long-term health (55). A substantial cumulative burden of chronic infections has the potential to induce an elevated state of inflammation and accelerate the onset of chronic ailments and mortality (34). Among the major pathogens, H. pylori is an important contributor to infection-related cancer deaths (53, 54, 56) and cardiovascular disease (57). In the present study, the result of crude model and Kaplan–Meier curve indicated that H. pylori seropositivity were associated with higher all-cause mortality (Figure 4B). However, after adjusting for covariates, H. pylori seropositivity was not associated with all-cause mortality. The result showed that the association H. pylori seropositivity and all-cause mortality was influenced by potential covariates. Previous evidence suggests that while H. pylori has a complex role in human health, it is not a major risk factor for all-cause mortality (58). The RCS curve showed a similar relationship between PIR and all-cause mortality in H. pylori seropositivity and seronegative groups. The result of weighted multivariable Cox regression analyses also demonstrated that PIR was negatively associated with all-cause mortality, regardless of H. pylori serostatus. The findings show that H. pylori seropositivity affects health, but it was not linked to all-cause mortality, which aligns with previous studies. Serology is common for general population assessment of H. pylori status. However, it is important to acknowledge the inherent limitations of this diagnostic test, as H. pylori serologic status can not differentiate a current or past infection. In addition, the varying availability of healthcare services among different SES populations during the follow-up survey may contribute to the disparities in H. pylori eradication rates. These limitations might potentially influence the result of the analysis. The findings of a meta-analysis suggest that H. pylori eradication reduced gastric cancer-related mortality but did not appear to affect all-cause mortality (59).
The NHANES survey compiles a range of health- and nutrition-related parameters from a nationally representative population of individuals from the United States, making it an invaluable resource for hypothesis generation and the assessment of relationships between particular exposures and health-related outcomes. In addition, this study is subject to certain limitations. First, both PIR values and Hp serological status were obtained at baseline; therefore, a causal relationship between the PIR values and Hp serological status cannot be established. Second, we employed H. pylori serological data for detecting H. pylori infection. It’s important to note that while the sensitivity of serological test is above 90%, its specificity is only about 80%. This means there’s a possibility of misclassification in this study. For example, patients with prior infections may test positive in the serological test. Third, the association between PIR and H. pylori seropositivity could be influenced by unmeasured or residual confounding factors and misclassification of H. pylori status and other variables. Fourth, consecutive PIR and H. pylori status changes during follow-up were not recorded and the majority of deaths are unrelated to H. pylori infection. These factors could lead to opaque recommendations or misinterpretations in the analysis of all-cause mortality. Fifth, our research conclusion only applies to Americans, and may not be generalizable to other regions. Sixth, weighted analysis may dilute the observations in oversampled minority population. Finally, the samples used in this study are just from the United States more than 20 years ago (NHANES 1999–2000) because the H. pylori serological data were only available in this period. Although these samples may not reflect the current socio-economic factors, we believe they still possess intrinsic value for research purposes.
5 Conclusion
In summary, this analysis of the general US population revealed an inverse association between PIR values and both H. pylori seropositivity and all-cause mortality. While H. pylori seropositivity is associated with all-cause mortality, it is not a major risk factor for all-cause mortality and does not appear to influence the relationship between PIR and all-cause mortality. These findings suggest that there is a need to strengthen screening for H. pylori infection, particularly among impoverished populations, and to enhance healthcare services to reduce H. pylori infection rates and mortality. Furthermore, our study emphasizes the value of assessing PIR values in patient populations to better inform public health strategies.
Data availability statement
Publicly available datasets were analyzed in this study. This data can be found here: https://www.cdc.gov/nchs/nhanes.
Ethics statement
The studies involving humans were approved by the National Center for Health Statistics Research Ethics Review Board. The studies were conducted in accordance with the local legislation and institutional requirements. The participants provided their written informed consent to participate in this study.
Author contributions
CJ: Conceptualization, Data curation, Formal analysis, Funding acquisition, Investigation, Methodology, Project administration, Resources, Software, Supervision, Validation, Visualization, Writing – original draft, Writing – review & editing. LZ: Conceptualization, Data curation, Formal analysis, Funding acquisition, Investigation, Methodology, Project administration, Resources, Software, Supervision, Validation, Visualization, Writing – original draft, Writing – review & editing. WnY: Writing – original draft. ZY: Writing – original draft. WiY: Writing – original draft. XJ: Writing – original draft. YS: Conceptualization, Data curation, Formal analysis, Funding acquisition, Investigation, Methodology, Project administration, Resources, Software, Supervision, Validation, Visualization, Writing – original draft, Writing – review & editing.
Funding
The author(s) declare that no financial support was received for the research and/or publication of this article.
Acknowledgments
We would like to thank the NHANES team for providing the data. We would also like to thank Zhang Jing (Second Department of Infectious Disease, Shanghai Fifth People’s Hospital, Fudan University) for his work (nhanesR package and webpage) on the NHANES database.
Conflict of interest
The authors declare that the research was conducted in the absence of any commercial or financial relationships that could be construed as a potential conflict of interest.
Generative AI statement
The author(s) declare that no Gen AI was used in the creation of this manuscript.
Publisher’s note
All claims expressed in this article are solely those of the authors and do not necessarily represent those of their affiliated organizations, or those of the publisher, the editors and the reviewers. Any product that may be evaluated in this article, or claim that may be made by its manufacturer, is not guaranteed or endorsed by the publisher.
Supplementary material
The Supplementary material for this article can be found online at: https://www.frontiersin.org/articles/10.3389/fpubh.2025.1578257/full#supplementary-material
Footnotes
References
1. Malfertheiner, P, Megraud, F, O'Morain, CA, and Gisbert, JP. Management of Helicobacter pylori infection-the Maastricht V/Florence consensus report. Gut. (2017) 66:6–30. doi: 10.1136/gutjnl-2016-312288
2. Zamani, M, and Ebrahimtabar, F. Systematic review with meta-analysis: the worldwide prevalence of Helicobacter pylori infection. Aliment Pharmacol Ther. (2018) 47:868–76. doi: 10.1111/apt.14561
3. Sjomina, O, Pavlova, J, Niv, Y, and Leja, M. Epidemiology of Helicobacter pylori infection. Helicobacter. (2018) 23:e12514. doi: 10.1111/hel.12514
4. Hooi, JKY, Lai, WY, Ng, WK, Suen, MMY, Underwood, FE, Tanyingoh, D, et al. Global prevalence of Helicobacter pylori infection: systematic review and Meta-analysis. Gastroenterology. (2017) 153:420–9. doi: 10.1053/j.gastro.2017.04.022
5. Zou, JC, Wen, MY, Huang, Y, Chen, XZ, and Hu, JK. Helicobacter pylori infection prevalence declined among an urban health check-up population in Chengdu, China: a longitudinal analysis of multiple cross-sectional studies. Front Public Health. (2023) 11:1128765. doi: 10.3389/fpubh.2023.1128765
6. Butt, J, and Epplein, M. How do global trends in Helicobacter pylori prevalence inform prevention planning? Lancet Gastroenterol Hepatol. (2023) 8:498–9. doi: 10.1016/S2468-1253(23)00101-2
7. Li, Y, Choi, H, Leung, K, Jiang, F, Graham, DY, and Leung, WK. Global prevalence of Helicobacter pylori infection between 1980 and 2022: a systematic review and meta-analysis. Lancet Gastroenterol Hepatol. (2023) 8:553–64. doi: 10.1016/S2468-1253(23)00070-5
8. Zandian, H, and Zahirian Moghadam, T. Gastric troubles in Iran: the role of social and economic factors in Helicobacter pylori infection. Health Promot Perspect. (2023) 13:120–8. doi: 10.34172/hpp.2023.15
9. Kusters, JG, van Vliet, AH, and Kuipers, EJ. Pathogenesis of Helicobacter pylori infection. Clin Microbiol Rev. (2006) 19:449–90. doi: 10.1128/CMR.00054-05
10. Elshair, M, Ugai, T, Oze, I, Kasugai, Y, Koyanagi, YN, Hara, K, et al. Impact of socioeconomic status and sibling number on the prevalence of Helicobacter pylori infection: a cross-sectional study in a Japanese population. Nagoya J Med Sci. (2022) 84:374–87. doi: 10.18999/nagjms.84.2.374
11. Alicandro, G, and Bertuccio, P. The mediating role of combined lifestyle factors on the relationship between education and gastric cancer in the stomach cancer pooling (StoP) project. Br J Cancer. (2022) 127:855–62. doi: 10.1038/s41416-022-01857-9
12. Xiong, YJ, Du, LL, Diao, YL, Wen, J, Meng, XB, Gao, J, et al. Association of dietary inflammatory index with helicobacter pylori infection and mortality among US population. J Transl Med. (2023) 21:538. doi: 10.1186/s12967-023-04398-8
13. Alwin, DF, and Wray, LA. A life-span developmental perspective on social status and health. J Gerontol B Psychol Sci Soc Sci. (2005) 60:7–14. doi: 10.1093/geronb/60.special_issue_2.s7
14. Tang, M, Liu, M, Zhang, Y, and Xie, R. Association of family income to poverty ratio and vibration-controlled transient elastography quantified degree of hepatic steatosis in U.S. adolescents. Front Endocrinol. (2023) 14:1160625. doi: 10.3389/fendo.2023.1160625
15. Vart, P, Gansevoort, RT, Crews, DC, Reijneveld, SA, and Bültmann, U. Mediators of the association between low socioeconomic status and chronic kidney disease in the United States. Am J Epidemiol. (2015) 181:385–96. doi: 10.1093/aje/kwu316
16. Liu, C, He, L, Li, Y, Yang, A, Zhang, K, and Luo, B. Diabetes risk among US adults with different socioeconomic status and behavioral lifestyles: evidence from the National Health and nutrition examination survey. Front Public Health. (2023) 11:1197947. doi: 10.3389/fpubh.2023.1197947
17. Rota, M, and Alicandro, G. Education and gastric cancer risk-an individual participant data meta-analysis in the StoP project consortium. Int J Cancer. (2020) 146:671–81. doi: 10.1002/ijc.32298
18. IARC Working Group on the Evaluation of Carcinogenic Risks to Humans. IARC Monographs on the Evaluation of Carcinogenic Risks to Humans, Schistosomes, Liver Flukes and Helicobacter pylori. Lyon: International Agency for Research on Cancer. vol. 61. (1994).
19. Li, L, Tan, J, Liu, L, Li, J, Chen, G, Chen, M, et al. Association between H. pylori infection and health outcomes: an umbrella review of systematic reviews and meta-analyses. BMJ Open. (2020) 10:e031951. doi: 10.1136/bmjopen-2019-031951
20. Wang, T, Li, X, Zhang, Q, Ge, B, Zhang, J, Yu, L, et al. Relationship between Helicobacter pylori infection and osteoporosis: a systematic review and meta-analysis. BMJ Open. (2019) 9:e027356. doi: 10.1136/bmjopen-2018-027356
21. Berrett, AN, Gale, SD, Erickson, LD, Brown, BL, and Hedges, DW. Folate and inflammatory markers moderate the association between Helicobacter pylori exposure and cognitive function in US adults. Helicobacter. (2016) 21:471–80. doi: 10.1111/hel.12303
22. Cardenas, VM, and Graham, DY. Smoking and Helicobacter pylori infection in a sample of U.S. adults. Epidemiology. (2005) 16:586–90. doi: 10.1097/01.ede.0000165365.52904.4a
23. Huang, JW, Xie, C, Niu, Z, He, LJ, and Li, JJ. The relation between Helicobacter pylori immunoglobulin G seropositivity and leukocyte telomere length in US adults from NHANES 1999-2000. Helicobacter. (2020) 25:e12760. doi: 10.1111/hel.12760
24. Fong, P, and Wang, QT. Protective effect of oral contraceptive against Helicobacter pylori infection in US adult females: NHANES 1999-2000. Epidemiol Infect. (2021) 149:e120. doi: 10.1017/S0950268821000923
25. Best, LM, Takwoingi, Y, Siddique, S, Selladurai, A, Gandhi, A, Low, B, et al. Non-invasive diagnostic tests for Helicobacter pylori infection. Cochrane Database Syst Rev. (2018) 3:Cd012080. doi: 10.1002/14651858.CD012080.pub2
26. Meier, HCS, Miller, FW, Dinse, GE, Weinberg, CR, Cho, CC, and Parks, CG. Helicobacter pylori seropositivity is associated with antinuclear antibodies in US adults, NHANES 1999-2000. Epidemiol Infect. (2020) 148:e20. doi: 10.1017/S0950268820000126
27. Marusić, M, Presecki, V, Katicić, M, Dominis, M, and Kalenić, S. The place and role of serologic methods in detecting Helicobacter pylori infection. Coll Antropol. (2006) 30:529–33.
28. Faigel, DO, Magaret, N, Corless, C, Lieberman, DA, and Fennerty, MB. Evaluation of rapid antibody tests for the diagnosis of Helicobacter pylori infection. Am J Gastroenterol. (2000) 95:72–7. doi: 10.1111/j.1572-0241.2000.01702.x
29. Gilger, MA, Tolia, V, Johnson, A, Rabinowitz, S, Jibaly, R, Elitsur, Y, et al. The use of an oral fluid immunoglobulin G ELISA for the detection of Helicobacter pylori infection in children. Helicobacter. (2002) 7:105–10. doi: 10.1046/j.1083-4389.2002.00062.x
30. Bosch, DE, Krumm, N, Wener, MH, Yeh, MM, Truong, CD, Reddi, DM, et al. Serology is more sensitive than urea breath test or stool antigen for the initial diagnosis of Helicobacter pylori gastritis when compared with histopathology. Am J Clin Pathol. (2020) 154:255–65. doi: 10.1093/ajcp/aqaa043
31. Sousa, C, and Ferreira, R. Advances on diagnosis of Helicobacter pylori infections. Crit Rev Microbiol. (2023) 49:671–92. doi: 10.1080/1040841X.2022.2125287
32. Vakil, N. Review article: the cost of diagnosing Helicobacter pylori infection. Aliment Pharmacol Ther. (2001) 15:10–5. doi: 10.1046/j.1365-2036.2001.00106.x
33. Grad, YH, Lipsitch, M, and Aiello, AE. Secular trends in Helicobacter pylori seroprevalence in adults in the United States: evidence for sustained race/ethnic disparities. Am J Epidemiol. (2012) 175:54–9. doi: 10.1093/aje/kwr288
34. Dowd, JB, Zajacova, A, and Aiello, A. Early origins of health disparities: burden of infection, health, and socioeconomic status in U.S. children. Soc Sci Med. (2009) 68:699–707. doi: 10.1016/j.socscimed.2008.12.010
35. Inoue, M. Changing epidemiology of Helicobacter pylori in Japan. Gastric Cancer: Official J Int Gastric Cancer Association Japanese Gastric Cancer Association. (2017) 20:3–7. doi: 10.1007/s10120-016-0658-5
36. Li, D, Merchant, SA, Badalov, JM, and Corley, DA. Time trends and demographic disparities in Helicobacter pylori burden in a large, community-based population in the United States. Gastro HEP Advan. (2024) 3:749–60. doi: 10.1016/j.gastha.2024.04.008
37. Kumar, S, Araque, M, Stark, VS, Kleyman, LS, Cohen, DA, and Goldberg, DS. Barriers to community-based eradication of Helicobacter pylori infection. Clinical Gastroenterol Hepatol: Official Clin Prac J American Gastroenterolog Association. (2024) 22:2140–.e1. doi: 10.1016/j.cgh.2024.03.008
38. Sitas, F, Forman, D, Yarnell, JW, Burr, ML, Elwood, PC, Pedley, S, et al. Helicobacter pylori infection rates in relation to age and social class in a population of welsh men. Gut. (1991) 32:25–8.
39. Goh, KL, Chan, WK, Shiota, S, and Yamaoka, Y. Epidemiology of Helicobacter pylori infection and public health implications. Helicobacter. (2011) 16:1–9. doi: 10.1111/j.1523-5378.2011.00874.x
40. Osaki, T, Okuda, M, Ueda, J, Konno, M, Yonezawa, H, Hojo, F, et al. Multilocus sequence typing of DNA from faecal specimens for the analysis of intra-familial transmission of Helicobacter pylori. J Med Microbiol. (2013) 62:761–5. doi: 10.1099/jmm.0.053140-0
41. Goodman, KJ, and Correa, P. Transmission of Helicobacter pylori among siblings. Lancet (London, England). (2000) 355:358–62. doi: 10.1016/S0140-6736(99)05273-3
42. Curtis, LJ. An economic perspective on the causal explanations for the socioeconomic inequalities in health. Rev Panam Salud Publica. (2018) 42:e53. doi: 10.26633/RPSP.2018.53
43. Seabrook, JA, and Avison, WR. Socioeconomic status and cumulative disadvantage processes across the life course: implications for health outcomes. Canadian Rev Sociol = Revue canadienne de sociologie. (2012) 49:50–68. doi: 10.1111/j.1755-618X.2011.01280.x
44. Evans, GW, and Kantrowitz, E. Socioeconomic status and health: the potential role of environmental risk exposure. Annu Rev Public Health. (2002) 23:303–31. doi: 10.1146/annurev.publhealth.23.112001.112349
45. Stebbins, RC, and Noppert, GA. Persistent socioeconomic and racial and ethnic disparities in pathogen burden in the United States, 1999-2014. Epidemiol Infect. (2019) 147:e301. doi: 10.1017/S0950268819001894
46. Tsang, SH, Avilés-Santa, ML, Abnet, CC, Brito, MO, Daviglus, ML, Wassertheil-Smoller, S, et al. Seroprevalence and determinants of Helicobacter pylori infection in the Hispanic community health study/study of Latinos. Clin Gastroenterol Hepatol: Official Clin Prac J American Gastroenterol Association. (2022) 20:e438–51. doi: 10.1016/j.cgh.2021.02.042
47. Meier, HCS, Haan, MN, Mendes de Leon, CF, Simanek, AM, Dowd, JB, and Aiello, AE. Early life socioeconomic position and immune response to persistent infections among elderly Latinos. Soc Sci Med. (1982) 166:77–85.
48. Wang, M, Liu, Y, Ma, Y, Li, Y, Sun, C, Cheng, Y, et al. Association between Cancer prevalence and different socioeconomic strata in the US: the National Health and nutrition examination survey, 1999-2018. Front Public Health. (2022) 10:873805. doi: 10.3389/fpubh.2022.873805
49. Shen, R, Zhao, N, Wang, J, Guo, P, Shen, S, Liu, D, et al. Association between socioeconomic status and arteriosclerotic cardiovascular disease risk and cause-specific and all-cause mortality: data from the 2005-2018 National Health and nutrition examination survey. Front Public Health. (2022) 10:1017271. doi: 10.3389/fpubh.2022.1017271
50. Minhas, AMK, Jain, V, Li, M, Ariss, RW, Fudim, M, Michos, ED, et al. Family income and cardiovascular disease risk in American adults. Sci Rep. (2023) 13:279. doi: 10.1038/s41598-023-27474-x
51. Zajacova, A, Dowd, JB, and Aiello, AE. Socioeconomic and race/ethnic patterns in persistent infection burden among U.S. adults. J Gerontol A Biol Sci Med Sci. (2009) 64A:272–9. doi: 10.1093/gerona/gln012
52. de Martel, C, Georges, D, Bray, F, Ferlay, J, and Clifford, GM. Global burden of cancer attributable to infections in 2018: a worldwide incidence analysis. Lancet Glob Health. (2020) 8:e180–90. doi: 10.1016/S2214-109X(19)30488-7
53. Collatuzzo, G, La Vecchia, C, Parazzini, F, Alicandro, G, Turati, F, Di Maso, M, et al. Cancers attributable to infectious agents in Italy. Eur J Cancer. (1990) 183:69–78.
54. Huang, H, Hu, XF, Zhao, FH, Garland, SM, Bhatla, N, and Qiao, YL. Estimation of Cancer burden attributable to infection in Asia. J Epidemiol. (2015) 25:626–38. doi: 10.2188/jea.JE20140215
55. Crimmins, EM, and Finch, CE. Infection, inflammation, height, and longevity. Proc Natl Acad Sci USA. (2006) 103:498–503. doi: 10.1073/pnas.0501470103
56. Islami, F, Goding Sauer, A, Miller, KD, Siegel, RL, Fedewa, SA, Jacobs, EJ, et al. Proportion and number of cancer cases and deaths attributable to potentially modifiable risk factors in the United States. CA Cancer J Clin. (2018) 68:31–54. doi: 10.3322/caac.21440
57. Candelli, M, Franza, L, and Cianci, R. The interplay between Helicobacter pylori and gut microbiota in non-gastrointestinal disorders: a special focus on atherosclerosis. Int J Mol Sci. (2023) 24:17520. doi: 10.3390/ijms242417520
58. Chen, Y, Segers, S, and Blaser, MJ. Association between Helicobacter pylori and mortality in the NHANES III study. Gut. (2013) 62:1262–9. doi: 10.1136/gutjnl-2012-303018
Keywords: family poverty to income ratio, socioeconomic status, Helicobacter pylori, mortality, NHANES
Citation: Jiang C, Zhu L, Yang W, Yu Z, Yang W, Jin X and Shao Y (2025) Evaluating the relationship between familial poverty, Helicobacter pylori seropositivity, and all-cause mortality in the general US population. Front. Public Health. 13:1578257. doi: 10.3389/fpubh.2025.1578257
Edited by:
Colm Antoine O. Morain, Trinity College Dublin, IrelandReviewed by:
Shilan Mozaffari, Tehran University of Medical Sciences, IranXianzhu Zhou, Second Military Medical University, China
Copyright © 2025 Jiang, Zhu, Yang, Yu, Yang, Jin and Shao. This is an open-access article distributed under the terms of the Creative Commons Attribution License (CC BY). The use, distribution or reproduction in other forums is permitted, provided the original author(s) and the copyright owner(s) are credited and that the original publication in this journal is cited, in accordance with accepted academic practice. No use, distribution or reproduction is permitted which does not comply with these terms.
*Correspondence: Yaojian Shao, c3lqXzExMDdAMTYzLmNvbQ==
†These authors have contributed equally to this work