 Lingyu Dai†
 Guannan Su
 Peizeng Yang
- Ophthalmology Medical Center, The First Affiliated Hospital of Chongqing Medical University, Chongqing Key Laboratory for the Prevention and Treatment of Major Blinding Eye Diseases, Chongqing Branch (Municipality Division) of National Clinical Research Centre for Ocular Diseases, Chongqing, China
Background: Heavy metals exposure has been widely referred to as a risk factor for human health. However, studies on the potential impact of heavy metals on visual disability are limited. Herein, this study aims to investigate the associations of urinary and blood heavy metals with visual disability in adults.
Methods: A total of 4,284 eligible participants in the 2013–2018 National Health and Nutrition Examination Survey (NHANES) were enrolled in our cross-sectional study. The urinary barium (Ba), cadmium (Cd), cesium (Cs), cobalt (Co), molybdenum (Mo), lead (Pb), antimony (Sb), thallium (Tl), tin (Sn), tungsten (Tu), and mercury (Hg) and blood Pb, Cd, and Hg were included for analysis. We used multivariate logistic regression, weighted quantile sum (WQS) regression, quantile-based gcomputation (qgcomp) regression, and Bayesian kernel machine regression (BKMR) to assess the mixed-metal effect on visual disability. The subgroup analysis was stratified by age.
Results: In the single metal exposure model, the risk of visual disability increased by 39.2%, 22.6%, 25.6%, and 17.9% for each unit increase in urinary Cd, Pb, Sn, and Tu, respectively (all p < 0.05). Meanwhile, the risk of visual disability increased by 40.6% and 22.7% per unit increase in blood Ln-Pb and Ln-Cd, respectively (p = 0.034 and 0.018). In mixed metal effect analysis, WQS, qgcomp, and BKMR models consistently demonstrated a positive association between blood and urine metal co-exposure and visual disability. Furthermore, we found that Cd and Pb were the top-weighted metals responsible for the overall effect. However, these associations were not pronounced in the older adults.
Conclusions: Our findings suggested that Cd, Pb, Sn, and Tu were identified as independent risk factors for visual disability. Furthermore, exposure to mixed metals could increase the risk of visual disability, to which Cd and Pb were the greatest contributors.
1 Introduction
Visual disability has been a long-standing and globally knotty public health issue, profoundly implicating individual, economic, and social life. Recently, the Vision Loss Expert Group (VLEG) of the Global Burden of Disease (GBD) Study reported approximately 43.3 million blindness and 295 million moderate to severe visual impairment population worldwide (1). The etiologies of irreversible vision loss are multifaceted and complex. It could not only be caused by ocular diseases such as glaucoma, cataracts, uveitis, diabetic retinopathy, and age-related macular degeneration (2, 3), but also by neurological disorders, systemic diseases, environmental intoxication, etc. (4, 5).
Heavy metals have infiltrated the environment and are ubiquitously present in our lives with the development of industrial technology and increasing serious pollution. Air, water, soil, food, and even dust are inevitably contaminated by heavy metals that are hazardous to human health. Several studies have indicated that exposure to heavy metals can lead to a variety of multi-system diseases, including ocular disorders, osteoarthritis, liver and renal dysfunction, cardiovascular diseases, rheumatoid arthritis, metabolic syndrome, tumors, neurodegenerative diseases, diabetes, etc. (6–13). Metals could enter the eye through oral route or direct contact with airborne ocular structures (e.g., tear film, cornea, conjunctiva) (14). Previous studies have revealed that long-term exposure to heavy metals can lead to various eye tissue damages, such as cell death in human lens epithelial cells and retinal pigment epithelial cells, retinal vascular dysfunction, and oxidative stress on retinal cells and neurons (15–18). Existing studies tended to focus on a single metallic effect on diseases that may amplify or disregard the co-exposure effects. However, a single metal cannot comprehensively illuminate the antagonistic or synergistic effects of multiple metals on human health due to the intricate multi-metal interactions in a realistic environment (19). To date, few epidemiological studies have evaluated the combined effects of multiple metal mixtures on visual disability.
Therefore, we conducted a cross-sectional study to investigate the single and mixed effects of 11 urinary metals and three blood metals on visual disability by using several regression models based on the National Health and Nutrition Examination Survey (NHANES) 2013-2018 in the U.S. population. This study provides novel epidemiological evidence on the associations between heavy metal exposures and visual disability. It may have a potential impact on mitigating preventable environmental risks and promoting ocular health.
2 Methods
2.1 Study design and enrollment
NHANES is a national and cross-sectional survey aimed to assess the health and nutritional condition of the general population in the U.S. In this study, data were derived from 2013–2014, 2015–2016, and 2017–2018 NHANES. Figure 1 shows that 29,400 participants were screened. We excluded 1,168 subjects with unavailable visual disability data and 23,984 subjects with any missing data on urinary metals, blood metals, and covariates. A total of 4,284 eligible subjects were enrolled, including 4,000 with non-visual disability and 248 with visual disability. The programs in NHANES were all approved by the National Center for Health Statistics (NCHS) Ethic Review Board and all written informed consents were provided by participants before enrollment.
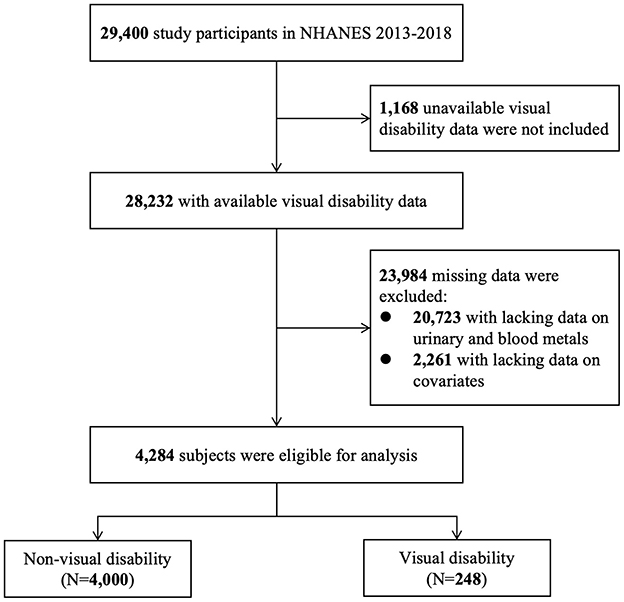
Figure 1. Flow diagram of enrollment and analysis populations.
2.2 Assessment of vision disability
Visual disability is defined as a best-corrected visual acuity of < 3/60 or < 10° visual field around central fixation in the better eye (3). In this study, it was diagnosed by the disability questionnaire asked in the home by trained interviewers using the Computer-Assisted Personal Interview (CAPI) system. They were asked: “Are you blind?” or “Do you have serious difficulty seeing even when wearing glasses?” The participants who answered “Yes” were regarded as having a visual disability. However, those who answered “no” were considered to have a non-visual disability.
2.3 Metals measurement
The urinary barium (Ba), cadmium (Cd), cesium (Cs), cobalt (Co), molybdenum (Mo), lead (Pb), antimony (Sb), thallium (Tl), tin (Sn), tungsten (Tu), and mercury (Hg) and blood Pb, Cd, and Hg were measured by inductively coupled plasma mass spectrometry (ICP-MS). The ICP-MS method is a multi-element analytical technique capable of trace-level elemental analysis. The liquid samples were converted to an argon aerosol through ICP-MS and entered the mass spectrometer after atomization and ionization in a plasma field. The ions then passed through a focusing region, dynamic reaction cell, and the quadrupole mass filter. Finally, the ion detection signal was processed into digital data to quantify the concentration of the metallic elements (20). According to the NHANES standard, the metal concentration lower limit of detection was divided by the square root of two. Meanwhile, the concentrations of urinary metals were adjusted by urinary creatinine and calculated as μg/g creatinine.
2.4 Covariates
Covariates included gender, age at interview (20–59 years old, ≥60 years old), race/ethnicity (Mexican American, Other Hispanic, Non-Hispanic White, Non-Hispanic black, and Other Race/multiracial), educational level (below high school, high school or equivalent, and above high school), marital status (married/living with partner, widowed/divorced/separated, and never married), body mass index (BMI) (< 25, 25–29.9, ≥30 kg/m2), family income to poverty (PIR), serum cotinine, and NHANES cycles. Serum cotinine concentrations identifying exposure to tobacco smoke were categorized into active/secondhand smokers and nonsmokers with a cutoff of 0.11 ng/mL (21).
2.5 Statistical analysis
All statistical analyses were performed by STATA (version 17.0) and R (version 4.3.1). Chi-square and Mann-Whitney U tests were used to assess the basic demographic characteristics of participants. The concentrations of heavy metals (continuous variables) were Ln-transformed to obtain similarly normal distributions, and divided into four quartiles (Q1, Q2, Q3, and Q4) as categorical variables. Pearson correlation analysis was used to evaluate the correlation of Ln-transformed heavy metal concentrations in urine and blood, in which the coefficients above 0.3 were considered to be correlating. We applied multivariable logistic regression to calculate odds ratios (ORs) and 95% confidence intervals (CIs) to estimate the effects of different metals on visual disability.
The Weight quantile sum (WQS) regression was carried out to explore the total mixture effect of multi-metals on visual disability and reveal the predominant exposure. R package (gWQS) can calculate the WQS index comprised of the weighted sums of specific metal concentrations. The WQS index, with a range of 0 to 1, reflects the contribution of each metal to the co-exposure effect in urine or blood. We randomly divided data into training and validation sets, respectively accounting for 40% and 60%. The training dataset underwent 1,000 iterations of bootstrap to estimate the weight of each metal, while the validation dataset was utilized to assess the significance of the WQS index.
The BKMR model was used to address the non-linearity and non-additive dose-response correlations among multi-variables exposure. Posterior inclusion probability (PTP) was used to assess the contribution of each component to the outcomes, with a value >0.5 being deemed significant. The overall effect plot illustrates the combined effect of all metals at a specific percentile as compared to when all of them are at their 50th percentile. The single exposure-response plots demonstrate the impact of a single metal on the outcome at different quartiles when the remaining elements are fixed at the 25th, 50th, and 75th percentiles. Binary exposure-response curves reflect the relationship of two exposures. It refers to the potential interaction between the 25th, 50th, and 75th percentiles of one metal and another when the remaining variables are fixed at the median. The iteration in the BKMR model was set at 25,000 and run by “bkmr” package in R software.
Sensitivity analysis and subgroup analysis were performed to robust the estimations of models. The quantile-based g computation (qgcomp) model was used to overcome the restriction of the WQS model that estimates outcome-related exposures in the same direction. Qgcomp regression allowing heterogeneous directions was used to calculate the positive and negative weights of each index of the mixtures by R package “qgcomp”. Furthermore, subgroup analysis was conducted stratified by age to adjust model bias. All models were corrected by gender, age, race/ethnicity, educational level, marital status, BMI, PIR, serum cotinine, and NHANES cycles.
3 Result
3.1 Population characteristics, heavy metals distributions, and correlations
Among the 4,284 participants in the 2013–2018 NHANES, 284 (6.63%) had a visual disability. Table 1 summarizes the demographic characteristics of participants among U.S. adults. There were statistically significant differences between non-visual disability and visual disability subjects in age, race/ethnicity, education level, marital status, family PIR, and serum cotinine (p < 0.05). However, the two groups had a comparable gender and BMI.
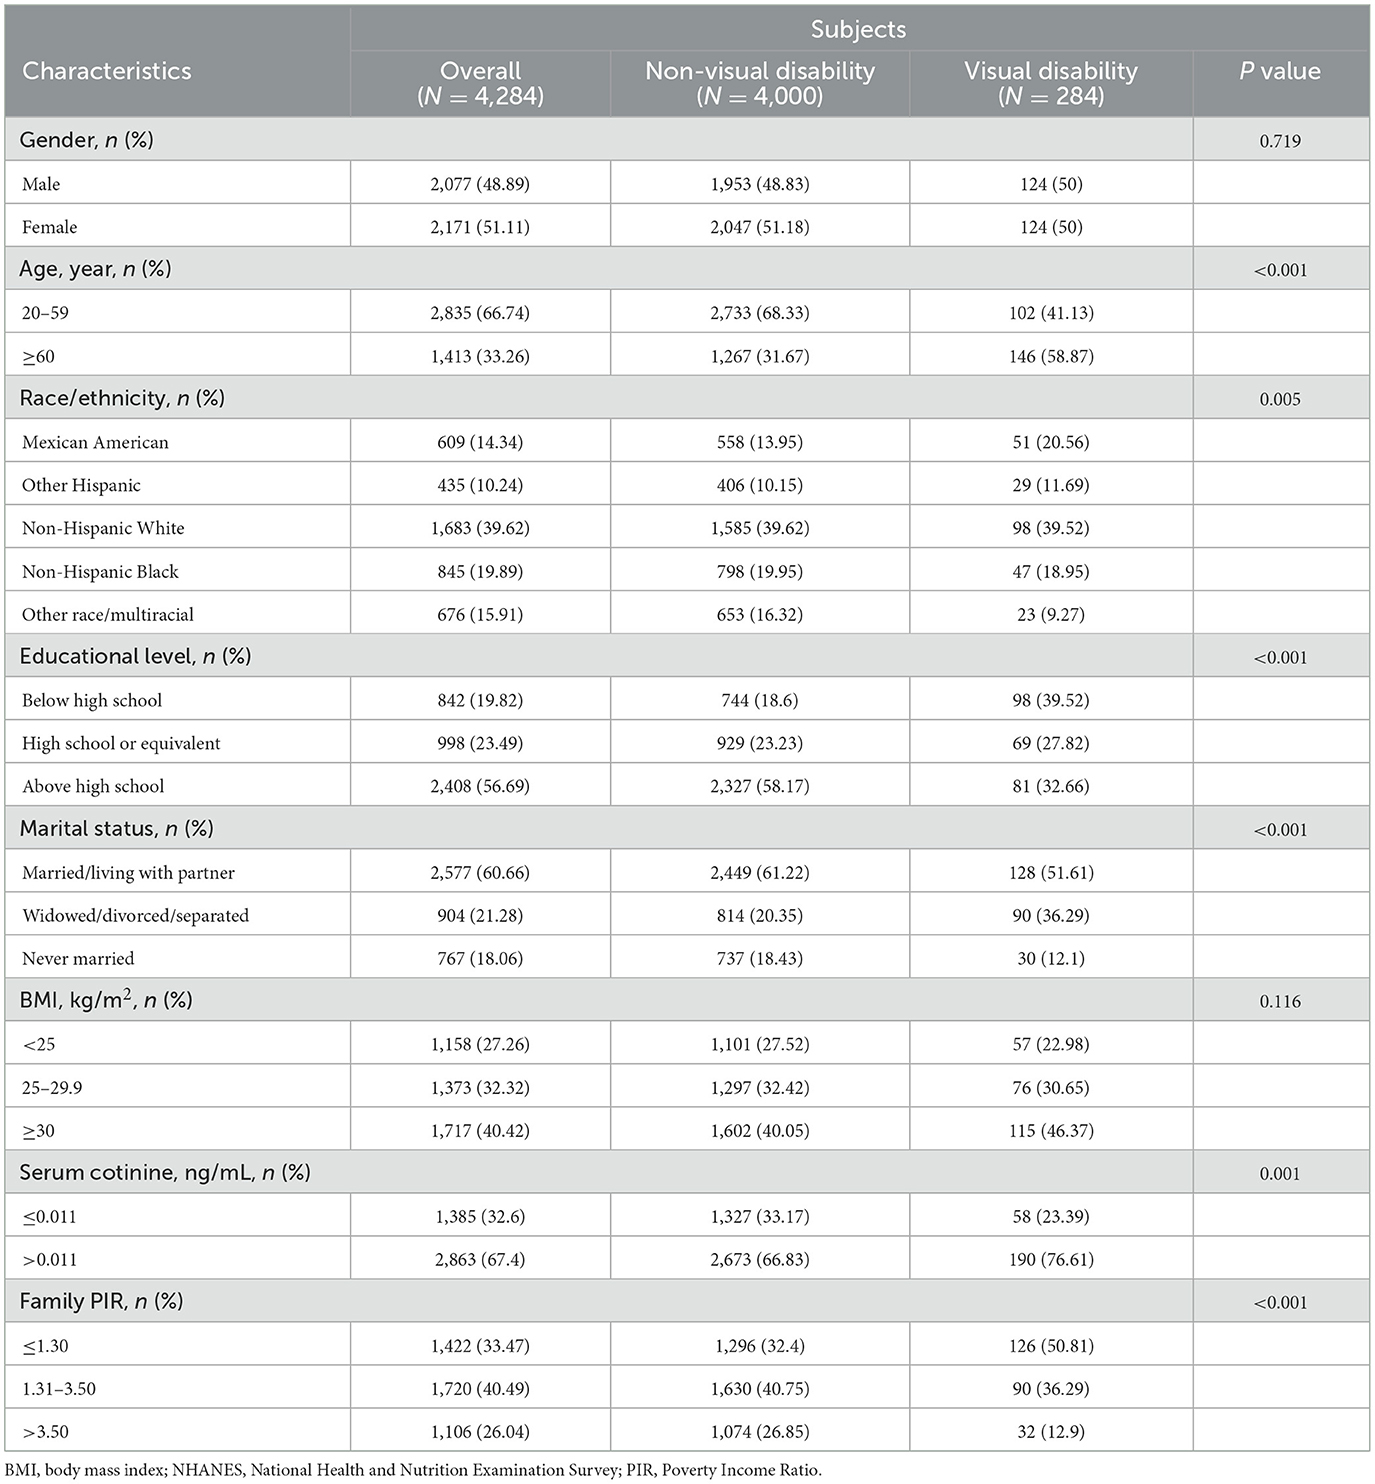
Table 1. Basic characteristics of subjects by visual disability among U.S. adults in the NHANES 2013–2018.
3.2 Distribution and correlations of urinary and blood metals
The distributions of urinary and blood metal concentrations are presented in Supplementary Table S1. The detection rates of urinary and blood metal concentrations were above 80.0% except for Hg in urine. Pearson's correlation matrix displayed the correlation between these Ln-transformed metals (Supplementary Figure S1). In urine, there was a positive correlation between Ba and Co (r = 0.46), Cd and Pb (r = 0.42), Co and Cs (r = 0.39), Co and Tl (r = 0.33), Cs and Pb (r = 0.34), Cs and Tl (r = 0.63), Mo and Tu (0.40). A mild correlation was found between blood Pb and blood Cd (r = 0.33). The correlations of others were comparatively weak.
3.4 The association of single metals with visual disability disclosed by multivariate logistic regression
Table 2 shows the multivariate logistic regression outcomes adjusted by all covariates. For each unit increase in urinary Ln-Cd, Ln-Pb, Ln-Sn, and Ln-Tu, there was a 39.2%, 22.6%, 25.6%, and 17.9% increase in the risk of visual disability, respectively (all p < 0.05). For the highest exposure level (Q4), the concentrations of urinary Cd, Co, Pb, and Sn significantly increased visual disability risk as compared to the lowest level (Q1) (Cd: OR = 2.032, 95%CI: 1.280–3.228; Co: OR = 1.558, 95%CI: 1.028–2.362; Pb: OR = 1.708, 95%CI: 1.109–2.632; Sn: OR = 3.047, 95%CI: 1.446–6.418). Urinary Cd and Sn of the Q3 level were also found to significantly increase the risk of visual disability as compared to that of the Q1 level (Cd: OR = 1.638, 95%CI: 1.038–2.584; Sn: OR = 2.447, 95%CI: 1.164–5.143). The risk of visual disability rose by 40.6% and 22.7% per unit increase in blood Ln–Pb and Ln–Cd, respectively (p = 0.034 and 0.018). The blood Pb of the Q4 level had a greater impact on visual disability compared to the Q1 level (OR = 1.580, 95% CI:1.014–2.462). Moreover, blood Cd in the Q3 and Q4 levels both significantly increased visual disability risk compared to that in the Q1 level (Q3: OR = 1.707,95%CI:1.136–2.565; Q4: OR = 1.568, 95%CI:1.026–2.398).
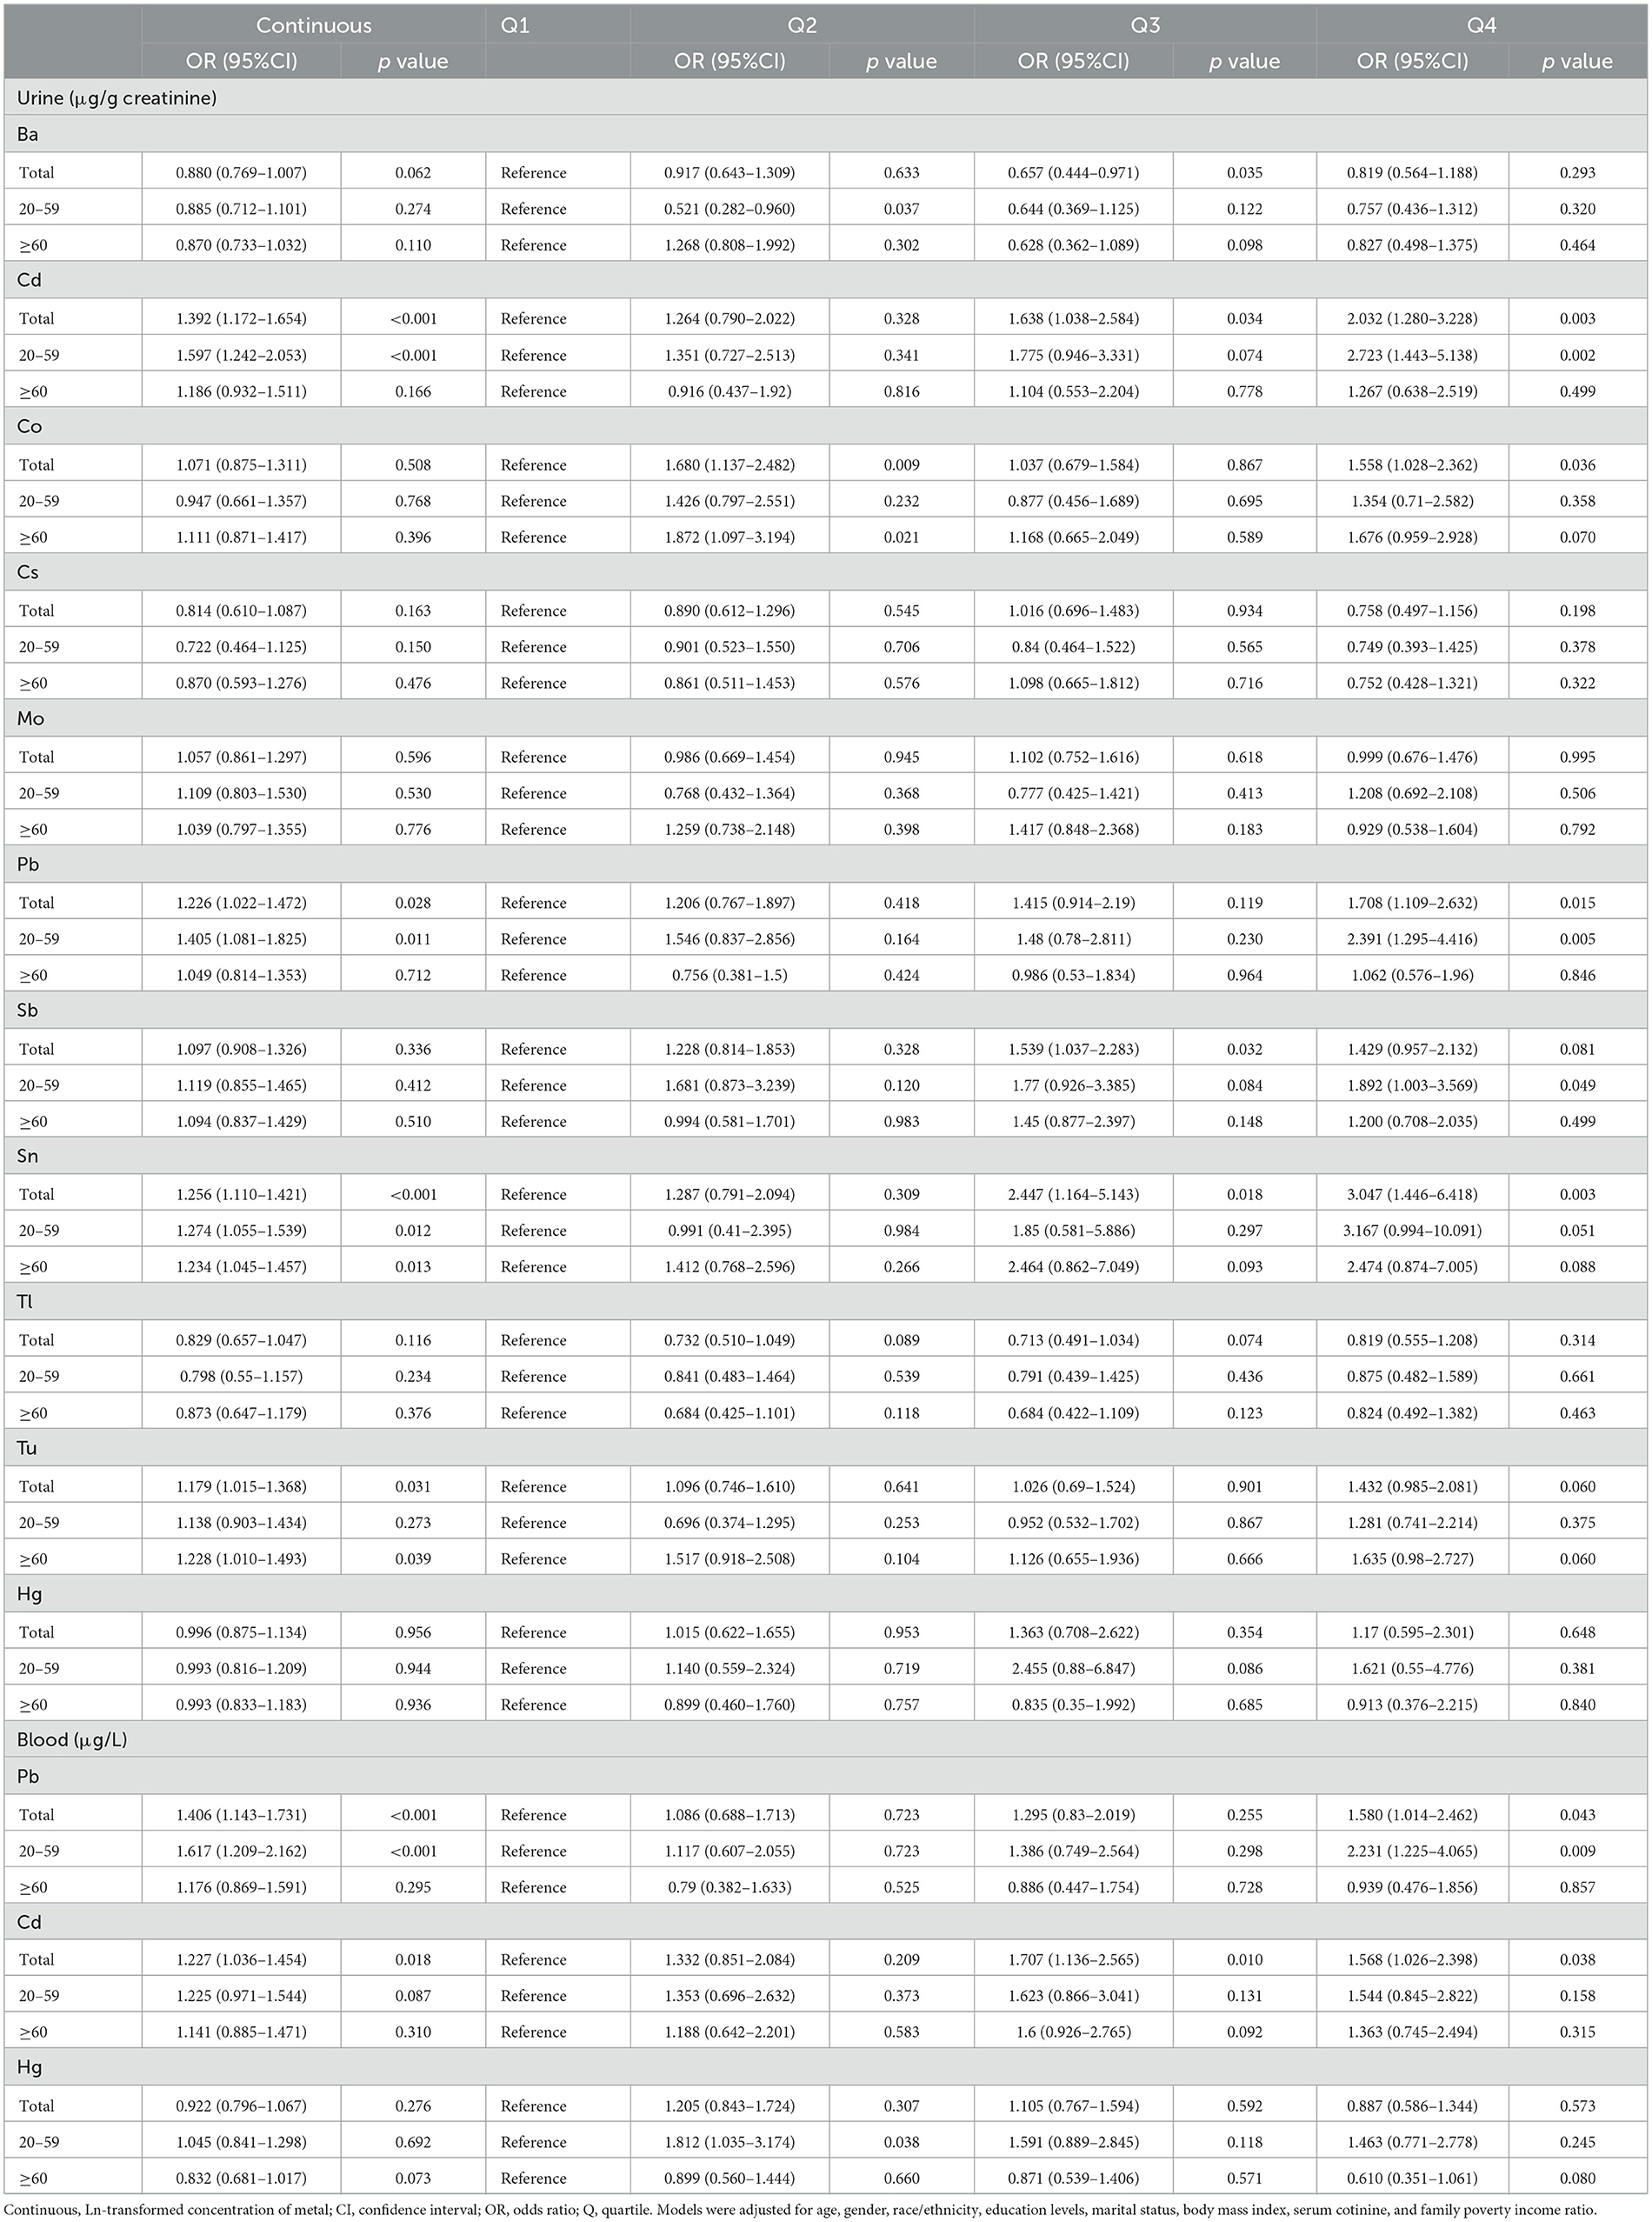
Table 2. Associations of single urinary and blood metals with visual disability in the NHANES 2013–2018.
In the 20–59 age group, an increase in urinary Ln–Cd, Ln–Pb, Ln–Sn, and blood Ln–Pb per unit enhanced the risk of visual disability by 59.7%, 40.5%, 27.4%, and 61.7%, respectively (all p < 0.05). Compared to the Q1 level, urinary Cd, Pb, and blood Pb of Q4 level significantly improved visual disability risk (Urinary Cd: OR = 2.723,95% CI: 1.443–5.138; Urinary Pb: OR = 2.391, 95%CI: 1.295–4.416; Blood Pb: OR = 2.231, 95%CI:1.225–4.065). Among individuals aged 60 and above, there was a notable positive association between urinary Sn and Tu with visual disability (Sn: OR = 1.234, 95%CI: 1.045–1.457; Tu: OR = 1.228, 95%CI: 1.01–1.493). No significant correlations between other metals and visual disability were found.
3.5 The mixed effect of multiple metals on visual disability disclosed by WQS and qgcomp regression model
The WQS model corrected by all covariates showed a substantial association of per–unit increase in urinary and blood metal co–exposure with the risk of visual disability for the total population (Urine: OR = 1.412, 95%CI: 1.035–1.927; Blood: OR = 1.281, 95%CI: 1.022–1.606) (Figure 2A). In the subgroup analysis, the positive effects of urinary and blood metal co–exposure on visual disability were more pronounced in the 20–59 age group (Urine: OR = 2.662, 95%CI: 1.450–4.887; Blood: OR = 1.503, 95%CI: 1.097–2.059), but not statistically significant in the ≥60 age group (Urine: OR = 1.005, 95%CI: 0.627–1.612; Blood: OR = 1.041, 95%CI: 0.838–1.303). Supplementary Figure S2 displays the WQS index of each metal. Cd accounted for the heaviest weight in the urine and blood metal mixtures for all groups, except for blood Pb, which was the top–weighted metal in the blood metal mixture for the 20–59 age group.
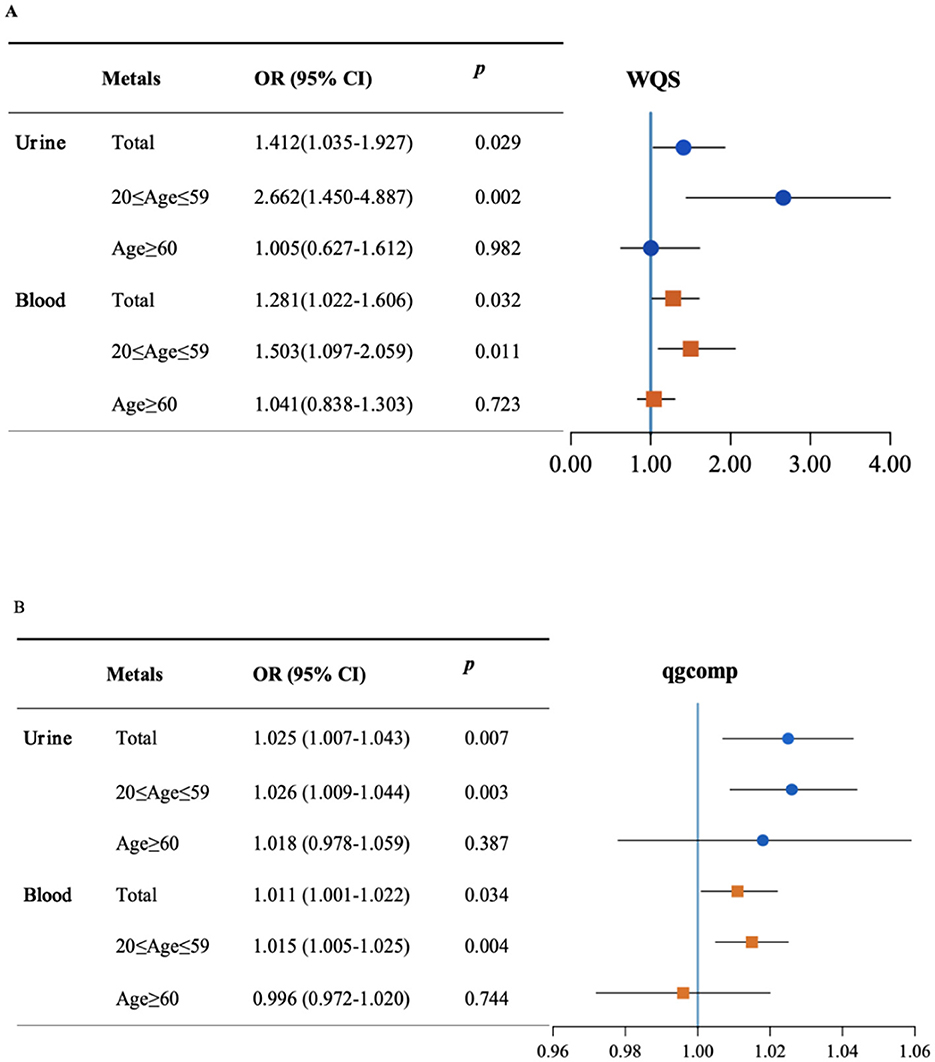
Figure 2. The mixed effect of metals on visual disability and stratified by age. Weight quantile sum (WQS) model (A) and quantile-based g computation (qgcomp) model (B) were adjusted for age, gender, race/ethnicity, education levels, poverty income ratio, marital status, body mass index, serum cotinine, and NHANES cycles.
In the sensitivity analysis, Figure 2B shows the qgcomp model outcome adjusted by all confounders. The effect of urinary metal co–exposure was still significantly associated with the risk of visual disability in the total population (OR = 1.025, 95%CI: 1.007–1.043) as well as in the 20–59 age group (OR = 1.026, 95%CI: 1.009–1.044). However, the overall effect was not significant in the ≥60 age group (OR = 1.018, 95%CI: 0.978–1.059). The correlations between blood metals and visual disability risk were also significant in the total population and the 20–59 age group (OR = 1.011, 95%CI: 1.001–1.022; OR = 1.015, 95%CI: 1.005–1.025, respectively), whereas not statistically significant in individuals aged 60 and above (OR = 0.996, 95%CI: 0.972–1.02). The positive and negative directions of the estimated exposure weights are presented in Supplementary Figure S3, in which Cd and Pb were the main positive contributors to mixed exposure in urine and blood. However, Ba was the negative top–weighted metal in urine metal exposure and Hg was the negative highest–weighted metal in blood mixtures.
3.6 The associations of mixed metals exposure and visual disability disclosed by BKMR regression model
The effect of urinary and blood metals on visual disability estimated by BKMR regression is displayed in Figure 3. When the concentrations of metals were at or above the 55th percentile, the urinary and blood co-exposure effects both significantly increased the risk of visual disability as compared to the 50th percentile. Significantly similar upward trend effects were observed in the 20–59 age group, but not found in the ≥60 age group. Supplementary Table S2 shows that the Cd, Cs, Pb, Sn, and Tu in urine and Pb and Cd in blood had a PIP value greater than 0.5 in the total population. We also found that the PTP values of urinary Cd, blood Pb, and blood Cd were above 0.5 in the 20-59 age group, whereas no PIP value above 0.5 was found in the ≥60 age group. Furthermore, when other metals respectively fixed at the 25th, 50th, and 75th percentile, urinary Hg, Sn, Cd and blood Cd, Pb showed notable effects on visual disability in the total population.
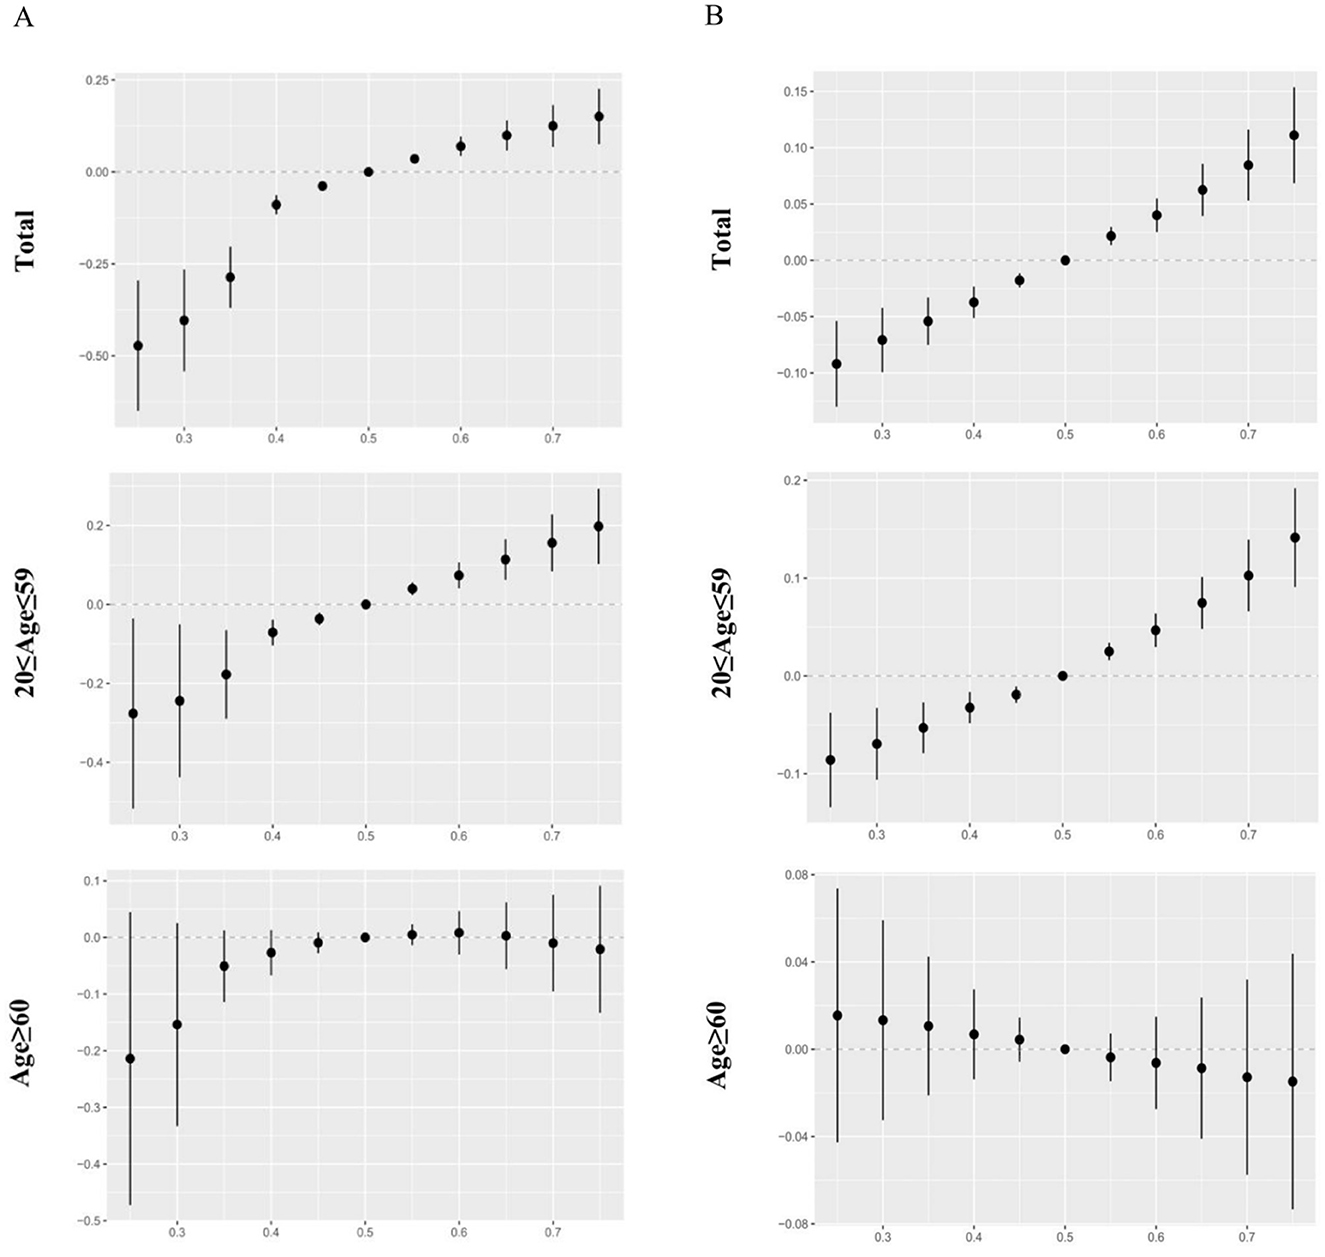
Figure 3. The overall effects of urinary and blood metal mixtures on visual disability were estimated by Bayesian Kernel Machine Regression (BKMR) models when all the metals at particular percentiles were compared to those at their 50th percentile. Models were adjusted for age, gender, race/ethnicity, education levels, poverty income ratio, marital status, body mass index, serum cotinine, and NHANES cycles. (A) Mixed effects of urinary metals. (B) Mixed effects of blood metals.
In the 20–59 age participants, urinary Cd and blood Pb were found to be positively correlated with visual disability when other metals were fixed at the 25th, 50th, and 75th percentile. Additionally, blood Cd significantly affected visual disability whenever other metals were fixed at the 50th and 75th percentile. However, no significant exposure was found in the older adults group (Figure 4). When the concentrations of other metals were fixed at the median, the single concentration-response plots (Supplementary Figure S4) demonstrated a gradual increase in the advancement of visual disability caused by urinary Cd and blood Pb. Supplementary Figure S5 indicates that there may be underlying interactions between several metals in visual disability, such as urinary Cd and Co, Pb, Sn, urinary Hg and Tl, Tu, blood Pb and Cd, Hg.
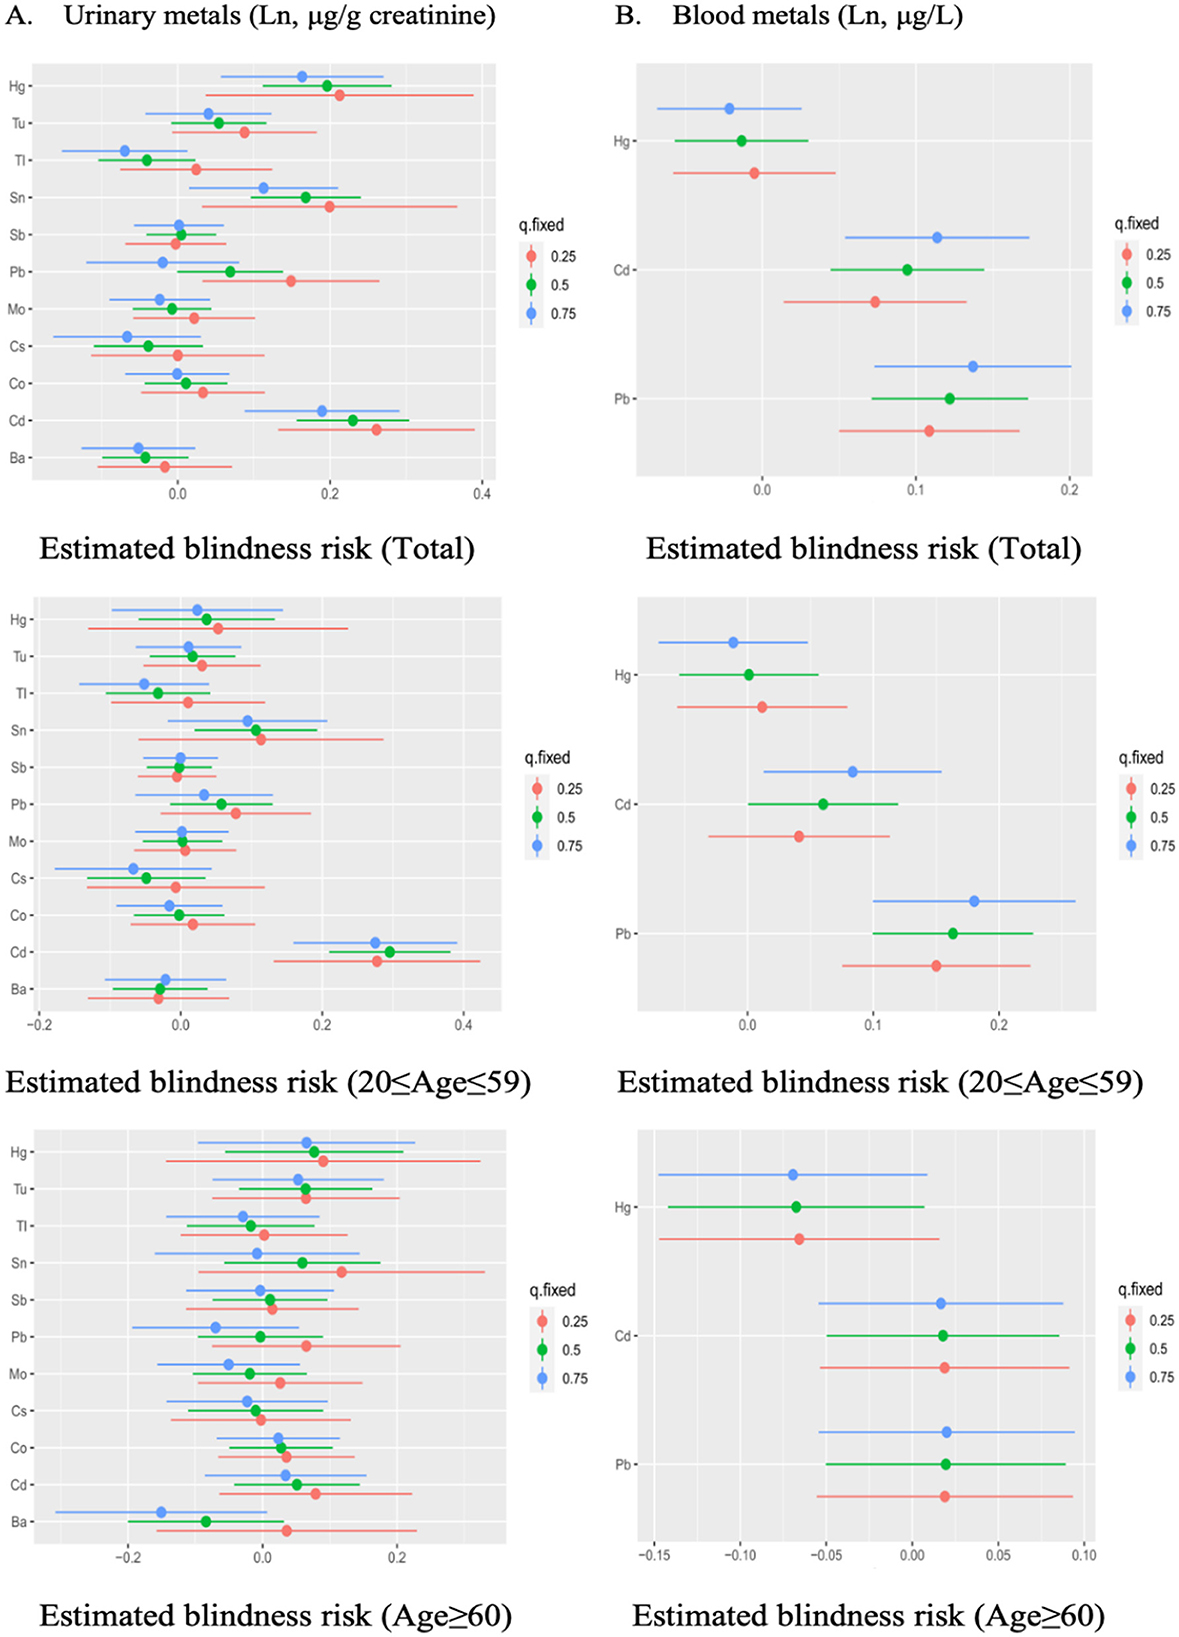
Figure 4. The estimated effect of single urinary (A) and blood (B) metals on visual disability in BKMR regression models, when other all metals were held at their corresponding 25th (red), 50th (green), or 75th (blue) percentile, respectively. Models were adjusted for gender, age, race/ethnicity, education levels, poverty income ratio, marital status, body mass index, serum cotinine, and NHANES cycles.
4 Discussion
To our knowledge, it is the first study to investigate the possible correlation of multiple urinary and blood metals on visual disability in the U.S. population. For the single metal exposure logistic regression models, urinary Cd, Pb, Sn, and Tu as well as blood Pb and Cd were found to significantly increase the risk of visual disability. For the mixed metal exposure analysis, WQS, qgcomp, and BKMR regression models consistently showed a positive correlation between the mixed effect of urinary and blood metals and visual disability. Cd and Pb were identified as the highest-weighted metals in the mixed effect of metals. Moreover, the combined metal effects were only found in the young and middle age group, but not in the older adults group.
Previous studies have revealed that the accumulation levels of toxic heavy metals in the RPE, choroid, iris, and ciliary body were higher than those in the blood, suggesting that these eye tissues have a strong affinity for metal ions (22, 23). Cd and Pb have been listed as some of the 10 most hazardous heavy metals (24). Cd has been widely distributed in atmosphere, drinking water, smoking, food, soil, and industrial products. The biological half-life of Cd in human organs is up to 10–30 years with a high residence and low clearance (25). In this study, we found that increased urinary and blood Cd were both associated with the risk of visual disability, and this result is consistent with previous studies, in which exposure to Cd could lead to blind-causing diseases such as glaucoma, cataracts, optic neuritis, and age-related macular degeneration, eventually seriously threatening visual acuity (26–28). Pieces of evidence further supported our results, Cd has the potential to damage human retinal pigment epithelium (RPE) cells, photoreceptors, and optic nerve by generating reactive oxygen species, inducing oxidative stress and endoplasmic reticulum stress, producing inflammatory cytokines, and damaging vascular system (29–32). It is worthwhile to point out that these mechanism studies were based on exposure models with high Cd concentrations (e.g., cellular experiments: 10–100 μM; animal experiments: 1–5 mg/kg), which far exceed the actual exposure levels of the visual disability population in NHANES [median blood Cd: 0.41 (0.23-0.71) μg/L, median urinary Cd: 0.31 (0.15–0.58) μg/g creatinine]. Although the exposure doses were different, the pathogenic pathways identified in these studies have been shown to have a cumulative effect at low doses of long-term Cd exposure (33), which provided biological plausibility for our observational associations. Furthermore, we also found that Pb was a risk factor for visual disability, which has widely existed in batteries, gasoline, paints, and various industrial processes. Individuals with long-term exposure to Pb had lower macular, choroidal, and retinal nerve fiber thicknesses as compared to healthy controls (34). Pb not only tightly binds with sulfhydryl and decreases glutathione by inhibiting the activity of antioxidant enzymes (35), but also competitively inhibits the calcium channels into neurons and retina and impairs nervous transmission (36). Numerous shreds of evidence also proved that accumulation of Pb on the optic nerve and retina could cause optic neuropathy and retinopathy, eventually leading to vision loss (37–39). In addition to Cd and Pb, urinary Sn and Tu were found to increase the risk of visual disability in our study. Sn and Tu, as industrial and environmental toxicants, were known to cause pulmonary inflammation, cardiometabolic dysfunction, neurological disorders, and autoimmune disease (40, 41). Tu can often augment the effects of other co-exposures or co-stressors, potentially resulting in greater toxicity or more severe diseases (42). However, experimental research on the links of these metals to vision dysfunction is less conducted.
Humans are concurrently exposed to multiple metals and diseases are caused by synergistic and antagonistic interactions of metals. Previous studies on the association between mixed metal effects and vision are comparatively small. An animal experiment discovered that Cd and Pb exposure could significantly damage vision, but their combined exposure caused an opposite effect (43). Our findings extend the knowledge about the impact of co-exposure metals on visual disability. The WQS model estimating in the same direction found that the mixed metal effect significantly increased the risk of visual disability. The outcomes of qgcomp model without restriction on the direction were comparable to the results of WQS regression, which further ensured the reliability of our outcomes. The nonlinear and non-additive relationship between metals disclosed by the BKMR model further implied that the mixed effect had a dose-response association with the risk of visual disability. These three models all revealed that Cd and Pb were primarily responsible for the overall co-exposure effect. Interestingly, in the subgroup analysis, a significant association between the overall effect of urinary or blood metals and visual disability was only found in the 20–59 age group, but not in the older adults group. A potential explanation is that young and middle-aged people are more exposed to various toxic metals, such as smoking, burning materials, batteries, mining, and industrial activity.
The toxic effect of metals on visual disability has remained poorly understood, but oxidative stress, DNA damage, and lipid peroxidation are generally regarded as important factors in driving vision loss (44–46). Furthermore, recent studies have suggested that metals could induce the generation of pro-inflammatory cytokines, including TNF-α, IL-1β, IL-6, IL-10, and IL-12 (47, 48). These mechanisms of metals may be involved in the processes of blind-causing diseases (49–52). Nevertheless, the elucidation of underlying mechanisms of metal interactions on the pathogenesis of vision loss deserves further research.
This study conducted several novel statistical models to assess the possible associations between heavy metals and visual disability, which robustly made our conclusions more reliable. Moreover, the study was carried out in a relatively large population and all data were subject to strict quality control measures of NHANES. However, there were also some inevitable limitations. Firstly, due to the design of a cross-sectional study, the associations between heavy metals and visual disability found in this study were a potential epidemiological link. It could not reflect a temporal causal relationship between metal exposure and the risk of vision loss. These findings should be further confirmed in depth by longitudinal studies and laboratory studies. Secondly, although some covariates were corrected, there are still uncontrollable and residual confounders, and the results may also be affected. In addition, due to the lack of related genetic data in the NHANES database, genetic factors (e.g. a family history of visual disability and genetic factors leading to blinding ocular diseases) were not included in our analysis. Therefore, future studies could focus on integrating genetics data and environmental exposomics to assess the effect of genetic predisposition on the associations between heavy metals and visual disability. Thirdly, each urinary and blood sample was only measured one time, which may cause measurement errors due to individual differences in metabolite excretion and half-life of each metal.
5 Conclusion
Our findings demonstrated that Cd, Pb, Sn, and Tu in urine, as well as Pb and Cd in blood, were significantly associated with an increased risk of visual disability. Furthermore, the mixed metal effect analysis indicated a positive association between metal mixture exposure and visual disability, in which Cd and Pb were the dominant positive contributors. However, due to the limitations of this study, future prospective cohort studies with longitudinal heavy metal monitoring and clinical validation are needed to further confirm these associations.
Data availability statement
The original contributions presented in the study are included in the article/Supplementary material, further inquiries can be directed to the corresponding author.
Ethics statement
The studies involving humans were approved by the National Center for Health Statistics (NCHS) Ethic Review Board. The studies were conducted in accordance with the local legislation and institutional requirements. Written informed consent for participation in this study was provided by the participants' legal guardians/next of kin.
Author contributions
LD: Conceptualization, Data curation, Formal analysis, Methodology, Project administration, Validation, Writing – original draft, Writing – review & editing. QZ: Data curation, Validation, Writing – review & editing. YG: Data curation, Writing – review & editing. GS: Data curation, Writing – review & editing. QJ: Data curation, Writing – review & editing. LX: Data curation, Writing – review & editing. PY: Conceptualization, Funding acquisition, Supervision, Writing – review & editing.
Funding
The author(s) declare that financial support was received for the research and/or publication of this article. The work was supported by Chongqing Outstanding Science Project (2019), Chongqing Key Laboratory of Ophthalmology (CSTC, 2008CA5003), Chongqing Science & Technology Platform and Base Construction Program (cstc2014pt-sy10002), and Key Project of Chongqing Science and Technology Bureau (CSTC2021jscx-gksb-N0010).
Acknowledgments
All authors thank NHANES for its open-access data.
Conflict of interest
The authors declare that the research was conducted in the absence of any commercial or financial relationships that could be construed as a potential conflict of interest.
Generative AI statement
The author(s) declare that no Gen AI was used in the creation of this manuscript.
Publisher's note
All claims expressed in this article are solely those of the authors and do not necessarily represent those of their affiliated organizations, or those of the publisher, the editors and the reviewers. Any product that may be evaluated in this article, or claim that may be made by its manufacturer, is not guaranteed or endorsed by the publisher.
Supplementary material
The Supplementary Material for this article can be found online at: https://www.frontiersin.org/articles/10.3389/fpubh.2025.1583105/full#supplementary-material
References
1. GBD 2019 Blindness and Vision Impairment Collaborators. Trends in prevalence of blindness and distance and near vision impairment over 30 years: an analysis for the Global Burden of Disease Study. Lancet Glob Health. (2021) 9:e130–43. doi: 10.1016/S2214-109X(20)30489-7
2. Burton MJ, Ramke J, Marques AP, Bourne RRA, Congdon N, Jones I, et al. The Lancet Global Health Commission on Global Eye Health: vision beyond 2020. Lancet Glob Health. (2021) 9:e489–551. doi: 10.25259/IHOPEJO_15_2021
3. Pascolini D, Mariotti SP. Global estimates of visual impairment: 2010. Br J Ophthalmol. (2012) 96:614–8. doi: 10.1136/bjophthalmol-2011-300539
4. Mulak M, Misiuk-Hojło M, Markuszewski B, Dembska K. Influence of chronic exposure to heavy metals on eyesight. Klin Oczna. (2008) 110:176–82.
5. Yang X, Chen H, Zhang T, Yin X, Man J, He Q, et al. Global, regional, and national burden of blindness and vision loss due to common eye diseases along with its attributable risk factors from 1990 to 2019: a systematic analysis from the global burden of disease study 2019. Aging. (2021) 13:19614–42. doi: 10.18632/aging.203374
6. Li W, Huang G, Tang N, Lu P, Jiang L, Lv J, et al. Effects of heavy metal exposure on hypertension: A machine learning modeling approach. Chemosphere. (2023) 337:139435. doi: 10.1016/j.chemosphere.2023.139435
7. He Z, Shen P, Feng L, Hao H, He Y, Fan G, et al. Cadmium induces liver dysfunction and ferroptosis through the endoplasmic stress-ferritinophagy axis. Ecotoxicol Environ Saf. (2022) 245:114123. doi: 10.1016/j.ecoenv.2022.114123
8. Kazmierczak K, Malukiewicz G, Lesiewska-Junk H, Laudencka A, Szady-Grad M, Klawe J, et al. Blood plasma levels of microelements in patients with history of optic neuritis. Curr Eye Res. (2014) 39:93–8. doi: 10.3109/02713683.2013.833244
9. Zhou J, Meng X, Deng L, Liu N. Non-linear associations between metabolic syndrome and four typical heavy metals: Data from NHANES 2011-2018. Chemosphere. (2022) 291:132953. doi: 10.1016/j.chemosphere.2021.132953
10. Chen L, Zhao Y, Liu F, Chen H, Tan T, Yao P, et al. Biological aging mediates the associations between urinary metals and osteoarthritis among U. S. adults. BMC Med. (2022) 20:207. doi: 10.1186/s12916-022-02403-3
11. Lim JT, Tan YQ, Valeri L, Lee J, Geok PP, Chia SE, et al. Association between serum heavy metals and prostate cancer risk - A multiple metal analysis. Environ Int. (2019) 132:105109. doi: 10.1016/j.envint.2019.105109
12. Sanders AP, Mazzella MJ, Malin AJ, Hair GM, Busgang SA, Saland JM, et al. Combined exposure to lead, cadmium, mercury, and arsenic and kidney health in adolescents age 12-19 in NHANES 2009-2014. Environ Int. (2019) 131:104993. doi: 10.1016/j.envint.2019.104993
13. Kalariya NM, Nair B, Kalariya DK, Wills NK, van Kuijk FJ. Cadmium-induced induction of cell death in human lens epithelial cells: implications to smoking associated cataractogenesis. Toxicol Lett. (2010) 198:56–62. doi: 10.1016/j.toxlet.2010.04.021
14. Saxena R, Srivastava S, Trivedi D, Anand E, Joshi S, Gupta SK. Impact of environmental pollution on the eye. Acta Ophthalmol Scand. (2003) 81:491–4. doi: 10.1034/j.1600-0420.2003.00119.x
15. Kalariya NM, Wills NK, Ramana KV, Srivastava SK, van Kuijk FJ. Cadmium-induced apoptotic death of human retinal pigment epithelial cells is mediated by MAPK pathway. Exp Eye Res. (2009) 89:494–502. doi: 10.1016/j.exer.2009.05.011
16. Prozialeck WC, Edwards JR, Woods JM. The vascular endothelium as a target of cadmium toxicity. Life Sci. (2006) 79:1493–506. doi: 10.1016/j.lfs.2006.05.007
17. Schaumberg DA, Mendes F, Balaram M, Dana MR, Sparrow D, Hu H. Accumulated lead exposure and risk of age-related cataract in men. JAMA. (2004) 292:2750–4. doi: 10.1001/jama.292.22.2750
18. Yuki K, Dogru M, Imamura Y, Kimura I, Ohtake Y, Tsubota K. Lead accumulation as possible risk factor for primary open-angle glaucoma. Biol Trace Elem Res. (2009) 132:1–8. doi: 10.1007/s12011-009-8376-z
19. Sasso AF, Isukapalli SS, Georgopoulos PG, A. generalized physiologically-based toxicokinetic modeling system for chemical mixtures containing metals. Theor Biol Med Model. (2010) 7:17. doi: 10.1186/1742-4682-7-17
20. McQuillan GM, McLean JE, Chiappa M, Corporation H, Lukacs SL. National health and nutrition examination survey biospecimen program: NHANES III (1988-1994) and NHANES 1999-2014. Vital Health Stat 2. (2015) 170:1–14.
21. Xu C, Liang J, Xu S, Liu Q, Xu J, Gu A. Increased serum levels of aldehydes are associated with cardiovascular disease and cardiovascular risk factors in adults. J Hazard Mater. (2020) 400:123134. doi: 10.1016/j.jhazmat.2020.123134
22. Potts AM, Au PC. The affinity of melanin for inorganic ions. Exp Eye Res. (1976) 22:487–91. doi: 10.1016/0014-4835(76)90186-X
23. Erie JC, Butz JA, Good JA, Erie EA, Burritt MF, Cameron JD. Heavy metal concentrations in human eyes. Am J Ophthalmol. (2005) 139:888–93. doi: 10.1016/j.ajo.2004.12.007
24. WHO. WHO 2020 Ten Chemicals of Major Public Health Concern. (2020). Available online at: https://www.who.int/news-room/photo-story/detail/10-chemicals-of-public-health-concern
25. Rafati Rahimzadeh M, Rafati Rahimzadeh M, Kazemi S, Moghadamnia AA. Cadmium toxicity and treatment: an update. Caspian J Intern Med. (2017) 8:135–45. doi: 10.22088/cjim.8.3.135
26. Ebrahimi M, Ebrahimi M, Vergroesen JE, Aschner M, Sillanpää M. Environmental exposures to cadmium and lead as potential causes of eye diseases. J Trace Elem Med Biol. (2024) 82:127358. doi: 10.1016/j.jtemb.2023.127358
27. Kim MH, Zhao D, Cho J, Guallar E. Cadmium exposure and age-related macular degeneration. J Expo Sci Environ Epidemiol. (2016) 26:214–8. doi: 10.1038/jes.2014.75
28. Lee SH, Kang EM, Kim GA, Kwak SW, Kim JM, Bae HW, et al. Three toxic heavy metals in open-angle glaucoma with low-teen and high-teen intraocular pressure: a cross-sectional study from South Korea. PLoS ONE. (2016) 11:e0164983. doi: 10.1371/journal.pone.0164983
29. Wills NK, Ramanujam VM, Chang J, Kalariya N, Lewis JR, Weng TX, et al. Cadmium accumulation in the human retina: effects of age, gender, and cellular toxicity. Exp Eye Res. (2008) 86:41–51. doi: 10.1016/j.exer.2007.09.005
30. Pamphlett R, Cherepanoff S, Too LK, Kum Jew S, Doble PA, Bishop DP. The distribution of toxic metals in the human retina and optic nerve head: implications for age-related macular degeneration. PLoS ONE. (2020) 15:e0241054. doi: 10.1371/journal.pone.0241054
31. Di Paola D, Gugliandolo E, Capparucci F, Cordaro M, Iaria C, Siracusa R, et al. Early exposure to environmental pollutants: imidacloprid potentiates cadmium toxicity on zebrafish retinal cells death. Animals. (2022) 12:3484. doi: 10.3390/ani12243484
32. Zhang L, Xia Q, Zhou Y, Li J. Endoplasmic reticulum stress and autophagy contribute to cadmium-induced cytotoxicity in retinal pigment epithelial cells. Toxicol Lett. (2019) 311:105–13. doi: 10.1016/j.toxlet.2019.05.001
33. Satarug S, Gobe GC, Vesey DA. Multiple targets of toxicity in environmental exposure to low-dose cadmium. Toxics. (2022) 10:472. doi: 10.3390/toxics10080472
34. Ekinci M, Ceylan E, Cagatay HH, Keleş S, Altinkaynak H, Kartal B, et al. Occupational exposure to lead decreases macular, choroidal, and retinal nerve fiber layer thickness in industrial battery workers. Curr Eye Res. (2014) 39:853–8. doi: 10.3109/02713683.2013.877934
35. Renu K, Chakraborty R, Myakala H, Koti R, Famurewa AC, Madhyastha H, et al. Molecular mechanism of heavy metals (Lead, Chromium, Arsenic, Mercury, Nickel and Cadmium) - induced hepatotoxicity - a review. Chemosphere. (2021) 271:129735. doi: 10.1016/j.chemosphere.2021.129735
36. Cooper GP, Suszkiw JB, Manalis RS. Heavy metals: effects on synaptic transmission. Neurotoxicology. (1984) 5:247–66.
37. Nelke Kamil MM, Klaudiusz L, Wojciech P, Jan N, Dorota S, Monika K, et al. Occurrence and exposure to lead and cadmium and their environmental influence on eyesight polish. J Environm Stud. (2015) 24:1491–6. doi: 10.15244/pjoes/39551
38. Giddabasappa A, Hamilton WR, Chaney S, Xiao W, Johnson JE, Mukherjee S, et al. Low-level gestational lead exposure increases retinal progenitor cell proliferation and rod photoreceptor and bipolar cell neurogenesis in mice. Environ Health Perspect. (2011) 119:71–7. doi: 10.1289/ehp.1002524
39. Chenjin Z. Exposure assessments of cadmium and lead with age-related eye disease: a systematic review and meta-analysis. J Trace Elem Med Biol. (2025) 89:127631. doi: 10.1016/j.jtemb.2025.127631
40. Liu N, Guan Y, Zhou C, Wang Y, Ma Z, Yao S. Pulmonary and systemic toxicity in a rat model of pulmonary alveolar proteinosis induced by indium-tin oxide nanoparticles. Int J Nanomedicine. (2022) 17:713–31. doi: 10.2147/IJN.S338955
41. McInturf SM, Bekkedal MY, Wilfong E, Arfsten D, Gunasekar PG, Chapman GD. Neurobehavioral effects of sodium tungstate exposure on rats and their progeny. Neurotoxicol Teratol. (2008) 30:455–61. doi: 10.1016/j.ntt.2008.07.003
42. Wasel O, Freeman JL. Comparative assessment of tungsten toxicity in the absence or presence of other metals. Toxics. (2018) 6:66. doi: 10.3390/toxics6040066
43. Abd-Elhakim YM, El Bohi KM, El Sharkawy NI, Ghali MA, Haseeb S. The impacts of individual and combined exposure to cadmium and lead on intraocular pressure, electroretinography, and residual changes in the rabbit eyes. Environ Sci Pollut Res Int. (2019) 26:33321–8. doi: 10.1007/s11356-019-06446-7
44. Rehman K, Fatima F, Waheed I, Akash MSH. Prevalence of exposure of heavy metals and their impact on health consequences. J Cell Biochem. (2018) 119:157–84. doi: 10.1002/jcb.26234
45. Pisoschi AM, Pop A, Iordache F, Stanca L, Predoi G, Serban AI. Oxidative stress mitigation by antioxidants - an overview on their chemistry and influences on health status. Eur J Med Chem. (2021) 209:112891. doi: 10.1016/j.ejmech.2020.112891
46. Aschner M, Skalny AV, Paoliello MMB, Tinkova MN, Martins AC, Santamaria A, et al. Retinal toxicity of heavy metals and its involvement in retinal pathology. Food Chem Toxicol. (2024) 188:114685. doi: 10.1016/j.fct.2024.114685
47. Zhang Y, Huo X, Lu X, Zeng Z, Faas MM, Xu X. Exposure to multiple heavy metals associate with aberrant immune homeostasis and inflammatory activation in preschool children. Chemosphere. (2020) 257:127257. doi: 10.1016/j.chemosphere.2020.127257
48. Ghazy HA, Abdel-Razek MAS, El Nahas AF, Mahmoud S. Assessment of complex water pollution with heavy metals and Pyrethroid pesticides on transcript levels of metallothionein and immune related genes. Fish Shellfish Immunol. (2017) 68:318–26. doi: 10.1016/j.fsi.2017.07.034
49. Baudouin C, Kolko M, Melik-Parsadaniantz S, Messmer EM. Inflammation in Glaucoma: From the back to the front of the eye, and beyond. Prog Retin Eye Res. (2021) 83:100916. doi: 10.1016/j.preteyeres.2020.100916
50. Yang P, Ohno S, Zierhut M. Editorial: New insights into uveitis: immunity, genes, and microbes. Front Immunol. (2021) 12:765377. doi: 10.3389/fimmu.2021.765377
51. Kaarniranta K, Uusitalo H, Blasiak J, Felszeghy S, Kannan R, Kauppinen A, et al. Mechanisms of mitochondrial dysfunction and their impact on age-related macular degeneration. Prog Retin Eye Res. (2020) 79:100858. doi: 10.1016/j.preteyeres.2020.100858
Keywords: heavy metals, visual disability, National Health and Nutrition Examination Survey, cadmium, lead, risk factors
Citation: Dai L, Zhou Q, Gao Y, Su G, Jiang Q, Xia L and Yang P (2025) Association of exposure to urinary and blood heavy metals with visual disability among U.S. adults in NHANES 2013–2018. Front. Public Health 13:1583105. doi: 10.3389/fpubh.2025.1583105
Received: 25 February 2025; Accepted: 14 April 2025;
Published: 09 May 2025.
Edited by:
Alessandra Pulliero, University of Genoa, ItalyReviewed by:
Biswajit Patra, Fakir Mohan University, IndiaAna Luiza Fonseca Destro, Universidade Federal de Viçosa, Brazil
Copyright © 2025 Dai, Zhou, Gao, Su, Jiang, Xia and Yang. This is an open-access article distributed under the terms of the Creative Commons Attribution License (CC BY). The use, distribution or reproduction in other forums is permitted, provided the original author(s) and the copyright owner(s) are credited and that the original publication in this journal is cited, in accordance with accepted academic practice. No use, distribution or reproduction is permitted which does not comply with these terms.
*Correspondence: Peizeng Yang, cGVpemVuZ3ljbXVAMTI2LmNvbQ==
†These authors share first authorship