- 1Department of Epidemiology and Health Statistics, School of Public Health, Hangzhou Normal University, Hangzhou, China
- 2School of Pharmacy, Hangzhou Normal University, Hangzhou, China
- 3Department of Occupational and Environmental Health, School of Public Health, Hangzhou Normal University, Hangzhou, China
- 4Department of Nutrition and Toxicology, School of Public Health, Hangzhou Normal University, Hangzhou, China
Background: Frailty progression may lead to adverse clinical events. Timely intervention of individual with heterogeneous frailty trajectories are important to prevent or reverse frailty progression.
Aims: This study aimed to develop nomograms to predict heterogeneous frailty progression, and validate their predictive performance.
Methods: 4,406 participants (2,268 in the development cohort and 2,138 in the validation cohort) were included in this study. Latent class trajectory model (LCTM) was used to identify the heterogeneous frailty trajectories. Lasso regression analysis was employed to screen predictive factors. The nomogram models were subsequently developed using multivariable logistic regression analysis. Model performance was internally validated with bootstrap resampling and externally validated using independent data. The discrimination and calibration were assessed by C-index and calibration curve, respectively.
Results: Two prediction nomograms were developed and validated to estimate the risk of future frailty progression based on three identified frailty trajectories. Eleven predictors were determined in the medium-stable nomogram. The internal and external validation C-indices were 0.86 and 0.77; the calibration curves demonstrated that the predicted probabilities fit well with the actual observation. Six predictors were determined in the low-rapid nomogram. The internal and external validation C-indices were 0.74 and 0.62, respectively, and calibration curves indicated good calibration.
Discussion: Frailty trajectories provide more predictive value than frailty states. This study developed nomogram models to predict frailty progression, identifying key predictors such as gender, cognitive impairment, lifestyle factors, and early life experiences, with promising validation results.
Conclusion: The nomograms demonstrated favorable performance and may help making public health strategies for more precise frailty management.
1 Introduction
Frailty is characterized by the progressive decline of multiple physiological systems, resulting in increased vulnerability to external stressors among older adults (1, 2). Frailty is associated with many adverse health outcomes, including falls, cognitive impairment, fractures, disability, death, and high health expenditure (3–5). As such, frailty is becoming a significant challenge in global public health, especially for China with its large aging population (6).
It is worth noting that frailty is dynamic (7) and each individual probably has unique trajectory of frailty progression (8). In our previous study (9), three frailty trajectories were identified based on a large Chinese population cohort: the low-stable group, the medium-stable group, and the low-rapid group. The latter two trajectories indicated persistent or worsening frailty and were referred to as the “heterogeneous frailty trajectories”. Heterogeneous frailty trajectories also predict other adverse health outcomes and impact individual’s quality of life (10). Early identification and timely intervention of individual with heterogeneous frailty trajectories are important to prevent or reverse frailty progression (11). Thus, there is an urgent need to develop feasible risk prediction models based on frailty trajectories in older adults. The nomogram can visualize statistical predictive models and intuitively generate predictive probabilities of clinical events (12), which facilitates personalized predictions and interventions.
Therefore, this study aimed to develop and validate prediction nomograms for predicting the risk of worsening frailty progression in Chinese older adults, which would be of important public health value.
2 Materials and methods
2.1 Study participants
2.1.1 Development cohort
Chinese Longitudinal Healthy Longevity Survey (CLHLS) is the first longitudinal survey to investigate the determinants of health and longevity of older adults in China (13). Inclusion criteria for this study were as follows: (1) age 65 years and older; (2) participation in four surveys successively since 2008; (3) completion of baseline frailty measurement and three follow-up frailty measurements. Participants with more than 25% missing data in the frailty assessment were excluded.
2.1.2 Validation cohort
China Health and Retirement Longitudinal Study (CHARLS) (14) is also a nationally representative longitudinal survey designed to collect information on socioeconomic status and personal health status. The CHARLS database covers data from individuals aged 45 years or older and their spouses living in China between 2008 and 2018. Data from the CHARLS was used for external validation in this study. Curation of CHARLS data followed the same process that was done for CLHLS.
The two databases were approved by the Research Ethics Committee of Peking University (IRB00001052-13074 and IRB00001052-11015) and all participants provided written informed consent. Finally, 4,406 participants (2,268 in the development cohort and 2,138 in the validation cohort) were included (Supplementary Figure 1).
2.2 Frailty status
Frailty index (FI) was used to measure the dimensions of frailty. Based on our previous study (9), 38 health deficits in the CLHLS and 34 health deficits in the CHARLS were included to construct the FI. FI score was calculated in each wave of both cohorts, respectively. Frailty measurements from baseline to the last follow-up were subjected to trajectory analysis. Detailed deficits of the FI were shown in Supplementary Table 1.
2.3 Covariates
Life course theory posits that early life exposure may affect late-life health (15). Thus, we explored possible factors from a full life cycle perspective, including age, gender, education, economic status, health status and behaviors, lifestyle, family social support, and childhood experiences. For the consistency between CLHLS and CHARLS, education level was defined as illiterate (no education) or literate (having years of education). Some common leisure activities were included based on typical practices in Chinese culture, such as gardening, watching TV, and playing mah-jongg. The frequency of these activities were categorized as low-frequency and high-frequency. Information on childhood experiences including losing parents (yes/no), childhood starvation (yes/no), and medical service in childhood (inadequate/adequate) were collected. The level of loneliness was measured by a single-item question on how often the respondent felt lonely and was divided into two categories based on reported frequency (16). A more detailed description of the variables was shown in Supplementary Table 2.
2.4 Statistical analysis
For descriptive statistics, multiple imputation was used to interpolate for missing data on continuous variables if the percentage of missing data was <10%. Continuous variables were expressed as mean (M) ± standard deviation (SD) and compared using two-tailed t-tests or Kruskal-Wallis rank sum tests. Categorical variables were presented as numbers and proportions, and compared using a chi-square test or Fisher exact test.
Latent class trajectory model (LCTM) was used to identify potential frailty trajectories. The optimal number of trajectories was determined based on several criteria: the lowest Bayesian Information Criterion (BIC) value, an average posterior probability greater than 70%, and each class comprising at least 5% of the total sample. We employed the least absolute shrinkage and selection operator (Lasso) regression analysis and 10-fold cross-validation techniques to identify potential predictive factors (17, 18). Lasso can eliminate coefficients of less important variables and evaluate the significant correlations between independent variables and the outcome. Subsequently, a nomogram prediction model was developed using multivariate logistic regression analysis. A score was assigned to each predictor in the nomogram so that total points could be ascertained to estimate the probability of being in worsening frailty trajectories (19). Meanwhile, we constructed a web-based dynamic online nomogram to facilitate practical application.
The performances of the nomogram were validated in the internal and external validation cohorts concerning discrimination and calibration (20). Internal validation was performed in the development cohort using 1,000 bootstrap resamples, while external validation was conducted using an independent CHARLS cohort. The discrimination performances of the nomogram were assessed by the concordance index (C-index) or the area under curve (AUC) of the receiver operating characteristic (ROC) curve. The AUC value ranges from 0.5 to 1, with value 1 being the best discriminatory ability (21). Calibration curve analysis was conducted to assess the calibration effect by evaluating the consistency of predicted probabilities and observed frequencies.
Statistical analyses and visualizations were performed with R version 4.3.0 (22). All tests were two-sided, and a p-value < 0.05 was considered statistically significant.
3 Results
3.1 Baseline characteristics of the participants
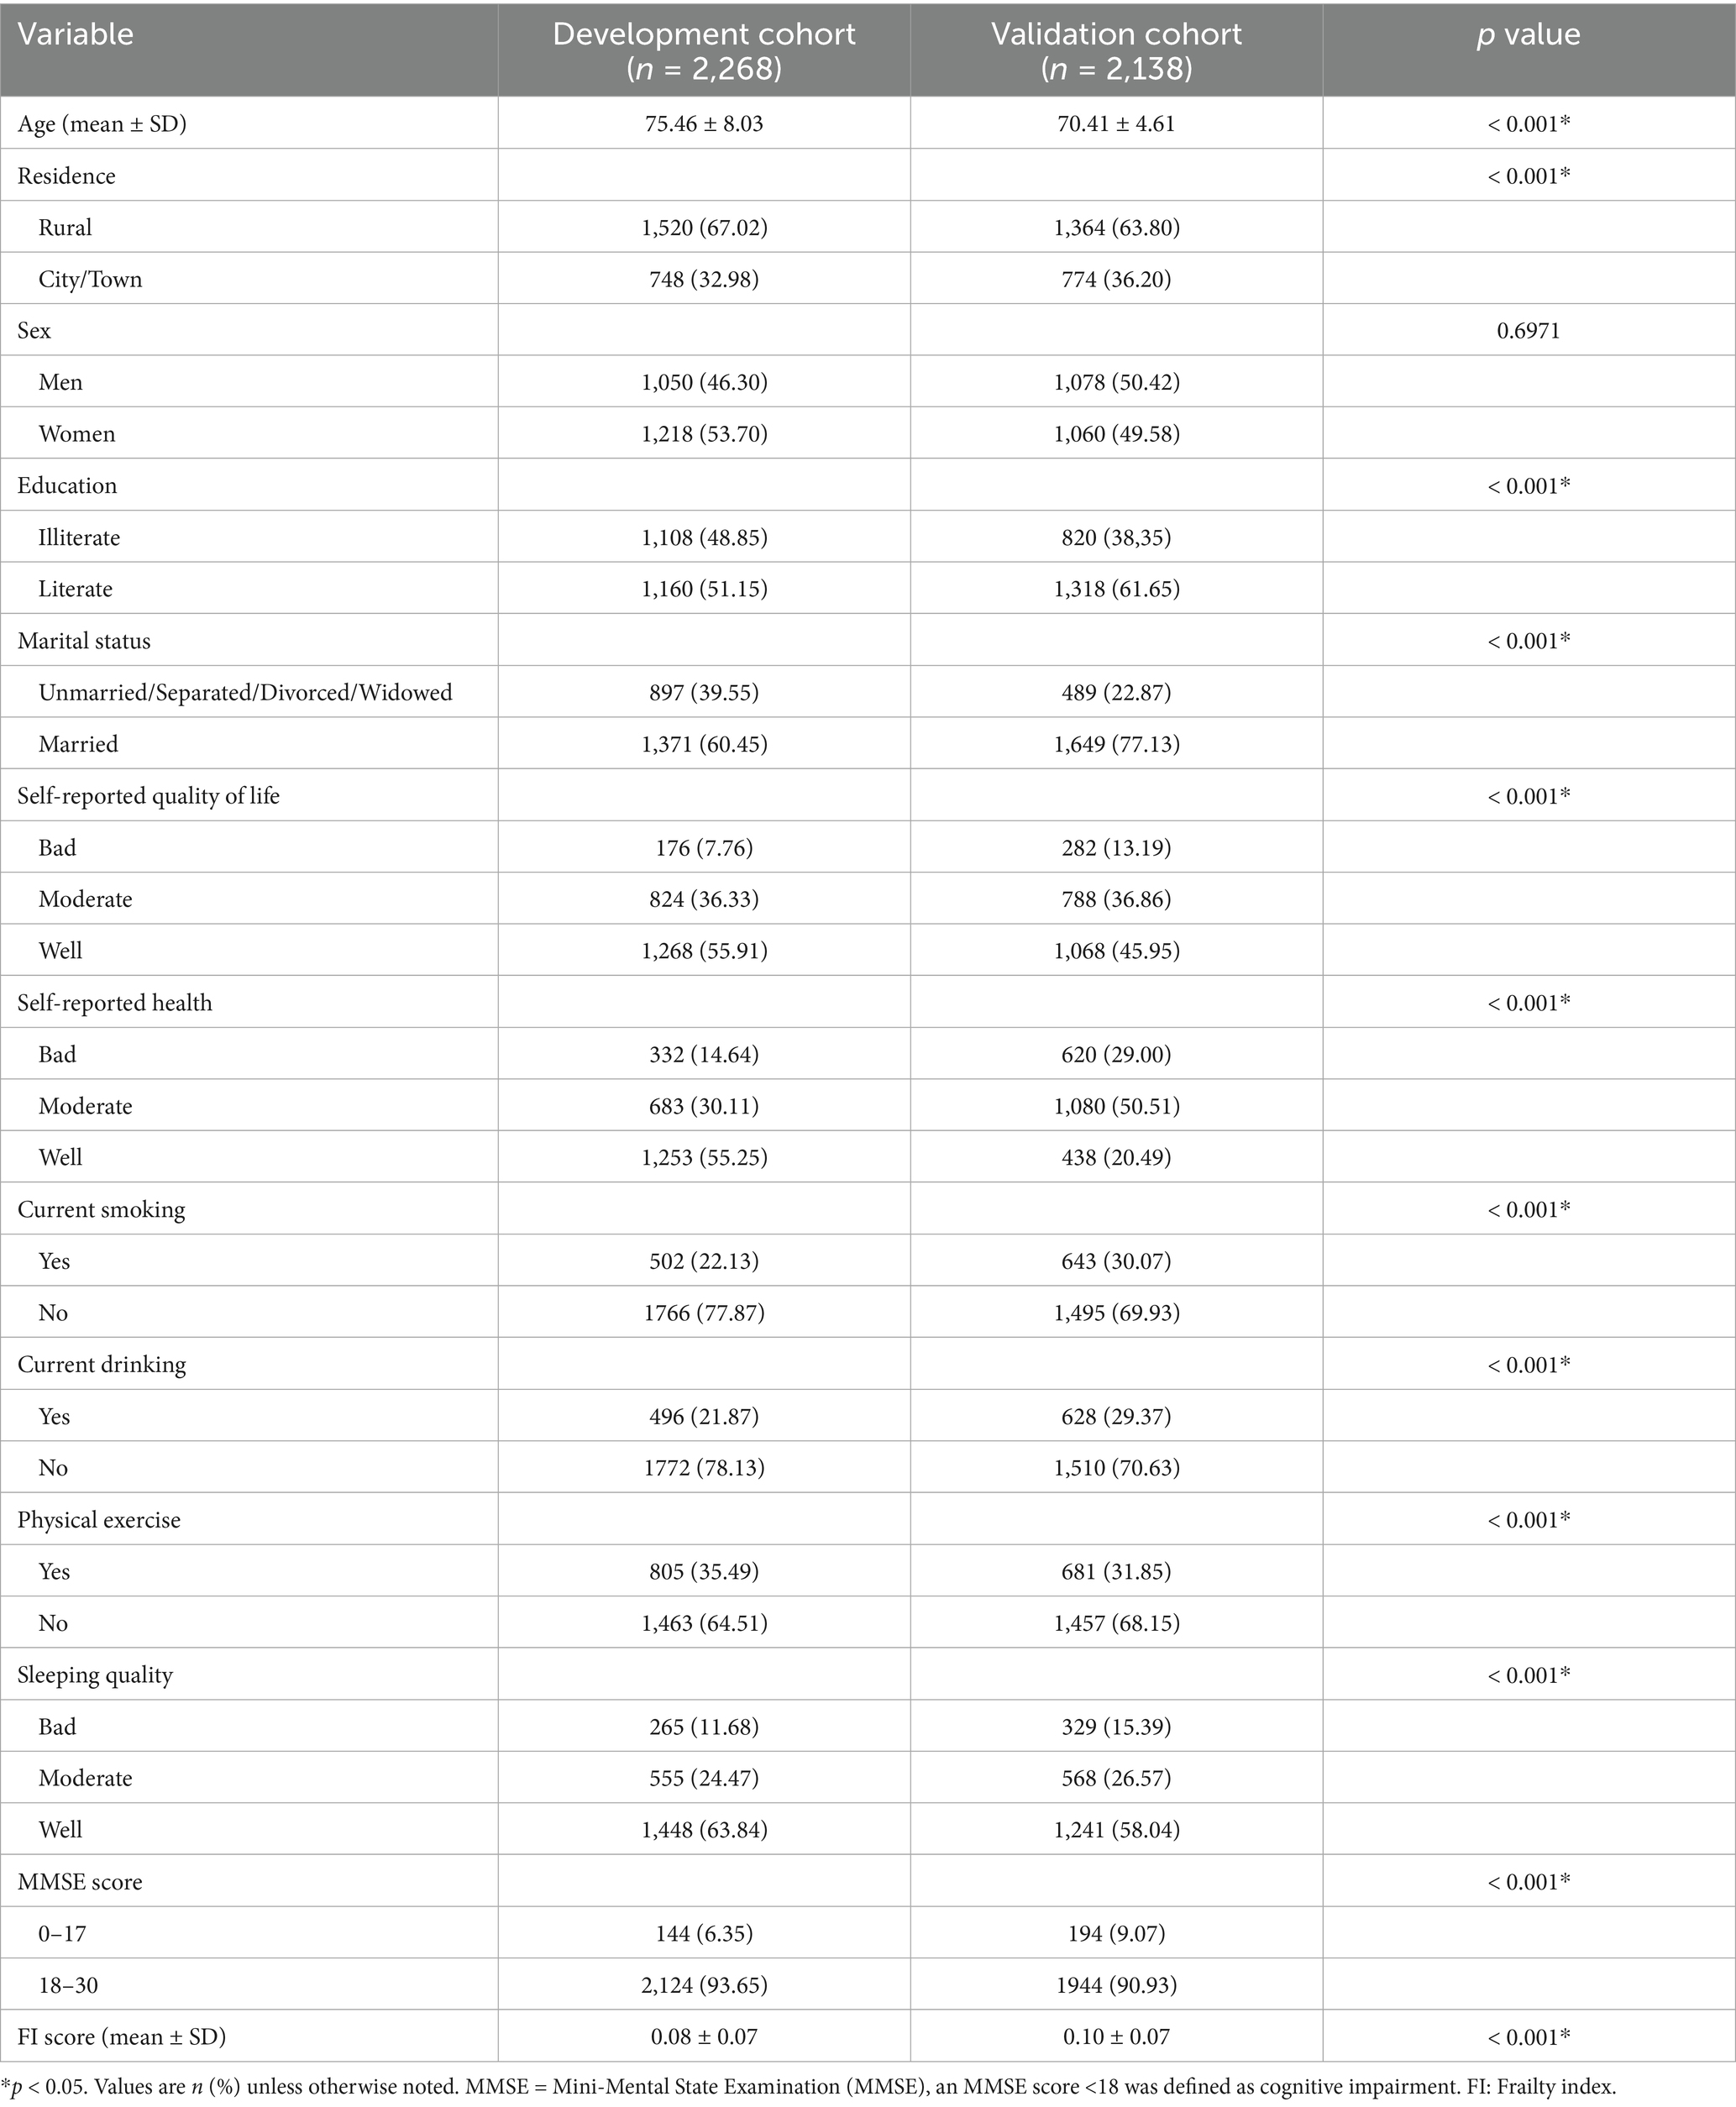
There were statistically significant differences between the development and validation cohorts in the demographical and behavioral characteristics. Compared to the validation cohort, the participants in the development cohort were relatively older (p < 0.001). Nevertheless, older adults in both cohorts exhibited a similarly low risk of frailty at baseline. More details were described in Table 1.
3.2 Frailty trajectory
Three distinct frailty trajectories were identified using the best-fitting trajectory model with a BIC of −19356.99. The APP for every group exceeded 70%, and the proportion of the smallest class comprised over 5% of the total sample. The three trajectories were designated as follows: low-stable group, medium-stable group and low-rapid group. In the low-stable group, participants had a relatively low and stable FI. In the medium-stable group, participants had a moderate FI at baseline with a slight increase over time. And participants in the low-rapid group started with a low FI but experienced a rapid increase over time (9).
3.3 Lasso regression
The optimal penalty term lambda was determined using 10-fold cross-validation of the Lasso regression. The model performance was optimal when the lambda.min was set at 0.005471071. Eighteen non-zero coefficients were chosen as potential predictors of frailty progression at this lambda value, including gender, self-reported quality of life, cognitive function, tea consumption, smoking and drinking status, physical labor, social activities, leisure activities, financial support, childhood medical service, age, sleep quality, chewing ability, BMI, and loneliness level. The detailed selection process by Lasso was shown in Supplementary Figures 2, 3.
3.4 Multivariate logistic regression and nomogram development
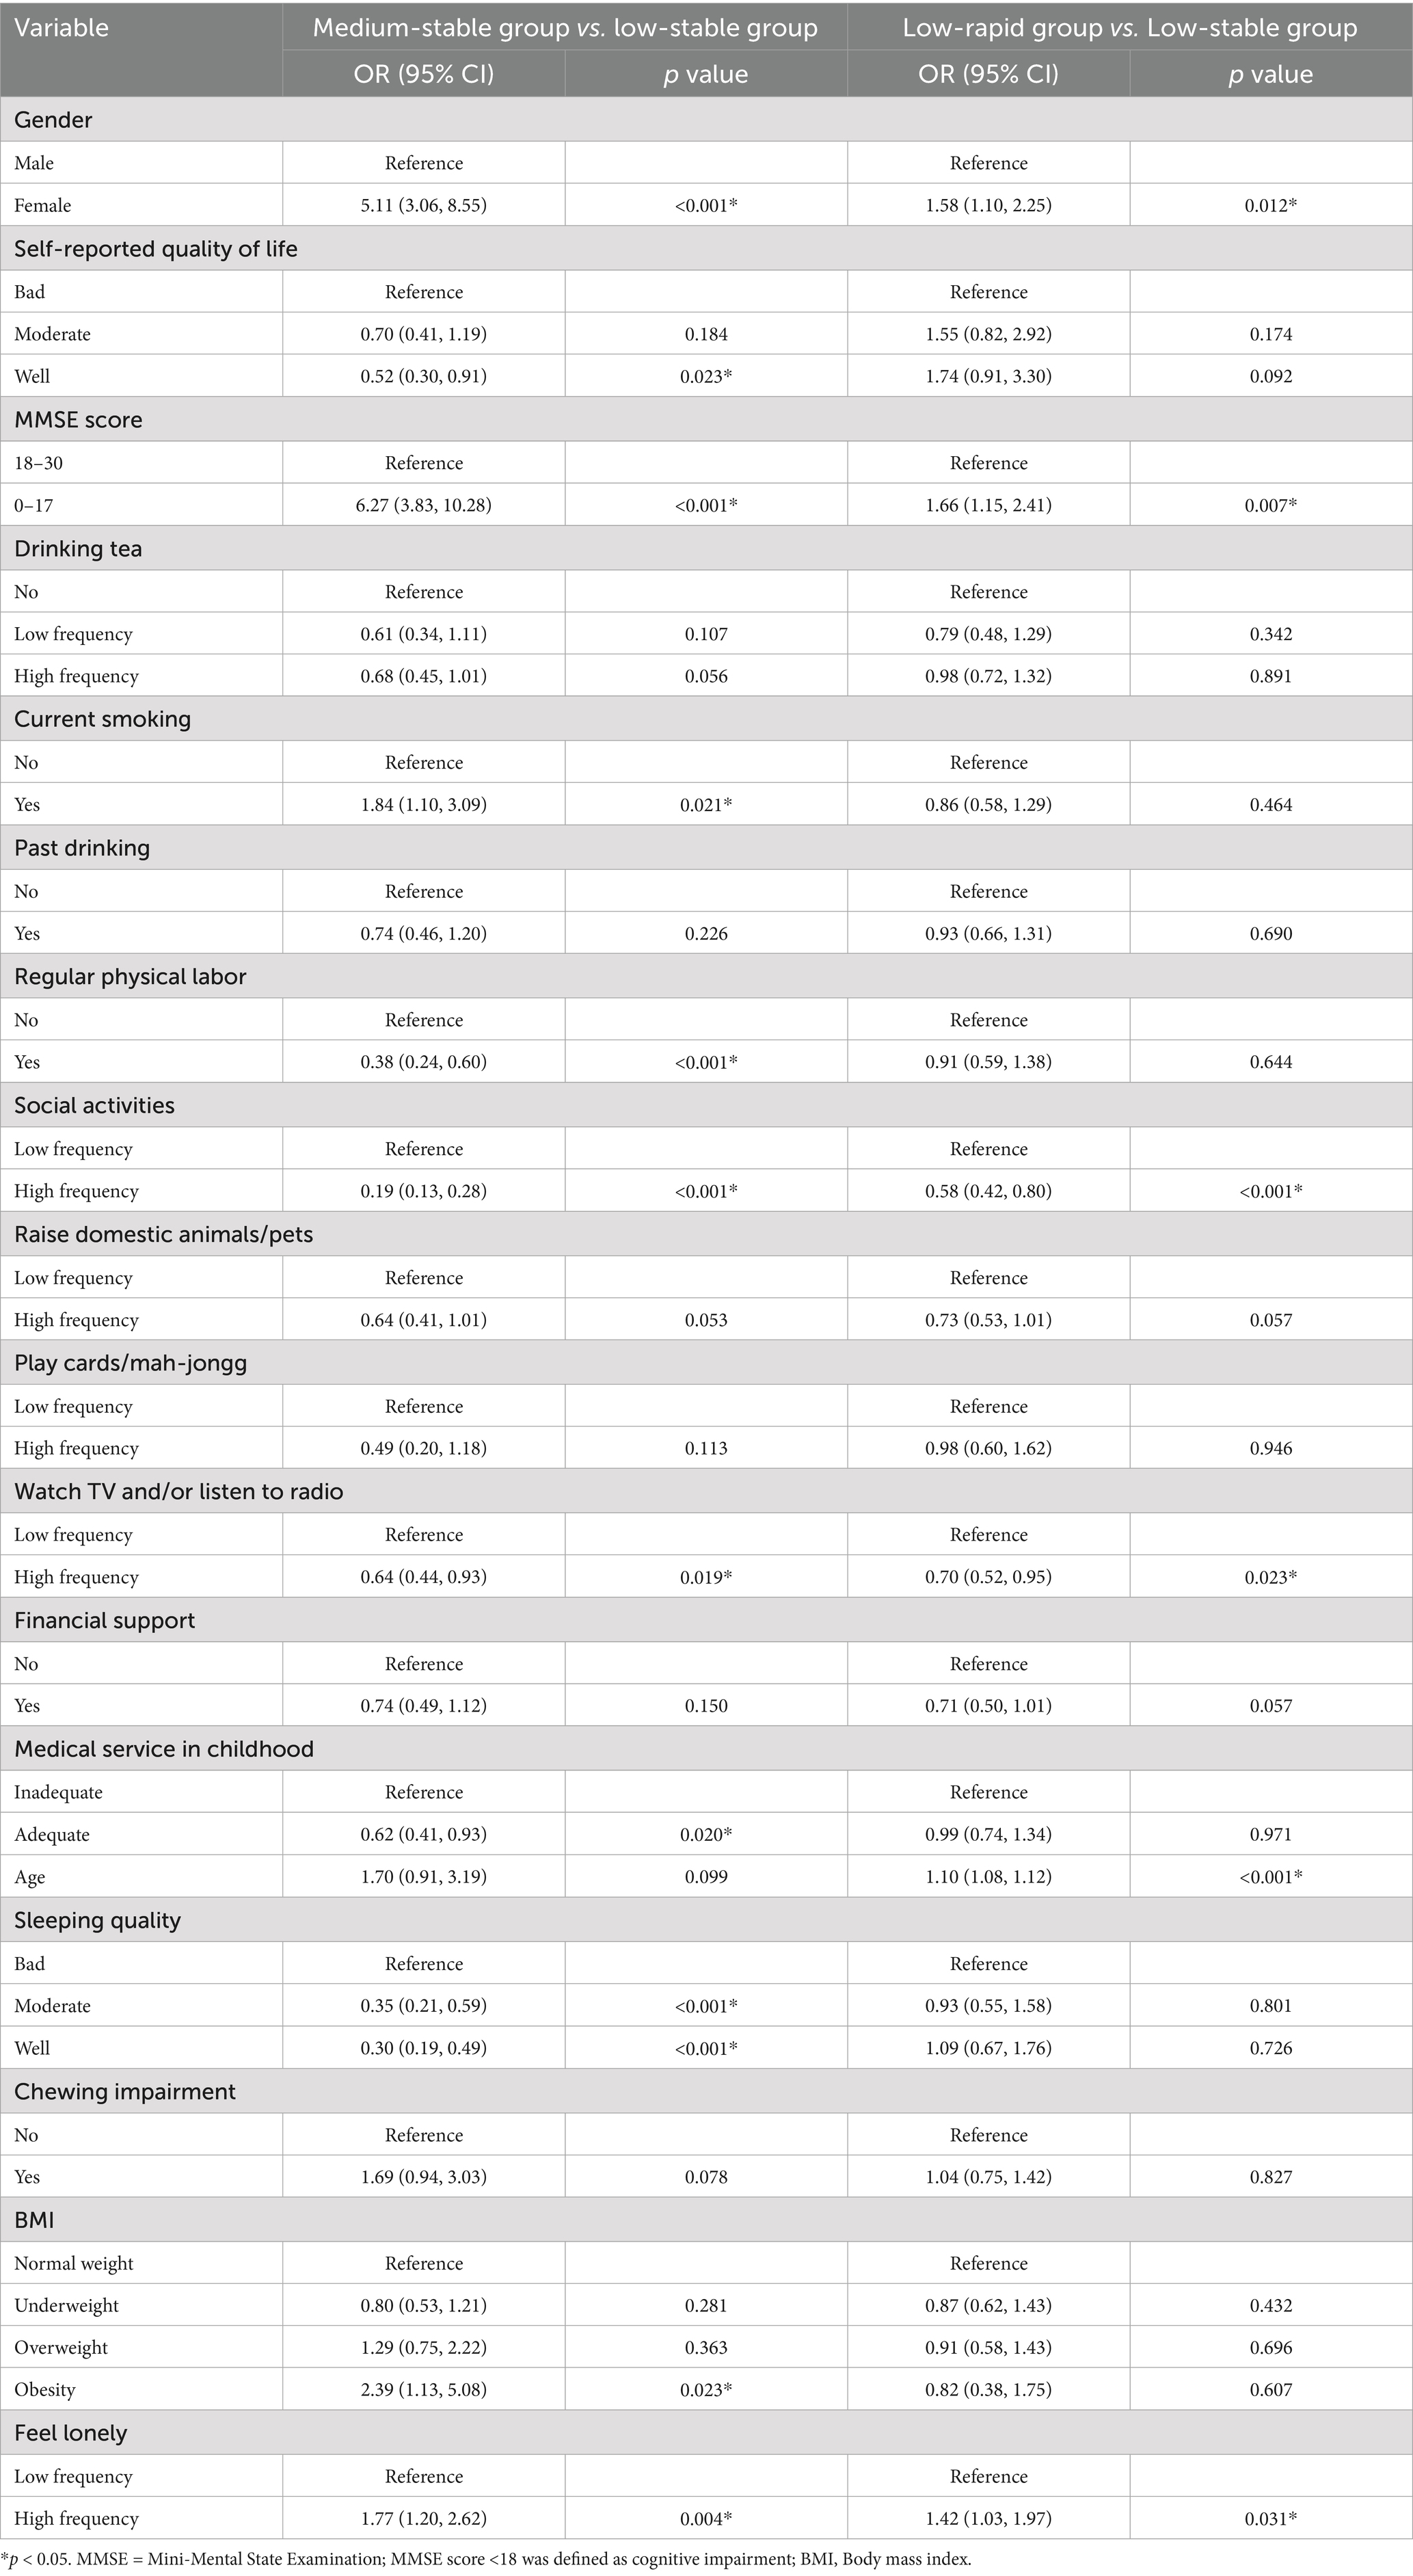
The selected variables were then included in the multivariate logistic regression analysis to further select predictors. Medium-stable trajectory and low-rapid trajectory were distinct patterns of frailty development, so we constructed separate prediction models for these two groups, by using the low-stable group as the reference group. Table 2 displays the odds ratio (OR) (95% confidence interval [CI]) for frailty progression in different trajectories.
For medium-stable trajectory, women (OR = 5.11, p < 0.001), cognitive impairment (OR = 6.27, p < 0.001), smoking (OR = 1.84, p = 0,021), obesity (OR = 2.39, p = 0.023), and loneliness (OR = 1.77, p = 0.004) exacerbated the progression of worsening frailty. While, high quality of life (OR = 0.52), regular physical labor (OR = 0.38) and social activities (OR = 0.19), watching TV (OR = 0.64), adequate childhood medical service (OR = 0.62), and good sleep quality (OR = 0.30) may contribute to decelerating the frailty progression (p all<0.001). A nomogram based on these eleven independent features was developed to predict the probability of being in the medium-stable group for old adults (Figure 1). The nomogram illustrated that cognitive function (MMSE) was the strongest predictor of high and progressive risk of frailty, followed by gender and frequency of social participation. The dynamic online nomogram can be accessed at https://online-nomogram.shinyapps.io/Medium_stable_trajectory/. An example was illustrated in Supplementary Figure 4, showing that the individual’s probability of being in the medium-stable trajectory was 96.0%.
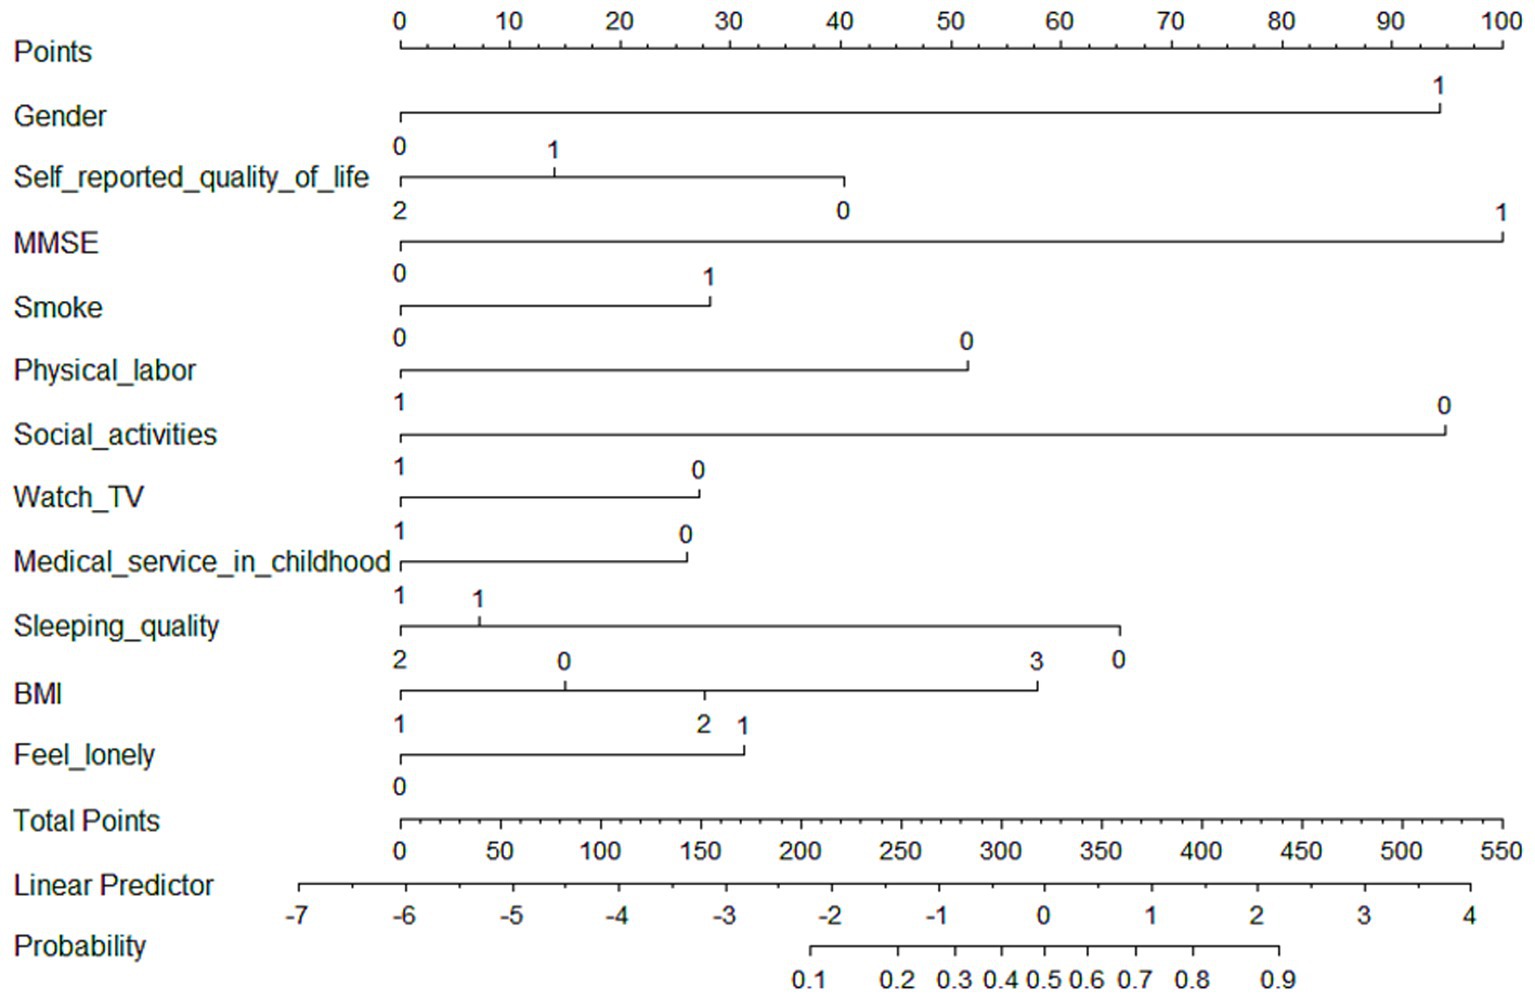
Figure 1. Nomogram for predicting the probability of being in the medium-stable trajectory. The scores corresponding to each predictor were listed at the top of the nomogram. By counting the total score, and projecting it to the bottom risk line, “medium-stable trajectory” probabilities could be estimated.
For low-rapid trajectory, six predictive factors including gender, cognitive function, social activities, watching TV, age, and loneliness level were included in the final multivariate model to construct the prediction model, which was visualized as a nomogram (Figure 2). The dynamic nomogram was available online.1 Assuming that an 83-year-old woman with cognitive impairment, but regularly participated in social activities and watched TV, and was less likely to feel lonely, the predicted probability was approximately 18.1% (Supplementary Figure 5).
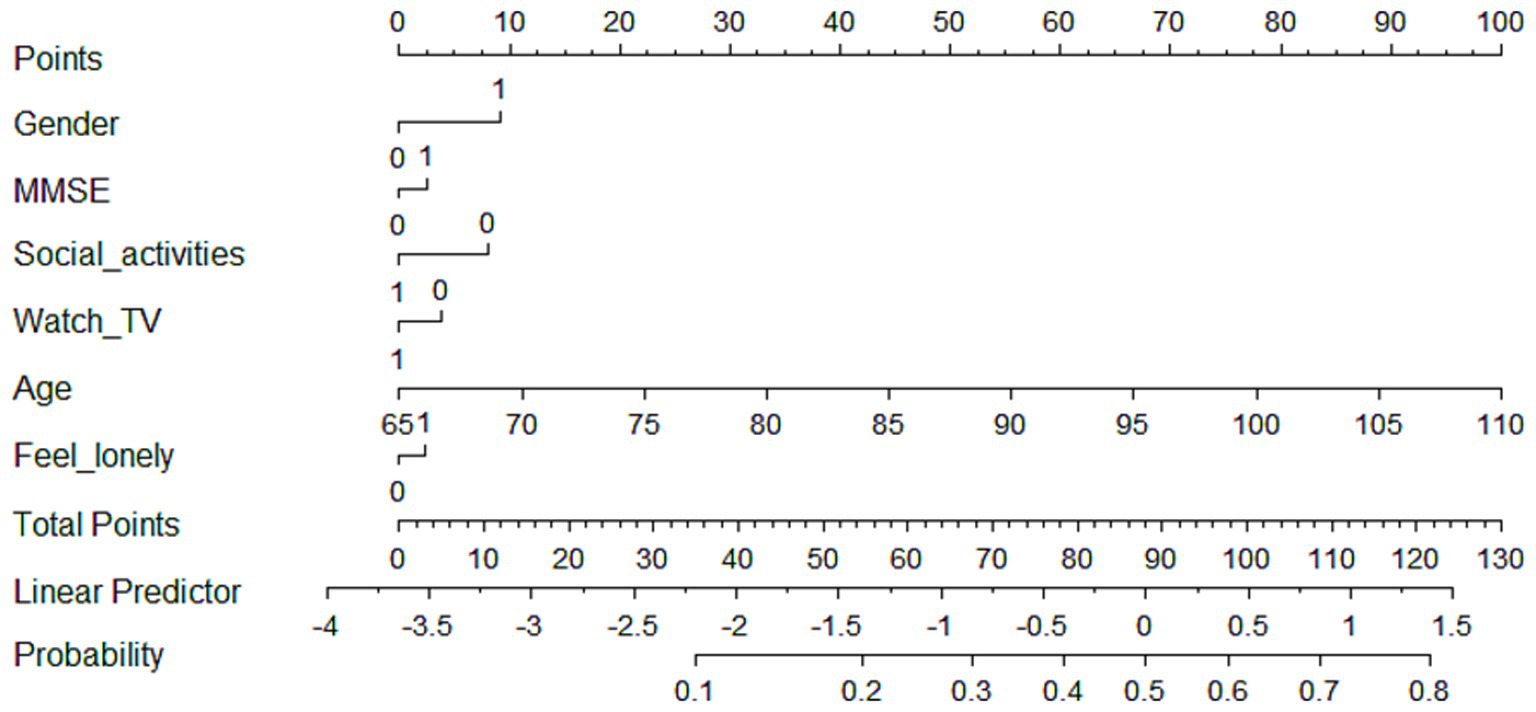
Figure 2. Nomogram for predicting the probability of being in low-rapid trajectory. The scores corresponding to each predictor were listed at the top of the nomogram. By counting the total score, and projecting it to the bottom risk line, “low-rapid trajectory” probabilities could be estimated.
3.5 Nomogram validation and evaluation
For the medium-stable trajectory, the nomogram showed good discrimination with the C-index of 0.86 in the internal validation cohort and 0.77 in the external validation cohort. The ROC curve of the nomogram also indicated favorable discrimination ability (Figure 3A). And the calibration curves with internal and external validation presented good concordance, as shown in Figures 4A,B. While for the nomogram of the low-rapid trajectory, the C-index was 0.74 for the bootstrapping validation and 0.62 for the external validation cohort. As shown in Figure 3B, ROC analysis presented similar results, with the AUC of the external validation cohort lower than that of the internal validation cohort. However, the calibration curve in the external validation cohort demonstrated that the low-rapid trajectory probabilities predicted by the nomogram agreed well with the actual observation probabilities (Figures 4C,D).
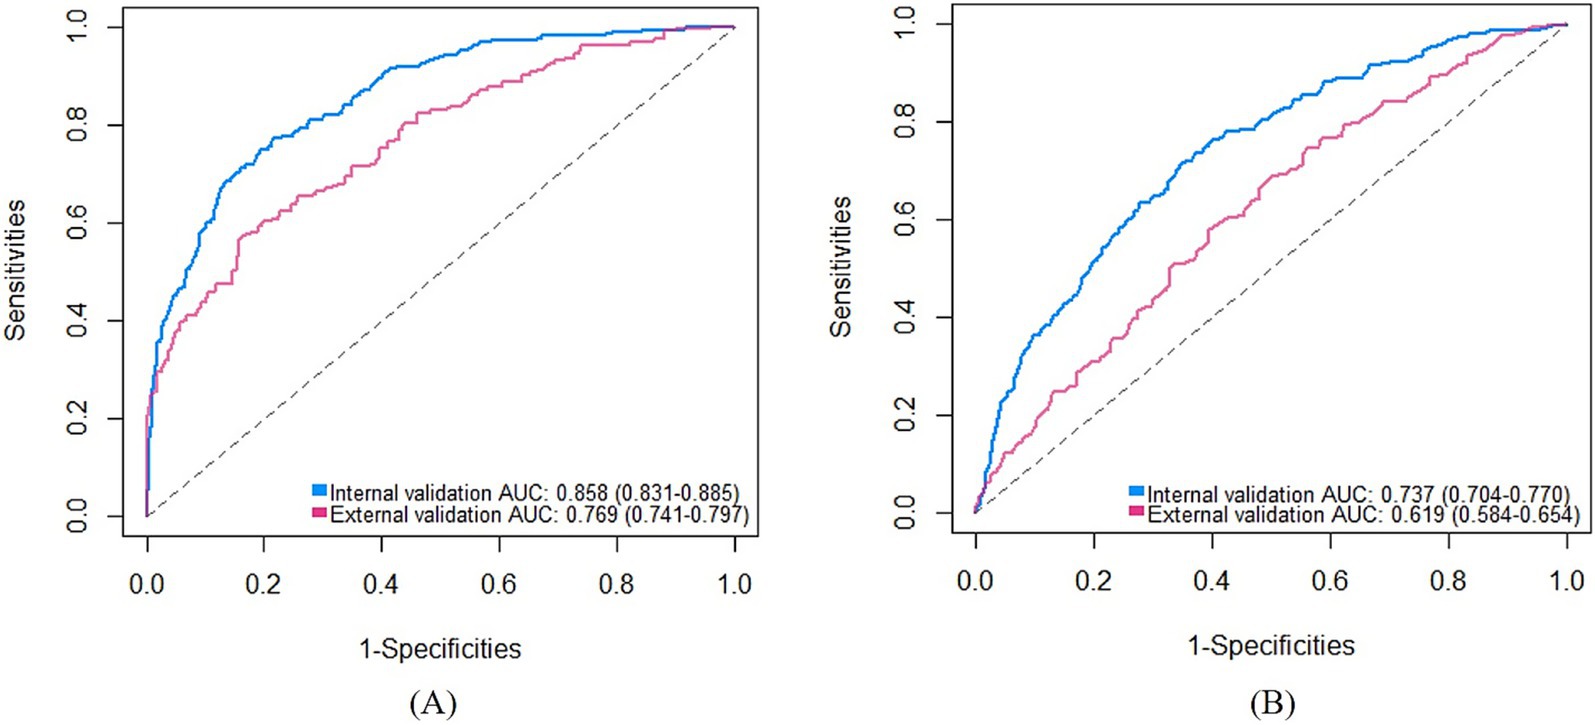
Figure 3. ROC curves of the “medium-stable” nomogram (A) and the “low-rapid” nomogram (B). AUC, Area under the receiver operating characteristic curve. ROC, Receiver operating characteristic.
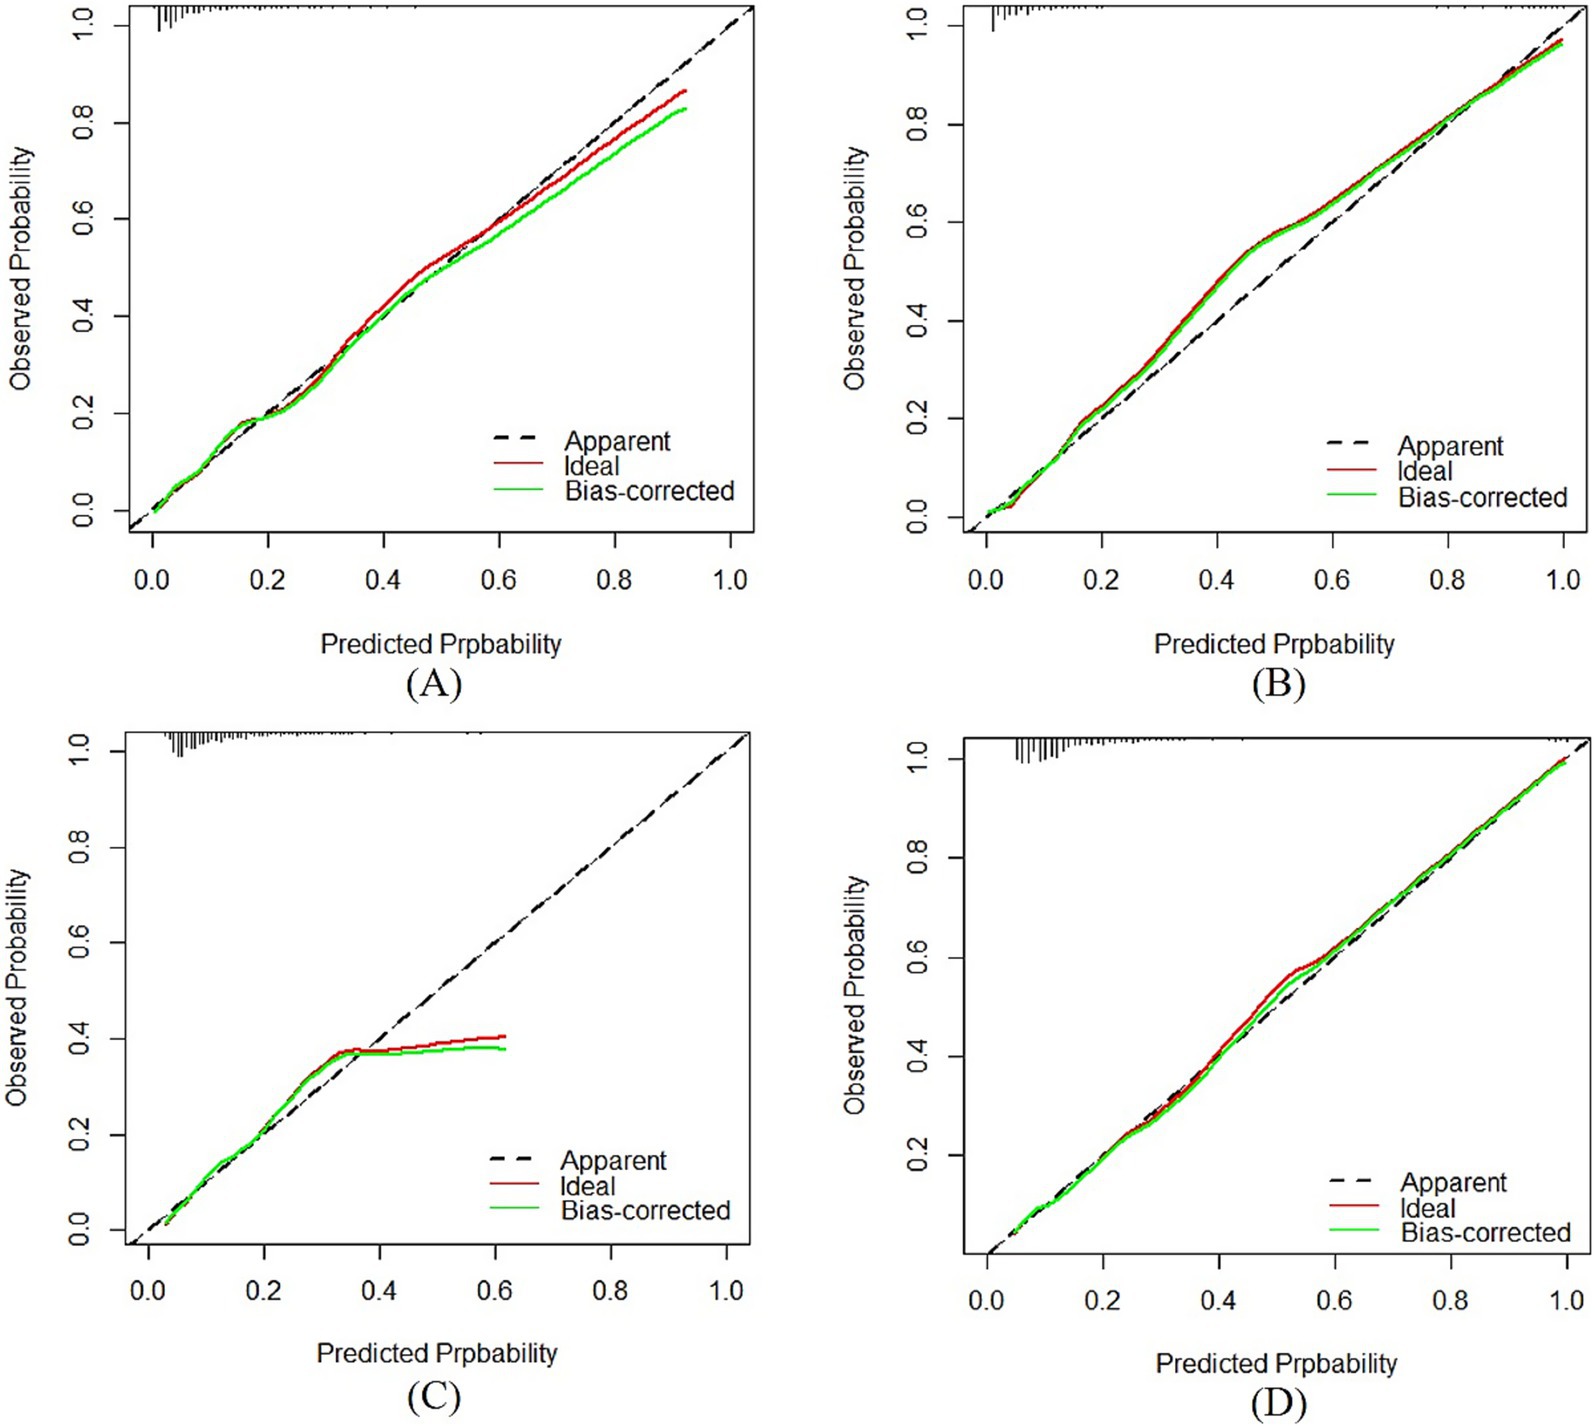
Figure 4. Calibration plots of the “medium-stable” nomogram in the internal (A) and external (B) validation cohort. Calibration plots of the “low-rapid” nomogram in the internal (C) and external (D) validation cohort. AUC: The y axis indicated the observed incidence for heterogeneous frailty trajectories, and the x axis was the predicted probability of heterogeneous frailty trajectories based on the predictive model.
4 Discussion
In the current study, nomogram models for predicting heterogeneous frailty progression were developed and validated. Several important factors were identified. Firstly, women, poor quality of sleep and life, cognitive impairment, smoking, no physical and social activities, low childhood medical service, obesity, and loneliness were independent predictors of frailty development in the medium-stable group. Additionally, women, cognitive impairment, lack of social activities, rarely watching TV, advanced age, and loneliness were independent predictors in the low-rapid group. Secondly, based on these findings, the static and dynamic nomograms were constructed for medium-stable group and low-rapid group, respectively. Thirdly, the internal and external validation showed good discrimination and calibration ability of the “medium-stable” nomogram. In contrast, the “low-rapid” nomogram showed acceptable performance in the internal validation cohort but relatively poor discrimination in the external validation cohort.
Our study found that age was a significant risk factor for the deterioration of frailty progression, which is consistent with previous research (23). Frailty is strongly associated with advanced age, primarily as a result of the progressive decline in physiological reserves and the accumulation of age-related pathological changes. These process compromise homeostatic capacity and increase susceptibility to stressors, thereby accelerating frailty development (24). Besides, several physiology and psychosocial factors were also identified as significant predictors. Women were more likely to develop unfavorable frailty trajectories. Previous studies have also found that biological differences (25) and the effects of gender inequality (26) can exacerbate the frailty process for women. Therefore, more attention and health intervention should be devoted to women. Loneliness, sleep, and quality of life are interrelated and directly related to health (27). They all contributed to frailty development in this study, which is consistent with previous research findings (16, 28, 29). Our study also showed that cognitive impairment was associated with an increased risk of frailty progression. It is plausible that cognitive decline and frailty have a common underlying pathology (30). The International Academy on Nutrition and Aging (IANA) and the International Association of Gerontology and Geriatrics (IAGG) defined the simultaneous presence of cognitive impairment and physical frailty as cognitive frailty (31). Regular frailty assessments are recommended for healthcare professionals during disease management of patients with cognitive impairment. On the other hand, cognitively stimulating activities, such as social activities and consumption of intellectually stimulating media, may keep the brain active and reduce the risk of frailty (32, 33).
Furthermore, smoking (34), physical inactivity (35), and obesity (36) were possible risk factors of frailty progression. The rapid progression of frailty with advanced age is associated with increasing physiological dysregulation (37). Specifically, smoking and obesity independently contribute to the dysregulation of inflammatory and metabolic processes, while physical activities improve the function of physiological systems, including muscle, endocrine, and inflammation. These findings underscore the importance of early interventions targeting modifiable lifestyle factors to prevent or slow the deterioration of frailty in aging populations. Lastly, our results demonstrated that the risk of frailty trajectories also involved experiences during early life stages. Consistent with life course theory which posits that childhood conditions can have long-term health consequences, prior studies have reported a positive association between childhood adversity and frailty (38). Notably, other study suggests that older women who received prompt medical care during childhood illness are less likely to experience limitations in daily activities (39). Thus, it is necessary to promote child protection and life course interventions (40).
Besides, a comparative analysis of the two trajectory models reveals both their differences and similarities in risk profiles. Notably, behavior risk factors such as smoking, obesity, and physical inactivity were significant only in the medium-stable nomogram model, suggesting a lifestyle-sensitive path of frailty progression. This finding is consistent with previous studies highlighting the role of modifiable health behaviors in the early stages of frailty (41–43). In contrast, the low-rapid nomogram model did not include these lifestyle variables but still retained cognitive and psychosocial vulnerabilities, possibly reflecting a more biologically driven or less modifiable process (44–46). These differences underscore the heterogeneity in frailty development and suggest that interventions should be tailored accordingly.
Currently, there are relatively few literatures on prediction models of frailty trajectories. More research focused on frailty transition and its risk prediction, with generally short follow-up times (47–51). Using frailty scores at two time points as a criterion for assessing frailty development may fail to capture the longitudinal trajectory and the heterogeneity in frailty progression during follow-up. Besides, there were no internal or external validation of the prediction models of frailty trajectories in some studies (8, 52, 53). Thus, the applicability and generalization of these models in the community population were unknown. For instance, Miao et al. (54) constructed a nomogram for predicting the heterogeneous frailty trajectories among older adults with gastric cancer. However, there was no external validation. In addition, the authors combined two totally different anomalous frailty trajectories for a unified analysis, which would affect the model precision.
Our research has the following advantages. Firstly, frailty trajectories provide more predictive value than frailty states as frailty is a dynamic condition that changes over time. Secondly, we transformed the predictive models into nomograms (including dynamic online nomograms) to quickly calculate the occurrence probability of an individual’s frailty trajectory. Thirdly, external validation was performed using a different set of data with relatively satisfactory results, suggesting that our nomogram models can be generally applied among community-dwelling older adult in China. Fourthly, the identified predictors are easily accessible.
However, some limitations need to be acknowledged. First of all, due to the long observation period of this study, a substantial number of participants who were lost to follow-up or died were excluded, which may have led to an underestimation of frailty levels in Chinese older adults. Besides, most variables and frailty-related indicators were obtained by self-report and there may be information bias. Moreover, predictors cannot explain actual causality. Further empirical studies should be conducted. Last, the discrimination of the “low-rapid” nomogram needs to be improved compared to the “medium-stable” nomogram. And more methods including machine learning methods can be applied to construct the predictive model for better results.
5 Conclusion
This study developed and validated two nomogram model for predicting distinct frailty progression trajectories in Chinese older adults. The medium-stable nomogram model and low-rapid nomogram model included eleven and six predictors, respectively. Both models showed acceptable to excellent discriminative performance, with C-index values ranging from 0.62 to 0.86 in internal and external validation. These models can be used for risk assessment to make individualized intervention strategies. Further studies are needed to confirm their efficacy in reducing the risk of frailty progression.
Data availability statement
Publicly available datasets were analyzed in this study. This data can be found at: CLHLS (https://opendata.pku.edu.cn/dataverse/CHADS) and CHARLS (https://charls.charlsdata.com/pages/data/111/zh-cn.html).
Ethics statement
Ethical review and approval was not required for the study on human participants in accordance with the local legislation and institutional requirements. Written informed consent from the [patients/ participants OR patients/participants legal guardian/next of kin] was not required to participate in this study in accordance with the national legislation and the institutional requirements.
Author contributions
JD: Methodology, Writing – review & editing, Conceptualization, Software, Writing – original draft. FY: Data curation, Writing – original draft. MZ: Data curation, Writing – original draft. JZ: Formal Analysis, Writing – original draft. TD: Methodology, Supervision, Writing – review & editing. QS: Conceptualization, Writing – review & editing. JY: Conceptualization, Funding acquisition, Writing – review & editing. YW: Methodology, Supervision, Writing – review & editing.
Funding
The author(s) declare that financial support was received for the research and/or publication of this article. This study was supported in part by grants from the National Science Foundation of China (No. 32270186) and the Huadong Medicaine Joint Funds of the Zhejiang Provincial Natural Science Foundation (No. LHDMZ24H040001).
Acknowledgments
We sincerely thank all the staff and participants in the CLHLS and CHARLS projects for their outstanding contributions.
Conflict of interest
The authors declare that the research was conducted in the absence of any commercial or financial relationships that could be construed as a potential conflict of interest.
Generative AI statement
The authors declare that no Gen AI was used in the creation of this manuscript.
Publisher’s note
All claims expressed in this article are solely those of the authors and do not necessarily represent those of their affiliated organizations, or those of the publisher, the editors and the reviewers. Any product that may be evaluated in this article, or claim that may be made by its manufacturer, is not guaranteed or endorsed by the publisher.
Supplementary material
The Supplementary material for this article can be found online at: https://www.frontiersin.org/articles/10.3389/fpubh.2025.1588303/full#supplementary-material
Footnotes
References
1. Dent, E, Martin, FC, Bergman, H, Woo, J, Romero-Ortuno, R, and Walston, JD. Management of Frailty: opportunities, challenges, and future directions. Lancet. (2019) 394:1376–86. doi: 10.1016/s0140-6736(19)31785-4
2. Clegg, A, Young, J, Iliffe, S, Rikkert, MO, and Rockwood, K. Frailty in elderly people. Lancet. (2013) 381:752–62. doi: 10.1016/s0140-6736(12)62167-9
3. Hoogendijk, EO, Afilalo, J, Ensrud, KE, Kowal, P, Onder, G, and Fried, LP. Frailty: implications for clinical practice and public health. Lancet. (2019) 394:1365–75. doi: 10.1016/s0140-6736(19)31786-6
4. Fan, L, Hou, XY, Liu, Y, Chen, S, Wang, Q, and Du, W. Catastrophic health expenditure associated with frailty in community-dwelling Chinese older adults: a prospective cohort analysis. Front Public Health. (2021) 9:718910. doi: 10.3389/fpubh.2021.718910
5. Pinto Dias, AL, Pereira, FA, de Lima Barbosa, CP, de Nascimento Araujo-Monteiro, GK, dos Santos-Rodrigues, RC, and Souto, RQ. Fall risk and the frailty syndrome in older adults. Acta Paul Enferm. (2023) 36:eAPE006731. doi: 10.37689/acta-ape/2023AO006731
6. Chen, X, Giles, J, Yao, Y, Yip, W, Meng, Q, Berkman, L, et al. The path to healthy ageing in China: a Peking University-Lancet Commission. Lancet. (2022) 400:1967–2006. doi: 10.1016/S0140-6736(22)01546-X
7. Lang, PO, Michel, JP, and Zekry, D. Frailty syndrome: a transitional state in a dynamic process. Gerontology. (2009) 55:539–49. doi: 10.1159/000211949
8. Yafei, W, Maoni, J, Chaoyi, X, and Ya, F. Latent trajectories of frailty and risk prediction models among geriatric community dwellers: an interpretable machine learning perspective. BMC Geriatr. (2022) 22:900. doi: 10.1186/S12877-022-03576-5
9. Du, J, Zhang, M, Zeng, J, Han, J, Duan, T, Song, Q, et al. Frailty trajectories and determinants in Chinese older adults: a longitudinal study. Geriatr Nurs. (2024) 59:131–8. doi: 10.1016/j.gerinurse.2024.06.015
10. Hwang, A-C, Lee, W-J, Huang, N, Chen, L-Y, Peng, L-N, Lin, M-H, et al. Longitudinal changes of frailty in 8 years: comparisons between physical frailty and frailty index. BMC Geriatr. (2021) 21:726. doi: 10.1186/s12877-021-02665-1
11. Marcucci, M, Damanti, S, Germini, F, Apostolo, J, Bobrowicz-Campos, E, Gwyther, H, et al. Interventions to prevent, delay or reverse frailty in older people: a journey towards clinical guidelines. BMC Med. (2019) 17:193. doi: 10.1186/s12916-019-1434-2
12. Balachandran, VP, Gonen, M, Smith, JJ, and DeMatteo, RP. Nomograms in oncology: more than meets the eye. Lancet Oncol. (2015) 16:e173–80. doi: 10.1016/s1470-2045(14)71116-7
13. Goodkind, D, and Poston, DL Jr. Healthy longevity in China: demographic, socioeconomic, and psychological dimensions. Popul Stud-J Demogr. (2009) 63:312–3. doi: 10.1080/00324720903216903
14. Zhao, YH, Hu, YS, Smith, JP, Strauss, J, and Yang, GH. Cohort profile: the China health and retirement longitudinal study (Charls). Int J Epidemiol. (2014) 43:61–8. doi: 10.1093/ije/dys203
15. Yan, Y, Cai, L, and Lu, N. Childhood experiences and frailty trajectory among middle-aged and older adults in China. Eur J Ageing. (2022) 19:1601–15. doi: 10.1007/s10433-022-00746-7
16. Sha, S, Xu, Y, and Chen, L. Loneliness as a risk factor for frailty transition among older Chinese people. BMC Geriatr. (2020) 20:300. doi: 10.1186/s12877-020-01714-5
17. Friedman, J, Hastie, T, and Tibshirani, R. Regularization paths for generalized linear models via coordinate descent. J Stat Softw. (2010) 33:1–22. doi: 10.18637/jss.v033.i01
18. Kheir, GB, Khaldi, A, Karam, A, Duquenne, L, and Preiser, J-C. A dynamic online nomogram predicting severe vitamin D deficiency at ICU admission. Clin Nutr. (2021) 40:5383–90. doi: 10.1016/j.clnu.2021.08.024
19. Yang, J, Pan, Z, Zhou, Q, Liu, Q, Zhao, F, Feng, X, et al. Nomogram for predicting the survival of patients with malignant melanoma: a population analysis. Oncol Lett. (2019) 18:3591–8. doi: 10.3892/ol.2019.10720
20. Lyu, H, and Jiang, W. Development and internal and external validation of a nomogram model for frailty risk among hospitalised older people using comprehensive geriatric assessment data. BMC Geriatr. (2023) 23:712. doi: 10.1186/s12877-023-04426-8
21. Zhou, Z-R, Wang, W-W, Li, Y, Jin, K-R, Wang, X-Y, Wang, Z-W, et al. In-depth Mining of Clinical Data: the construction of clinical prediction model with R. Ann Trans Med. (2019) 7:796. doi: 10.21037/atm.2019.08.63
22. R Core Team. R: A language and environment for statistical computing. R Foundation for Statistical Computing, Vienna, Austria. (2021). URL: https://www.R-project.org
23. Hsu, HC, and Chang, WC. Trajectories of frailty and related factors of the older people in Taiwan. Exp Aging Res. (2015) 41:104–14. doi: 10.1080/0361073x.2015.978219
24. Beckman, KB, and Ames, BN. The free radical theory of aging matures. Physiol Rev. (1998) 78:547–81. doi: 10.1152/physrev.1998.78.2.547
25. Lannuzzi Sucich, M, Prestwood, KM, and Kenny, AM. Prevalence of sarcopenia and predictors of skeletal muscle mass in healthy, older men and women. J Gerontol A Biol Sci Med Sci. (2002) 57:772–7. doi: 10.1093/gerona/57.12.M772
26. Wang, HY, Zhang, M, and Sun, X. Sex-specific association between socioeconomic status, lifestyle, and the risk of frailty among the ederly in China. Front Med. (2021) 8:775518. doi: 10.3389/fmed.2021.775518
27. Delgado-Losada, ML, Bouhaben, J, Arroyo-Pardo, E, Aparicio, A, and Lopez-Parra, AM. Loneliness, depression, and genetics in the elderly: prognostic factors of a worse health condition? Int J Environ Res Public Health. (2022) 19:15456. doi: 10.3390/ijerph192315456
28. Lorber, M, Kmetec, S, Davey, A, Mlinar Reljic, N, Fekonja, Z, and Kegl, B. Associations between sleep quality, frailty, and quality of life among older adults in community and nursing home settings. Int J Environ Res Public Health. (2023) 20:4937. doi: 10.3390/ijerph20064937
29. Nemoto, Y, Sato, S, Kitabatake, Y, Nakamura, M, Takeda, N, Maruo, K, et al. Bidirectional relationship between insomnia and frailty in older adults: a 2-year longitudinal study. Arch Gerontol Geriatr. (2021) 97:104519. doi: 10.1016/j.archger.2021.104519
30. Buchman, AS, Yu, L, Wilson, RS, Boyle, PA, Schneider, JA, and Bennett, DA. Brain pathology contributes to simultaneous change in physical frailty and cognition in old age. J Gerontol A Biol Sci Med Sci. (2014) 69:1536–44. doi: 10.1093/gerona/glu117
31. Kelaiditi, E, Cesari, M, Canevelli, M, Van Kan, GA, Ousset, PJ, Gillette-Guyonnet, S, et al. Cognitive frailty: rational and definition from an (IANA/IAGG) international consensus group. J Nutr Health Aging. (2013) 17:726–34. doi: 10.1007/s12603-013-0367-2
32. Howrey, BT, Al Snih, S, Middleton, JA, and Ottenbacher, KJ. Trajectories of frailty and cognitive decline among older Mexican Americans. J Gerontol A Biol Sci Med Sci. (2020) 75:1551–7. doi: 10.1093/gerona/glz295
33. Jürschik, P, Nunin, C, Botigué, T, Escobar, MA, Lavedán, A, and Viladrosa, M. Prevalence of frailty and factors associated with frailty in the elderly population of Lleida, Spain: the Fralle survey. Arch Gerontol Geriatr. (2012) 55:625–31. doi: 10.1016/j.archger.2012.07.002
34. Chamberlain, AM, St Sauver, JL, Jacobson, DJ, Manemann, SM, Fan, C, Roger, VL, et al. Social and behavioural factors associated with frailty trajectories in a population-based cohort of older adults. BMJ Open. (2016) 6:e011410. doi: 10.1136/bmjopen-2016-011410
35. McPhee, JS, French, DP, Jackson, D, Nazroo, J, Pendleton, N, and Degens, H. Physical activity in older age: perspectives for healthy ageing and frailty. Biogerontology. (2016) 17:567–80. doi: 10.1007/s10522-016-9641-0
36. Sun, Q, Xia, X, and He, F. Longitudinal association between body mass index (Bmi), Bmi trajectories and the risk of frailty among older adults: a systematic review and Meta-analysis of prospective cohort studies. Arch Gerontol Geriatr. (2024) 124:105467. doi: 10.1016/j.archger.2024.105467
37. Fried, LP, Tangen, CM, Walston, J, Newman, AB, Hirsch, C, Gottdiener, J, et al. Frailty in older adults: evidence for a phenotype. J Gerontol A Biol Sci Med Sci. (2001) 56:M146–57. doi: 10.1093/gerona/56.3.M146
38. Mian, O, Anderson, LN, Belsky, DW, Gonzalez, A, Ma, J, Sloboda, DM, et al. Associations of adverse childhood experiences with frailty in older adults: a cross-sectional analysis of data from the Canadian longitudinal study on aging. Gerontology. (2022) 68:1091–100. doi: 10.1159/000520327
39. Kuh, D. A life course approach to healthy aging, frailty, and capability. J Gerontol A Biol Sci Med Sci. (2007) 62:717–21. doi: 10.1093/gerona/62.7.717
40. Yang, G, Cao, X, Yu, J, Li, X, Zhang, L, Zhang, J, et al. Association of childhood adversity with frailty and the mediating role of unhealthy lifestyle: a lifespan analysis. Am J Geriatr Psychiatry. (2024) 32:71–82. doi: 10.1016/j.jagp.2023.08.015
41. Yuan, L, Chang, M, and Wang, J. Abdominal obesity, body mass index and the risk of frailty in community-dwelling older adults: a systematic review and Meta-analysis. Age Ageing. (2021) 50:1118–28. doi: 10.1093/ageing/afab039
42. Liu, S, Pan, X, Chen, B, Zeng, D, Xu, S, Li, R, et al. Association between healthy lifestyle and frailty in adults and mediating role of weight-adjusted waist index: results from Nhanes. BMC Geriatr. (2024) 24:757. doi: 10.1186/s12877-024-05339-w
43. Gu, Y, Li, Z, Dang, A, Zhang, W, Liu, J, Han, X, et al. Obesity, birth weight, and lifestyle factors for frailty: a Mendelian randomization study. Aging (Albany NY). (2023) 15:14066–85. doi: 10.18632/aging.205290
44. Robertson, DA, Savva, GM, and Kenny, RA. Frailty and cognitive impairment--a review of the evidence and causal mechanisms. Ageing Res Rev. (2013) 12:840–51. doi: 10.1016/j.arr.2013.06.004
45. Jang, AR, Sagong, H, and Yoon, JY. Frailty trajectory among community-dwelling middle-aged and older adults in Korea: evidence from the Korean longitudinal study of aging. BMC Geriatr. (2022) 22:524. doi: 10.1186/s12877-022-03229-7
46. Yuan, YY, Peng, CM, Burr, JA, and Lapane, KL. Frailty, cognitive impairment, and depressive symptoms in Chinese older adults: an eight-year multi-trajectory analysis. BMC Geriatr. (2023) 23:843. doi: 10.1186/s12877-023-04554-1
47. Jung, H, Kim, M, Won, CW, Kim, J, and Mun, K-R. Machine learning-based classification and risk factor analysis of frailty in Korean community-dwelling older adults. Annu Int Conf IEEE Eng Med Biol Soc. (2023) 2023:1–4. doi: 10.1109/embc40787.2023.10340229
48. Mielke, N, Schneider, A, Huscher, D, Ebert, N, and Schaeffner, E. Gender differences in frailty transition and its prediction in community-dwelling old adults. Sci Rep. (2022) 12:7341. doi: 10.1038/s41598-022-11358-7
49. Pincombe, A, Afzali, HHA, Visvanathan, R, and Karnon, J. Development and validation of an individual-based state-transition model for the prediction of frailty and frailty-related events. PLoS One. (2023) 18:e0290567. doi: 10.1371/journal.pone.0290567
50. Tan, V, Thuy Thanh, L, and Tu Ngoc, N. A pilot study of the clinical frailty scale to predict frailty transition and readmission in older patients in Vietnam. Int J Environ Res Public Health. (2020) 17:1582. doi: 10.3390/ijerph17051582
51. Dong, B-R, Gu, X-Q, Chen, H-Y, Gu, J, and Pan, Z-G. Development and validation of a nomogram to predict frailty progression in nonfrail Chinese community-living older adults. J Am Med Dir Assoc. (2021) 22:2571. doi: 10.1016/j.jamda.2021.05.020
52. Pu, J, Zhou, W, Zeng, W, and Shang, S. Long-term trajectories of frailty phenotype in older Cancer survivors: a nationally representative longitudinal cohort study. Age Ageing. (2023) 52:afad 190. doi: 10.1093/ageing/afad190
53. Taniguchi, Y, Kitamura, A, Hata, T, Fujita, K, Abe, T, Nofuji, Y, et al. Frailty trajectories and its associated factors in Japanese older adults. J Frailty Aging. (2024) 13:233–9. doi: 10.14283/jfa.2024.51
Keywords: frailty, trajectory, nomogram, prediction, validation
Citation: Du J, Ye F, Zhang M, Zeng J, Duan T, Song Q, Yang J and Wu Y (2025) Development and validation of nomograms to predict frailty-worsening trajectories among Chinese older adults. Front. Public Health. 13:1588303. doi: 10.3389/fpubh.2025.1588303
Edited by:
Klara Komici, University of Molise, ItalyReviewed by:
Mohammad Saiful Islam, Bangladesh Livestock Research Institue, BangladeshWei Wu, Hubei University of Chinese Medicine, China
Copyright © 2025 Du, Ye, Zhang, Zeng, Duan, Song, Yang and Wu. This is an open-access article distributed under the terms of the Creative Commons Attribution License (CC BY). The use, distribution or reproduction in other forums is permitted, provided the original author(s) and the copyright owner(s) are credited and that the original publication in this journal is cited, in accordance with accepted academic practice. No use, distribution or reproduction is permitted which does not comply with these terms.
*Correspondence: Jun Yang, Z2FzdGF0ZUB6anUuZWR1LmNu; Yinyin Wu, MjAxMTAxMDZAaHpudS5lZHUuY24=
†These authors share first authorship
 Jiaolan Du1†
 Jun Yang
 Yinyin Wu