 Pradeep Kumar1,2†
 Rajeev Singh1,3*†
- 1Department of Environmental Studies, Satyawati College, University of Delhi, New Delhi, India
- 2Department of Agricultural and Biosystems Engineering, South Dakota State University, Brookings, SD, United States
- 3Department of Environmental Science, Jamia Millia Islamia, New Delhi, India
Indoor air quality plays a crucial role in the health and well-being of residents. Delhi, known as one of the most polluted cities globally, often receives insufficient attention in managing and mitigating related health impacts. This study isolated, characterized, and assessed microbial indoor air quality (bioaerosols) using multiproxy approaches and correlated findings with associated health effects. The spatial variation of bacterial aerosols showed irregular patterns, increasing from winter to summer and decreasing in fall; fungal aerosols consistently increased from winter to fall. Bacterial aerosol concentrations ranged from 730 to 5,300 CFU/m3, while fungal concentrations were between 1,330 and 6,050 CFU/m3, significantly exceeding the recommended limits. The size distribution of fungal aerosols varied across seasons, with higher concentrations in the 4th and 5th stages of the sampler. Several airborne bacterial and fungal genera, including Staphylococcus, Streptococcus, Micrococcus, Aspergillus, Penicillium, and Cladosporium, were identified in homes. Health effects were most pronounced in winter followed by fall, with symptoms such as headaches, eye irritation, allergic rhinitis, coughing, and sneezing being common. As per this study, there may be a correlation between indoor bioaerosol concentrations, seasonal variations, and health outcomes, though further in-depth in vitro, exposure assessment, and epidemiological studies are necessary to substantiate these findings.
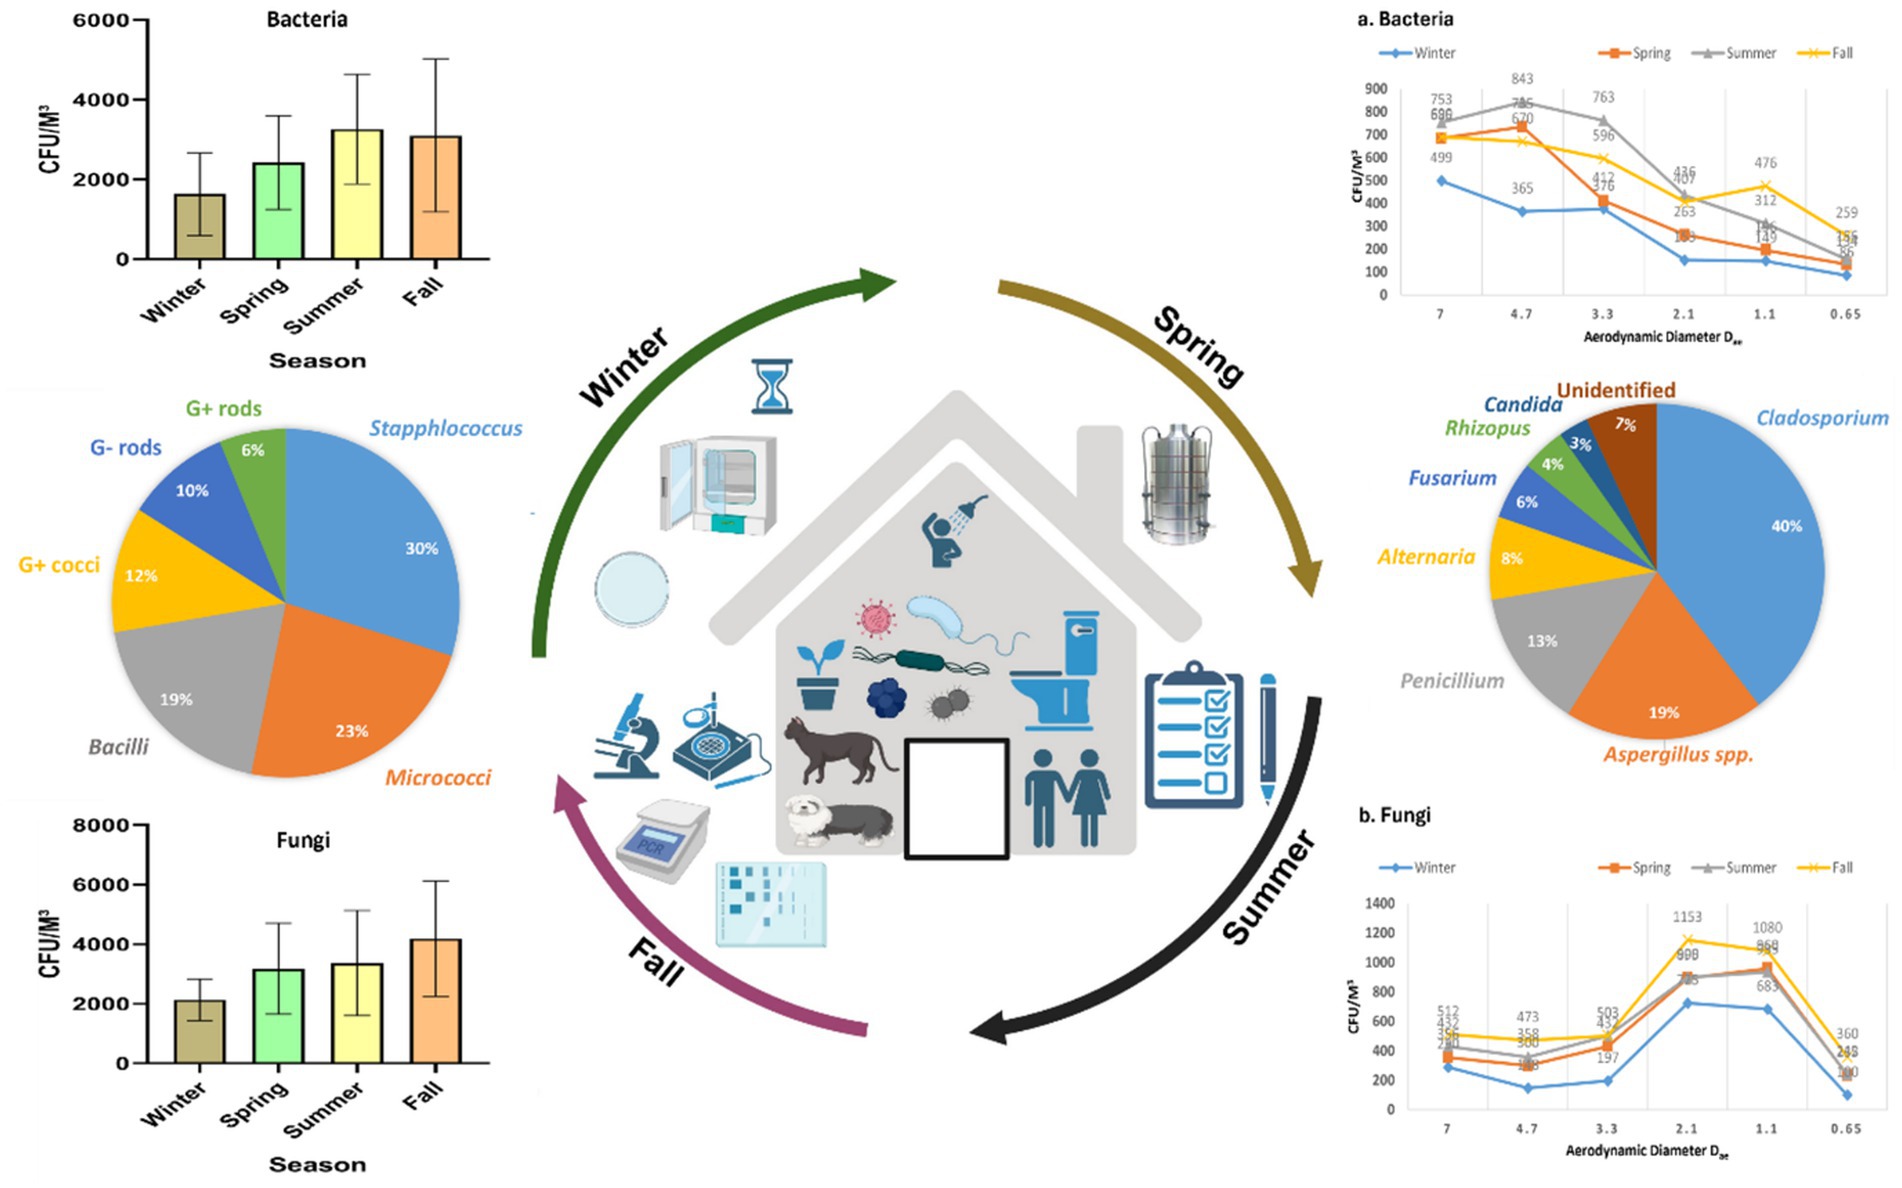
Graphical Abstract.
1 Introduction
Bioaerosols are airborne particles of biological origin, including both pathogenic and non-pathogenic bacteria, fungal spores, viruses, and droplets released during human activities such as coughing and sneezing. With increasing awareness of the potential dangers posed by biological agents, there is growing concern regarding bioaerosol exposure, particularly in confined environments. This exposure can significantly impact both individual and public health, contributing to conditions such as allergies, asthma, respiratory infections, and even cancer (1–6, 59).
Numerous research studies have indicated that bioaerosol concentrations play a significant role in the onset of indoor allergies, asthma, bronchitis, laryngitis, and other respiratory health issues (3, 7–9, 59). Among airborne microorganisms, fungi such as Aspergillus, Curvularia, and Fusarium are more likely to trigger respiratory allergies and asthma than bacteria (10). Additionally, respirable bioaerosol particles smaller than 2.5 microns can penetrate deep into the alveoli, leading to potential long-term health consequences (11).
Given that people spend nearly 90% of their time indoors, poor indoor air quality can have an even greater impact on health compared to outdoor air pollution (8). Communities near industrial sites may be at greater risk due to elevated levels of pollutants, including bioaerosols, which contribute to various health problems. Variations in indoor air pollutants such as formaldehyde, total volatile organic compounds (TVOCs), and particulate matter (PM) have been associated with respiratory, digestive, skin, eye, and ear-related health issues, particularly among workers and students in poorly ventilated environments (12, 59). Overcrowded residential areas with inadequate ventilation further exacerbate these health risks.
Bioaerosol concentrations can range from a few colony-forming units (CFU) per cubic meter in typical residential environments to billions (109 CFU/m3) near waste disposal sites. These concentrations fluctuate with seasonal changes, which in turn influence bioaerosol abundance, diversity, viability, and community composition. Meteorological factors such as temperature, humidity, and wind speed also play a critical role in bioaerosol dispersion and persistence (58).
To mitigate the risks associated with indoor bioaerosol exposure, several national and international organizations have established guidelines or recommendations for acceptable bioaerosol concentrations (13, 14). For instance, the World Health Organization (WHO) has recommended that fungal bioaerosol levels in residential areas should not exceed 500 CFU/m3 (14). The China Centers for Disease Control and Prevention set a limit of 2,500 CFU/m3 for bioaerosol concentrations in homes, while the American Conference of Governmental Industrial Hygienists (ACGIH) established a safe threshold of 1,000 CFU/m3 for fungal bioaerosols (15, 53). In South Korea, the Ministry of Environment mandates limits of 800 CFU/m3 for bacterial aerosols and 500 CFU/m3 for fungal aerosols in healthcare and daycare facilities where immunocompromised individuals are present (7, 16). However, existing regulations focus solely on bioaerosol concentration without accounting for their size, which significantly influences health risks. Bioaerosols can range in size from a few nanometers to over 100 micrometers, with PM2.5 and PM10 being particularly relevant categories for respiratory exposure (17).
Airborne microorganisms are small enough to bypass inertial filtration in the upper airways and can reach the alveolar region of the lungs, leading to potential health hazards (18–20). While bioaerosol standards and concentration guidelines provide a framework for assessing contamination levels, evaluating their actual health risks remains a challenge (7, 21).
In Delhi, India, a unique study is being conducted to investigate the health effects of biological and non-biological indoor air pollutants. This study aims to assess the seasonal variation in bioaerosols in residential houses with poor ventilation and facilities, correlating microbial concentration with observed health effects. The findings from this study will provide valuable insights into the impact of indoor air quality on human health, highlighting the need for improved regulatory measures and mitigation strategies.
2 Materials and methods
2.1 Sites location and description
This study was carried out in Delhi, the capital of India, which ranks among the most densely populated cities globally. Situated between the states of Uttar Pradesh and Haryana, Delhi is divided by the Yamuna River and features the Aravali hill ranges. The city experiences a warm, semi-arid climate with subtropical humidity and dry winters. According to IQAIR’s 2024 report, Delhi was the third most polluted city in the world in 2023 (57). This study was conducted throughout all four seasons- winter, spring, summer, and fall to assess the impact of poor air quality on human health. The research focused on densely populated areas, specifically the slum regions near Ashok Vihar and Azadpur in North Delhi. The selected houses for sampling were predominantly overcrowded, poorly ventilated, and lacked proper hygiene. The houses surveyed exhibited substantial variation in size, with room dimensions ranging from less than 100 square feet to significantly larger spaces. The average household occupancy was approximately six people. A total of 336 houses were sampled, with 84 houses assessed in each season. The typical floor plan consisted of one to two multifunctional rooms that served as both bedroom and living space, accompanied by a kitchen and a bathroom. Most dwellings were one to two stories in height. Natural ventilation through windows was the primary mode of air exchange in the majority of homes. Mechanical ventilation systems were largely absent during the field survey and air sampling period. Although direct measurements of air changes per hour (ACH) were not conducted, observational evidence indicated considerable limitations in natural ventilation, such as obstructed or sealed windows and inadequate cross-ventilation, which likely contributed to compromised indoor air quality. Visible and olfactory signs of dampness and mold were frequently noted across numerous dwellings. Furthermore, most houses did not contain indoor pets or plants, reducing additional sources of biological variation in indoor air quality.
2.2 Biological sampling details
For bacterial aerosols, Tryptic Soy Agar (HiMedia, India) supplemented with Cycloheximide (an antifungal agent) was employed, while for fungal aerosols, Sabouraud Dextrose Agar (SDA) (HiMedia, India) supplemented with Rose Bengal Dye (an antibacterial agent) was used for sampling and culturing. Prior to sampling, various culture media were evaluated for their effectiveness in collecting indoor bioaerosols, and the selected media proved most suitable for supporting the growth of a wide range of indoor culturable bioaerosols. Biological air sampling was conducted using an Andersen Six-Stage Impactor (Tisch Environmental, USA) operating at an airflow rate of 28.3 L/min. For each sampling session, six sterile 90 mm petri plates containing the specified culture media were prepared. Sampling durations were calibrated and determined in advance based on the characteristics of each sampling site. Furthermore, the sampler was used at an inhaling level of 1.5 m. After aseptic exposure, the plates were transferred to the laboratory, incubated, and the colony growth was quantified using a colony counter to determine the colony-forming units (CFU). Bacterial petri plates were incubated at 37°C for 1 to 3 days, whereas fungal plates were incubated at 28°C for 1 to 2 weeks. Growing colonies were measured and reported using colony-forming units (CFUs) per cubic meter of air. Overview of the bioaerosol sampling methodology is depicted in (Figure 1). The following formula was used to determine CFU/m3 in current study (3).
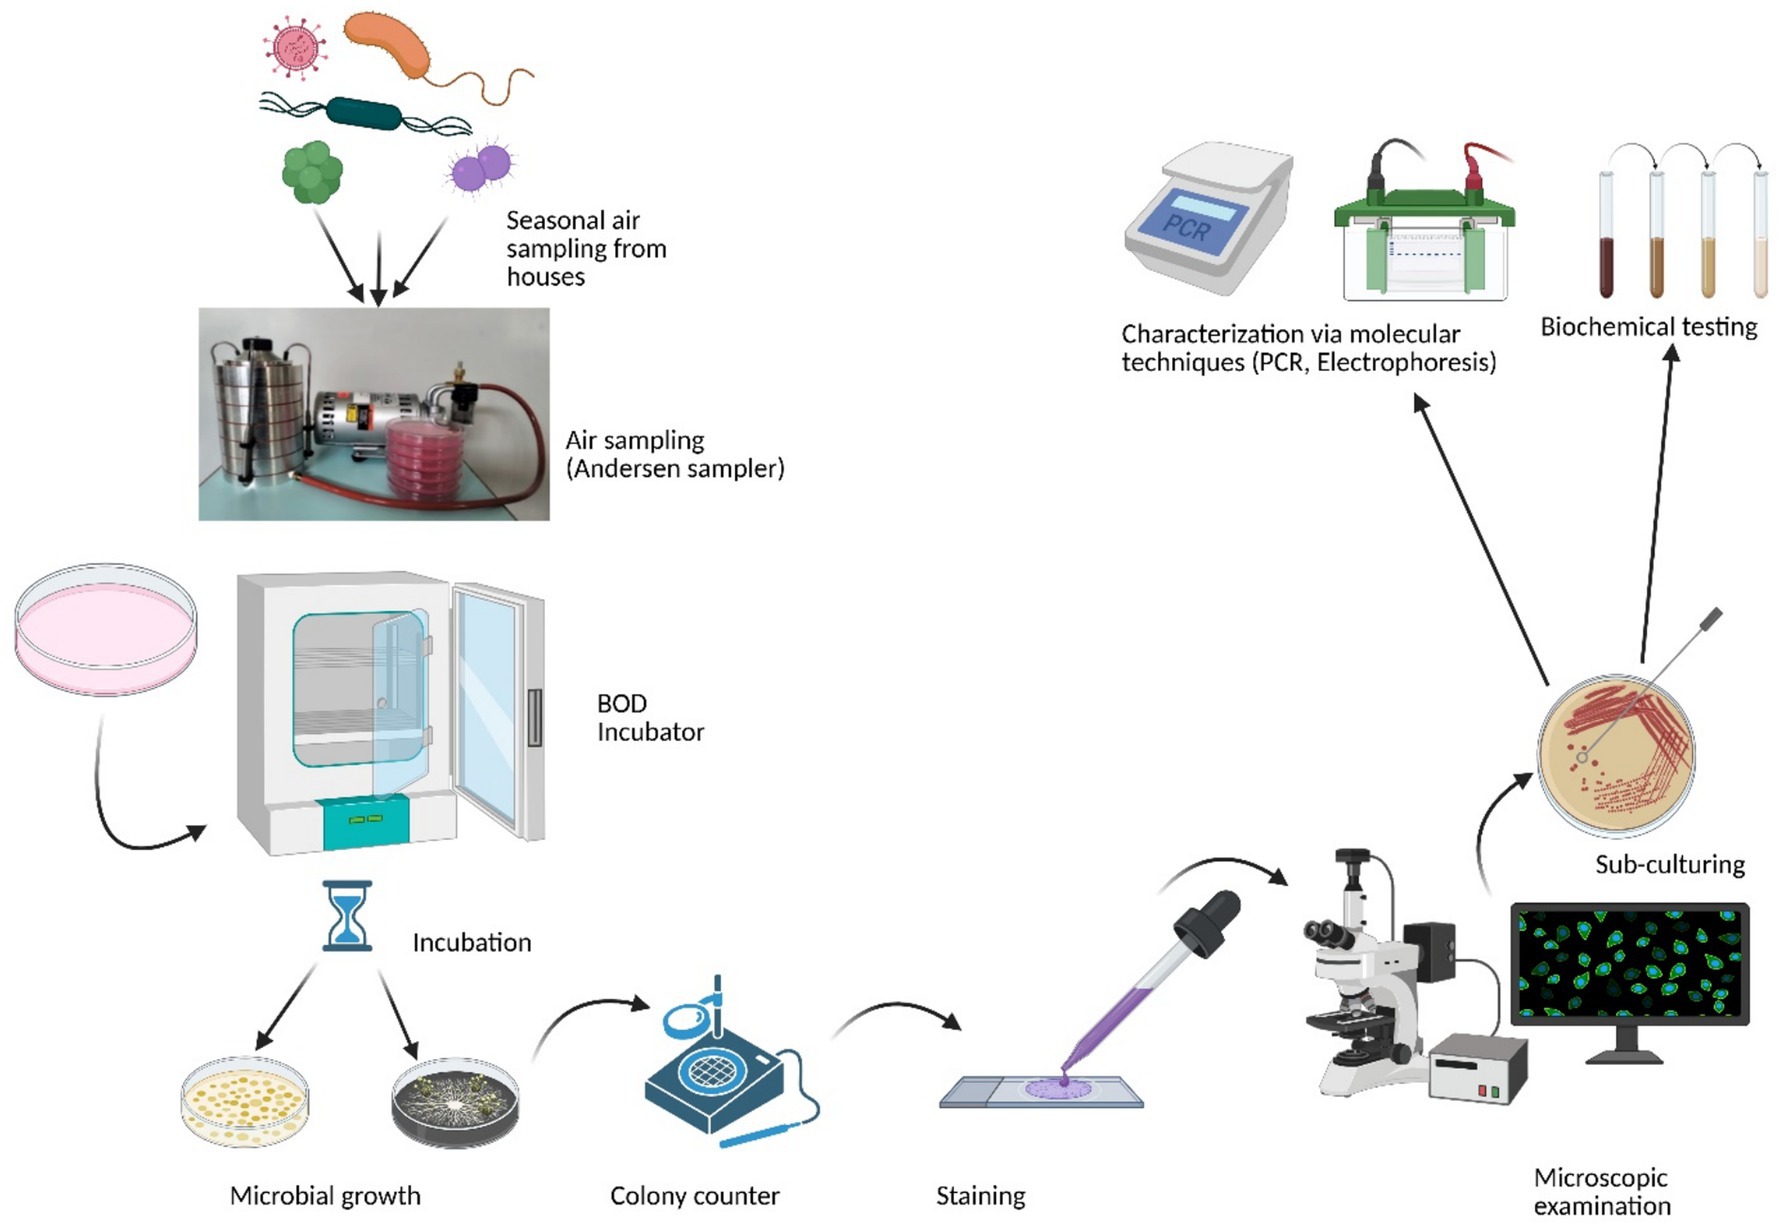
Figure 1. Simplified overview of the methodology used for bioaerosol sampling and analysis (Created with BioRender.com).
The purpose of isolating and characterizing bioaerosols of different sizes was to investigate how airborne particles of varying sizes can infiltrate different segments of the human respiratory system (Figure 2). Andersen proposed that particles with a size of 7 μm or larger (1st stage) would adhere to the pre-separator, particles ranging from 4.7 to 7.0 μm (2nd stage) would be retained in the pharynx, particles measuring 3.3–4.7 μm (3rd stage) would settle in the trachea and primary bronchi, particles within the range of 3.3–2.1 μm (4th stage) would reach the secondary bronchi, particles of 2.1–1.1 μm (5th stage) would enter the terminal bronchi, and particles measuring 1.1–0.65 μm (6th stage) would ultimately reach the alveoli of the lungs (3, 22, 54, 59).
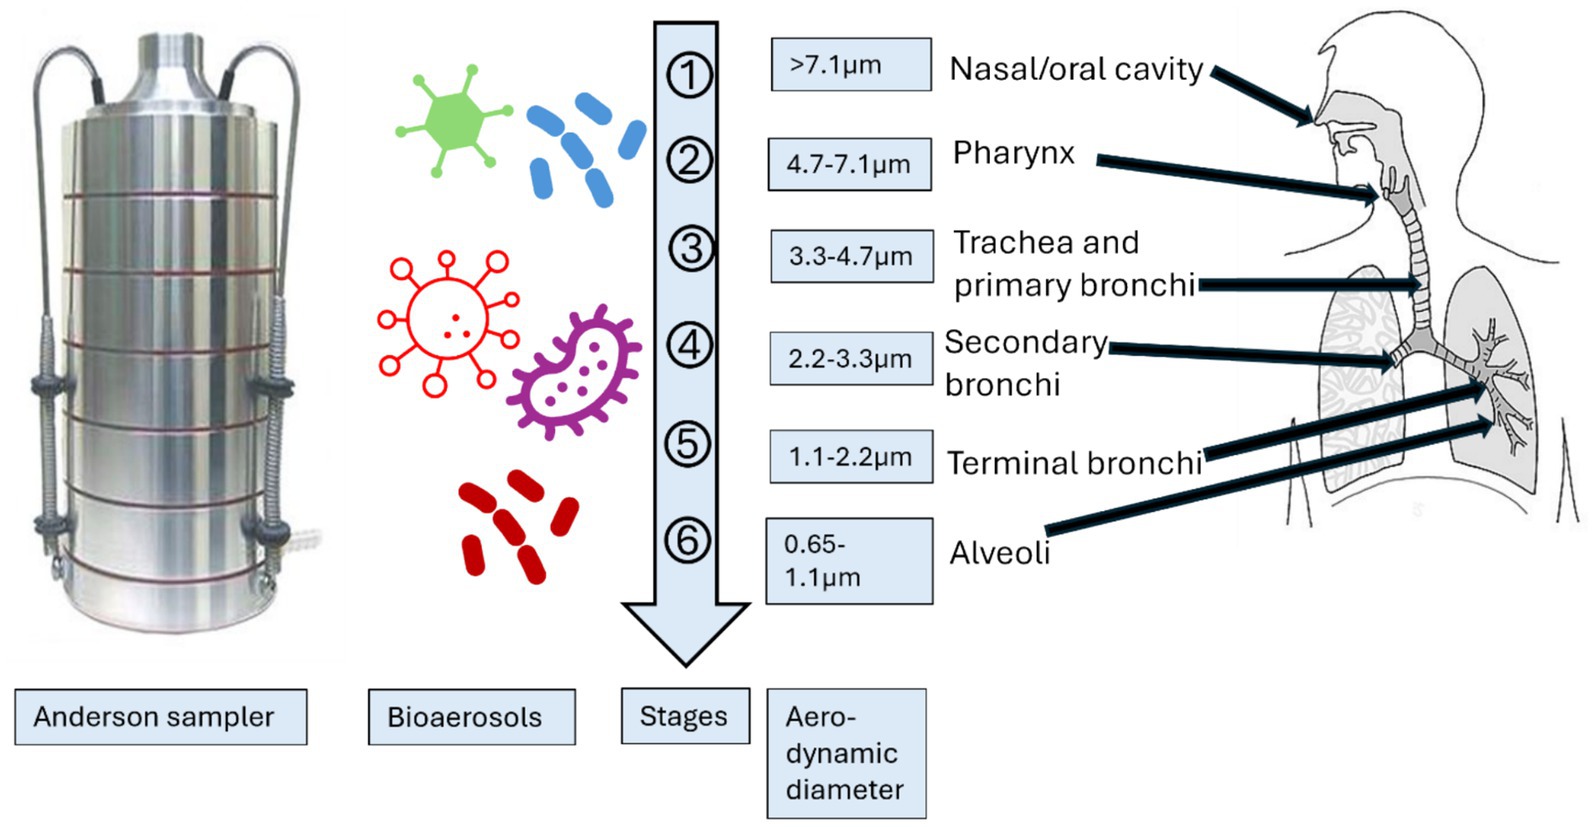
Figure 2. Schematic presentation of the comparison of size distribution of Andersen impactor with human respiratory system (54). (Created with BioRender.com).
2.3 Identification and quantification of bacterial and fungal aerosols
Following the successful collection and culture of bacterial and fungal aerosols, methods for identification were carried out. For instance, of bacteria, isolated samples were identified using gram staining, cell morphology, colony morphology, and other macrobiological and microbiological characteristics. These traits were then compared using Bergey’s Manual of Systematic Bacteriology. Initially, fungi were identified based on characteristics such as spores, color, shape, and patterns of colonies on petri plates. Later, lactophenol cotton stain was employed for fungal mounting and identification, following the recommendation of (23). Additionally, for fungi, the isolated fungal aerosols and pure cultures were sent to the Indian Agricultural Research Institute in Pusa, New Delhi, for precise identification. Additionally, fungal spores were recognized based on their shape by Campwell et al. (50) and The British Aerobiological Federation in 1995.
2.4 Biochemical characterization of the isolated bacterial samples
Due to the frequent detection of Gram-negative rods in indoor environments, several commercial multi-test kits have been analyzed to recognize members of the family Enterobacteriaceae and other harmful microbes. By applying the bacterial colony on a glass slide along with a drop of 3% H2O2, it was possible to determine if the isolates contained catalase. The appearance of bubbles was considered favorable, however their lack or a few dispersed bubbles were considered bad (24).
2.4.1 IMViC test
IMViC is a set of tests used to identify coliform group microorganisms. IMViC Test Kit (SRL Research Labs Pvt. Ltd.) was used to for the identification of the Gram-negative enteric bacteria which are involved in causing various bacterial diseases. The following test are included in IMViC test.
2.4.2 Indole test
Using Kovac’s and Ehrlich’s reagents, indole production is detected. Red color is produced when indole and the reagent’s aldehyde react (25, 26).
2.4.3 Methyl Red test
The Methyl Red test is used to confirm that enough acid is produced during the fermentation of glucose. A pH indicator called methyl red maintains its red hue at a pH of 4.4 or below. Pyruvic acid is originally created by all enterics through the metabolism of glucose. Some then convert pyruvic acid to other acids, such lactic, acetic, and formic acids, via the mixed acid route. Methyl-red positive bacteria are the ones in question. Later, other enterics metabolize pyruvic acid to neutral end products via the butylene glycol route (25, 26).
2.4.4 Voges Proskauer test
To demonstrate an organism’s capacity to convert pyruvate to acetoin, the Voges Proskauer test is utilized. Butylene glycol is produced via the intermediate acetyl-methyl carbinol (acetoin). Alpha-naphthol and 40% KOH are added to the test broth after incubation and exposure to ambient oxygen. If acetoin is present, it is converted to diacetyl in the presence of air and KOH. In the presence of alphanaphthol, dialdehyde then interacts with the guanidine components of peptone to generate red color. Alpha-naphthol plays the roles of a catalyst and an intensifier of color (25, 26).
2.4.5 Citrate utilization test
This test is designed to assess the microorganism’s capacity to utilize citrate as its only carbon source. Inorganic ammonium salts, which are used as the only source of nitrogen in the media, are present. Oxaloacetate and acetate result from the breakdown of citrate. Pyruvate and CO2 are produced after further breakdown of oxaloactetate. Alkaline pH is the consequence of the production of Na2CO3 and NH3 from the use of sodium citrate and ammonium salt, respectively. As a result, the medium’s hue changes from green to blue (25, 26).
2.5 Molecular analysis of samples (bacterial samples)
2.5.1 DNA extraction
Following the separation and preliminary macroscopic and microscopic identification of the bacteria, each distinctive in shape bacteria was separated into cultures, and the HiPura Bacterial genomic DNA purification Kit (Himedia) was used to extract the DNA from the bacteria.
2.5.2 PCR
In a real-time PCR (Thermo Fischer, USA), the universal bacterial 16S rDNA primers 27F (5′-AGA GTT TGA TCM TGG CTC AG-3′) and 1492R (5′-GGY TAC CTT GTT ACG ACT T-3′) were used to perform polymerase chain reaction (PCR). The reaction was conducted in a 25 μL mixture that contained 1.5 mM MgCl2 (Promega, USA), 0.4 μM of both forward and reverse primer, 0.1 mM of dNTP, 1 × Taq bufer (Thermo Fischer, USA), and one unit of Taq DNA polymerase (Thermo Fischer, USA). Initial denaturation was set at 94°C for 2 min. This was accompanied by 40 cycles of denaturation at 94°C for 1 min, annealing at 50°C for 1 min, elongation at 70°C for 2 min, and final extension at 70°C for 20 min in the thermo-cycle program.
2.5.3 Gel electrophoresis
Gel documentation method was used to visualize amplified DNA following electrophoresis in 1.5% agarose and using ethidium bromide staining. Amplicons were purified with a Himedia gel extraction kit. All the bands apparated on the gel were compared with the standard molecular size of the major airborne bacteria (27).
2.6 Meteorological and PM data monitoring
Metrological data was collected from Satyawati College Ashok Vihar Station, 110052, and the Ambient Air Quality Monitoring System of the Delhi Pollution Control Centre (DPCC) interior locations. Relative humidity (RH) (%), wind speed (WS), and temperature (°C) were measured, and their correlation with bioaerosol was ascertained.
2.7 Questionnaire survey
A health survey was conducted in the sampling areas using questionnaires with a structured set of questions. A single-stage random sampling procedure was used to choose participants from various locations. The purpose of the questionnaire form was to gather general and health-related data from participants. It was then authorized by Indian Council of Medical Research (ICMR) professionals in a relevant field. To that aim, the form is broken down into four sections. The first section includes demographic information such as name, residence, gender, and age, along with an informed consent form that includes general research details. The volunteer agreement and witness declaration are included in the next section of the form. The form’s next section, the “Indoor Air Quality Questionnaire,” is the most crucial one. It begins with some general information and includes 26 questions on allergies, general health impacts, past allergy medication use, and suggestions for better air quality. A total of 84 households were selected for the health survey and environmental sampling. Household selection followed a single-stage random sampling approach within the defined community clusters. On average, each household had approximately six residents, resulting in a total of 509 individuals who completed the health questionnaire. The response rate was effectively around 100%, as surveys were administered in person by trained research staff. Incomplete or unresponsive entries were excluded to ensure data accuracy. A brief overview of the questionnaire used in the study is provided below:
a) Demographic Information
Age, gender, date of birth, profession, contact details, and duration of residence.
b) Residential Exposure Assessment
• Duration of residence and time spent indoors.
• Subjective assessment of indoor air quality (good, average, poor).
• Proximity to potential pollution sources (industrial areas, water bodies, vacant land).
c) Health History and Symptoms
• Past and present diagnoses of respiratory or allergic conditions (e.g., asthma, bronchitis, allergic rhinitis).
• Frequency and timing of symptoms (e.g., seasonal vs. year-round, time of day).
• Symptom exacerbation due to environmental triggers (dust, mold, weather, pollutants, etc.).
d) Environmental and Lifestyle Factors
• Evidence of moisture/water leakage or renovation activities in the home.
• Lighting adequacy and ventilation quality.
• Occupational exposures or hobbies with potential for air pollutant contact (e.g., welding, auto-repair, farming).
e) Medication and Reproductive History
• Current medication use (e.g., antihistamines, decongestants).
• Childbirth-related outcomes include low birth weight, preterm birth, and neonatal mortality.
f) Workplace Environment Assessment
• Symptoms experienced in the workplace.
• Suspected causes of workplace-related symptoms.
• Observations and suggestions regarding workplace environmental conditions.
2.8 Statistical analysis
Statistical analysis and entry of questionnaires was performed using Epi info version 7 and Microsoft Excel. Significance of data (p-value) and odds ratio was also analyzed by using the same software. PAST software (v13), Microsoft Excel, and Prizm were used for analyzing the sampling data.
3 Results and discussion
3.1 Seasonal fluctuations in the overall concentration of bioaerosols
The time allocated for sampling was split into four seasons: winter (December to February), spring (March to May), summer (June to August), and fall (September to November). Concerning bacterial aerosols, the CFU/m3 concentration exhibited an upward trend from winter to summer, followed by a subsequent decline in the fall (Figures 3a, 3b). In contrast, fungal aerosol concentration displayed a distinct pattern. The graphical representation indicates a significant rise in fungal spore concentration from winter to spring, with a modest increase from spring to summer. Following this, there was a substantial surge in fungal concentration from summer onwards. It is noteworthy that the total CFU/m3 count was greater for fungal aerosols compared to bacterial aerosols. Bacterial aerosol levels varied from 730–5,300 CFU/m3, while fungal levels ranged between 1,330–6,050 CFU/m3 (Figures 3a, 3b). Pearson correlation matrix between different seasons and microbial concentrations (bacteria and fungi) is provided in Tables 1a,b. The highest levels of bacterial aerosols were observed in August, the final month of summer, as the increased temperature and humidity during this time fostered their growth. Winter had the lowest-ever recorded concentration of bacteria, possibly attributed to lower temperatures and a lack of ventilation. Like bacterial concentrations, it is presumed that fungal CFU levels were highest in the fall due to the favorable combination of temperature and humidity. Consistent with earlier findings from our laboratory, the conditions conducive to the growth of both fungi and bacteria are optimal during the fall season (3) (Table 1).
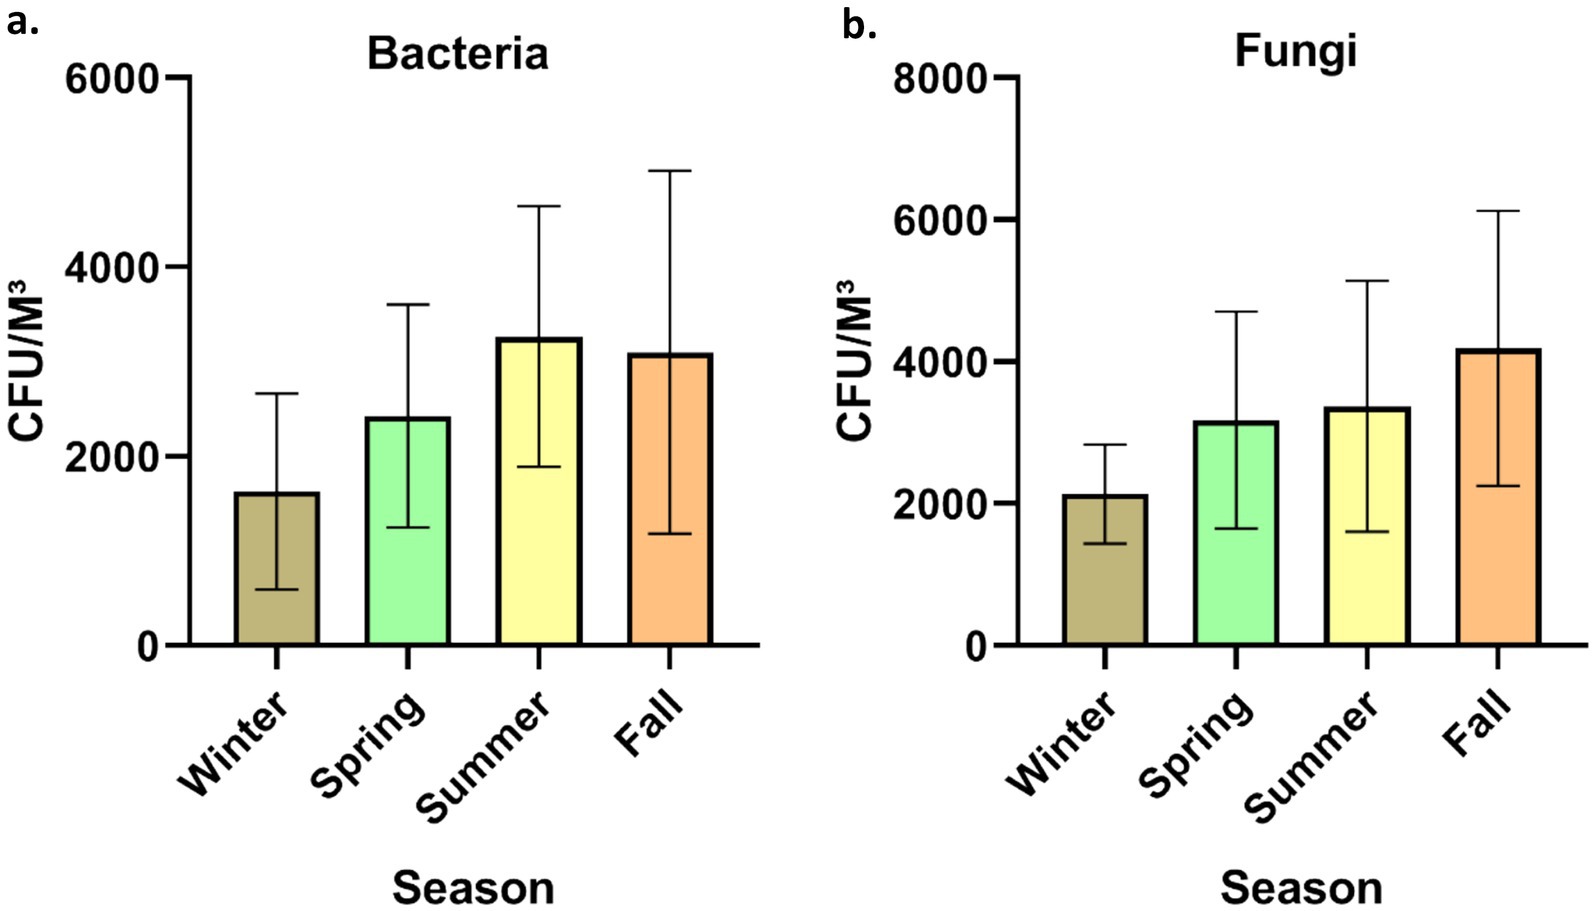
Figure 3. Seasonal concentration of culturable bioaerosols indoor places. (a) Bacteria (b) Fungi. n = 336 samples in all seasons (84 each season); Error bars represent SD of triplicates.
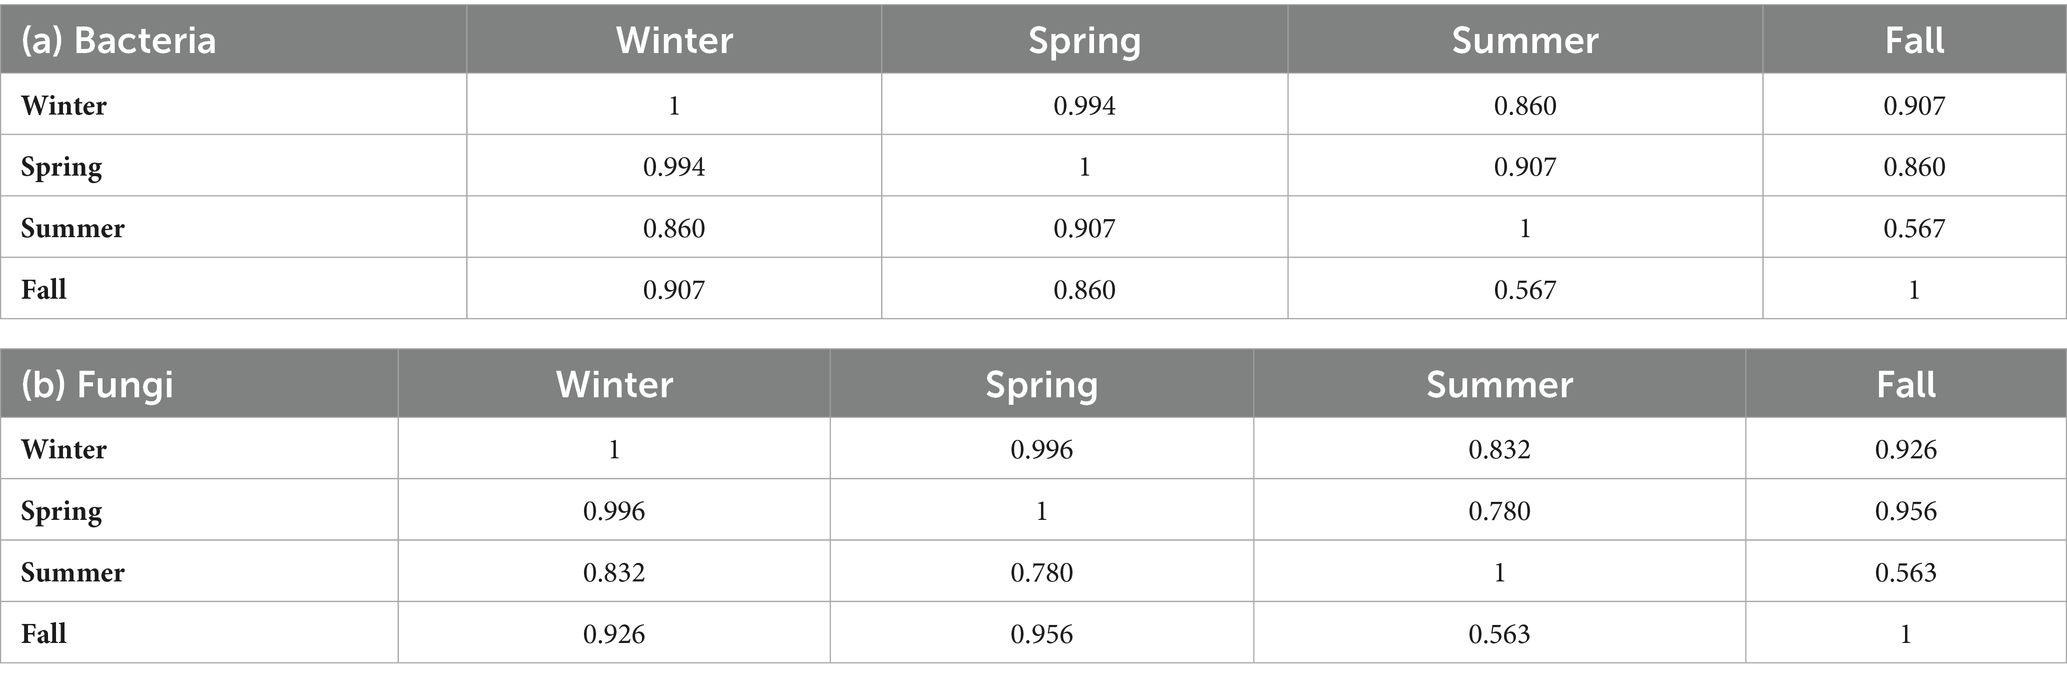
Table 1. Pearson correlation in seasonal microbial concentration in houses (Pearson correlation coefficient) (a) Bacteria and (b) Fungi.
Anthropogenic activities, pets, indoor plants and ventilation facilities are among the top factors responsible for the variation in the microbial concentration in indoor areas. Human actions are the primary cause of biological pollution within indoor spaces, as highlighted by Hospodosky et al. (28). According to a study carried out in Delhi, Cladosporium was the most prevalent fungus and another fungi were Aspergillus flavus and Ustilago. The study observed elevated concentrations of fungi from April to July, with reduced concentrations in the cold and arid season (29). Kumari and her colleagues conducted a comparable investigation to assess the fluctuation of fungal aerosols in pig farms across seasons (30). Ascomycota was among the most common phylum of fungi, with Basidiomycota and Zygomycota following closely behind. According to the research, summertime had more variation and quantity than cold (30). A study conducted in multifamily apartments in the USA identified that ventilation, indoor sources, and seasonal variations are the primary factors influencing bioaerosol concentrations within indoor environments (31). According to a recent study in Belgium, insufficient ventilation and filtration systems in indoor spaces could lead to a substantial rise in respiratory pathogens among residents (32). In another study, Karmakar et al. (33) highlighted the prevalence of Ascospore, basidiospore, Cladosporium, and Aspergilli fungi in elevated concentrations within primary indoor spaces. The availability of nutrients and optimal temperatures favored the proliferation of diverse indoor fungi (33). Seasonal variations have been found in the levels of bacteria and fungi within buildings. Bacterial concentrations were highest in spring at 2165CFU/m3 and reached their lowest in summer at 240 CFU/m3. Conversely, fungi exhibited their highest concentrations in houses during the summer at 235CFU/m3, while their lowest concentrations were recorded in winter at 26 CFU/m3 (34). The most recent data, in contrast to this study, shows that the level of bacteria is maximum in August, the start of fall, and least in cold. On the other hand, the trend of fungi prevalence is identical to current study (34). Madhwal et al. (35) measured biological aerosols close to a bus terminal and observed a nearly identical trend across all seasons. As per a study conducted in Dehradun, India, the most common genera of bacteria were Micrococcus, Staphylococcus, and Bacillus, whereas the most common fungal genera were Aspergillus, Penicillium, and Cladosporium (35). Airborne fungi exhibited a decline from July to August, possibly attributed to increased soil moisture, leading to reduced fungal resuspension during this time (55, 62). In similar research conducted in China, Summertime was also the season with the greatest populations of bacteria and fungi (36). Recent Chinese research by Li et al. (60) found intriguing variations in indoor microflora between male and female dormitories, revealing higher. Another Indian study reported the bacterial range between 924 and 2,750 CFU/m3 however in case of fungi it ranged between 656 and 1799 CFU/m3 (37). Considering the current study and other studies, it is interesting to note that most of studies reported the bioaerosol CFU/m3 exceeded the recommended limits for the indoor places (38). Hence, there is an urgent need for implementing strict guidelines for improving the microbial indoor air quality.
Supplementary Table S1 illustrates the seasonal variations in different meteorological parameters that may significantly influence bioaerosol composition and concentrations. In addition to presenting meteorological data, the study also statistically correlated them with aerosol concentrations across different seasons (Table 2). Overall, bacterial and fungal aerosol concentrations were found to correlate with these meteorological parameters, with a few exceptions. Previous research from our laboratory, along with other studies, has demonstrated an association between temperature and humidity and bioaerosol concentrations in indoor environments (9, 34).
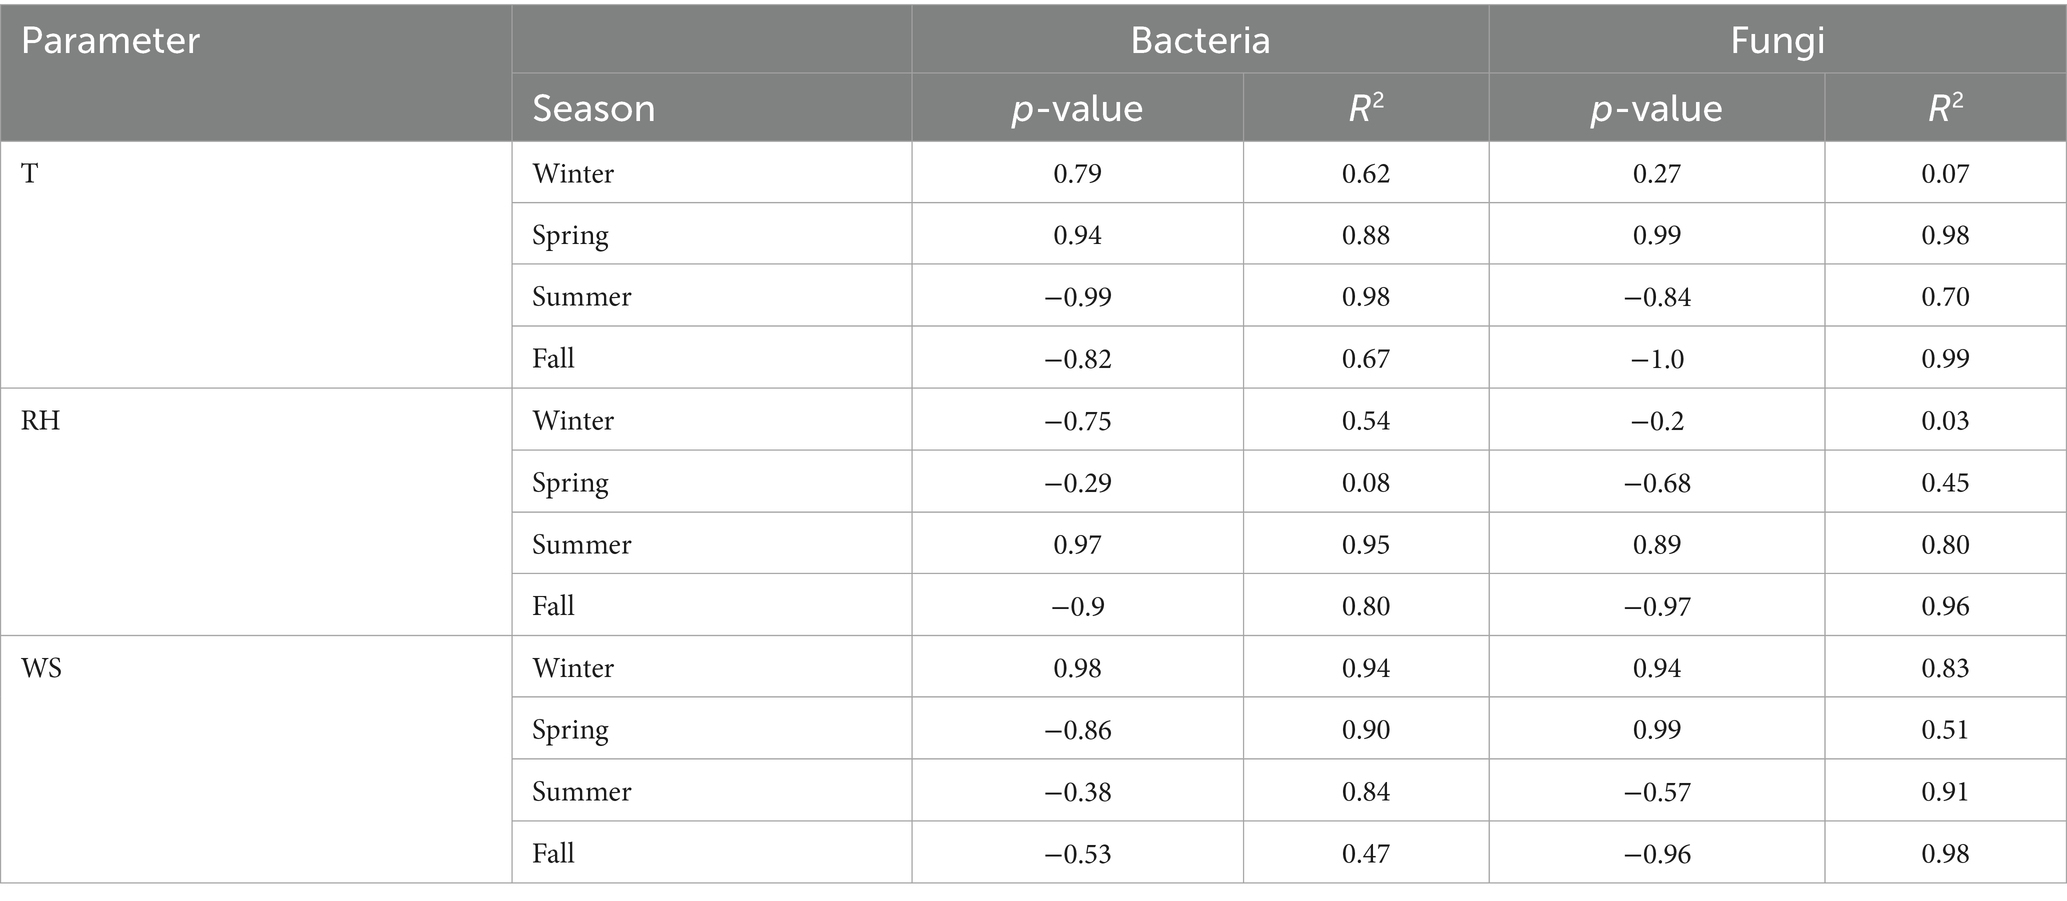
Table 2. Correlation between environmental parameters temperature, relative humidity and wind speed with microbial concentration (a. Temperature T, b. Relative Humidity RH, c. Wind Speed WS).
The fungal aerosol concentrations observed in this study (1330–6,050 CFU/m3) significantly exceeded the WHO recommended limit of 500 CFU/m3, indicating substantial fungal contamination in indoor environments. Despite the major studies being focused on bacterial aerosols, fungal bioaerosols are equally important and pose considerable health risks, particularly when present in elevated levels. Fine fungal particles (>2.5 μm), which were predominant across seasons, are capable of penetrating deep into the respiratory tract, reaching the bronchioles and alveolar regions. This can trigger allergic responses, exacerbate asthma, and lead to respiratory infections, especially in sensitive populations such as children, the older adult, and immuno-compromised individuals.
The seasonal distribution further highlights the potential health burden. During the rainy season, the dominance of fine fungal particles aligns with increased humidity and favorable conditions for fungal growth and spore dispersal, which may intensify respiratory symptoms like sneezing, wheezing, and allergic rhinitis. Conversely, the aggregation of fungal aerosols with non-biological particles in winter may reduce airborne counts but could still pose risks when resuspended. Although direct correlation with fungal exposure and reported symptoms was not separately analyzed in this study, the consistently elevated fungal levels and particle size distribution strongly suggest a plausible link with the observed respiratory and allergic health complaints among residents.
3.2 The pattern of bioaerosol sizes during various seasons
For bacterial samples, in all four seasons, the observed size distribution exhibited a roughly unimodal pattern, peaking at > 4.7 μm during the summer and minimum was recorded in winter peaking at > 3.3 with no statistically significant difference (p > 0.05) (Figure 4a). The occurrence of larger particles across various seasons might be attributed to bacterial cell aggregation on non-biological surfaces. In case of all the seasons a rough pattern can be observed which shoes the negative correlation of the CFU with size of the sampler with a few exceptions. Fall was shown to have the greatest level of bacterial aerosols (>0.65 μm) of any seasons (p > 0.05). Wintertime dominance of tiny bacterial aerosols implies a shortage of bigger non-biological particles. In a nursery school setting, larger particulate in the (>4.7 μm) range were also discovered by Bragoszewska et al. (39). According to Grzyb and Lenart (40), microorganisms account for more than 70% of all respirable particle fractions. Furthermore, the (>7 μm) fraction had the largest concentrations of both bacteria and fungi particles, according to a Madhwal et al. (35) research from India.
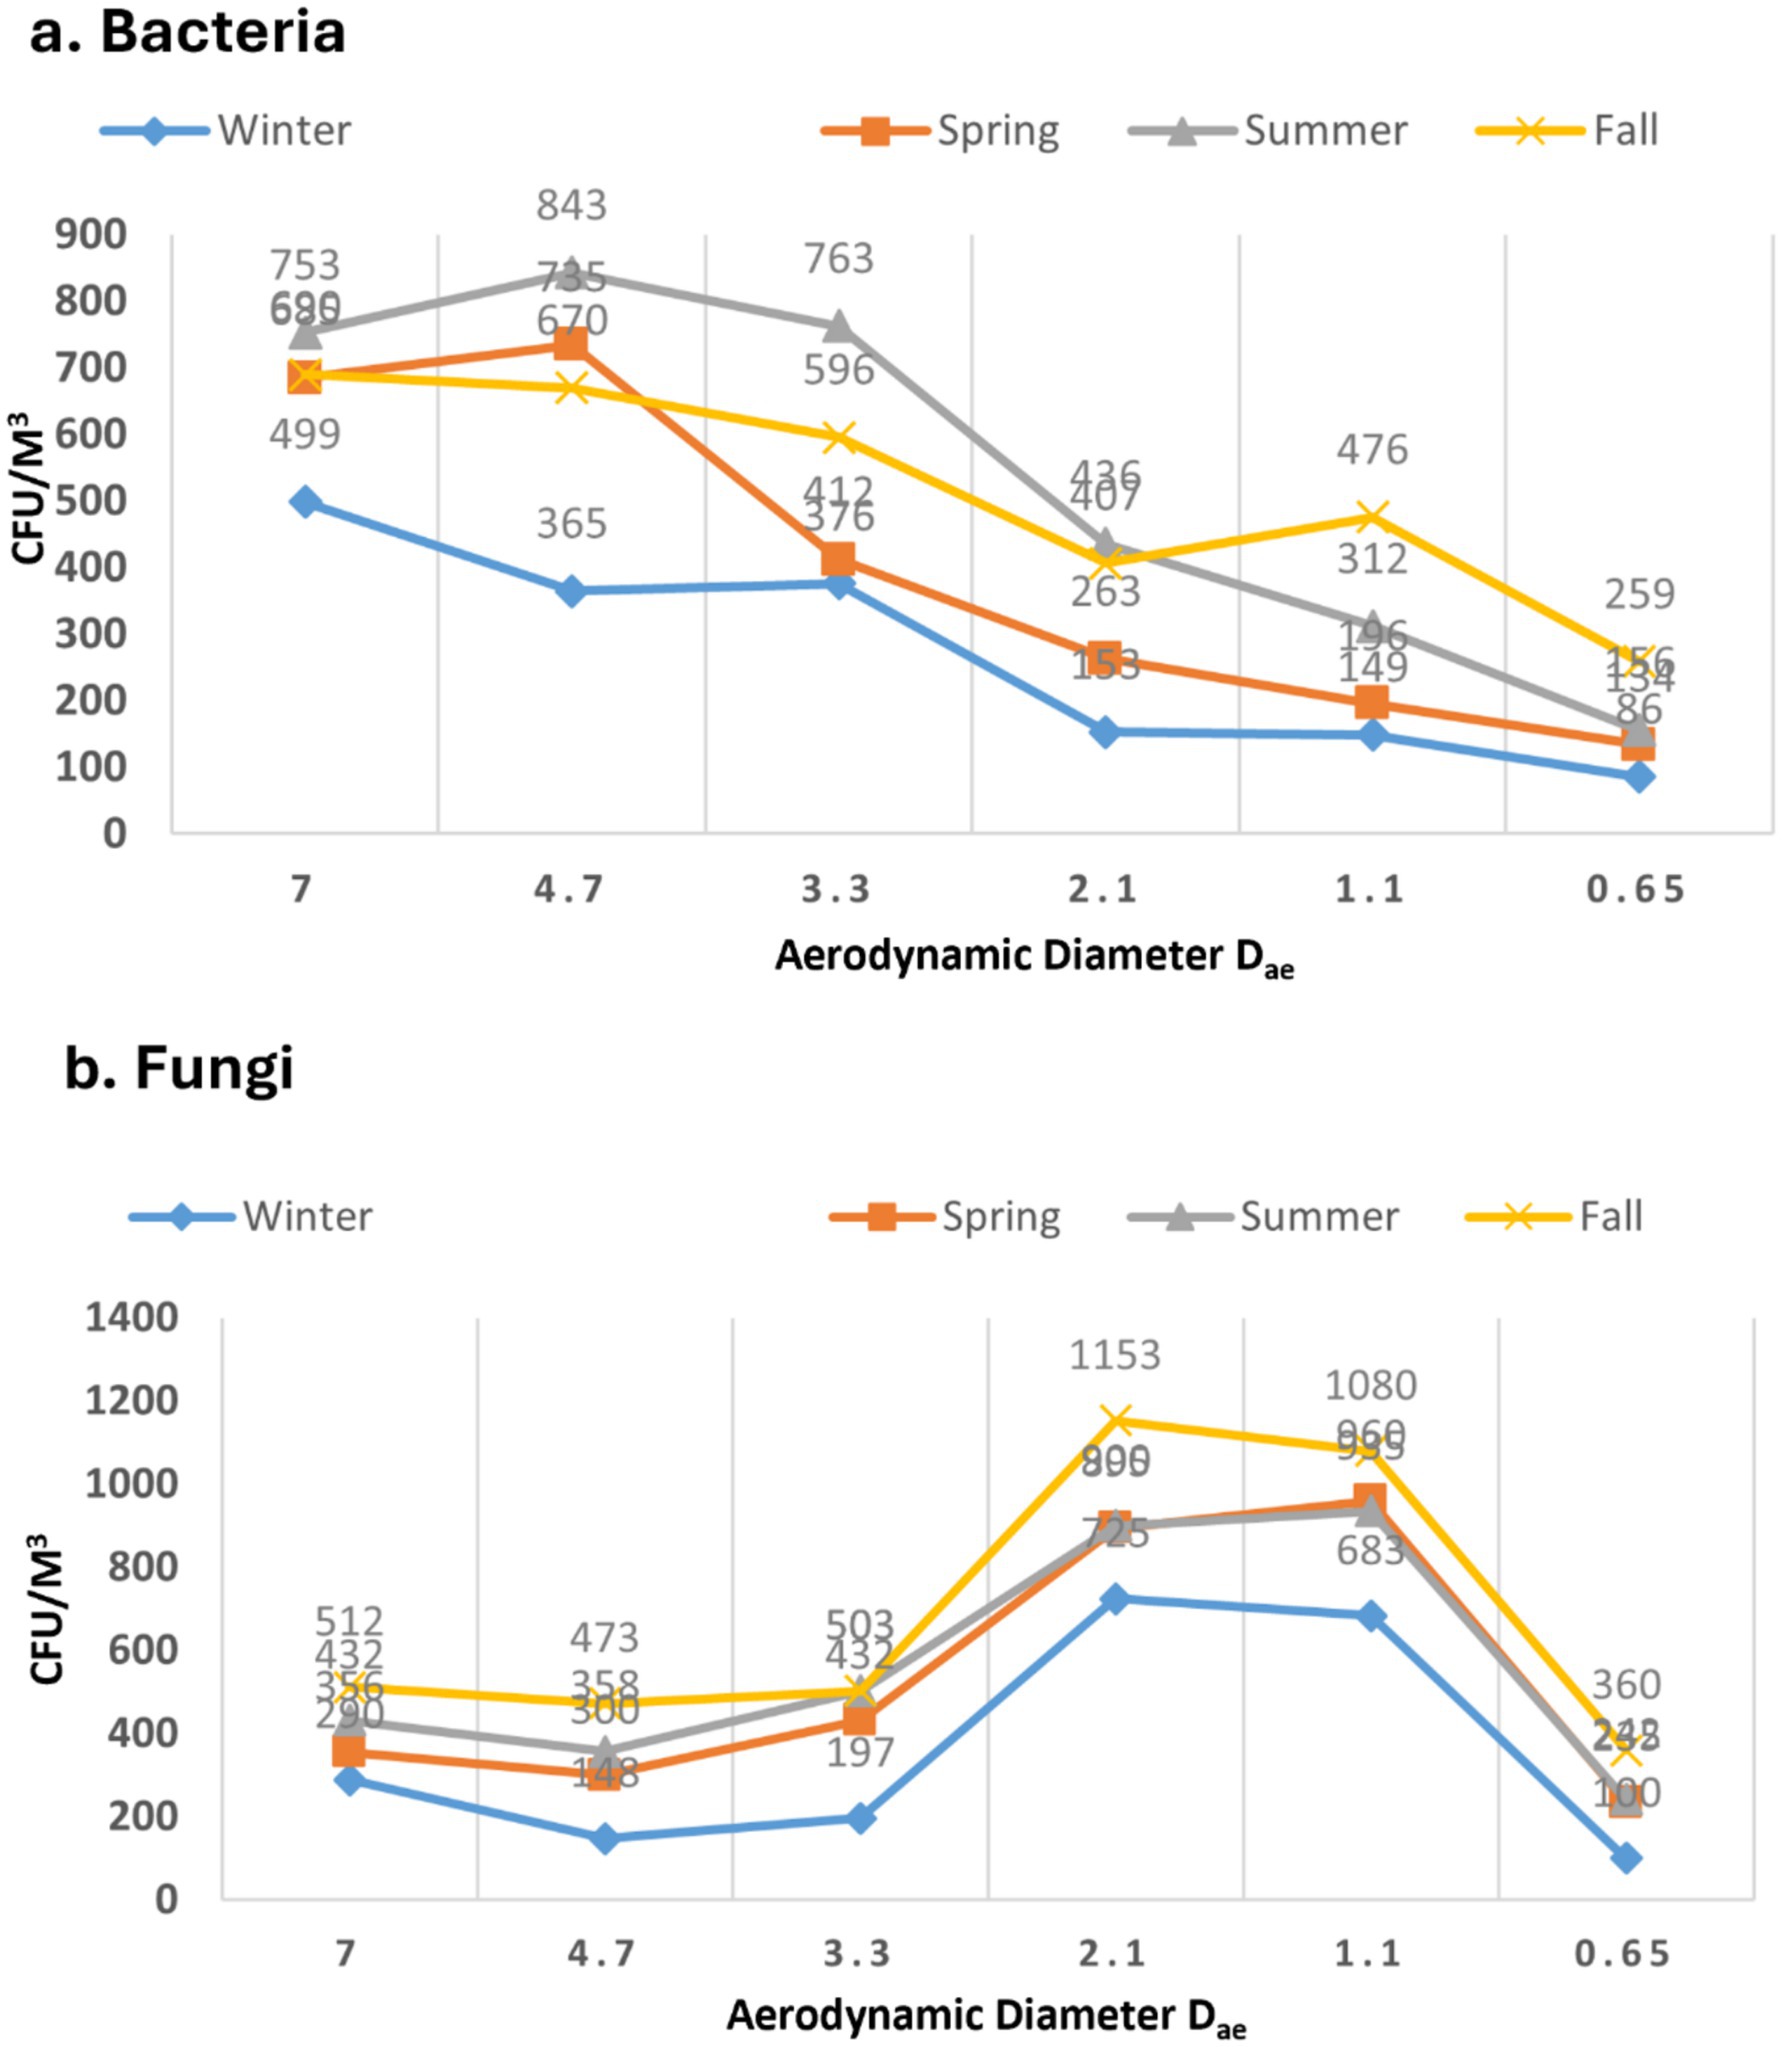
Figure 4. Size distribution in different seasons. (a) Bacterial. (b) Fungi.
In the context of fungi, there was a distinct trend observed in the size of diameters (p > 0.05), as depicted in Figure 4b. The data indicates that particles of smaller fungal sizes (>2.5 μm) were predominant across all seasons. These diminutive particles have the potential to deposit in the lower tracheal or alveolar regions of the lungs, leading to various health issues in humans. The absence of smaller particles in winter could potentially be attributed to the aggregation of fungal aerosols with non-biological particles. The rainy season, however, exhibited a distinctive pattern compared to other seasons. Coarse particles (>7 μm) were minimal, resembling the winter season (p > 0.05). On the contrary, fine fungal particles were more prevalent during the rainy season than in any other season. Lal and colleagues documented a similar pattern in the distribution of fungal aerosols, reporting the highest concentrations in the 3rd stage (3.3–4.7 μm) and 4th stage (3.3–2.1 μm) of the Andersen air sampler at various locations in Delhi (41). Previous study published from our laboratory resembled the similar kind of pattern for the distribution of the fungal aerosols in different seasons (3). Recent study from China, reported the similar size distribution pattern results in some of the underground garages in case of the fungal aerosols (36). Typically, microorganisms are linked to the particles found in the air around us in the form of bioaerosols. However, they also have the capability to move independently in the air. Our data indicates that bacterial populations outnumber fungi both in overall concentration and in submicron fractions. Dust formation and aerosolization processes can be triggered by human and anthropogenic activities, impacting the respiratory system in humans (35, 42).
3.3 Detection of viable airborne microorganisms
Prior to conducting the molecular analysis of the bacterial samples, extensive biochemical tests were carried out on isolated bacterial genera. Supplementary Tables S2, S3 summarize the biochemical characteristics used to identify general and enteric bacterial genera isolated from samples. Supplementary Table S2 highlights the differentiation of Gram-positive and Gram-negative bacteria based on tests such as catalase, starch hydrolysis, mannitol fermentation, and coagulase activity, helping distinguish genera like Staphylococcus, Streptococcus, and various bacilli. Supplementary Table S3 focuses on enteric bacteria, using standard IMViC tests (Indole, Methyl Red, Voges-Proskauer, and Citrate) to differentiate species like Escherichia coli, Enterobacter aerogenes, Klebsiella pneumoniae, and Proteus vulgaris. These biochemical profiles support accurate genus- and species-level classification of airborne bacterial isolates.
The molecular analysis aimed at identifying bacterial aerosols was conducted in accordance with the procedures outlined in the materials and methods section. Figure 5a presents the major bacterial genera found in all the residences, along with their respective proportions. Notably, the combined concentrations of Staphylococci, Micrococci, and Bacilli accounted for over 70% of the total viable bacterial aerosols.
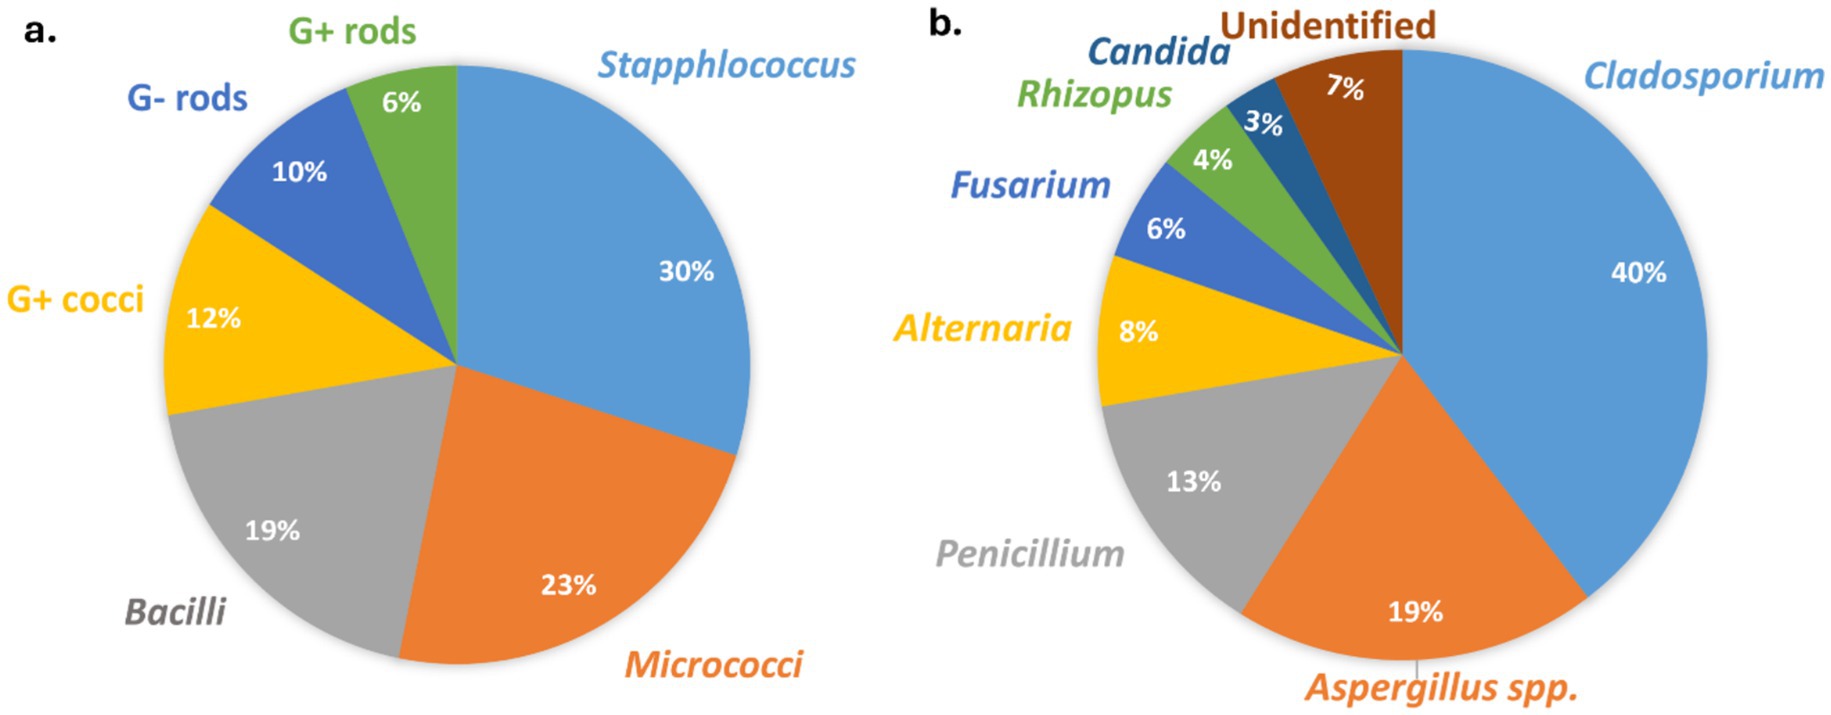
Figure 5. Proportion of microbes isolated from indoor residential houses. (a) Bacteria. (b) Fungi.
Fungal aerosol composition in indoor environments was assessed through culture-based identification methods. The identification of conidia from the Aspergillus and Penicillium groups was verified using culture methods as described by Oliveira et al. (61). Figure 5b illustrates the predominant fungal genera identified in every dwelling, along with their corresponding percentages. Like bacterial aerosols, the three major fungal genera (Cladosporium, Aspergillus and Penicillium) constituted more than 70% of the total culturable fungal aerosols. Like our results, the previous studies also reported the similar composition of fungal aerosols (3, 10, 11). Another recent study from India also identified Cladosporium as being present in the highest concentrations in indoor environments (37). Similar to our current research, this study also found nearly the same fungal genera across different houses (37). Various experimental and epidemiological studies also confirmed that these fungal genera isolated from the indoor houses are may also be responsible for the mold allergy (9–11, 43–45). Given the person-to-person transmission of SARS-CoV-2 (COVID-19) through bioaerosols, there is an urgent need for research to quantify the relationship between infected particles and aerosols.
3.4 Health impacts resulting from poor microbial indoor air quality identified in questionnaire survey
Participants in the survey were residents of the North-West Delhi sampling locations that were chosen at random. The demographic characteristics of the individuals, including age group, and sex are displayed in Supplementary Table S4. According to the consent agreement, the confidential information of the study participants was not disclosed in the publication. The reason behind selecting these subjects’ houses was to correlate the health effects with the microbial concentration. The study included 509 participants, with a majority being male (67.6%) and the rest female (32.4%). Most subjects were under 30 years old, with 50% below 18 years and 41.3% between 18 and 30 years. As per data, it was notable that more than two-third from the total subjects performed in this study were male. Additionally, around half of the population participated in this study was around 18 years of age.
Bioaerosols can lead to a variety of health problems in humans through inhalation or skin contact. According to the survey, participants experienced the highest incidence of health issues during the winter, while the spring season saw the fewest health problems. Previous studies suggest that the high levels of smoke in Delhi and surrounding areas during winter could be a contributing factor to the increased health effects during this season (3). Interestingly, despite this correlation, the winter months showed the lowest levels of viable bioaerosols in homes.
The symptoms and health effects resulting from exposure to poor indoor air quality have been categorized into respiratory, neural, ocular, bodily pain, and other health issues. These symptoms were identified through an analysis of various questionnaires. Commonly reported problems among participants included frequent coughing, eye irritation, sneezing attacks, headaches, allergies, allergic rhinitis, and chapped lips, as summarized in the Table 3. It was also observed that females exhibited a higher prevalence of these health issues (Table 3). However, conditions such as allergic rhinitis, emphysema, asthma, nasal congestion, wheezing, shortness of breath, sneezing attacks, colds, and hearing problems were more commonly reported in males. According to a 2018 report, females tend to spend more time indoors than males, which could be a likely explanation for their higher susceptibility to health issues linked to indoor air quality (46). Another cross-sectional study highlighted that indoor air pollution in India has a substantial impact on the cognitive functioning of older adult women (47). Notably, many of these prominent symptoms in male participants appear to be occupational health concerns, suggesting that poor air quality in the workplace might be a contributing factor. Interestingly, migraines, headaches, and skin problems were significantly more common in female participants than in males.
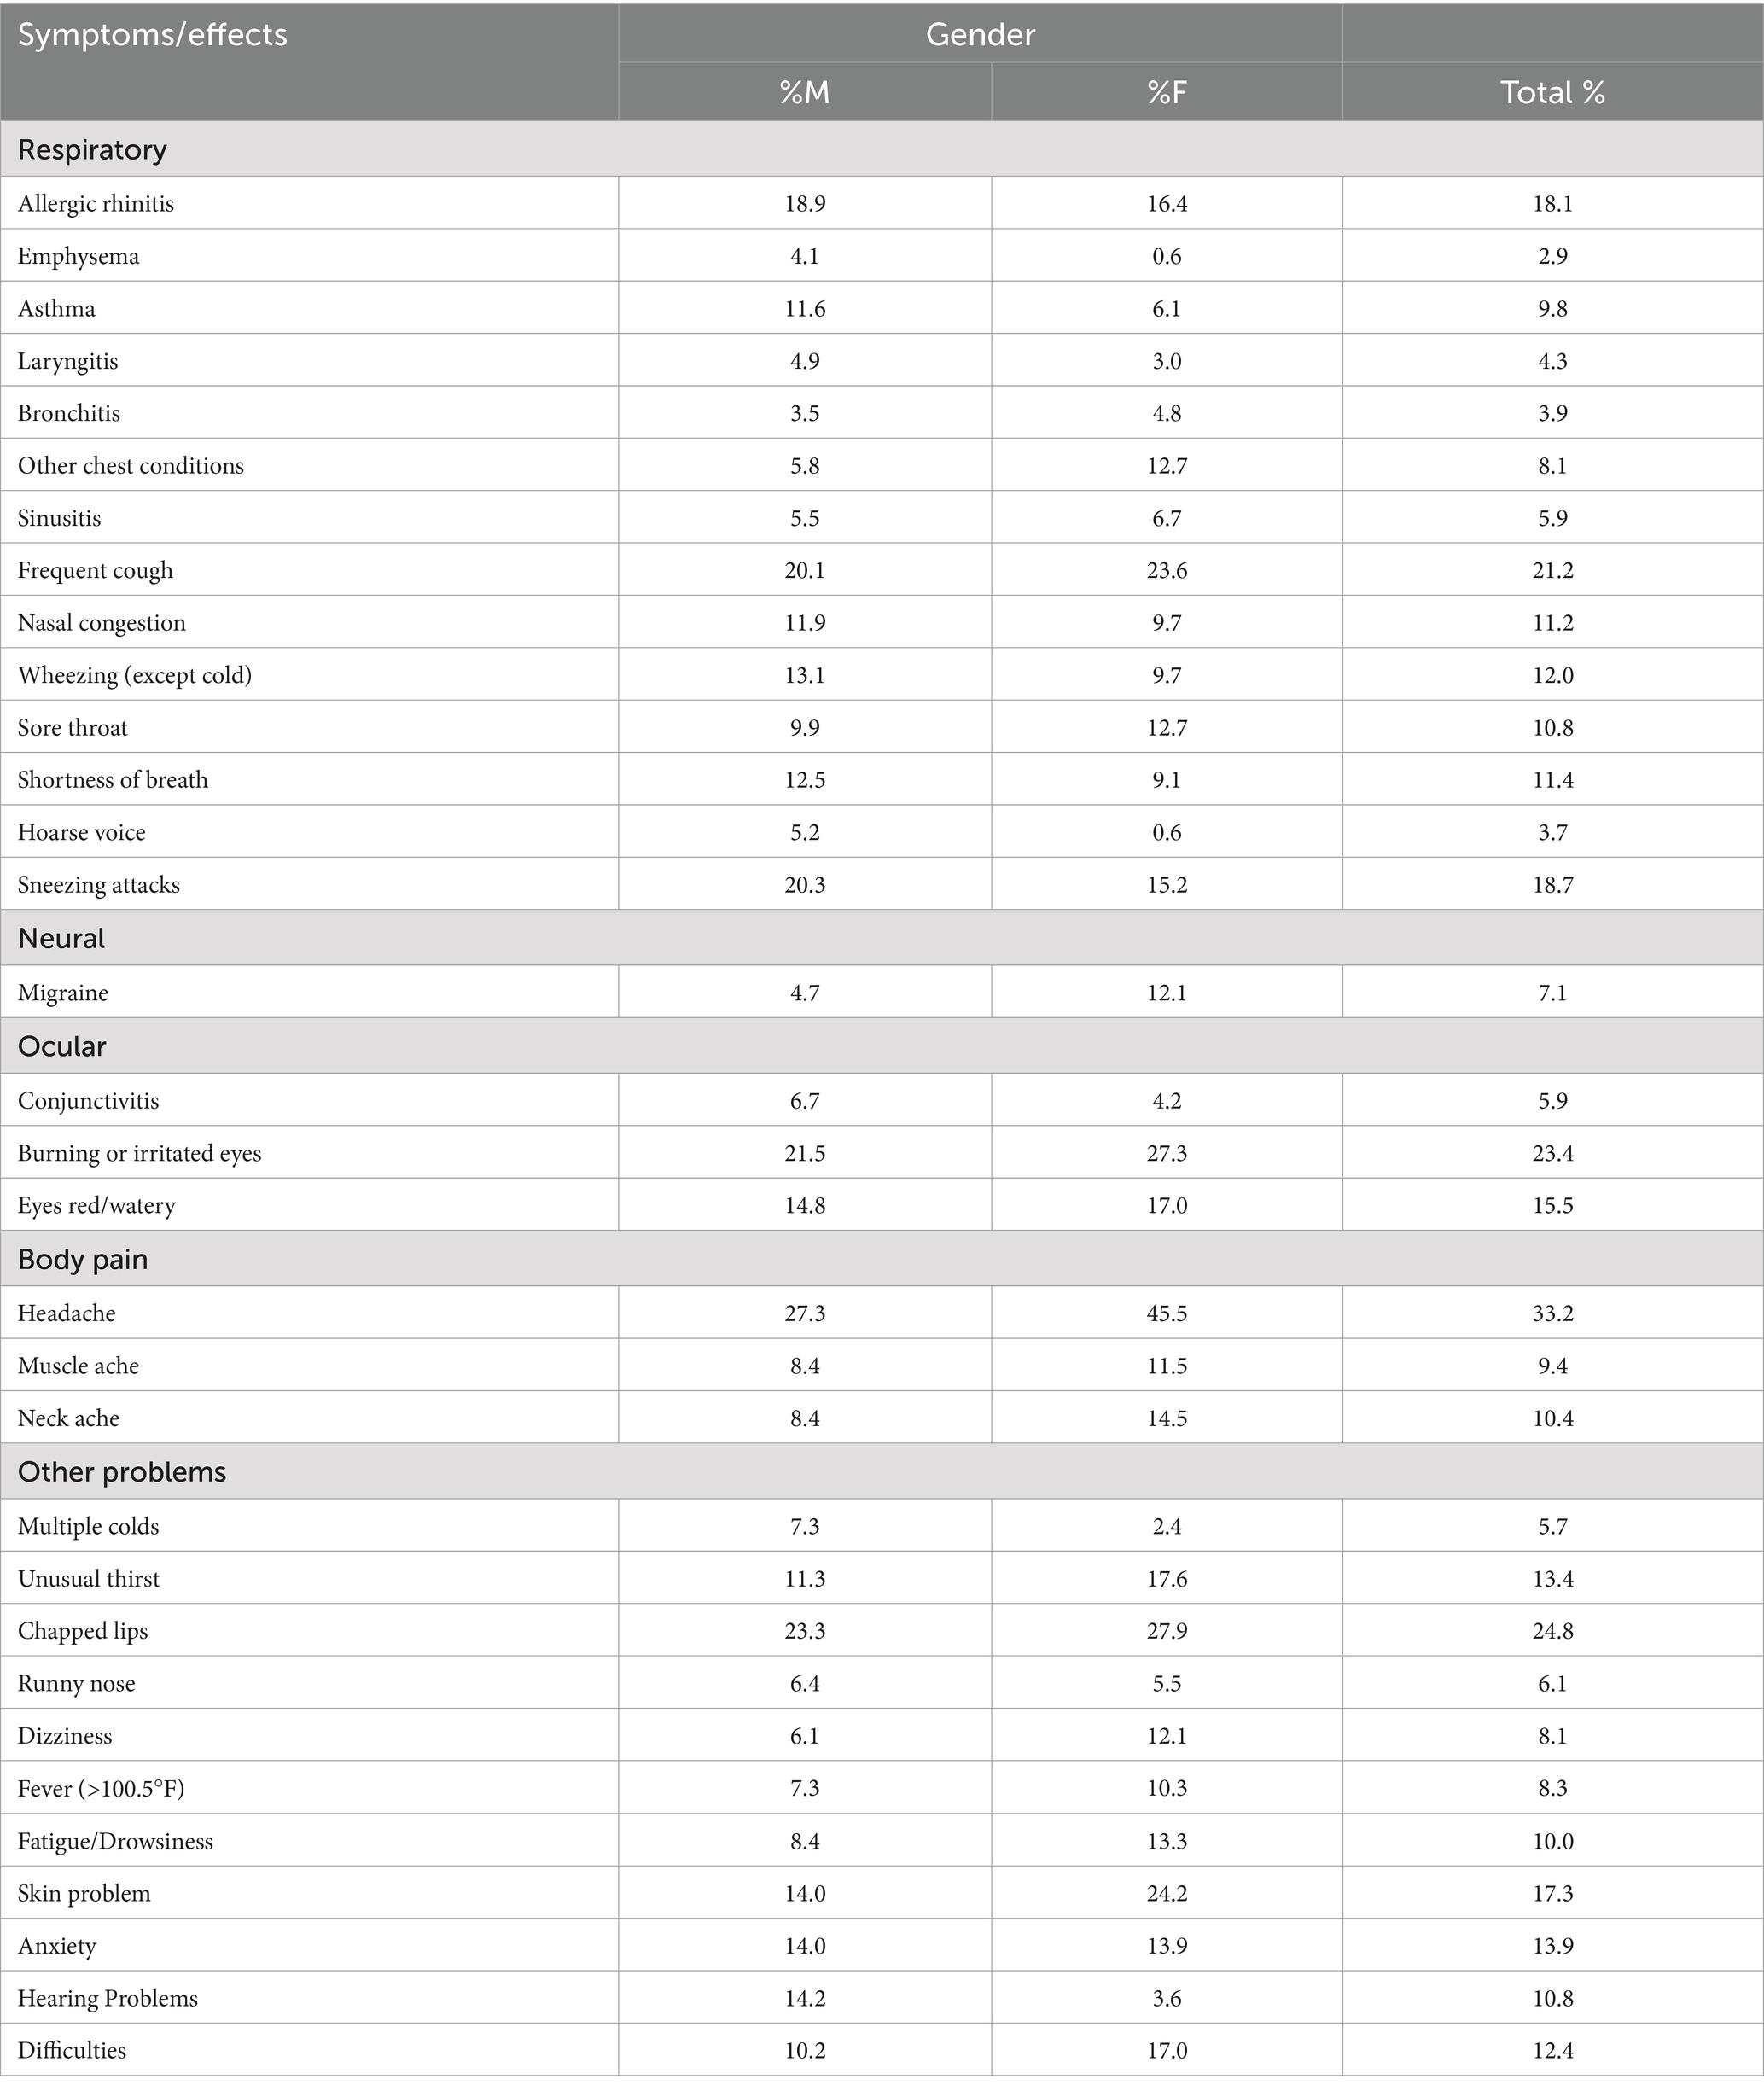
Table 3. Overall proportion of occurrence of health effects related to indoor air quality in houses.
Table 4 outlines the overall health issues observed across different groups. In Group A, the most frequently reported symptoms included allergic rhinitis, persistent coughing, sneezing attacks, wheezing, eye irritation, muscle aches, chapped lips, dizziness, and skin and hair problems. Conversely, Group B participants experienced higher rates of asthma, nasal congestion, migraines, and headaches. Interestingly, Groups C and D reported fewer health problems compared to Groups A and B. This difference might be attributed to the fact that younger individuals are more susceptible to health effects and symptoms caused by poor indoor air quality.
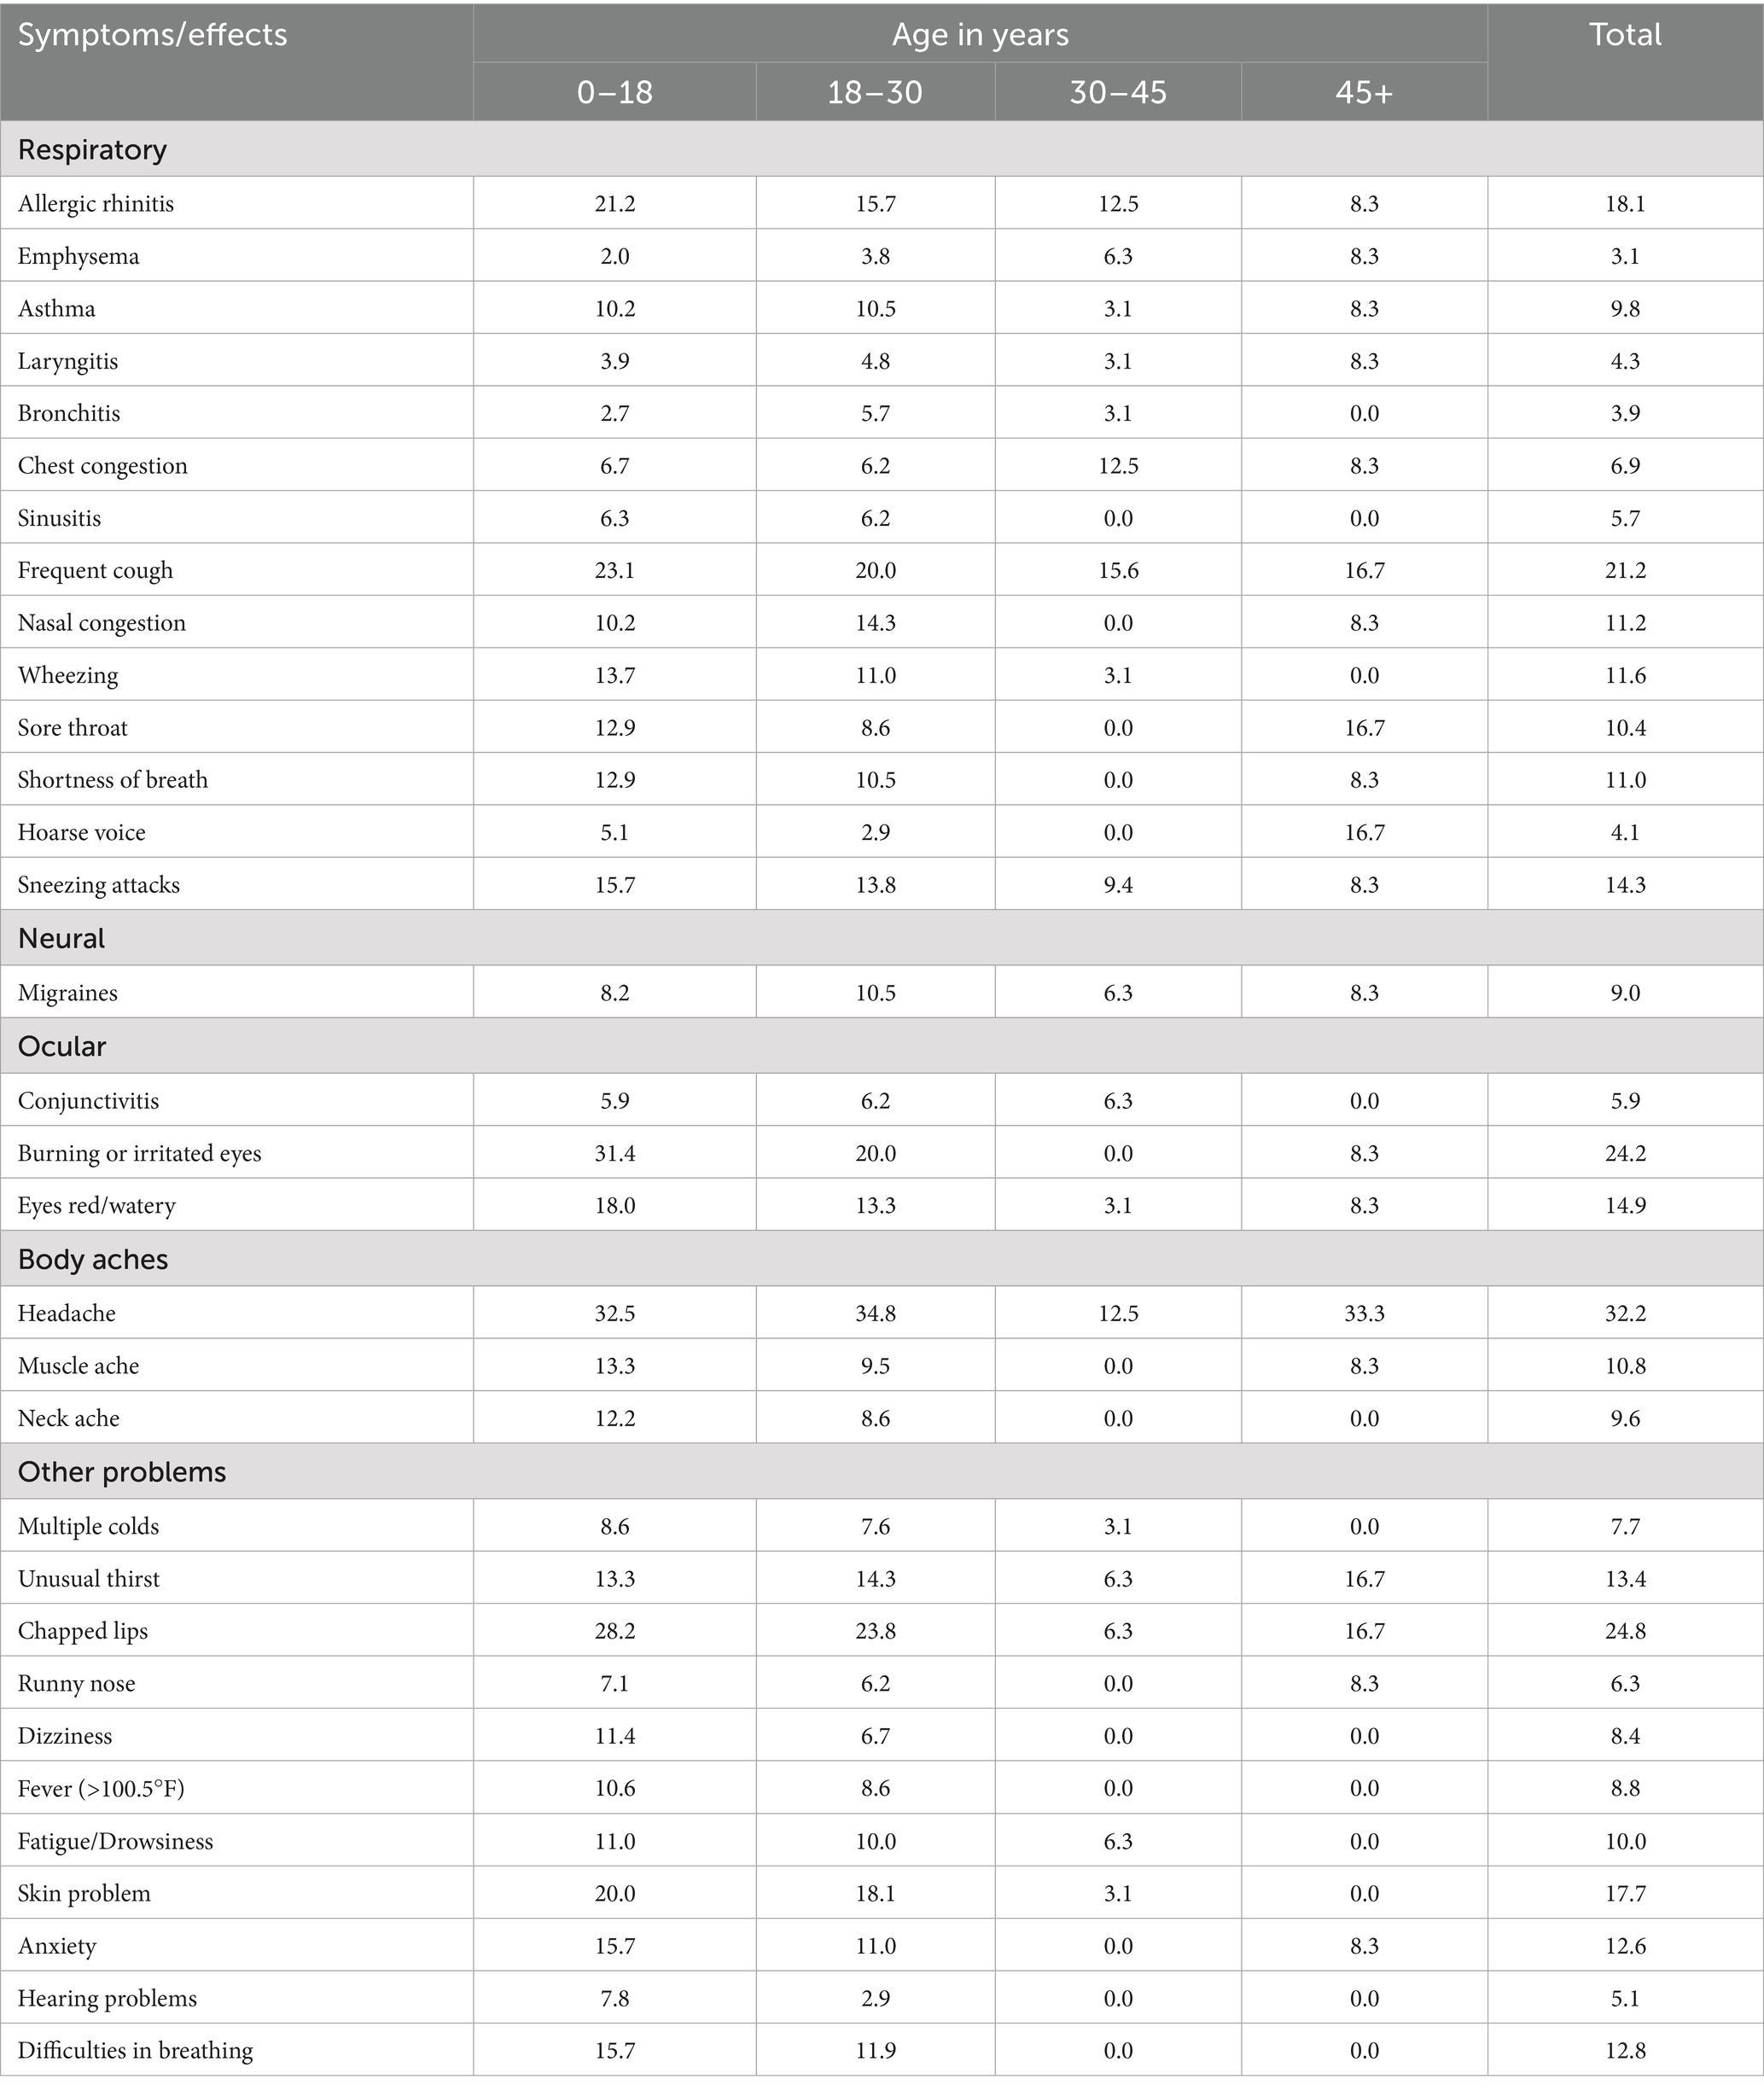
Table 4. Occurrence of health effects related to indoor air quality in houses in different age groups.
According to the overall seasonal data, the majority of people experience one or more health issues during the fall, while the fewest are affected in the spring. For the assessment of seasonal health issues related to poor indoor air quality, subjects were classified into six distinct categories (Table 5). In addition to those experiencing health problems during specific seasons, two additional categories were established: one for individuals suffering from health issues year-round, and another for those experiencing health problems in more than one season. Health effects caused due to poor microbial indoor air quality are significantly correlated with the seasons. In addition to inquiring about health-related issues, a question regarding the quality of indoor air was also asked (Supplementary Figure S1). According to a study, people are less likely to report the outdoor air pollution related health issues than indoor air pollution. However, it is well known that the indoor air pollution is more crucial as most of the time spent by the people is indoor areas (48).
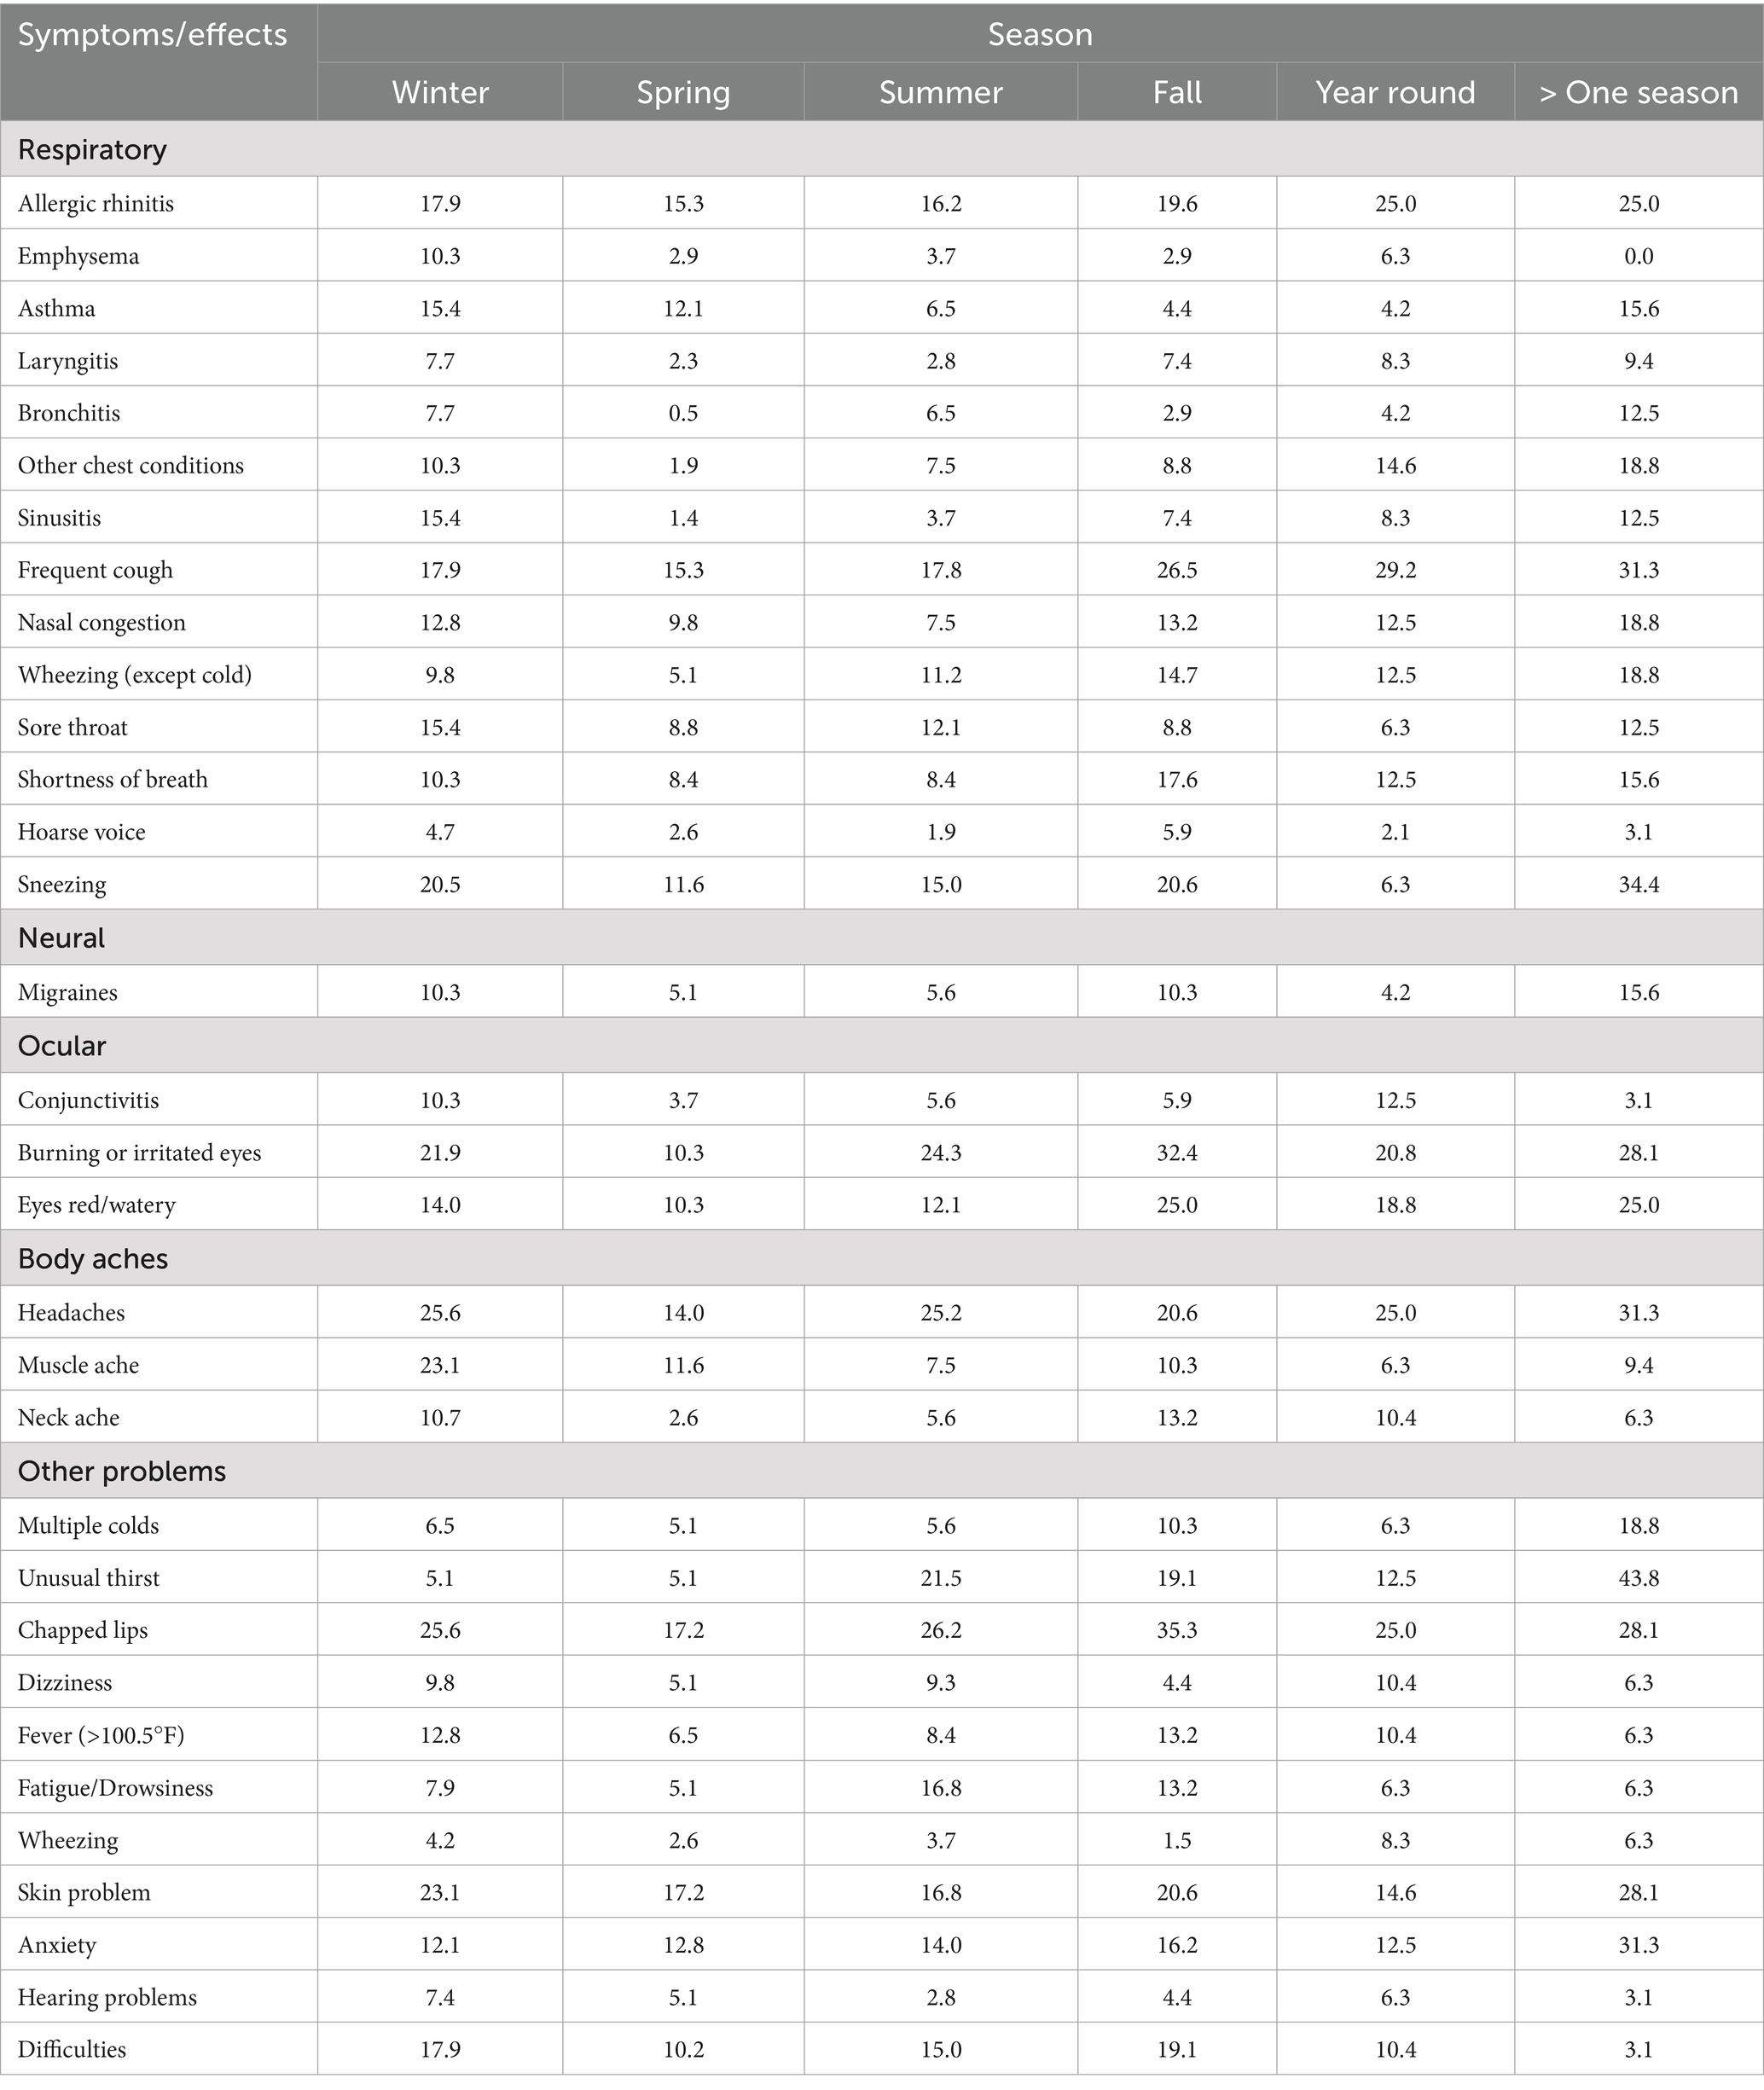
Table 5. Occurrence of health effects related to indoor air quality in houses in different seasons.
The predominance of fine fungal aerosols, particularly in stages 4–5 (particle sizes >2.5 μm), suggests a high potential for deep lung penetration, notably into the tracheobronchial and alveolar regions (3, 9). These regions are more susceptible to chronic inflammatory responses due to the deposition of respirable particles. Several reported health complaints, such as persistent coughing, shortness of breath, wheezing, and chest discomfort, are consistent with lower respiratory tract irritation, which aligns with exposure to fine fungal particles. Inhalation of such particles can trigger or exacerbate conditions like asthma, hypersensitivity pneumonitis, and allergic bronchopulmonary mycosis, particularly in sensitized individuals or those with pre-existing respiratory conditions. Moreover, the higher abundance of fine particles during the rainy season could correlate with increased fungal sporulation and dispersal due to elevated humidity levels. The aggregation of fungal aerosols with non-biological particles during winter, resulting in fewer respirable-sized particles, may explain the relative reduction in lower respiratory symptoms during that season (56). These results highlight the critical role of particle size in evaluating health risks linked to bioaerosol exposure and emphasize the need for improved health questionnaires in future studies to more accurately capture symptoms associated with specific regions of the respiratory tract.
Although bioaerosol concentrations were found to be lowest during the winter season (Figure 3), the highest prevalence of respiratory and general health symptoms was reported during this period (Table 5). This apparent contradiction can be explained by several confounding factors. During winter, residents tend to remain indoors for extended periods with limited ventilation, leading to prolonged exposure to indoor pollutants. Additionally, increased indoor crowding in small, poorly ventilated homes can enhance the transmission of airborne pathogens. Moreover, winter in Delhi is associated with severe outdoor air pollution events, including smog episodes driven by high levels of particulate matter (PM2.5), nitrogen oxides, and emissions from biomass burning and vehicular traffic. These pollutants can penetrate indoor environments and exacerbate respiratory symptoms. Therefore, the heightened health effects observed in winter likely result from a combined influence of indoor crowding, poor ventilation, and elevated levels of non-biological pollutants rather than bioaerosols alone.
3.5 Policy recommendations to improve indoor air quality and public health
To improve indoor air quality (IAQ) and safeguard public health, a comprehensive set of strategies should be implemented across various indoor environments (51, 52). One of the most critical recommendations is the enhancement of ventilation and air filtration systems. The integration of high-efficiency particulate air (HEPA) filters into ventilation systems or the use of standalone filtration units can substantially reduce airborne particulate matter and microbial loads, including bacteria, fungi, and viruses (49). Another key intervention involves the use of low-emission construction and furnishing materials, which are known to release fewer volatile organic compounds (VOCs) and support lower microbial growth rates. Such materials contribute to a more stable and less contaminated indoor environment, particularly in high-density or poorly ventilated settings (50). For community housing and commercial buildings, it is essential to adopt mandatory indoor air quality (IAQ) standards, such as ASHRAE 62.1. Low-cost air purifiers offer an affordable and practical solution for improving indoor air quality, especially in resource-limited settings. They can effectively reduce particulate matter and airborne microbes in polluted and poorly ventilated environments. Additionally, maintaining appropriate air exchange rates in high-occupancy areas, such as gyms, lobbies, and meeting spaces, is crucial for minimizing the risk of airborne disease transmission within indoor environments.
Furthermore, it is essential to support and expand ongoing scientific research aimed at establishing evidence-based bioaerosol exposure thresholds and region-specific IAQ guidelines. These efforts should include comprehensive monitoring of microbial contaminants across different building types and climate zones to inform public health policies and building design standards. Implementing these measures in an integrated manner will significantly improve indoor air quality, lower the risk of respiratory diseases, and contribute to better overall health and well-being of building occupants.
4 Conclusion
The current study demonstrated that indoor environments in Delhi exhibit higher microbial concentrations than outdoor settings, particularly during the summer and fall seasons. The prevalence of common health symptoms such as headaches and chronic allergies was positively associated with elevated microbial levels and influenced by meteorological factors like temperature and humidity. Human activity and ventilation patterns were also found to significantly shape the diversity and abundance of airborne biological particles indoors.
However, this study has several limitations. The data were collected from selected urban locations in Delhi, which may not represent broader geographic or climatic variations. Therefore, generalizing the findings to other regions requires caution, as seasonal and climatic factors affecting indoor air quality may vary significantly across different global contexts. Moreover, while this study established associations between bioaerosol concentrations and self-reported health symptoms, direct causal links could not be confirmed. There is also a need for methodological refinement, particularly in exposure assessment approaches across diverse indoor environments and population groups. The reliance on culture-based methods may have underestimated the total microbial diversity. Furthermore, future studies should account for the time participants spend indoors to better assess household bioaerosol exposure and establish accurate dose–response relationships. Given that symptoms observed in this study may also be influenced by general ambient air quality, comprehensive exposure assessment, including both indoor and outdoor environments, is essential.
Future studies should include longitudinal exposure assessments, incorporate culture-independent techniques such as metagenomics, and involve diverse geographic regions to better understand global patterns. Additionally, interdisciplinary efforts integrating microbiology, environmental science, and public health are essential for developing evidence-based indoor air quality guidelines.
Data availability statement
The original contributions presented in the study are included in the article/Supplementary material, further inquiries can be directed to the corresponding author.
Ethics statement
The studies involving humans were approved by “Institutional Ethical Committee for Human Research” of Satyawati College, University of Delhi, Delhi. The studies were conducted in accordance with the local legislation and institutional requirements. Written informed consent for participation in this study was provided by the participants’ legal guardians/next of kin.
Author contributions
PK: Methodology, Writing – original draft. RS: Conceptualization, Funding acquisition, Investigation, Project administration, Supervision, Writing – original draft, Writing – review & editing.
Funding
The author(s) declare that financial support was received for the research and/or publication of this article. This study was financially supported by Science and Engineering Research Board (SERB) (Currently ANRF), New Delhi, India (Grant No. ECR/2017/000470).
Acknowledgments
Authors acknowledge the Delhi Pollution Control Committee (DPCC) Delhi for providing the meteorological data. Some figures were created using BioRender under an academic license.
Conflict of interest
The authors declare that the research was conducted in the absence of any commercial or financial relationships that could be construed as a potential conflict of interest.
Generative AI statement
The authors declare that Gen AI was used in the creation of this manuscript. During the preparation of this work the author(s) used ChatGPT 4o mini in order to improve the readability and language of the manuscript. After using this tool/service, the authors reviewed and edited the content as needed and take full responsibility for the content of the publication.
Publisher’s note
All claims expressed in this article are solely those of the authors and do not necessarily represent those of their affiliated organizations, or those of the publisher, the editors and the reviewers. Any product that may be evaluated in this article, or claim that may be made by its manufacturer, is not guaranteed or endorsed by the publisher.
Supplementary material
The Supplementary material for this article can be found online at: https://www.frontiersin.org/articles/10.3389/fpubh.2025.1626827/full#supplementary-material
References
1. D’Amato, G, Vitale, C, Lanza, M, Molino, A, and D’Amato, M. Climate change, air pollution, and allergic respiratory diseases: an update. Curr Opin Allergy Clin Immunol. (2016) 16:434–40. doi: 10.1097/ACI.0000000000000301
2. Felini, M, Preacely, N, Shah, N, Christopher, A, Sarda, V, Elfaramawi, M, et al. A case–cohort study of lung cancer in poultry and control workers: occupational findings. Occup Environ Med. (2012) 69:191–7. doi: 10.1136/oemed-2011-100310
3. Kumar, P, Singh, AB, and Arora, T. Seasonal variation and size distribution in the airborne indoor microbial concentration of residential houses in Delhi and its impact on health. Aerobiologia. (2021) 37:1–14. doi: 10.1007/s10453-021-09718-3
4. Swan, J, Kelsey, A, Crook, B, and Gilbert, E. Occupational and environmental exposure to bioaerosols from composts and potential health effects: a critical review of published data In: Health and Safety Executive (HSE) research report, vol. 130 HSE Books (2003)
5. Von Mutius, E, and Vercelli, D. Farm living: effects on childhood asthma and allergy. Nat Rev Immunol. (2010) 10:861–8. doi: 10.1038/nri2871
6. Wurie, FB, Lawn, SD, Booth, H, Sonnenberg, P, and Hayward, AC. Bioaerosol production by patients with tuberculosis during normal tidal breathing: implications for transmission risk. Thorax. (2016) 71:549–54. doi: 10.1136/thoraxjnl-2015-207295
7. Kim, K-H, Kabir, E, and Jahan, SA. Airborne bioaerosols and their impact on human health. J Environ Sci. (2018) 67:23–35. doi: 10.1016/j.jes.2017.08.027
8. Kumar, P, Kausar, MA, Singh, AB, and Singh, R. Biological contaminants in the indoor air environment and their impacts on human health. Air Qual Atmos Health. (2021) 14:1723–36. doi: 10.1007/s11869-021-00978-z
9. Kumar, P, Singh, AB, and Singh, R. Comprehensive health risk assessment of microbial indoor air quality in microenvironments. PLoS One. (2022) 17:e0264226. doi: 10.1371/journal.pone.0264226
10. Dey, D, Ghoshal, K, and Bhattacharya, SG. Aerial fungal spectrum of Kolkata, India, along with their allergenic impact on public health: a quantitative and qualitative evaluation. Aerobiologia. (2019) 35:15–25.
11. Humbal, C, Joshi, SK, and Trivedi, UK. Evaluating the colonization and distribution of fungal and bacterial bio-aerosol in Rajkot, western India using a multi-proxy approach. Air Qual Atmos Health. (2019) 12:693–704. doi: 10.1007/s11869-019-00689-6
12. Wu, Y, Lu, Y, and Chou, D-C. Indoor air quality investigation of a university library based on field measurement and questionnaire survey. Int J Low-Carbon Technol. (2018) 13:148–60. doi: 10.1093/ijlct/cty007
13. Kumar, P, Singh, S, Pathak, VM, Singh, RK, Gupta, S, and Singh, R. Guidelines for the biological contaminants in indoor areas In: Airborne biocontaminants and their impact on human health. Wiley Online Library (2024). 357–77.
14. WHO. Indoor air quality: Biological contaminants. Report on a WHO meeting. Copenhagen, Denmark: WHO Regional Publications European series, no. 31 (1988).
15. Guo, K, Qian, H, Zhao, D, Ye, J, Zhang, Y, Kan, H, et al. Indoor exposure levels of bacteria and fungi in residences, schools, and offices in China: a systematic review. Indoor Air. (2020) 30:1147–65. doi: 10.1111/ina.12734
16. KME. Enforcement rules of the indoor air quality control act. Seoul, Korea: Korean Ministry of Environment (2021).
17. WHO. Control in the work environment: Airborne particle. Prevention and Control Exchange (PACE): Geneva, Switzerland (1999).
18. Cao, C, Jiang, W, Wang, B, Fang, J, Lang, J, Tian, G, et al. Inhalable microorganisms in Beijing’s PM2.5 and PM10 pollutants during a severe smog event. Environ Sci Technol. (2014) 48:1499–507. doi: 10.1021/es4048472
19. Poh, TY, Ali, N, Mac Aogáin, M, Kathawala, MH, Setyawati, MI, Ng, KW, et al. Inhaled nanomaterials and the respiratory microbiome: clinical, immunological, and toxicological perspectives. Part Fibre Toxicol. (2018) 15:1–16.
20. Richardson, M, Bowyer, P, and Sabino, R. The human lung and aspergillus: you are what you breathe in? Med Mycol. (2019) 57:S145–54. doi: 10.1093/mmy/myy149
21. Gollakota, AR, Gautam, S, Santosh, M, Sudan, HA, Gandhi, R, Jebadurai, VS, et al. Bioaerosols: characterization, pathways, sampling strategies, and challenges to geo-environment and health. Gondwana Res. (2021) 99:178–203.
22. Sturm, R. Total deposition of ultrafine particles in the lungs of healthy men and women: experimental and theoretical results. Ann Transl Med. (2016) 4:234. doi: 10.21037/atm.2016.06.05
23. Sutton, DA, Fothergill, AW, and Rinaldi, MG. Guide to clinically significant fungi Williams & Wilkins (1998). xix–471 p.
24. Lanyi, B. Classical and rapid identification methods for medically important bacteria. J Microbiol Methods. (1988) 19:1–67.
25. Dubey, RC, and Maheshwari, DK. Textbook of microbiology. 5th ed. New Delhi: S. Chand & Co., Limited (2014).
26. Flannigan, B, Samson, RA, and Miller, JD. Microorganisms in home and indoor work environments: Diversity, health impacts, investigation, and control. Boca Raton: CRC Press (2002).
27. Angenent, LT, Kelley, ST, Amand, AS, Pace, NR, and Hernandez, MT. Molecular identification of potential pathogens in water and air of a hospital therapy pool. Proc Natl Acad Sci. (2005) 102:4860–5. doi: 10.1073/pnas.0501235102
28. Hospodsky, D, Qian, J, Nazaroff, WW, Yamamoto, N, Bibby, K, Rismani-Yazdi, H, et al. Human occupancy as a source of indoor airborne bacteria. PLoS One. (2012) 7:e34867. doi: 10.1371/journal.pone.0034867
29. Gupta, SK, Pereira, BMJ, and Singh, AB. Survey of airborne culturable and non-culturable fungi at different sites in Delhi metropolis. Asian Pac J Allergy Immunol. (1993) 11:19.
30. Kumari, P, Woo, C, Yamamoto, N, and Choi, HL. Variations in abundance, diversity and community composition of airborne fungi in swine houses across seasons. Sci Rep. (2016) 6:37929. doi: 10.1038/srep37929
31. Myers, NT, Calderón, L, Pavilonis, B, Wang, Z, Xiong, Y, Sorensen-Allacci, MA, et al. Presence and variability of culturable bioaerosols in three multi-family apartment buildings with different ventilation systems in the northeastern US. Indoor Air. (2021) 31:502–23. doi: 10.1111/ina.12743
32. Raymenants, J, Geenen, C, Budts, L, Thibaut, J, Thijssen, M, De Mulder, H, et al. Indoor air surveillance and factors associated with respiratory pathogen detection in community settings in Belgium. Nat Commun. (2023) 14:1332. doi: 10.1038/s41467-023-36986-z
33. Karmakar, B, SenGupta, K, Kaur, A, Roy, A, and Gupta Bhattacharya, S. Fungal bio-aerosol in multiple micro-environments from eastern India: source, distribution, and health hazards. SN Appl Sci. (2020) 2:1–14. doi: 10.1007/s42452-020-2323-1
34. Frankel, M, Bekö, G, Timm, M, Gustavsen, S, Hansen, EW, and Madsen, AM. Seasonal variations of indoor microbial exposures and their relation to temperature, relative humidity, and air exchange rate. Appl Environ Microbiol. (2012) 78:8289–97. doi: 10.1128/AEM.02069-12
35. Madhwal, S, Prabhu, V, Sundriyal, S, and Shridhar, V. Ambient bioaerosol distribution and associated health risks at a high traffic density junction at Dehradun city, India. Environ Monit Assess. (2020) 192:1–15. doi: 10.1007/s10661-020-8158-9
36. Xing, Y, Li, Y, Zhang, K, Liu, D, Zhang, G, and Zhao, L. On-site investigation of the concentrations and size distributions of bioaerosols in the underground garages. Atmos Pollut Res. (2023) 14:101809. doi: 10.1016/j.apr.2023.101809
37. Jabeen, R, Kizhisseri, MI, Mayanaik, SN, and Mohamed, MM. Bioaerosol assessment in indoor and outdoor environments: a case study from India. Sci Rep. (2023) 13:18066. doi: 10.1038/s41598-023-44315-z
38. Kumar, P, Singh, S, Tyagi, E, Pathak, VM, Gupta, S, and Singh, R. Role of gases, VOC, PM2.5, and PM10 in biological contamination in indoor areas In: Airborne biocontaminants and their impact on human health. Wiley Online Library (2024). 89–107.
39. Brągoszewska, E, Mainka, A, Pastuszka, JS, Lizończyk, K, and Desta, YG. Assessment of bacterial aerosol in a preschool, primary school and high school in Poland. Atmos. (2018) 9:87. doi: 10.3390/atmos9030087
40. Grzyb, J, and Lenart-Boroń, A. Bacterial bioaerosol concentration and size distribution in the selected animal premises in a zoological garden. Aerobiologia. (2019) 35:253–68. doi: 10.1007/s10453-018-09557-9
41. Lal, H, Ghosh, B, Srivastava, A, and Srivastava, A. Identification and characterization of size-segregated bioaerosols at different sites in Delhi. Aerosol Air Qual Res. (2017) 17:1570–81. doi: 10.4209/aaqr.2015.05.0331
42. Johnson, GR, Morawska, L, Ristovski, ZD, Hargreaves, M, Mengersen, K, Chao, CYH, et al. Modality of human expired aerosol size distributions. J Aerosol Sci. (2011) 42:839–51. doi: 10.1016/j.jaerosci.2011.07.009
43. Egbuta, MA, Mwanza, M, and Babalola, OO. Health risks associated with exposure to filamentous fungi. Int J Environ Res Public Health. (2017) 14:719. doi: 10.3390/ijerph14070719
44. Khan, AH, and Karuppayil, SM. Fungal pollution of indoor environments and its management. Saudi J Biol Sci. (2012) 19:405–26. doi: 10.1016/j.sjbs.2012.06.002
45. Li, X, Liu, D, and Yao, J. Aerosolization of fungal spores in indoor environments. Sci Total Environ. (2022) 820:153003. doi: 10.1016/j.scitotenv.2022.153003
46. Sorensen, C, Saunik, S, Sehgal, M, Tewary, A, Govindan, M, Lemery, J, et al. Climate change and women's health: impacts and opportunities in India. GeoHealth. (2018) 2:283–97. doi: 10.1029/2018GH000163
47. Dakua, M, Karmakar, R, and Barman, P. Exposure to indoor air pollution and the cognitive functioning of elderly rural women: a cross-sectional study using LASI data, India. BMC Public Health. (2022) 22:2272. doi: 10.1186/s12889-022-14749-7
48. Greenstone, M, Lee, K, and Sahai, H. Indoor air quality, information, and socioeconomic status: evidence from Delhi In: AEA papers and proceedings, vol. 111. Nashville, TN: American Economic Association (2021). 420–4.
49. Arıkan, İ, Genç, ÖZLEM, Uyar, C, Tokur, ME, Balcı, C, and Renders, DP. Effectiveness of air purifiers in intensive care units: an intervention study. J Hosp Infect. (2022) 120:14–22.
50. Campwell, CK, Johnson, EM, and Warnock, DW. Identification of pathogenic fungi, 2nd Edn. (2013). doi: 10.1002/9781118520055
51. Haleem, N, Kumar, P, Uguz, S, Jamal, Y, McMaine, J, and Yang, X. Viability of artificial rain for air pollution control: insights from natural rains and roadside sprinkling. Atmos. (2023) 14:1714. doi: 10.3390/atmos14121714
52. Kumar, P, and Singh, R. Novel coronavirus (severe acute respiratory syndrome coronavirus 2) as a threat to general and reproductive health: challenges and research needs. J Reproduct Healthcare Med. (2020) 2:19–25.
53. American Conference of Governmental Industrial Hygienists Bioaerosol Committee. (1989). Guidelines for the assessment of bioaerosols in the indoor environment. Cincinnati, OH, USA: ACGIH.
54. Andersen, AA. New sampler for the collection, sizing, and enumeration of viable airborne particles. J Bacteriol. (1958) 76:471–84. doi: 10.1128/JB.76.5.471-484.1958
55. Fan, H, Li, X, Deng, J, Da, G, Gehin, E, and Yao, M. Time-dependent size-resolved bacterial and fungal aerosols in Beijing subway. Aerosol Air Qual. Res. (2017) 17:799–809. doi: 10.4209/aaqr.2016.03.0114
56. Ghosh, B, Lal, H, Kushwaha, R, Hazarika, N, Srivastava, A, and Jain, VK. Estimation of bioaerosol in indoor environment in the university library of Delhi. Sustain Environ Res. (2013) 23:199–207.
57. IQAir Air Quality Index (AQI) and PM2.5 Air pollution. (2024). Available at: https://www.iqair.com/us/world-most-polluted-cities (Accessed April 17, 2024).
58. Kumar, P, and Goel, A. Temporal variations in fungal bioaerosols in outdoor environment: a three-year study at four different locations in Gwalior, Central India. Def Life Sci J. (2019) 4:76–81.
59. Kumar, P, Singh, AB, Arora, T, Singh, S, and Singh, R. Critical review on emerging health effects associated with the indoor air quality and its sustainable management. Sci Total Environ. (2023) 872:162163. doi: 10.1016/j.scitotenv.2023.162163
60. Li, Y, Ge, Y, Wu, C, Guan, D, Liu, J, and Wang, F. Assessment of culturable airborne bacteria of indoor environments in classrooms, dormitories and dining hall at university: a case study in China. Aerobiologia. (2020) 36:313–24. doi: 10.1007/s10453-020-09633-z
61. Oliveira, M, Ribeiro, H, Delgado, JL, and Abreu, I. Seasonal and intradiurnal variation of allergenic fungal spores in urban and rural areas of the North of Portugal. Aerobiologia. (2009) 25:85–98. doi: 10.1007/s10453-009-9112-z
Keywords: indoor air quality, questionnaire survey, respiratory problems, bacteria, fungi
Citation: Kumar P and Singh R (2025) Microbial indoor air pollution in Delhi Metropolitan City is attributable to severe respiratory and general health effects among residents. Front. Public Health. 13:1626827. doi: 10.3389/fpubh.2025.1626827
Edited by:
Tong Wang, Duke University, United StatesReviewed by:
Yilin Han, Eli Lilly (United States), United StatesYuanyin Teng, Zhejiang University, China
Yuan Gao, Genentech Inc., United States
Mingliang Zhang, Johns Hopkins Medicine, United States
Copyright © 2025 Kumar and Singh. This is an open-access article distributed under the terms of the Creative Commons Attribution License (CC BY). The use, distribution or reproduction in other forums is permitted, provided the original author(s) and the copyright owner(s) are credited and that the original publication in this journal is cited, in accordance with accepted academic practice. No use, distribution or reproduction is permitted which does not comply with these terms.
*Correspondence: Rajeev Singh, MTByc2luZ2hAZ21haWwuY29t
†ORCID: Pradeep Kumar, orcid.org/0000-0001-7245-8211
Rajeev Singh, orcid.org/0000-0001-8804-155X