 Huayan Zuo1†
 Qiu Bi2†Xiaolong Liu3†Guoli Bi2Yijin Wang1Yunzhu Wu4
 Guang Yang5Chengxiu Zhang5
 Yang Song6
 Gang Wang7*‡
 Qiyang Wang8*‡
 Xiarong Gong2*‡
- 1Department of MRI the First People’s Hospital of Yunnan Province, The Affiliated Hospital of Kunming University of Science and Technology, Kunming, China
- 2Department of MRI, The First People’s Hospital of Yunnan Province, The Affiliated Hospital of Kunming University of Science and Technology, Kunming, China
- 3Department of Medical Imaging, The People’s Hospital of Puer, The Affiliated Hospital of Kunming University of Science and Technology, Kunming, China
- 4Institute for AI in Medicine, School of Artificial Intelligence, Nanjing University of Information Science and Technology, Nanjing, China
- 5Shanghai Key Laboratory of Magnetic Resonance, East China Nornal University, Shanghai, China
- 6MR Research Collaboration, Siemens Healthineers, Shanghai, China
- 7Department of Radiology, the First People’s Hospital of Yunnan Province, The Affiliated Hospital of Kunming University of Science and Technology, Kunming, China
- 8Department of Orthopedic Surgery, The Key Laboratory of Digital Orthopaedics of Yunnan Provincial, Yunnan Province Spinal Cord Disease Clinical Medical Center, The First People's Hospital of Yunnan Province, The Affiliated Hospital of Kunming University of Science and Technology, Kunming, China
Objectives: This study aims to investigate the efficacy of unsupervised machine learning algorithms, specifically the Gaussian Mixture Model (GMM), K-means clustering, and Otsu automatic threshold partitioning, in predicting sarcopenia based on computed tomography (CT) and magnetic resonance imaging (MRI) data.
Methods: A retrospective analysis was conducted on a dataset comprising 191 patients diagnosed with sarcopenia and 327 control patients. Participants were randomly assigned to training and validation cohorts in a 6:4 ratio. The paravertebral muscles at the lumbar 3/4 intervertebral disc level were manually delineated as the region of interest (ROI) on non-enhanced CT and axial T2-weighted MRI images. Muscle and adipose tissues were automatically segmented from the ROI using GMM, K-means, and Otsu algorithms at the cohort level. Quantitative metrics such as mean, volume, and volume percentage were computed, and these parameters were compared between the sarcopenia and non-sarcopenia groups. Logistic regression analysis was employed to develop predictive models for sarcopenia, with model performance evaluated using the area under the curve (AUC). The stability of the models was assessed through five-fold cross-validation.
Results: The study demonstrates that three unsupervised clustering algorithms utilizing CT data surpassed those employing MRI data. Notably, the CT-based Otsu model exhibited the highest predictive performance in both training and validation datasets, with AUC values of 0.986 and 0.958, respectively. This was followed by the CT-based GMM, which achieved AUC values of 0.990 and 0.903, and the K-means model, with AUC values of 0.727 and 0.772. Furthermore, the CT-based GMM model demonstrated superior stability upon five-fold cross-validation, yielding an average AUC of 0.990.
Conclusion: The findings indicate that CT-based unsupervised machine learning models outperform their MRI-based counterparts, with the CT-based Otsu and GMM models showing exceptional efficacy in sarcopenia prediction, as evidenced by AUC values exceeding 0.95.
Introduction
The European Working Group on Sarcopenia in Older People (EWGSOP) currently defines sarcopenia as “a syndrome characterized by progressive and generalized loss and change in skeletal muscle quality and strength” (1). It is an age-related disease characterized by a decline in muscle quality, strength, and function (2). From a clinical standpoint, the SARC-F questionnaire is a straightforward and well-established tool endorsed by the EWGSOP for identifying patients with compromised physical function and sarcopenia (3). However, diagnosing sarcopenia requires a variety of assessments, including muscle strength tests and more accurate imaging methods, often utilizing bioelectrical impedance analysis (BIA) or dual-energy X-ray absorptiometry (DXA) to evaluate muscle quality (4, 5). Dual-energy X-ray and bioelectrical impedance may underestimate the degree of muscle quality reduction, and factors such as hydration and water retention (such as heart, liver, or kidney failure) can affect the accuracy of these methods (6, 7). Additionally, many older population individuals experience conditions that lead to water retention, which can limit the applicability of certain assessment methods.
Accurate diagnosis of sarcopenia requires precise quantification of muscle including muscle quantity and quality. Computed tomography (CT) and magnetic resonance imaging (MRI) are considered the gold standards for non-invasive assessment of muscle (1, 8, 9). CT can directly analyze body composition and quantify muscle mass (10). Given that muscle density is associated with the extent of fat infiltration, CT can evaluate both muscle quantity and quality by accurately differentiating between fat and muscle tissues based on their specific attenuation characteristics, thereby providing detailed anatomical information (11). Over the past 25 years, the reliability of CT in assessing quantitative and qualitative changes in fat and muscle quality has been well demonstrated (12, 13). MRI also demonstrates high accuracy in assessing muscle and fat areas or volumes and in segmenting muscle on CT cross-sectional images (14). In addition to providing information on fatty infiltration similar to CT, MRI can also offer data on muscle edema, fiber infiltration, fiber contractility, and elasticity (15). However, these methods cannot provide precise measurements for evaluating changes over time, and no studies have compared CT and MRI for predicting sarcopenia. The majority of existing research predominantly employs supervised learning techniques, which necessitate substantial annotated datasets and exhibit high sensitivity to shifts in data distribution. In contrast to the prevalent focus on a single imaging modality (such as CT or MRI) in previous studies, this research uniquely integrates the strengths of both CT and MRI. CT is particularly effective for quantitative analyses of muscle density and fat infiltration, while MRI provides superior soft tissue contrast and detailed visualization of muscle fiber architecture.
To advance the exploration of sarcopenia, there is a pressing need for the development of precise quantitative assessment methodologies. Artificial intelligence (AI) holds potential to facilitate the integration of sarcopenia research, particularly concerning low muscle quantity and quality, into clinical practice (16). In recent years, the rapid advancement of AI technology has led to the increased application of unsupervised machine learning algorithms in the medical field, providing innovative strategies for sarcopenia prediction. Our preliminary investigations have demonstrated that unsupervised algorithms utilizing cohort-level clustering surpass those employing case-level clustering (17). In contrast to traditional radiomics, which necessitates large sample sizes for robust analysis, unsupervised machine learning algorithms exhibit reduced dependency on sample size. In the realm of medical image analysis, particularly in the assessment of muscle composition, there are significant challenges associated with acquiring large, high-quality labeled datasets due to financial and logistical constraints. Unsupervised learning algorithms address this limitation by identifying intrinsic data structures and patterns without the need for extensive annotations. This methodological approach is especially advantageous for studies on muscle composition where labeled data is scarce, as it reduces the dependency on annotations, lowers costs, and facilitates tissue segmentation and classification. These algorithms are capable of autonomously segmenting and classifying muscle tissues, as well as performing feature extraction and dimensionality reduction, thereby offering significant advantages. K-means clustering has been successfully applied to the automatic segmentation of muscle and fat (18). Although common unsupervised machine learning algorithms like the Gaussian mixture model (GMM) and Otsu thresholding are employed, there is limited literature on their application in muscle assessment.
This study aims to investigate the utility of unsupervised machine learning algorithms, such as Gaussian mixture modeling, K-means clustering, and Otsu thresholding, utilizing cohort-level CT and MRI data to predict sarcopenia.
Materials and methods
Study population
The study was conducted in accordance with the Declaration of Helsinki, and approved by the Institutional Review Board (or Ethics Committee) of the First People’s Hospital of Yunnan Province (reference number KHLL2023-KY209); date of approval 23 December 2024. The data are anonymous, and therequirement for informed consent was therefore waived. We consecutively reviewed 518 patients admitted to our hospital between August 2019 and October 2023, including 327 non-sarcopenia patients and 191 sarcopenia patients. And its validity was verified using prospectively collected data (65 non-sarcopenia patients and 36 sarcopenia patients) from our hospital between November 2023 and December 2024. Inclusion criteria: (1) patients diagnosed with sarcopenia or non-sarcopenia according to the Asian Working Group on Sarcopenia (AWGS) 2019 guidelines: Low Appendicular skeletal muscle mass (Dual-energy X-ray absorptiometry: male < 7.0 kg/m2, female: < 5.4 kg/m2 or Bioelectrical impedance analysis: male < 7.0 kg/m2, female < 5.7 kg/m2) and low muscle strength (Handgrip strength: male < 28 kg, female < 18 kg) or Low physical performance (6-metre walk: < 1.0 m/s or 5-time chair stand test: ≥ 12 s or Short Physical Performance Battery: ≤ 9); (2) age between 18 and 90 years old; (3) all patients had routine MRI and CT scans of the lumbar spine at our hospital within 14 days before treatment. Exclusion criteria: (1) patients who did not undergo lumbar non-enhanced CT or axial non-fat-suppressed T2-weighted imaging (T2WI) scanning; (2) patients who had undergone surgical treatment (pedicle screw fixation, vertebroplasty, and kyphoplasty); (3) poor-quality CT or MRI images, making evaluation impossible; (4) incomplete display of paraspinal muscles at the level of the L3/4 intervertebral disc. A total of 383 patients were finally enrolled, including 257 non-sarcopenia patients and 126 patients with sarcopenia. Clinical and laboratory data were retrospectively collected, encompassing variables such as age, gender, height, weight, body mass index (BMI), occupation, hypertension, diabetes, coronary heart disease, smoking history, preoperative red blood cell count, white blood cell count, serum albumin (ALB), hemoglobin, neutrophil count, neutrophil-to-lymphocyte ratio (NLR), and calcium concentration. Figure 1 shows the flow chart of patient inclusion and exclusion criteria.
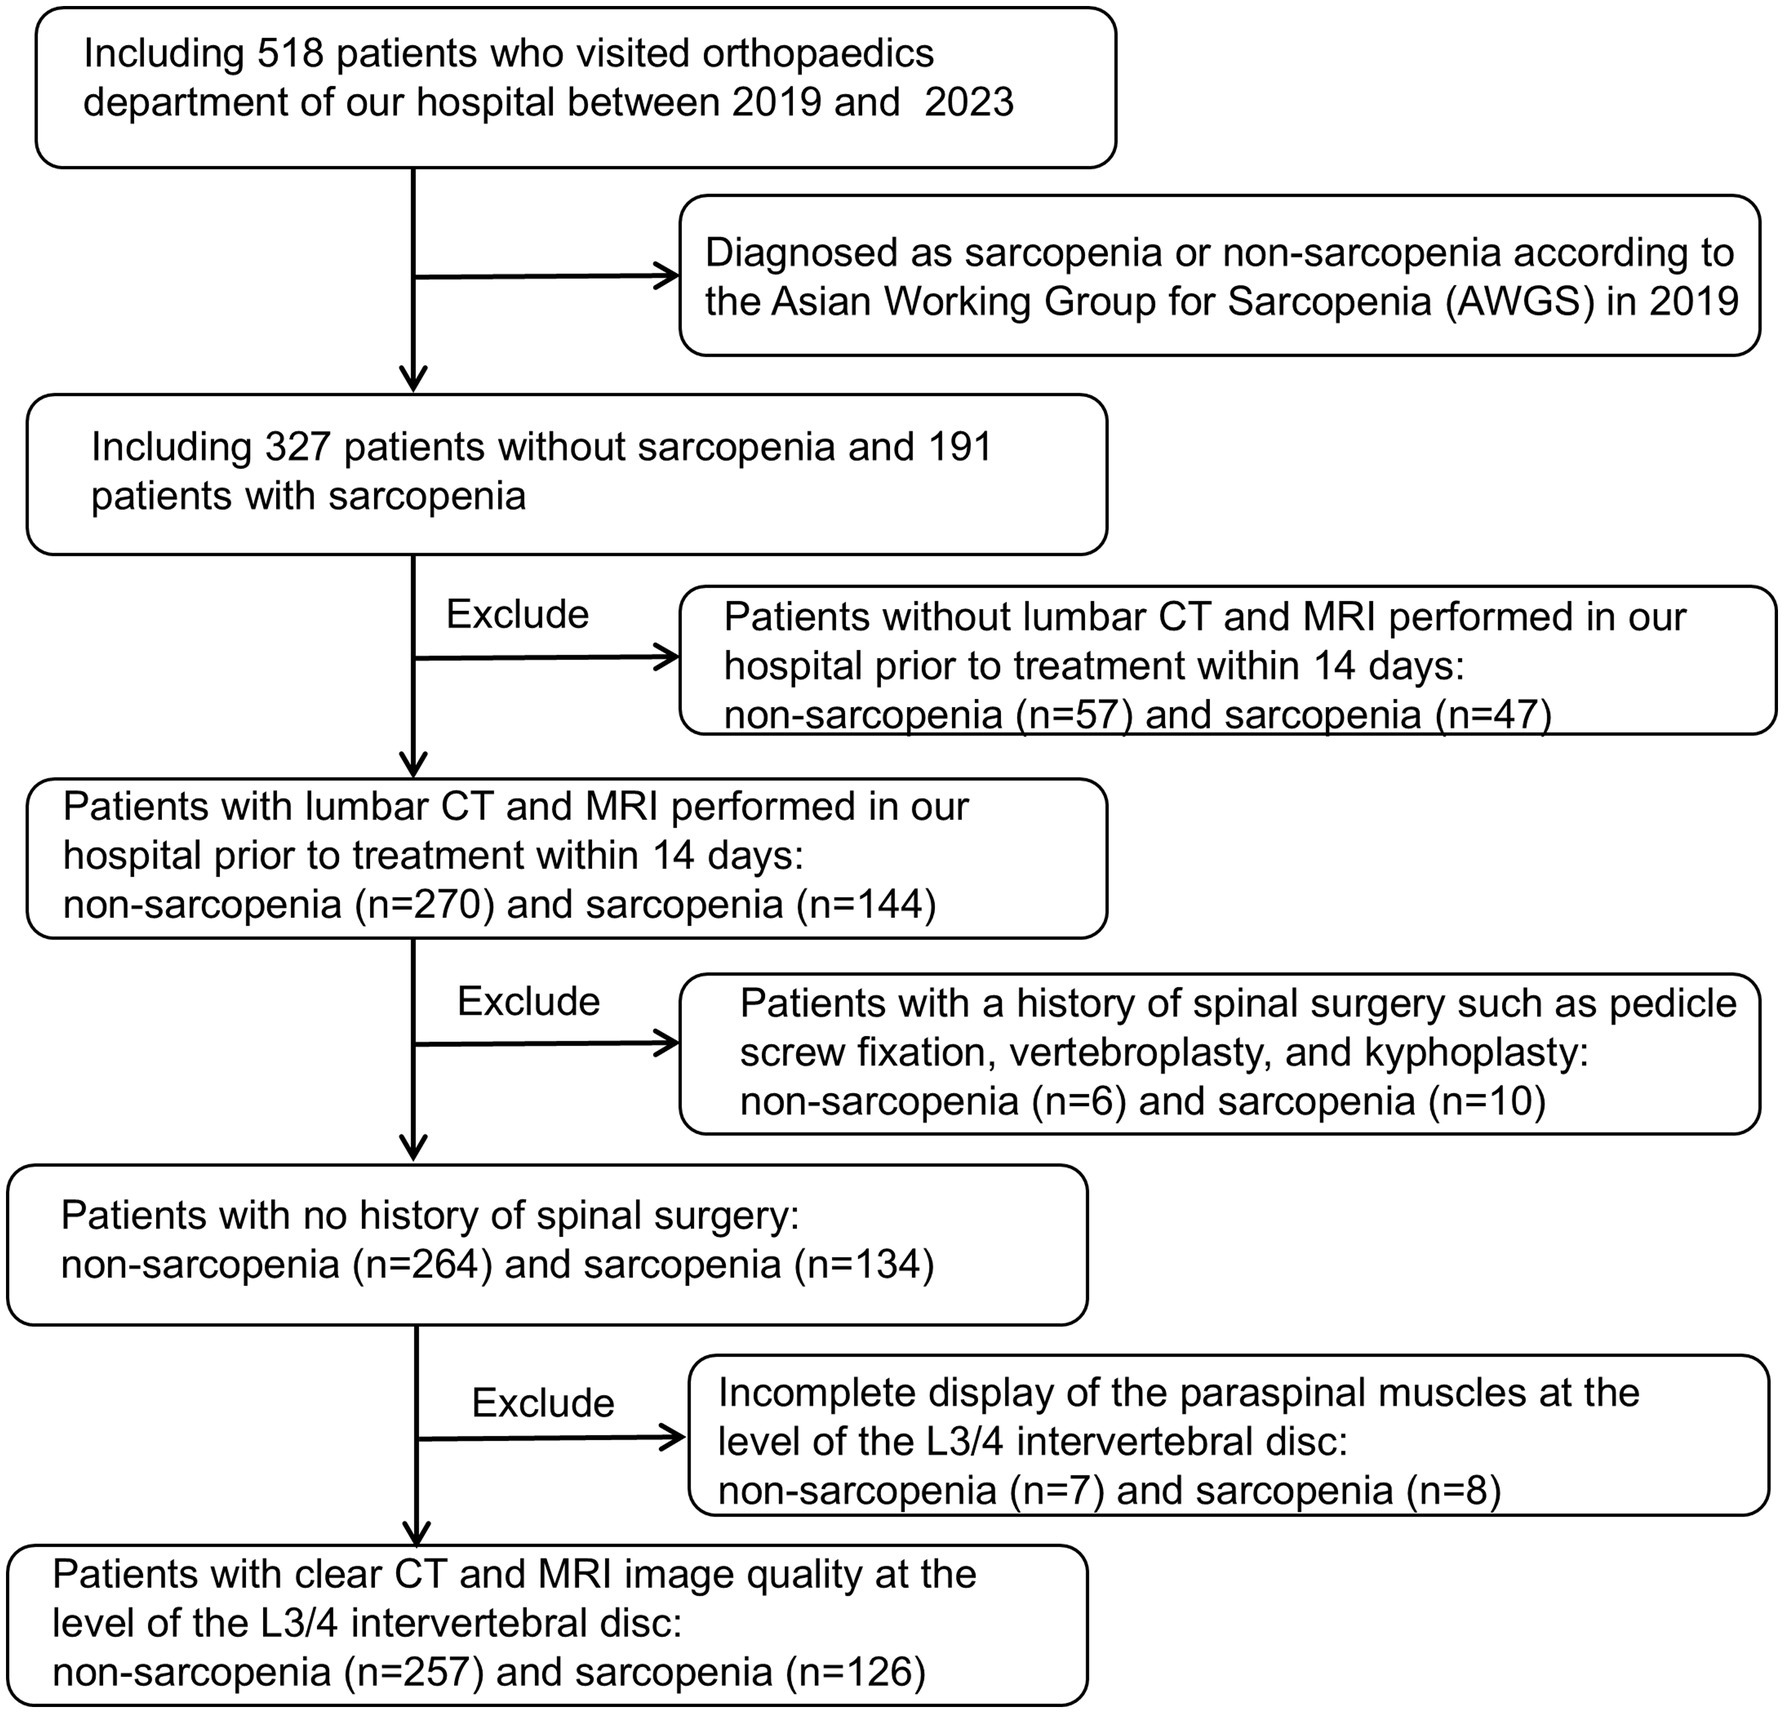
Figure 1. Flowchart of the patient collection process.
Imaging data acquisition
All retrospective patients MRI scans were performed using 1.5 T scanner (MAGNETOM Aera, Siemens Healthineers Ltd., Erlangen, Germany) and 1.5 T scanner (Ingenia, Philips, Netherlands) with 6- and 8-channel body coils, respectively. All patients underwent routine supine lumbar spine MRI scanning with the following sequences: lumbar spine sagittal T2/T1-weighted fast spin–echo sequences and lumbar intervertebral disc axial T2-weighted fast spin-echo sequences. The scan parameters are shown in Table 1. CT scans were performed using Somatom Definition, Aquilion One, Somatom Force, and Somatom Emotion 16 scanners with the following parameters: tube voltage = 100–120 kV, tube current = 20–500 mA, collimation degree = 40 mm, slice thickness = 3 mm, and pitch = 0.984:1. Some parameters were adjusted according to patients’ individual differences. All lumbar MRI scans of prospective patients were performed using a Siemens Aera 1.5 T MRI scanner (Germany), and all CT scans were conducted with a Siemens Somatom Force scanner, following standardized imaging protocols with identical scanning parameters as previously described.
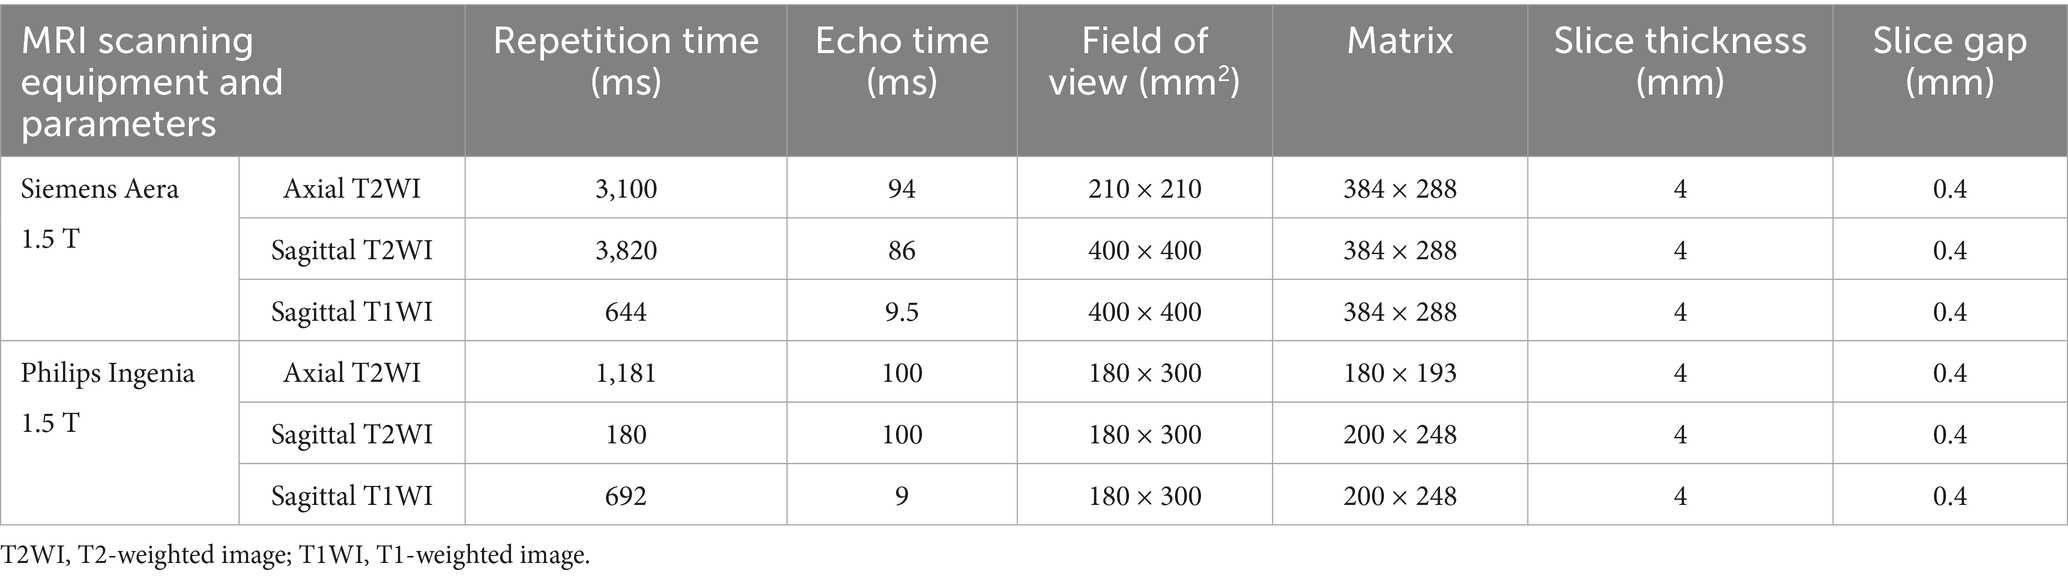
Table 1. The details of MRI parameters of different sequences.
Image quantitative measurement
To preserve the original information from CT and MRI scans, images were stored in a lossless DICOM format. 3D Slicer software (version 5.6.2) and Python (version 3.11.4) were used to preprocess the images. The Resample Image (BRAINS) module resampled the DICOM images to a voxel size of 1 × 1 × 1 mm3, and N4 bias field correction reduced nonuniformity caused by different scanner magnetic fields. A radiologist with 2 years of experience in musculoskeletal imaging utilized MRI axial T2-weighted imaging (T2WI) sequences and CT axial images for anatomical segmentation at the L3-4 intervertebral disc level. The regions of interest (ROIs) for the studied muscles, including the bilateral paraspinal muscles and the psoas major muscle, were manually segmented. Prior to training any algorithm, a series of preprocessing steps were carried out on the ROIs within the training set. In this study, three unsupervised clustering methods—Otsu method, K-means, and GMM—were employed to distinguish muscle and fat tissues in the paraspinal muscles of the lumbar spine. The Otsu method maximized the inter-class variance to classify voxel intensity values into two categories and determine the optimal intensity threshold. K-means clustering used k-means++ initialization and iterative centroid optimization to assign voxels into two clusters representing muscle and fat. GMM was initialized based on the results of K-means and updated using the Expectation–Maximization (EM) algorithm. After clustering, we analyzed the intensity distribution to determine the thresholds for muscle and fat and generated histograms of intensity values to identify peak positions. The Otsu method was then used to optimize these thresholds. Finally, the obtained thresholds were applied to classify voxels in the test set ROIs. Subsequently, after the clustering process, the intensity distributions were analyzed to establish threshold values for muscle and fat. Histograms of intensity values were generated to pinpoint peak positions, and these thresholds were further refined using Otsu’s method.
Based on population-level clustering involves accumulating voxel matrices from all patients’ GMM, K-means, and Otsu clustering results into a global matrix. Using Python (3.9.12) for consistent clustering, we obtain voxel consistency patterns at the population level. Ultimately, habitat images for each patient based on population-level clustering are obtained. The open-source software FeAture Explorer (FAE, v0.5.16) is used to extract habitat parameters, including the volume, percentage, and voxel mean across for each habitat.
To evaluate the reliability of intra-observer and inter-observer delineation of the ROI, a second independent delineation was performed 3 months later on a randomly selected cohort of 50 patients. This task was executed by two radiologists: one who had previously delineated the ROI and another with 15 years of expertise in musculoskeletal diagnostics.
Model building
Initially, univariate analysis was employed to compare the characteristics of patients with and without sarcopenia within the training cohort, aiming to identify parameters with statistically significant differences. Subsequently, individual predictors for sarcopenia were selected based on univariate logistic regression analysis. A predictive model was then developed using multivariate logistic regression, incorporating efficient predictive parameters. Various models were constructed to predict sarcopenia utilizing three unsupervised machine learning algorithms: CT-based GMM, K-means, and Otsu models, as well as MRI-based GMM, K-means, and Otsu models. Additionally, a separate clinical model was developed. A flowchart of the research process is shown in Figure 2.
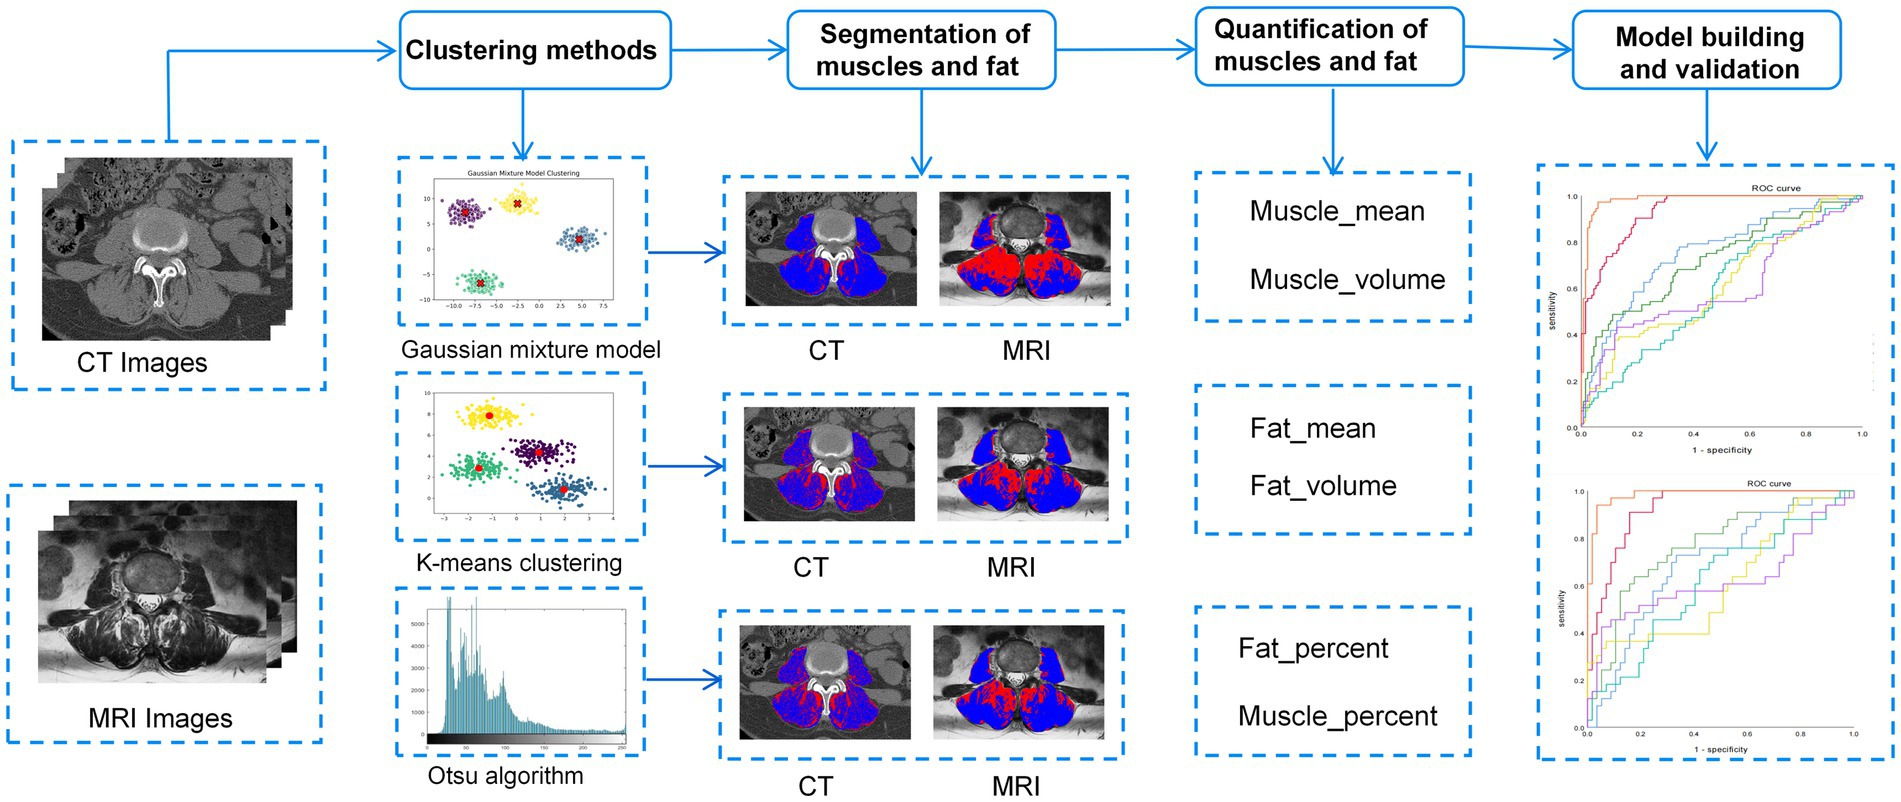
Figure 2. The overall workflow of this study.
Statistical analysis
The study population was randomly divided into training and retrospective validation sets in a 6:4 ratio using Python (version 3.12.4). Data were analyzed using SPSS statistical software (version 26.0 for Windows, IBM) and GraphPad Prism 9.5. A p-value less than 0.05 was considered statistically significant. A two-way random effects model, along with the Intraclass Correlation Coefficient (ICC), was utilized to assess the consistency of intra-observer and inter-observer measurement outcomes. The normality of the data was evaluated using the Kolmogorov–Smirnov test, with continuous variables reported as mean ± standard deviation. To compare differences in quantitative parameters such as age, height, weight, and BMI between the non-sarcopenia and sarcopenia groups in both the training and validation datasets, independent sample t-tests (for normally distributed data with homogeneity of variance) or Mann–Whitney U tests, along with chi-square and Fisher’s exact tests (for categorical variables), were employed. Statistically significant indicators were identified. In the training dataset, univariate logistic regression analysis and multivariate logistic regression with backward stepwise selection were conducted to identify independent predictors and to develop a predictive model for sarcopenia. The predictive performance of the models was evaluated and compared using the area under the receiver operating characteristic (ROC) curve (AUC), from which the corresponding AUC, optimal cutoff value, sensitivity, specificity, and accuracy were derived. The stability of each model was assessed with a five-fold cross-validation ROC curve. The calculation formulas for part of the data in this study are as follows: Sensitivity: Alias: True Positive Rate (TPR). The sensitivity formula is: Sensitivity = TP/(TP + FN). Specificity: Alias: True Negative Rate (TNR). The specificity formula is: Specificity = TN/(TN + FP). The accuracy formula is: Accuracy = (TP + TN)/(TP + TN + FP + FN). TP (true positive); FP (false positive); FN (false negative); TN (true negative). The workflow of this study is illustrated in Supplementary Figure S1.
Results
Clinical parameters
The clinical characteristics of the subjects in the training and retrospective validation sets are summarized in Table 2. A total of 383 patients were divided into a training set (228 patients) and a retrospective validation set (155 patients). In the training set, 149 (65.35%) were non-sarcopenia patients and 79 (34.65%) were sarcopenia patients. In the retrospective validation set, there were 108 non-sarcopenia patients (69.68%) and 47 sarcopenia patients (30.32%). The mean age of the sarcopenia group in the training set (71.65 ± 7.01 years) was greater than that of the non-sarcopenia group (68.13 ± 6.88 years). The statistical analysis revealed no significant differences between the non-sarcopenia and sarcopenia groups concerning variables such as gender, occupation, hypertension, diabetes mellitus, coronary heart disease, pulmonary disease, smoking history, preoperative white blood cell count, neutrophil count, NLR, and calcium ion concentration, with all p-values exceeding 0.05. However, significant differences were observed in age, BMI, preoperative RBC, hemoglobin, and serum albumin (all p < 0.05). According to univariate and multivariate logistic regression analysis, age, BMI, and preoperative serum albumin were effective predictive parameters, as shown in Table 3.
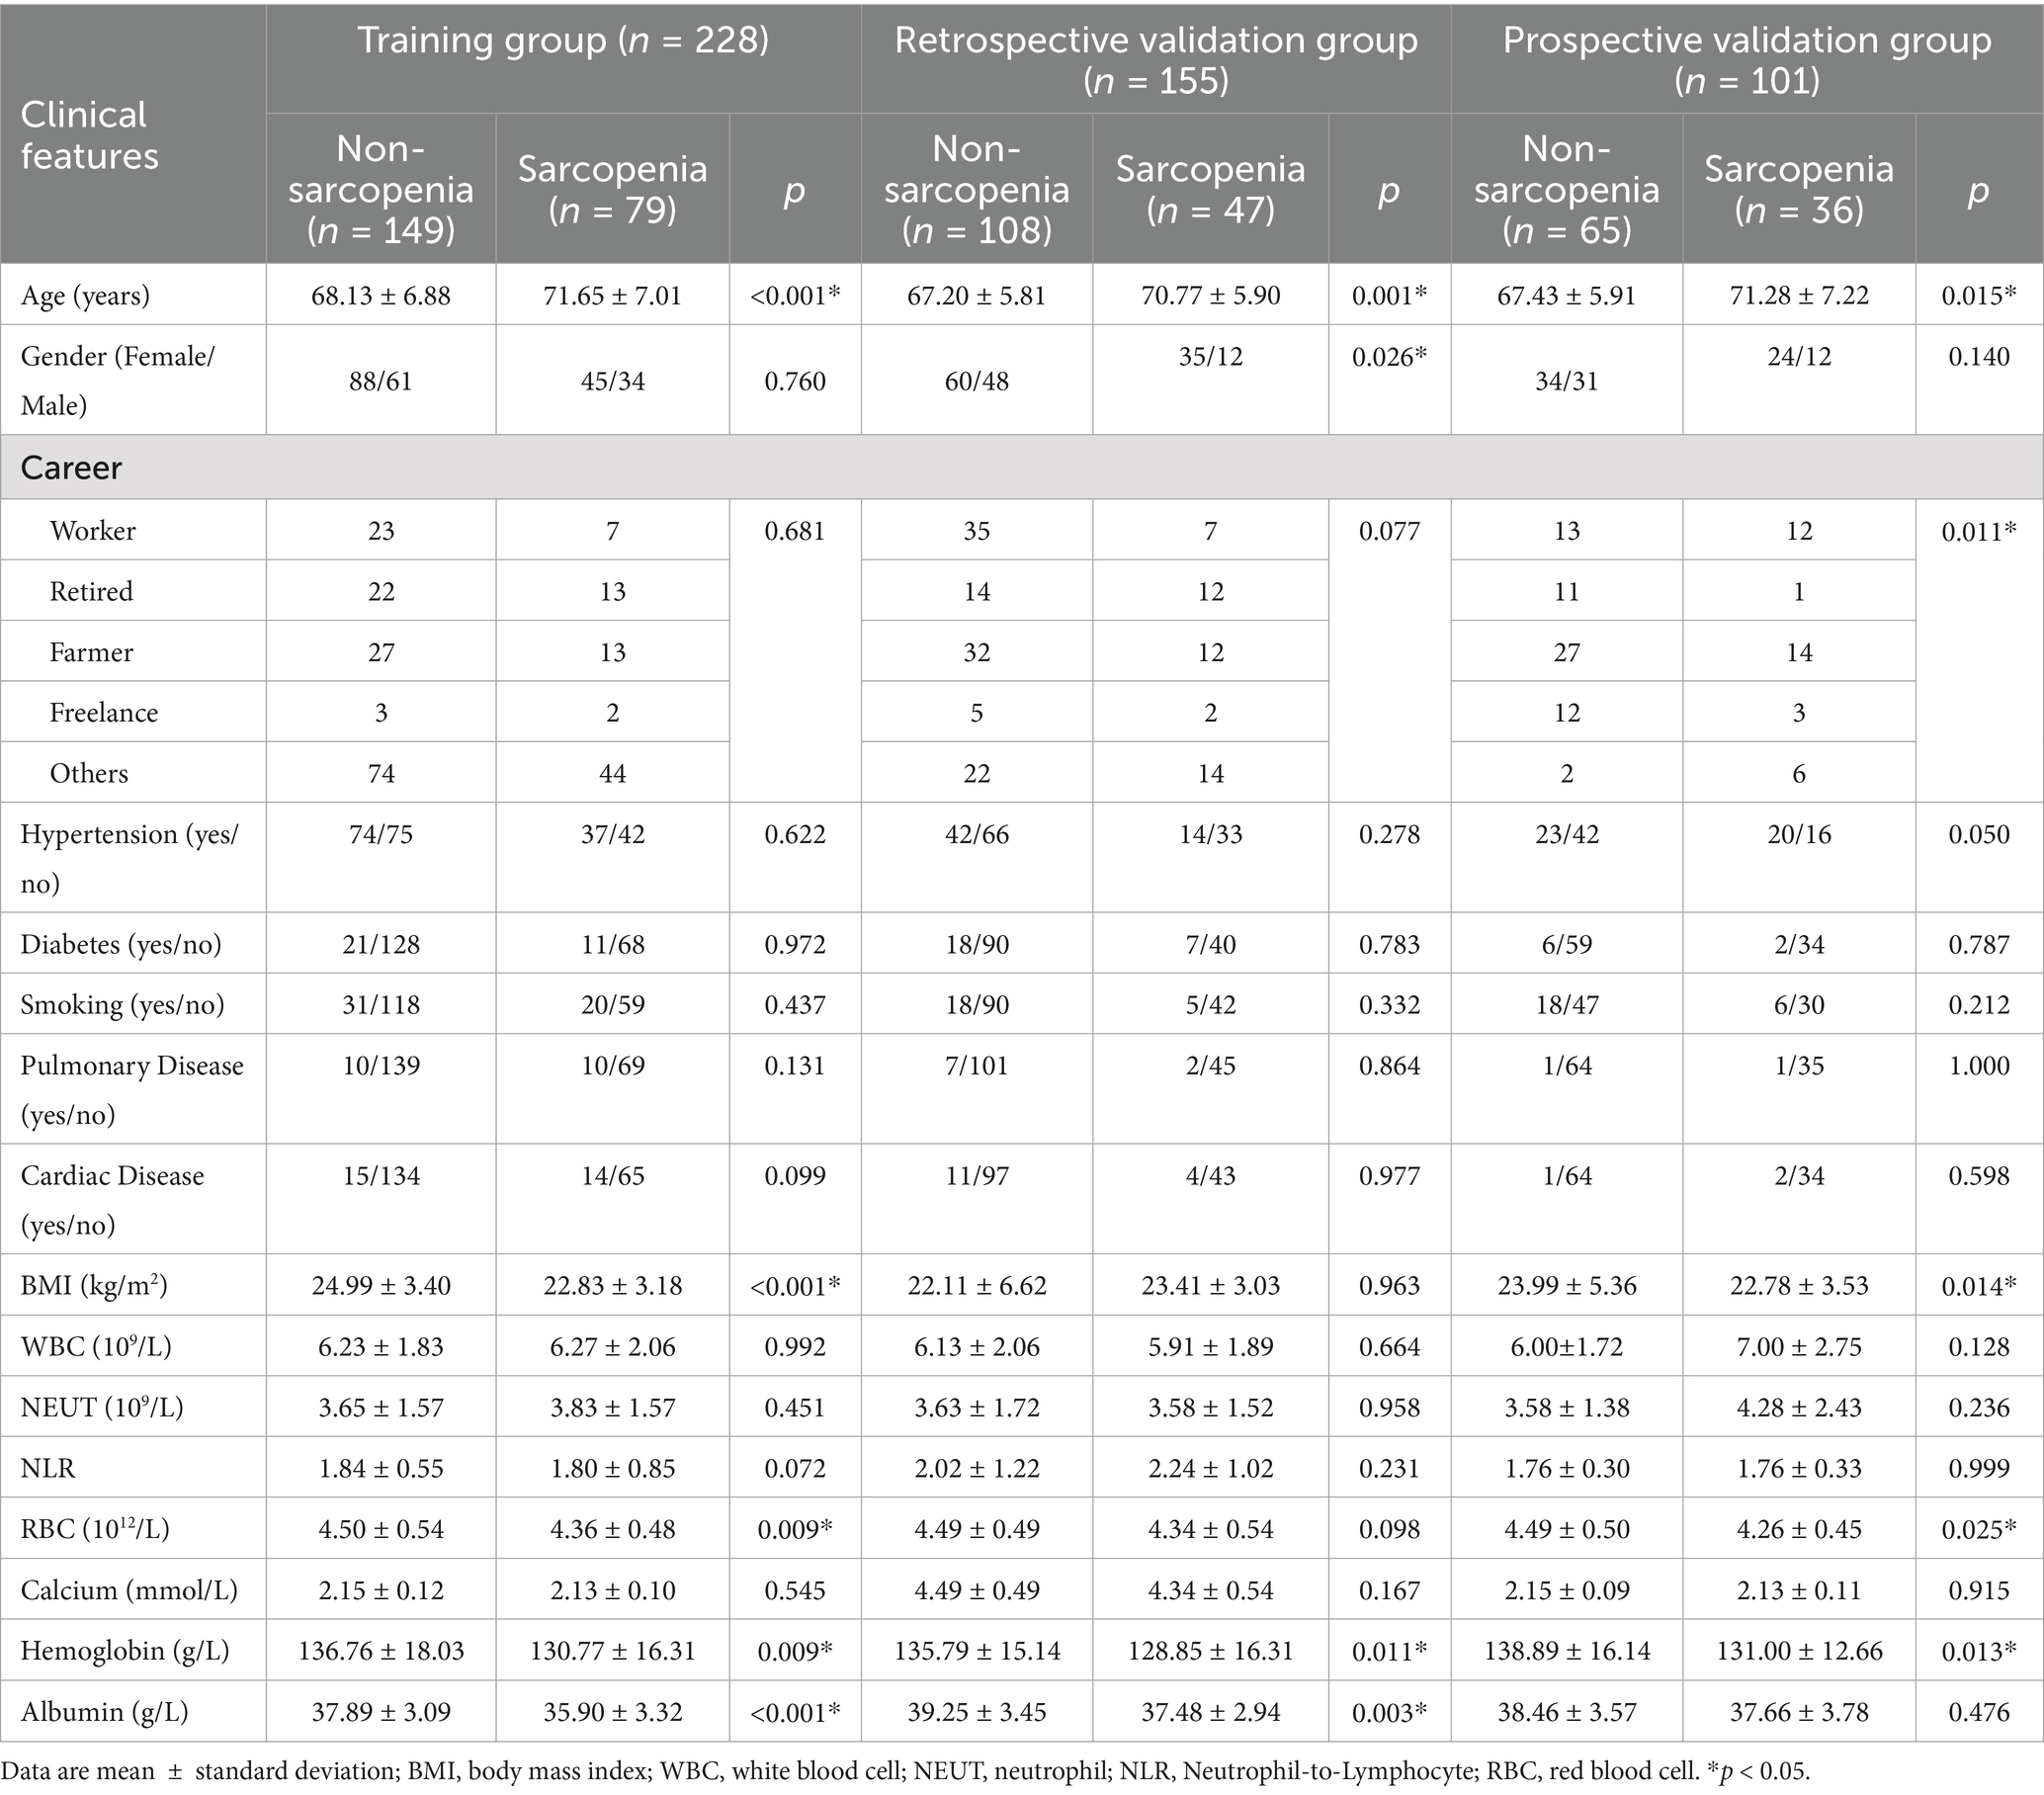
Table 2. Demographic and clinical characteristics of the training and validation groups.
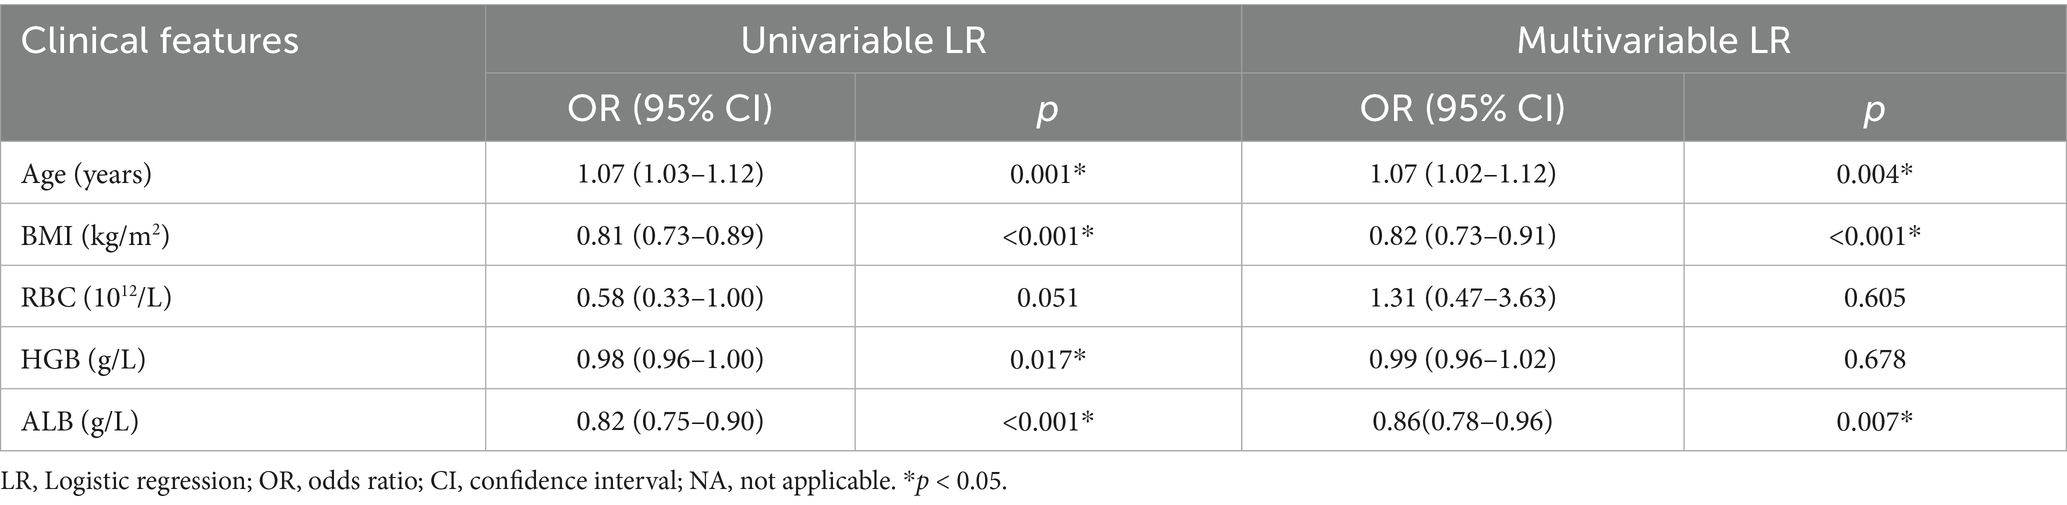
Table 3. Logistic regression analysis of clinical characteristics between the non-sarcopenia patients and the sarcopenia patients in the training group.
Intra- and inter-observer consistency of quantitative parameters
The quantitative parameters derived from a single radiologist delineating the ROI twice demonstrated strong intra-observer reliability, while those obtained from two radiologists independently delineating the ROI exhibited robust inter-observer reliability. Specifically, for ROI delineation in CT images, the intra-observer and inter-observer ICCs were 0.976 and 0.928, respectively. For ROI delineation in MRI images, the intra-observer and inter-observer ICCs were 0.994 and 0.945, respectively. Detailed results are presented in Supplementary Figure S2.
Image analysis
Within the training set, the differences in mean, volume, and percentage of fat, as well as in volume and percentage of muscle, between the non-sarcopenia and sarcopenia groups were statistically significant (p < 0.05) in the CT-based GMM. Similar significant differences were observed in the CT-based Otsu models. The differences in mean, and percentage of fat and in volume, and percentage of muscle between the non-sarcopenia and sarcopenia groups were statistically significant (p < 0.05) in the CT-based K-means model. In the MRI-based GMM model, differences in mean of fat and differences in mean, volume of muscle were statistically significant (p < 0.05). Similar significant differences were observed in the MRI-based K-means and Otsu models. The analysis results are shown in Figure 3 and Supplementary Table 1. Independent predictors in the CT-based GMM model was fat mean. In the CT-based K-means model, the predictors were fat mean and percentage, and muscle volume and percentage. In the CT-based Otsu model, the predictors were fat mean and percentage, and muscle volume and percentage. In the MRI-based GMM model, the predictor was muscle mean; in the MRI-based K-means model, it was muscle volume; and in the MRI-based Otsu model, it was muscle volume, as shown in Table 4.
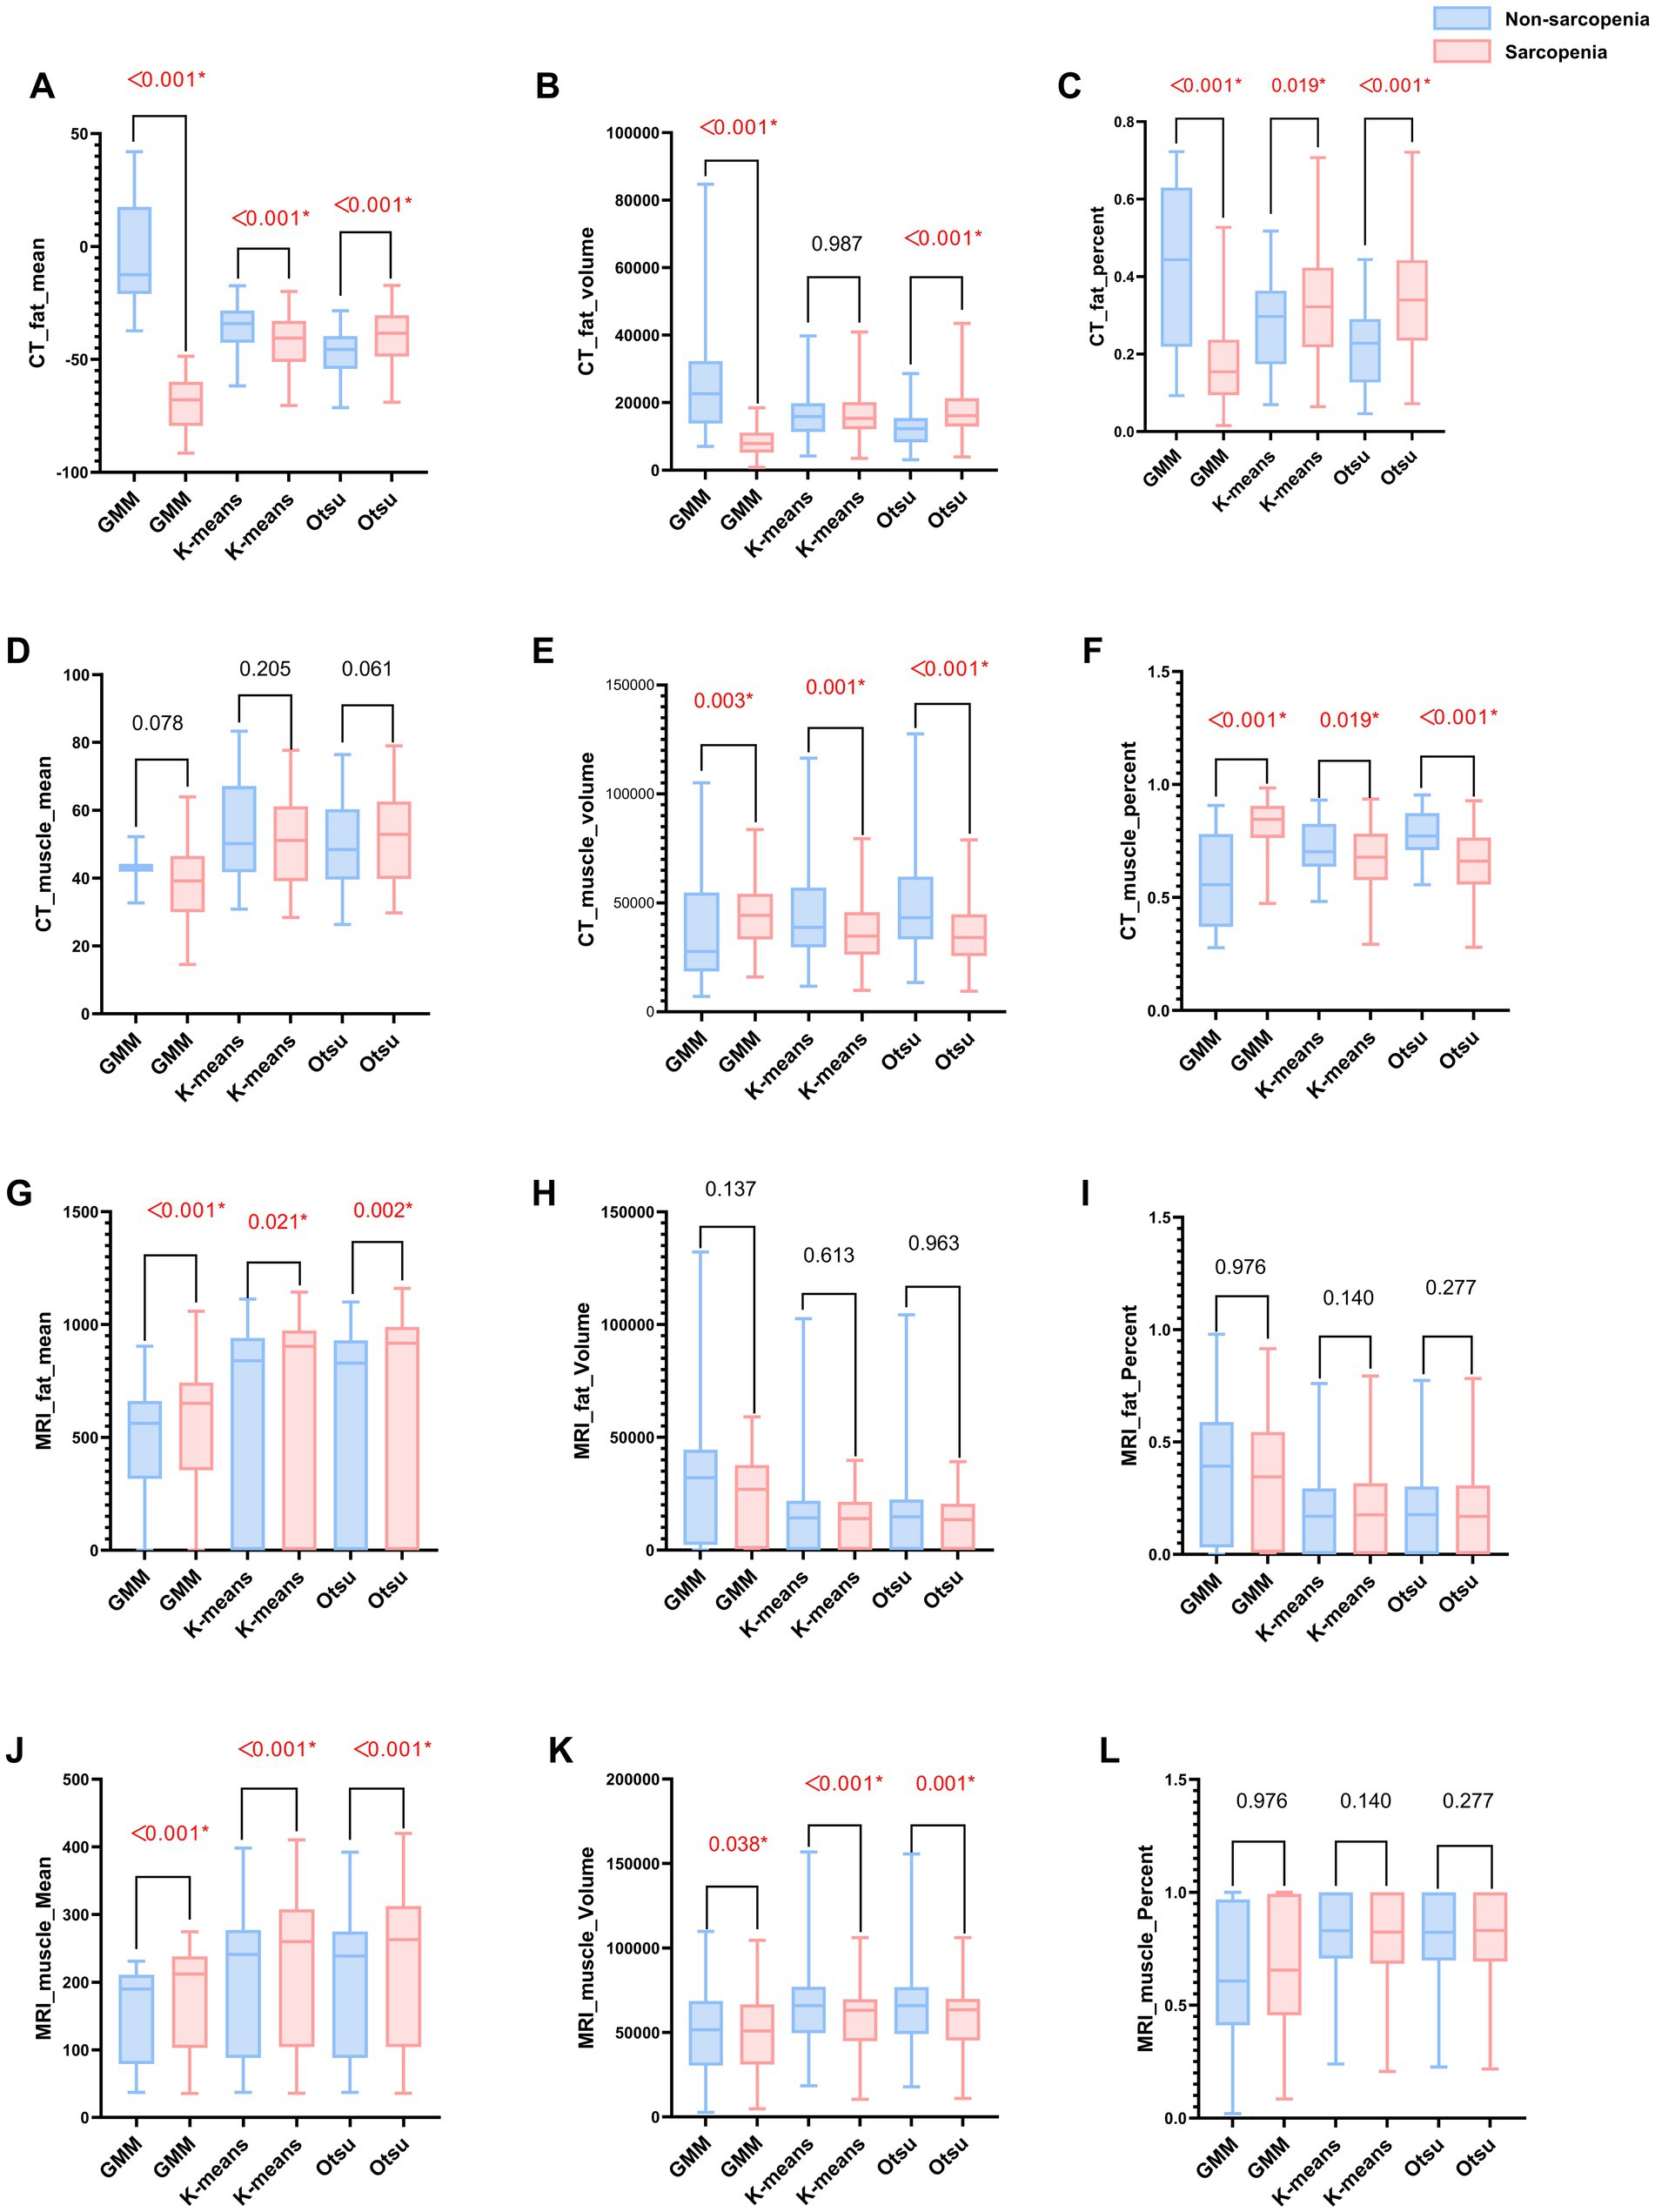
Figure 3. (A–L) Bar graphs of MRI and CT characteristics derived from different models in the non-sarcopenia patients and the sarcopenia patients in the training group. A red asterisk indicate statistical significance difference.
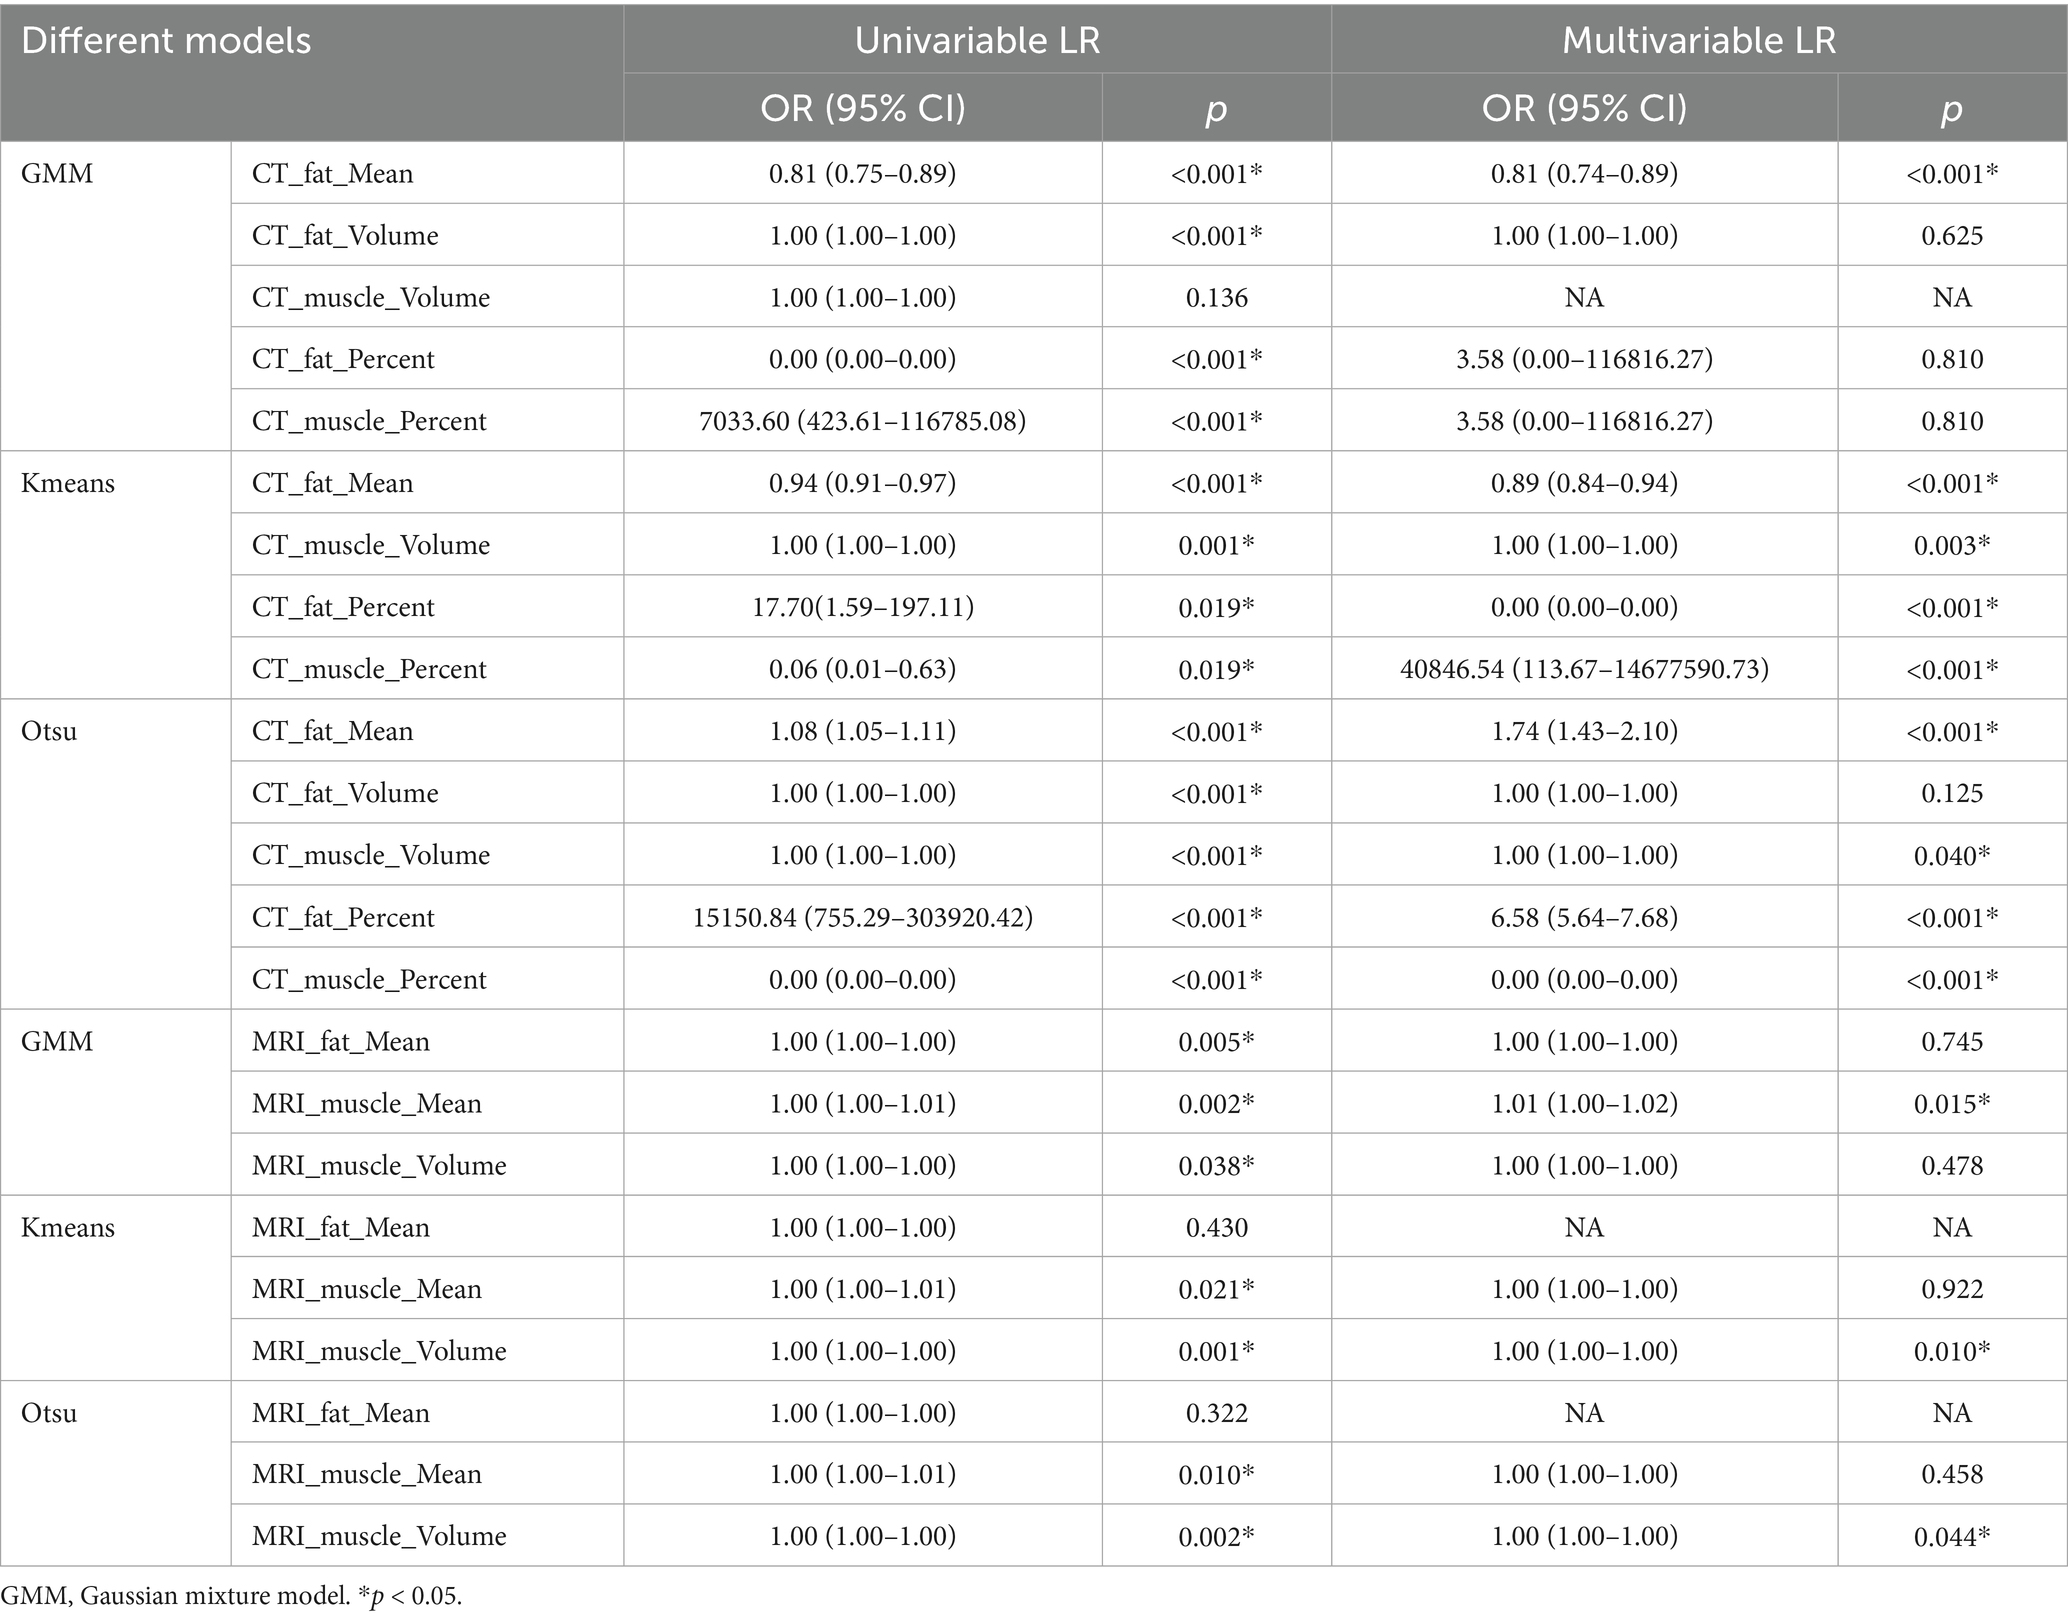
Table 4. Logistic regression analysis of different imaging models between non-sarcopenia patients and the sarcopenia patients in the training group.
The performance of different models and cross-validation on the training data set
Table 5 presents the comparison of the diagnostic efficiency of different models. In the training set, the CT-based GMM model achieved the highest AUC values (AUC = 0.990), followed by the CT-based Otsu model (AUC = 0.986), the clinical model (AUC = 0.764), the CT-based K-means model (AUC = 0.727), the MRI-based GMM model (AUC = 0.697), the MRI-based K-means model (AUC = 0.649), and the MRI-based Otsu model (AUC = 0.638). In the retrospective validation group, the diagnostic efficiency from highest to lowest was: CT-based Otsu model (AUC = 0.958), CT-based GMM model (AUC = 0.903), the CT-based K-means model (AUC = 0.772) clinical model (AUC = 0.719), MRI-based K-means model (AUC = 0.537), MRI-based GMM model (AUC = 0.537), and MRI-based Otsu model (AUC = 0.528). In the prospective validation cohort, the CT-based Otsu model demonstrated the highest diagnostic efficiency (AUC = 0.819). Figure 4 shows a schematic of the segmentation for the better-performing models, and Figure 5 presents the ROC curves for model comparison. Using five-fold cross-validation on the training set, the CT-based GMM model demonstrated the best stability (average AUC = 0.99), followed by the CT-based Otsu model (average AUC = 0.94). Detailed ROC curves and average AUC values for the five-fold cross-validation are shown in Supplementary Figures S3, S4.
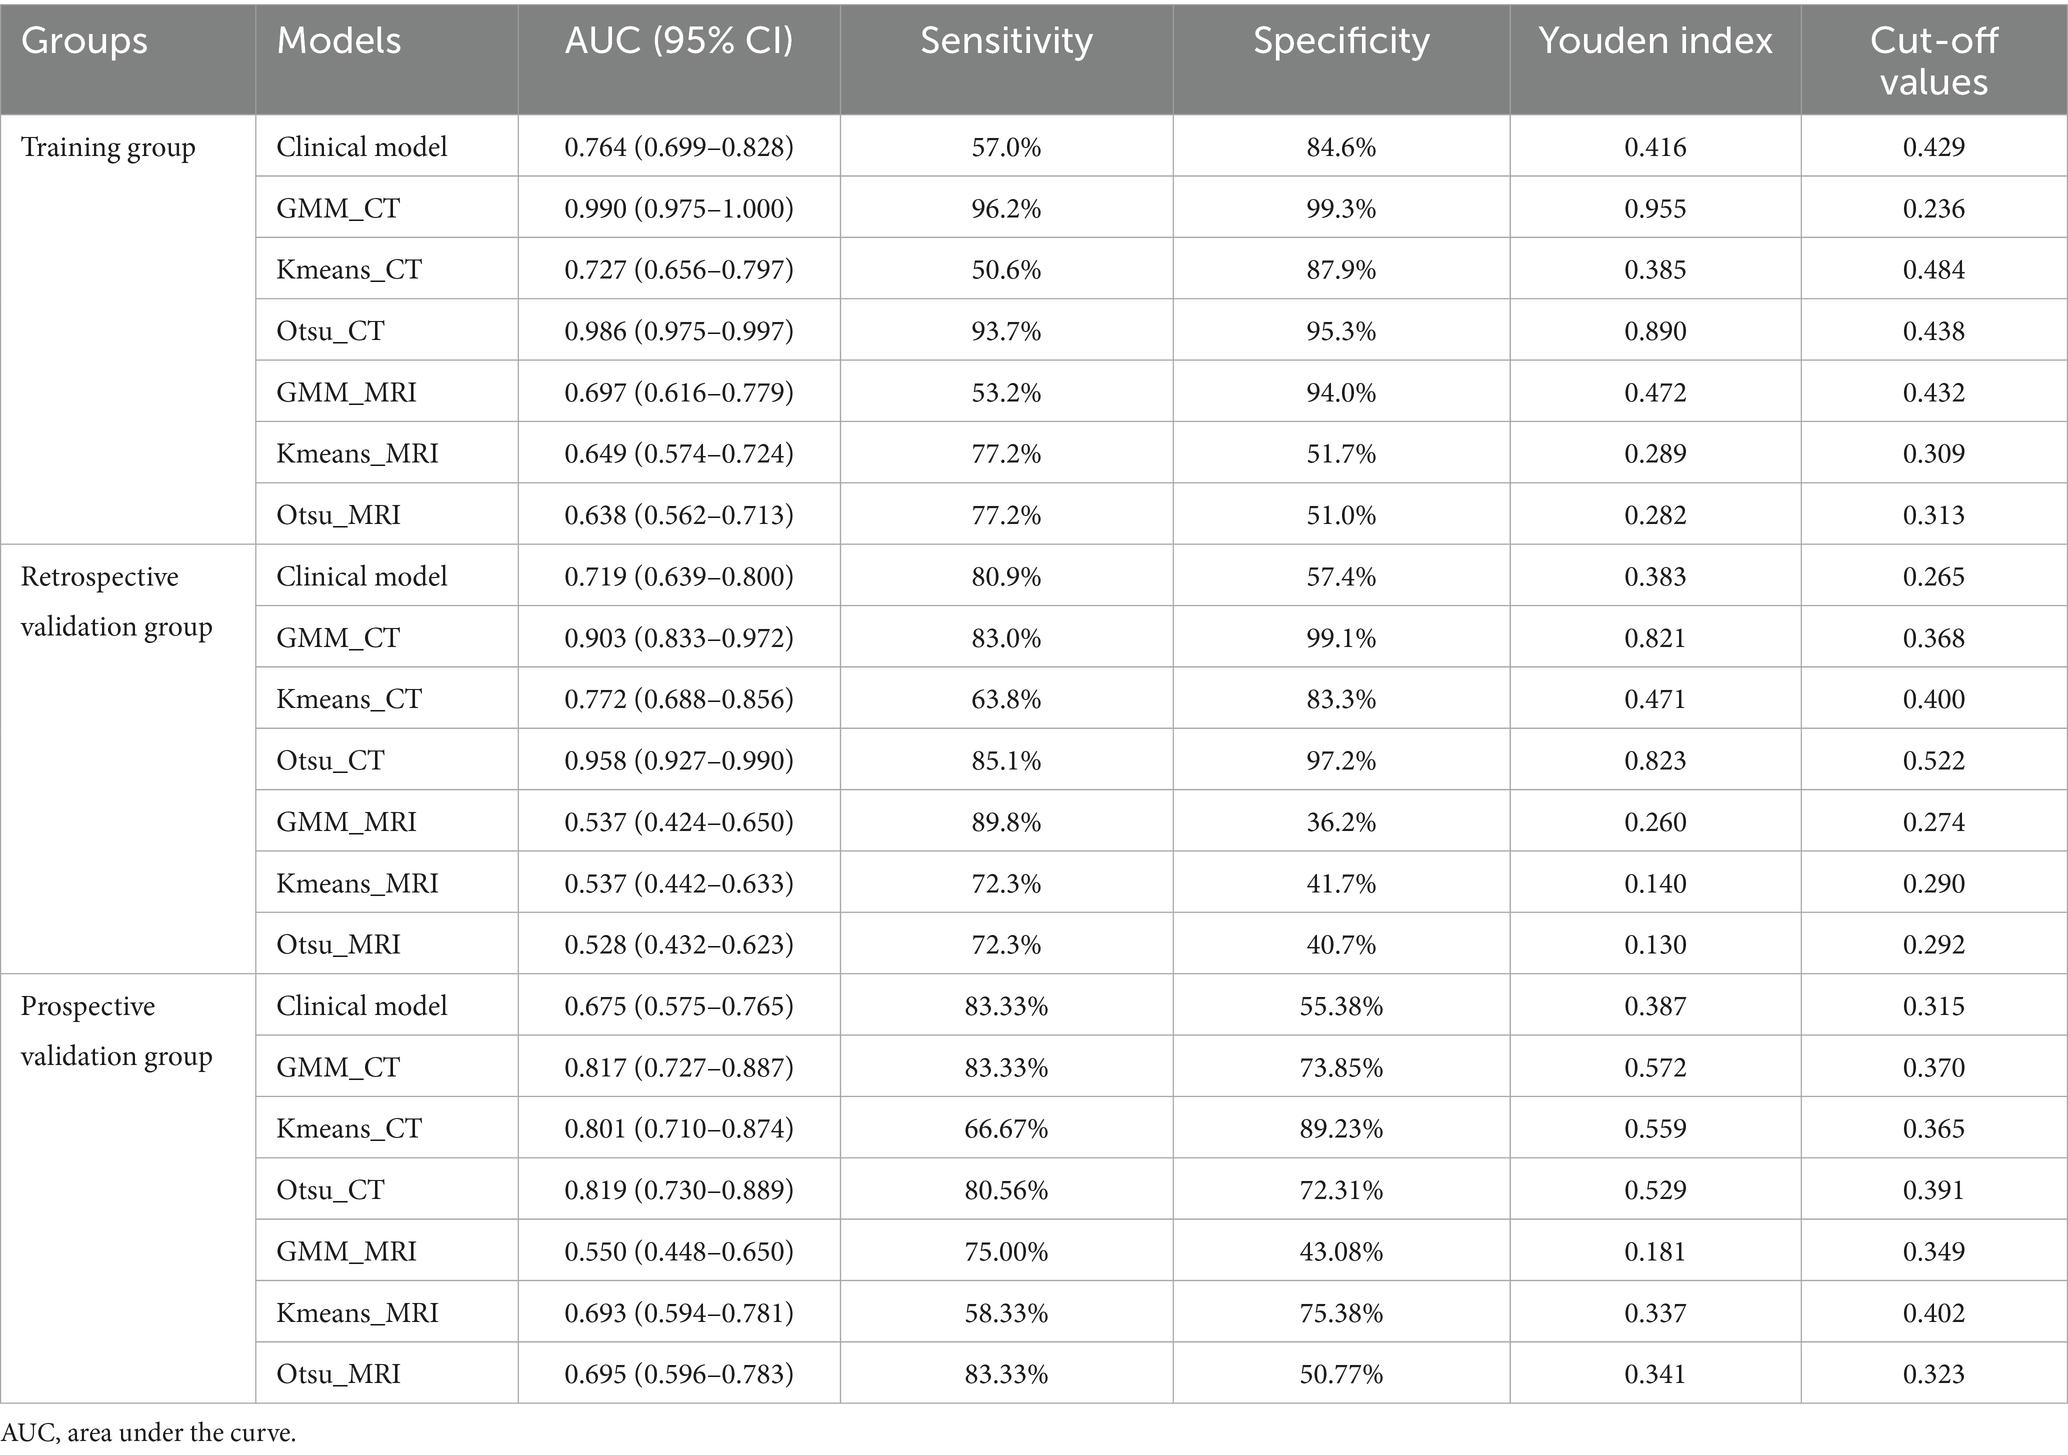
Table 5. Comparison of AUCs for different models in the training group and the validation group.
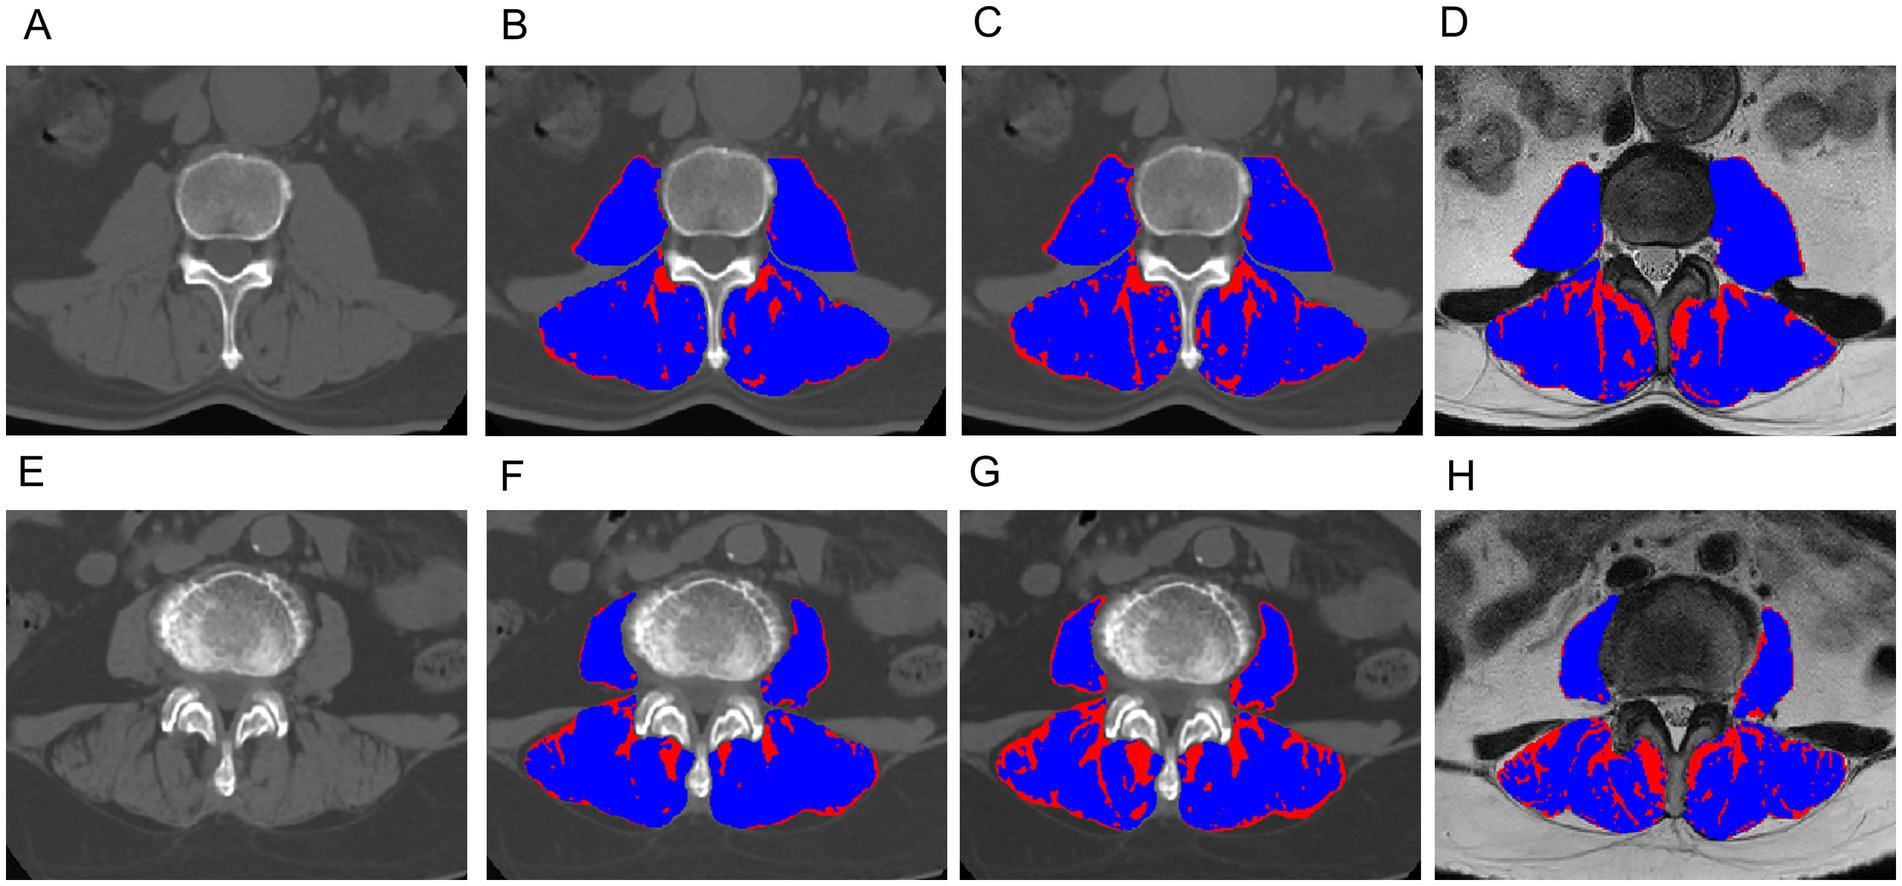
Figure 4. Exemplary slices showing the differentiation between muscle (blue) and fat (red) obtained with the CT-based Gaussian Mixture Model (B,F), CT-based Otsu thresholding method (C,G) and MRI-based Otsu thresholding method (D,H), (A–D): A 62-year-old male with sarcopenia; (E–H): an 66-year-old female without sarcopenia. The AUC of the CT-based Gaussian Mixture Model and the Otsu model for predicting sarcopenia was 0.98 and 0.93, respectively. The AUC of the Gaussian mixture model and the Otsu model for predicting sarcopenia was 0.990 and 0.986, respectively.
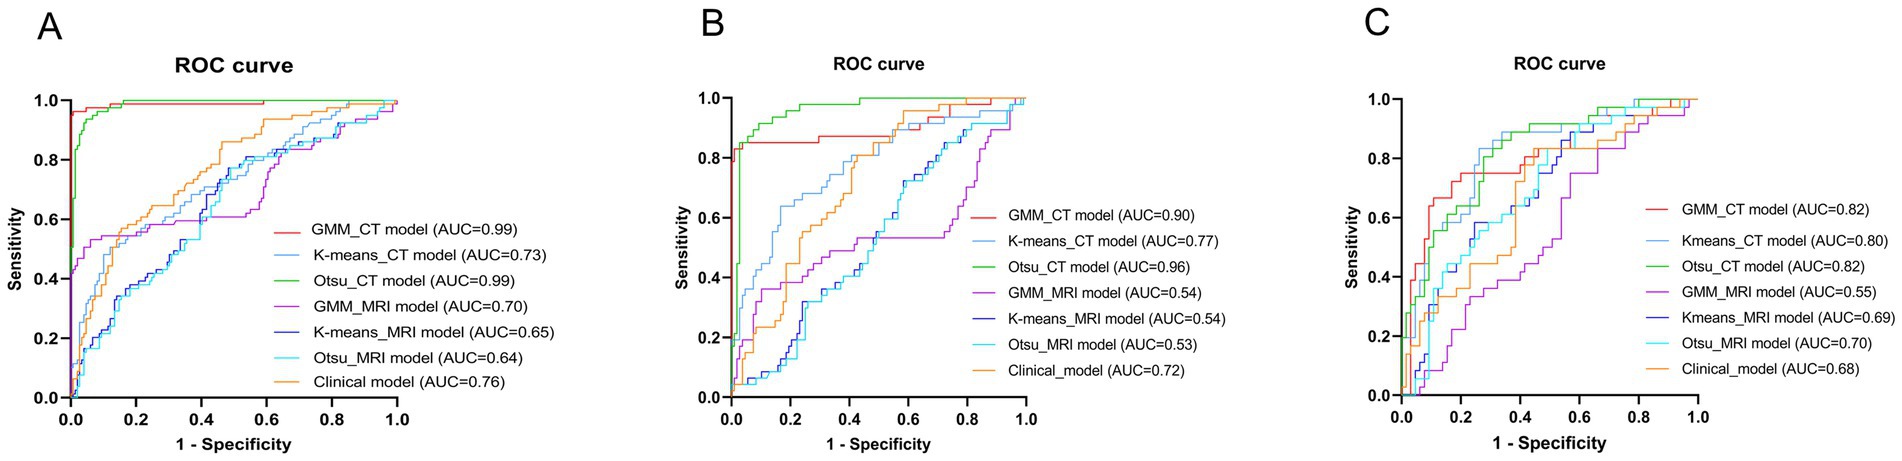
Figure 5. Receiver operator characteristic (ROC) curves of different models in the training group (A), the retrospective validation group (B) and the prospective validation group (C).
Discussion
In this study, we introduce an innovative unsupervised learning algorithm designed for the quantitative assessment of paraspinal muscle components utilizing CT and MR imaging modalities. Our findings indicate that the Otsu and GMM algorithms, when applied to CT scans, exhibit superior efficacy in predicting sarcopenia. Through logistic regression analysis, we determined that age, BMI, and serum albumin levels are significantly associated with sarcopenia. It is well-documented that the prevalence of sarcopenia escalates with advancing age, and its implications for public health are intensifying due to the aging population (19). BMI is a critical factor in sarcopenia (20). BMI emerges as a pivotal factor in the context of sarcopenia, as weight gain and obesity can expedite the onset and progression of this condition, either directly or indirectly. In individuals with obesity, the accumulation of pro-inflammatory macrophages and other immune cells within adipose tissue, coupled with the dysregulated secretion of various adipokines and cytokines, fosters a chronic pro-inflammatory state (21, 22). Furthermore, the excessive secretion from adipose tissue and the compromised lipid storage capacity observed in obese individuals contribute to ectopic lipid deposition within skeletal muscle. Intramuscular lipids contribute to mitochondrial dysfunction and enhance the secretion of specific pro-inflammatory myokines, thereby inducing muscle dysfunction (23). It is hypothesized that individuals with higher adiposity may have increased protein intake, which serves as a protective factor against sarcopenia (24). Consequently, maintaining a healthy weight is essential for preserving muscle mass and strength in older adults. Serum albumin concentration is a valuable indicator of an individual’s nutritional status, with lower levels signifying reduced protein reserves and the initiation of catabolic processes that lead to muscle degradation (25–27). Elevated free cortisol levels have been observed in patients with hypoalbuminemia, further promoting muscle breakdown, particularly in inactive individuals. Albumin is capable of activating the phosphatidylinositol 3-kinase pathway, which mediates muscle. This study used measurement of muscle mass at the level of the L3 because the muscle mass at the L3 vertebral level is recognized as a pivotal indicator for evaluating total body muscle mass. The cross-sectional area (CSA) at this level demonstrates a robust correlation with overall body muscle mass and serves as an effective reflection of the systemic musculature’s health status. Numerous clinical guidelines and studies have identified the skeletal muscle cross-sectional area (SMCSA) at the L3 level as a critical metric for assessing sarcopenia (28).
In our study, the predictive performance of CT-based models was superior to that of MRI-based models. CT has emerged as the most widely utilized cross-sectional imaging modality globally. Fron et al. (10) demonstrated a high level of concordance in imaging-derived biomarkers of muscle quantity and mass between CT and MRI in healthy subjects, indicating that both modalities can be used interchangeably for skeletal muscle assessment. The muscle area calculated from CT scans exhibits a strong correlation with total body muscle mass and is regarded as the gold standard for body composition analysis and the diagnosis of abnormal body composition phenotypes, particularly in malnourished patients (29–31). Tandon et al. observed that skeletal muscle area measurements obtained directly from CT and MRI tend to be systematically larger in CT than in MRI (32, 33). CT is capable of accurately quantifying muscle quality and identifying intramuscular fat, making it suitable for assessing muscle steatosis (34). Quantitative tissue measurements from CT are highly reproducible and show a strong correlation with clinical outcomes (35). CT offers advantages in the staging and follow-up of cancer and other diseases, rendering it ideal for the opportunistic evaluation of sarcopenia without the need for additional tests. Consequently, CT is extensively utilized in research across several retrospective and prospective analyses (36).
MRI holds promise for the assessment of sarcopenia; however, its application is constrained by high costs, extended scanning and post-processing durations, operational complexity, and the absence of standardized protocols. The quality of MRI imaging is highly contingent upon the configuration of scanning parameters. Inappropriate selection of parameters, such as echo time (TE), repetition time (TR), may lead to suboptimal image contrast or increased noise, thus compromising the clear visualization of soft tissues. In addition, this study segmented muscle and fat in the paraspinal muscles on T2WI and CT. The soft tissue contrast of MRI is not as clear as that of CT, so its predictive performance for sarcopenia is lower than that of CT. Consequently, its clinical use is largely confined to scenarios involving disease treatment or follow-up (37). The Otsu automatic thresholding algorithm, which segments images into foreground and background by optimizing inter-class variance based on the gray-level histogram, has been employed by Rui et al. to segment muscle tissue and quantify the fatty content of the gluteus maximus. This method yielded Dice Similarity Coefficients (DSCs) of 0.930 and 0.873, with fat ratio measurements aligning closely with those of radiologists, thereby demonstrating robust segmentation performance and potential for further muscle assessment (38, 39). In our study, the Otsu thresholding technique exhibited strong predictive capabilities, effectively delineating muscle tissue contours and features pertinent to sarcopenia prediction.
Additionally, the GMM, a renowned segmentation method grounded in mixture models, provides flexibility and efficacy for multivariate data analysis, and is frequently employed by researchers to address critical challenges in image segmentation. Ryan et al. (40) employed the GMM for the segmentation of abdominal organs, achieving DSC values ranging from 0.7 to 0.9, thereby establishing a benchmark for large-scale automatic abdominal segmentation. In our research, the GMM also exhibited superior predictive efficacy, suggesting that among the models evaluated, the GMM holds greater utility for assessing sarcopenia. This phenomenon may be attributed to the GMM’s capability to partition data into distinct Gaussian distributions by identifying these distributions within the dataset, thus enabling the model to adapt to real-world data with diverse cluster structures (41).
Conversely, K-means clustering, a fundamental clustering technique known for its straightforward structure, rapid segmentation, and versatility, was found by Thomas et al. (13) to effectively quantify total muscle volume compartments in sarcopenia, successfully distinguishing between contractile and non-contractile tissue components. However, in our study, the performance of K-means was suboptimal, potentially due to challenges in determining initial cluster centers and the slow convergence speed when processing large-scale images (42).
This study has some limitations. Firstly, this study is a single-center retrospective analysis with a limited sample size and lacks external validation. Although we have employed five-fold cross-validation to verify our findings, future research should involve multi-center studies with larger sample sizes. Secondly, despite standardizing image processing, variations in MRI scanning parameters, such as slice thickness, exist among different patients. The impact of these variations on our analysis remains uncertain, and we intend to conduct prospective validation in the future. Thirdly, the ROIs in this study were manually delineated by a single operator. While manual sketching is considered the gold standard in research, it is time-consuming and susceptible to the operator’s experience. Future studies should explore more accurate automatic or semi-automatic methods for lesion delineation.
Conclusion
Unsupervised clustering algorithms based on CT and MRI have demonstrated effectiveness in predicting sarcopenia, with the CT-based Otsu and GMM exhibiting superior accuracy, achieving an AUC greater than 0.95. This model can be widely used in primary healthcare settings or developing regions with aging populations and can assist healthcare providers in treating patients with early-stage sarcopenia. Our research underscores the importance of imaging modalities (CT and MRI) in diagnosing sarcopenia. Integrating these evaluations with clinical symptoms and physical exams can improve diagnostic accuracy and patient care. For prevention, lifestyle interventions are crucial. Healthcare professionals should promote regular exercise, balanced diets, and healthy habits through comprehensive health education. Implementing these insights in healthcare policies and practices can enhance outcomes for sarcopenia patients, reduce healthcare burdens, and improve quality of life for the aging population.
Data availability statement
The raw data supporting the conclusions of this article will be made available by the authors, without undue reservation.
Ethics statement
The studies involving humans were approved by the Institutional Review Board (or Ethics Committee) of the First People’s Hospital of Yunnan Province (reference number KHLL2023-KY209). The studies were conducted in accordance with the local legislation and institutional requirements. Written informed consent for participation was not required from the participants or the participants' legal guardians/next of kin in accordance with the national legislation and institutional requirements.
Author contributions
HZ: Conceptualization, Formal analysis, Investigation, Writing – original draft. QB: Conceptualization, Funding acquisition, Project administration, Writing – review & editing, Methodology. XL: Conceptualization, Writing – review & editing, Data curation, Visualization. GB: Writing – review & editing, Supervision. YWa: Formal analysis, Writing – review & editing. YWu: Writing – review & editing, Software. GY: Writing – review & editing, Software, Resources. CZ: Software, Writing – review & editing. YS: Resources, Writing – review & editing. GW: Data curation, Resources, Project administration, Writing – review & editing. QW: Writing – review & editing, Funding acquisition, Resources, Project administration, Data curation. XG: Project administration, Data curation, Writing – original draft, Funding acquisition, Resources.
Funding
The author(s) declare that financial support was received for the research and/or publication of this article. This study was supported by Yunnan Orthopaedic and Sports Rehabilitation Clinical Medical Research Center (2023YJZX-GK01 and 202102AA310068), Yunnan Spinal Cord Disease Clinical Medical Center (2024JSKFKT-05, 2024JSKFKT-17, and ZX2022000101), Yunnan Provincial Department of Science and Technology, Applied Basic Surface Project (202201AT070278), Yunnan Provincial Department of Science, Technology, Kunming Medical Joint Special-Project (202201AC070436), the Basic Research on Application of Joint Special Funding of Science and Technology Department of Yunnan Province-Kunming Medical University (202401AY070001-116), and the First People’s Hospital of Yunnan Province & Provincial Clinical Key Specialty of Medical Imaging Department (2024YXKFKT-06).
Acknowledgments
We thank the participants of the study.
Conflict of interest
The authors declare that the research was conducted in the absence of any commercial or financial relationships that could be construed as a potential conflict of interest.
Generative AI statement
The author(s) declare that no Gen AI was used in the creation of this manuscript.
Any alternative text (alt text) provided alongside figures in this article has been generated by Frontiers with the support of artificial intelligence and reasonable efforts have been made to ensure accuracy, including review by the authors wherever possible. If you identify any issues, please contact us.
Publisher’s note
All claims expressed in this article are solely those of the authors and do not necessarily represent those of their affiliated organizations, or those of the publisher, the editors and the reviewers. Any product that may be evaluated in this article, or claim that may be made by its manufacturer, is not guaranteed or endorsed by the publisher.
Supplementary material
The Supplementary material for this article can be found online at: https://www.frontiersin.org/articles/10.3389/fpubh.2025.1649400/full#supplementary-material
References
1. Cruz-Jentoft, AJ, Bahat, G, Bauer, J, Boirie, Y, Bruyère, O, Cederholm, T, et al. Sarcopenia: revised European consensus on definition and diagnosis. Age Ageing. (2019) 48:601. doi: 10.1093/ageing/afz046
3. Tanaka, S, Kamiya, K, Hamazaki, N, Matsuzawa, R, Nozaki, K, Maekawa, E, et al. Utility of SARC-F for assessing physical function in elderly patients with cardiovascular disease. J Am Med Dir Assoc. (2017) 18:176–81. doi: 10.1016/j.jamda.2016.10.019
4. Shu, X, Lin, T, Wang, H, Zhao, Y, Jiang, T, Peng, X, et al. Diagnosis, prevalence, and mortality of sarcopenia in dialysis patients: a systematic review and meta-analysis. J Cachexia Sarcopenia Muscle. (2022) 13:145–58. doi: 10.1002/jcsm.12890
5. Guglielmi, G, Ponti, F, Agostini, M, Amadori, M, Battista, G, and Bazzocchi, A. The role of DXA in sarcopenia. Aging Clin Exp Res. (2016) 28:1047–60. doi: 10.1007/s40520-016-0589-3
6. Morrell, GR, Ikizler, TA, Chen, X, Heilbrun, ME, Wei, G, Boucher, R, et al. Psoas muscle cross-sectional area as a measure of whole-body lean muscle mass in maintenance Hemodialysis patients. J Renal Nutr. (2016) 26:258–64. doi: 10.1053/j.jrn.2016.02.002
7. Prado, CM, and Heymsfield, SB. Lean tissue imaging: a new era for nutritional assessment and intervention. J Parenter Enter Nutr. (2014) 38:940–53. doi: 10.1177/0148607114550189
8. Beaudart, C, McCloskey, E, Bruyère, O, Cesari, M, Rolland, Y, Rizzoli, R, et al. Sarcopenia in daily practice: assessment and management. BMC Geriatr. (2016) 16:170. doi: 10.1186/s12877-016-0349-4
9. Albano, D, Messina, C, Vitale, J, and Sconfienza, LM. Imaging of sarcopenia: old evidence and new insights. Eur Radiol. (2020) 30:2199–208. doi: 10.1007/s00330-019-06573-2
10. Faron, A, Sprinkart, AM, Kuetting, DLR, Feisst, A, Isaak, A, Endler, C, et al. Body composition analysis using CT and MRI: intra-individual intermodal comparison of muscle mass and myosteatosis. Sci Rep. (2020) 10:11765. doi: 10.1038/s41598-020-68797-3
11. Lenchik, L, and Boutin, R. Sarcopenia: beyond muscle atrophy and into the new Frontiers of opportunistic imaging, precision medicine, and machine learning. Semin Musculoskelet Radiol. (2018) 22:307–22. doi: 10.1055/s-0038-1641573
12. Bazzocchi, A, Diano, D, Ponti, F, Salizzoni, E, Albisinni, U, Marchesini, G, et al. A 360-degree overview of body composition in healthy people: relationships among anthropometry, ultrasonography, and dual-energy x-ray absorptiometry. Nutrition. (2014) 30:696–701. doi: 10.1016/j.nut.2013.11.013
13. Sergi, G, Trevisan, C, Veronese, N, Lucato, P, and Manzato, E. Imaging of sarcopenia. Eur J Radiol. (2016) 85:1519–24. doi: 10.1016/j.ejrad.2016.04.009
14. Shen, W, Punyanitya, M, Wang, Z, Gallagher, D, St-Onge, MP, Albu, J, et al. Total body skeletal muscle and adipose tissue volumes: estimation from a single abdominal cross-sectional image. J Appl Physiol. (2004) 97:2333–8. doi: 10.1152/japplphysiol.00744.2004
15. Grimm, A, Nickel, MD, Chaudry, O, Uder, M, Jakob, F, Kemmler, W, et al. Feasibility of Dixon magnetic resonance imaging to quantify effects of physical training on muscle composition-a pilot study in young and healthy men. Eur J Radiol. (2019) 114:160–6. doi: 10.1016/j.ejrad.2019.03.019
16. Burns, JE, Yao, J, Chalhoub, D, Chen, JJ, and Summers, RM. A machine learning algorithm to estimate sarcopenia on abdominal CT. Acad Radiol. (2020) 27:311–20. doi: 10.1016/j.acra.2019.03.011
17. Zuo, H, Wang, Q, Bi, G, Wang, Y, Yang, G, Zhang, C, et al. Comparison of different MRI-based unsupervised segmentation algorithms in predicting sarcopenia. Eur J Radiol. (2024) 181:111748. doi: 10.1016/j.ejrad.2024.111748
18. Bedrikovetski, S, Seow, W, Kroon, HM, Traeger, L, Moore, JW, and Sammour, T. Artificial intelligence for body composition and sarcopenia evaluation on computed tomography: a systematic review and meta-analysis. Eur J Radiol. (2022) 149:110218. doi: 10.1016/j.ejrad.2022.110218
19. Janssen, I, Heymsfield, SB, and Ross, R. Low relative skeletal muscle mass (sarcopenia) in older persons is associated with functional impairment and physical disability. J Am Geriatr Soc. (2002) 50:889–96. doi: 10.1046/j.1532-5415.2002.50216.x
20. Donini, LM, Busetto, L, Bischoff, SC, Cederholm, T, Ballesteros-Pomar, MD, Batsis, JA, et al. Definition and diagnostic criteria for sarcopenic obesity: ESPEN and EASO consensus statement. Obes Facts. (2022) 15:321–35. doi: 10.1159/000521241
21. Zamboni, M, Rubele, S, and Rossi, AP. Sarcopenia and obesity. Curr Opin Clin Nutr Metab Care. (2019) 22:13–9. doi: 10.1097/MCO.0000000000000519
22. Perna, S, Peroni, G, Faliva, MA, Bartolo, A, Naso, M, Miccono, A, et al. Sarcopenia and sarcopenic obesity in comparison: prevalence, metabolic profile, and key differences. A cross-sectional study in Italian hospitalized elderly. Aging Clin Exp Res. (2017) 29:1249–58. doi: 10.1007/s40520-016-0701-8
23. Yu, R, Wong, M, Leung, J, Lee, J, Auyeung, TW, and Woo, J. Incidence, reversibility, risk factors and the protective effect of high body mass index against sarcopenia in community-dwelling older Chinese adults. Geriatr Gerontol Int. (2014) 14:15–28. doi: 10.1111/ggi.12220
24. Yoo, MC, Won, CW, and Soh, Y. Association of high body mass index, waist circumference, and body fat percentage with sarcopenia in older women. BMC Geriatr. (2022) 22:937. doi: 10.1186/s12877-022-03643-x
25. Keller, U. Nutritional laboratory markers in malnutrition. J Clin Med. (2019) 8:775. doi: 10.3390/jcm8060775
26. De Pergola, G, Zupo, R, Lampignano, L, Paradiso, S, Murro, I, Cecere, A, et al. Effects of a Low carb diet and whey proteins on anthropometric, Hematochemical, and cardiovascular parameters in subjects with obesity. Endocr Metab Immune Disord Drug Targets. (2020) 20:1719–25. doi: 10.2174/1871530320666200610143724
27. Visser, M, Kritchevsky, SB, Newman, AB, Goodpaster, BH, Tylavsky, FA, Nevitt, MC, et al. Lower serum albumin concentration and change in muscle mass: the health, aging and body composition study. Am J Clin Nutr. (2005) 82:531–7. doi: 10.1093/ajcn/82.3.531
28. Van den Broeck, J, Sealy, MJ, Brussaard, C, Kooijman, J, Jager-Wittenaar, H, and Scafoglieri, A. The correlation of muscle quantity and quality between all vertebra levels and level L3, measured with CT: an exploratory study. Front Nutr. (2023) 10:1148809. doi: 10.3389/fnut.2023.1148809
29. Blauwhoff-Buskermolen, S, Versteeg, KS, MA, d v d S, den Braver, NR, Berkhof, J, Langius, JA, et al. Loss of muscle mass during chemotherapy is predictive for poor survival of patients with metastatic colorectal cancer. Clin Oncol. (2016) 34:1339–44. doi: 10.1200/JCO.2015.63.6043
30. Cespedes Feliciano, EM, Avrutin, E, Caan, BJ, Boroian, A, and Mourtzakis, M. Screening for low muscularity in colorectal cancer patients: a valid, clinic-friendly approach that predicts mortality. J Cachexia Sarcopenia Muscle. (2018) 9:898–908. doi: 10.1002/jcsm.12317
31. Guerri, S, Mercatelli, D, Aparisi Gómez, MP, Napoli, A, Battista, G, Guglielmi, G, et al. Quantitative imaging techniques for the assessment of osteoporosis and sarcopenia. Quant Imaging Med Surg. (2018) 8:60–85. doi: 10.21037/qims.2018.01.05
32. Tandon, P, Mourtzakis, M, Low, G, Zenith, L, Ney, M, Carbonneau, M, et al. Comparing the variability between measurements for sarcopenia using magnetic resonance imaging and computed tomography imaging. Am J Transplant Off J Am Soc Transplant Am Soc Transplant Surg. (2016) 16:2766–7. doi: 10.1111/ajt.13832
33. Sinelnikov, A, Qu, C, Fetzer, DT, Pelletier, JS, Dunn, MA, Tsung, A, et al. Measurement of skeletal muscle area: comparison of CT and MR imaging. Eur J Radiol. (2016) 85:1716–21. doi: 10.1016/j.ejrad.2016.07.006
34. Miljkovic, I, and Zmuda, JM. Epidemiology of myosteatosis. Curr Opin Clin Nutr Metab Care. (2010) 13:260–4. doi: 10.1097/MCO.0b013e328337d826
35. Lenchik, L, Lenoir, KM, Tan, J, Boutin, RD, Callahan, KE, Kritchevsky, SB, et al. Opportunistic measurement of skeletal muscle size and muscle attenuation on computed tomography predicts 1-year mortality in Medicare patients. J Gerontol A Biol Sci Med Sci. (2019) 74:1063–9. doi: 10.1093/gerona/gly183
36. Pescatori, LC, Savarino, E, Mauri, G, Silvestri, E, Cariati, M, Sardanelli, F, et al. Quantification of visceral adipose tissue by computed tomography and magnetic resonance imaging: reproducibility and accuracy. Radiol Bras. (2019) 52:1–6. doi: 10.1590/0100-3984.2017.0211
37. Erlandson, MC, Lorbergs, AL, Mathur, S, and Cheung, AM. Muscle analysis using pQCT, DXA and MRI. Eur J Radiol. (2016) 85:1505–11. doi: 10.1016/j.ejrad.2016.03.001
38. Merzban, MH, and Elbayoumi, MJESA. Efficient solution of Otsu multilevel image thresholding: a comparative study. Expert Syst Appl. (2019) 116:299–309. doi: 10.1016/j.eswa.2018.09.008
39. Zhang, F, and Zhang, H. Comment on "diagnosis, prevalence, and mortality of sarcopenia in dialysis patients: a systematic review and meta-analysis" by Shu et al. J Cachexia Sarcopenia Muscle. (2023) 14:2984–4. doi: 10.1002/jcsm.13113
40. Burke, RP, Xu, Z, Lee, CP, Baucom, RB, Poulose, BK, Abramson, RG, et al. (2015). “Multi-Atlas Segmentation for Abdominal Organs with Gaussian Mixture Models.” in Proceedings of SPIE--the International Society for Optical Engineering. p. 9417.
41. Waqar, M, Van Houdt, PJ, Hessen, E, Li, K-L, Zhu, X, Jackson, A, et al. Visualising spatial heterogeneity in glioblastoma using imaging habitats. Front Oncol. (2022) 12:12. doi: 10.3389/fonc.2022.1037896
Keywords: sarcopenia, computed tomography, magnetic resonance imaging, unsupervised machine learning, Gaussian mixture model
Citation: Zuo H, Bi Q, Liu X, Bi G, Wang Y, Wu Y, Yang G, Zhang C, Song Y, Wang G, Wang Q and Gong X (2025) The value of unsupervised machine learning algorithms based on CT and MRI for predicting sarcopenia. Front. Public Health. 13:1649400. doi: 10.3389/fpubh.2025.1649400
Edited by:
Chang Won Jeong, Wonkwang University, Republic of KoreaReviewed by:
Jan Kubicek, VSB-Technical University of Ostrava, CzechiaMack Shelley, Iowa State University, United States
Copyright © 2025 Zuo, Bi, Liu, Bi, Wang, Wu, Yang, Zhang, Song, Wang, Wang and Gong. This is an open-access article distributed under the terms of the Creative Commons Attribution License (CC BY). The use, distribution or reproduction in other forums is permitted, provided the original author(s) and the copyright owner(s) are credited and that the original publication in this journal is cited, in accordance with accepted academic practice. No use, distribution or reproduction is permitted which does not comply with these terms.
*Correspondence: Xiarong Gong, Z29uZ3hpYXJvbmcxOTgxQDE2My5jb21t;Gang Wang, d2duZXQxNThAMTYzLmNvbQ==;Qiyang Wang, ZHIucWl5YW5nQG91dGxvb2suY29t
†These authors have contributed equally to this work and share first authorship
‡These authors have contributed equally to this work