 Abel Pacheco-Ortega
 Walterio Mayol-Cuevas
- 1Visual Information Lab, Department of Computer Science, University of Bristol, Bristol, United Kingdom
- 2Amazon.com, Seattle, WA, United States
We present Affordance Recognition with One-Shot Human Stances (AROS), a one-shot learning approach that uses an explicit representation of interactions between highly articulated human poses and 3D scenes. The approach is one-shot since it does not require iterative training or retraining to add new affordance instances. Furthermore, only one or a small handful of examples of the target pose are needed to describe the interactions. Given a 3D mesh of a previously unseen scene, we can predict affordance locations that support the interactions and generate corresponding articulated 3D human bodies around them. We evaluate the performance of our approach on three public datasets of scanned real environments with varied degrees of noise. Through rigorous statistical analysis of crowdsourced evaluations, our results show that our one-shot approach is preferred up to 80% of the time over data-intensive baselines.
1 Introduction
Vision evolved to make inferences in a 3D world, and one of the most important assessments we can make is what can be done where. Detecting such environmental affordances allows the identification of locations that support actions, such as stand-able, walk-able, place-able, and sit-able. Human affordance detection is not only important in scene analysis and scene understanding but also potentially beneficial in object detection and labeling (via how objects can be used) and can eventually be useful for scene generation as well.
Recent approaches have worked toward providing such key competency to artificial systems via iterative methods, such as deep learning (Zhang et al., 2020a; Bochkovskiy et al., 2020; Carion et al., 2020; Du et al., 2020; Nekrasov et al., 2021). The effectiveness of these data-driven efforts is highly dependent on the number of classes, the number of examples per class, and their diversity. Usually, a dataset consists of thousands of examples, and the training process requires a significant amount of hand tuning and computing of resources. When a new category needs to be added, further sufficient samples need to be provided and training remade. The appeal for one-shot training methods is clear.
Often, human pose-in-scene detection is conflated with object detection or other semantic scene recognition, for example, training to detect sit-able locations through chair recognition, while this is a flawed approach for general action-scene understanding, first, since people can recognize numerous non-chair locations where they can sit, e.g., on tables or cabinets (Figure 1). Second, an object-driven approach may fail to consider that affordance detection depends on the object pose and its surroundings—it should not detect a chair as sit-able if it is upside-down or if an object is over it. Finally, object detectors alone may struggle to perceive a potentially sit-able place if a particular object example was not covered during training.
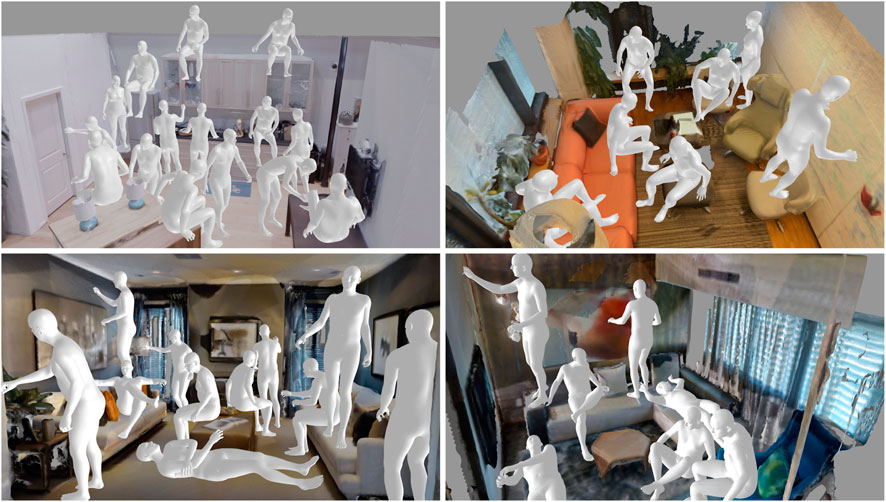
FIGURE 1. AROS is capable of detecting human–scene interactions with one-shot learning. Given a scene, our approach can detect locations that support interactions and generate the interacting human body in a natural and plausible way. Images show examples of detected sit-able, reach-able, lie-able, and stand-able locations.
To address these limitations, Affordance Recognition with One-shot Human Stances (AROS) uses a direct representation of human-scene affordances. It extracts an explainable geometrical description by analyzing proximity zones and clearance space between interacting entities. The approach allows training from one or very few data samples per affordance and is capable of handling noisy scene data as provided by real visual sensors, such as RGBD and stereo cameras.
In summary, our contributions are as follows: 1) we propose a one-shot learning geometric-driven affordance descriptor that captures both proximity zones and clearance space around human–pose interactions. 2) We set a statistical framework that relies on both central tendency statistics and a statistical inference to evaluate the performance of the compared approaches. The tests show that our approach generates natural and physically plausible human–scene interactions with better performance than intensively trained state-of-the-art methods. 3) Our approach demonstrates control on the kind of human–scene interaction sought, which permits exploring scenes with a concatenation of affordances.
2 Related work
Following Gibson’s suggestion that affordances are what we perceive when looking at scenes or objects (Gibson, 1977), the perception of human affordances with computational approaches has been extensively explored over the years. Before the popularity of data-intensive approaches, Gupta et al. (2011) employed an environment geometric estimation and a voxelized discretization of four human poses to measure the environment affordance capabilities. This human pose method was employed by Fouhey et al. (2015) to automatically generate thousands of labeled RGB frames from the NYUv2 dataset (Silberman et al., 2012) for training a neural network and a set of local discriminative templates that permits the detection of four human affordances. A related approach was explored by Roy and Todorovic (2016), where detection was performed for five different human affordances through a pipeline of CNNs that includes the extraction of mid-level cues trained on the NYUv2 dataset (Silberman et al., 2012). Luddecke and Worgotter (2017) implemented a residual neural network for detecting 15 human affordances and trained using a look-up table that assigns affordances to object parts on the ADE20K dataset (Zhou et al., 2017).
Another research line has been the creation of action maps. Savva et al. (2014) generated affordance maps by learning relations between human poses and geometries in recorded human actions. Piyathilaka and Kodagoda (2015) used human skeleton models positioned in different locations in an environment to measure geometrical features and determine the support required. In Rhinehart and Kitani (2016), egocentric videos as well as scenes, objects, and actions classifiers were used to build up the action maps.
There have been efforts to use functional reasoning for describing the purpose of elements in the environment that helped define them. Grabner et al. (2011) designed a geometric detector for sit-able objects, such as chairs, while further explorations performed by Zhu et al. (2016) and Wu et al. (2020) included physics engines to ponder constrains, such as collision, inertia friction, and gravity.
An important line of research is focused on generating human–environment interactions, representative of affordances detected in the environment. Wang et al. (2017) proposed an affordance predictor and a 2D human interaction generator trained on more than 20K images extracted from sitcoms with and without humans interacting with the environment. Li et al. (2019) extended this work by developing a 3D human pose synthesizer that learns on the same dataset of images but generates human interactions into input scenes that are represented as RGB, RGBD, or depth images. Jiang et al. (2016) exploited the spatial correlation between elements and human interactions on RGBD images to generate human interactions and improve object labeling. These methods use human skeletons for representing body–environment configurations, which reduces their representativeness since contacts, collisions, and naturalness of the interactions cannot be evaluated in a reliable manner.
In further studies, Ruiz and Mayol-Cuevas (2020) developed a geometric interaction descriptor for non-articulated, rigid object shapes. Given a 3D environment, the method demonstrated good generalization on detecting physically feasible object–environment configurations. In the SMPL-X human body representation (Pavlakos et al., 2019), Zhang et al. (2020c) presented a context-aware human body generator that learned the distribution of 3D human poses conditioned to the scene depth and semantics via recordings from the PROX (Hassan et al., 2019) dataset. In a follow-up effort, Zhang et al. (2020b) developed a purely geometrical approach to model human–scene interactions by explicitly encoding the proximity between the body and the environment, thus only using a mesh as input. Training CNNs and related data-driven methods require the use of most, if not all, of the labeled dataset; e.g., in PROX (Hassan et al., 2019), there are 100K image frames.
3 AROS
Detecting human affordances in an environment is to find locations capable of supporting a given interaction between a human body and the environment. For example, the study of finding “suitable to sit” locations identifies all those places where a human can sit, which can include a range of object “classes” (sofa, bed, chair, table, etc.). Our method is motivated to develop a descriptor that characterizes such general interactions without requiring object classes by using two key components and that is lightweight in terms of data requirements while outperforming alternative baselines.
These two components weigh the extraction of characteristics from areas with high (contact) and low (clearance) physical proximity between the entities in interaction (Figure 2).
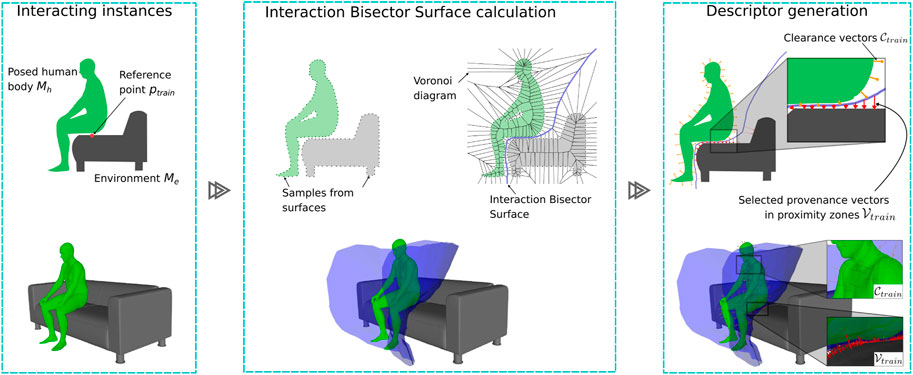
FIGURE 2. 2D and 3D illustrations of our one-shot training pipeline. (Left) Posed human body Mh interacting with an environment Me on a reference point ptrain. (Center) Only during training, we calculate the Voronoi diagram with sample points from both the environment and body surfaces to generate an IBS. (Right) We use the IBS to characterize the proximity zones and the surrounding space with provenance and clearance vectors. A weighted sample of these provenance and clearance vectors,
Importantly, the representation allows one-shot training per affordance, which is desirable to improve training scalability. Furthermore, our approach is capable of describing and detecting interactions between noisy data representations as obtained from visual depth sensors and highly articulated human poses.
3.1 A spatial descriptor for spatial interactions
We are inspired by recent methods that have revisited geometric features, such as the bisector surface for scene–object indexing (Zhao et al., 2014) and affordance detection (Ruiz and Mayol-Cuevas, 2020). Initiating from a spatial representation makes sense if it helps reduce data training needs and simplify explanations—as long as it can outperform data-intensive approaches. Our affordance descriptor expands on the Interaction Bisector Surface (IBS) (Zhao et al., 2014), an approximation of the well-known Bisector Surface (BS) (Peternell, 2000). Given two surfaces
Our one-shot training process represents interactions by 3-tuples (Mh, Me, and ptrain), where Mh is a posed human-body mesh, Me is an environment mesh, and ptrain is the reference point on Me that supports the interaction. Let Ph and Pe be the sets of samples on Mh and Me, respectively, their IBS
We use the Voronoi diagram
The number and distribution of samples in Ph and Pe are crucial for a well-constructed discrete IBS. A low rate of sampled points degenerates on an IBS that pierces the boundaries of Mh or Me. A higher density is critical in those zones where the proximity is high. To populate Ph and Pe, we first use a Poisson-disc sampling strategy (Yuksel, 2015) to generate ibsini evenly distributed samples on each mesh surface. Then, we perform a counter-part sampling that increases the number of samples in Pe by including the closest points on Me to elements in Ph, and similarly, we incorporate in Ph the closest point on Mh to samples in Pe. We perform the counter-part sampling strategy ibscs times to generate a new
To capture the regions of interaction proximity on our enhanced IBS as mentioned above, we use the notion of provenance vectors (Ruiz and Mayol-Cuevas, 2020). The provenance vectors of an interaction start from any point on
where a is the stating point of the delta vector
Provenance vectors inform about the direction and distance of the interaction; the smaller the
where
where numpv is the number of samples from
We include a set of vectors into our descriptor to define the clearance space necessary for performing the given interaction. Given Sh, an evenly sampled set of numcv points on Mh, the clearance vectors that integrate to our descriptor
where ptrain is the defined reference point,
Formally, our affordance descriptor, AROS, is defined as
where
3.2 Human affordance detection
Let
Given a point ptest on an environment mesh Mtest and its unit surface normal vector
A significant angle difference between
If we observe a normal match between
where
and compare with the magnitude of each correspondent provenance vector in
The bigger the κ value, the less the support for the interaction on the ptest. We experimentally determine interaction-wise thresholds for the sum of differences maxκ and the number of missing ray collisions maxmissings that permits us to score the affordance capabilities on ptest.
Clearance vectors are meant to fast-detect collision configurations by ray–mesh intersection calculation. Similar to provenance vectors, we generate a set of rays Rcv, whose origins and directions are determined by
A sparse distribution of clearance vectors on bi-dimensional noisy meshes in a 3D space results in collisions that are not detected by clearance vectors. To improve, we enhance scenes with a set of spherical fillers that pad the scene (see Figure 3). More details are provided in Supplementary Material.
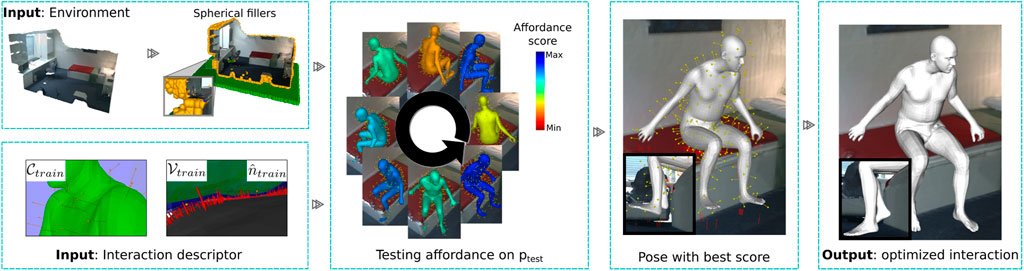
FIGURE 3. Approach for detecting human affordances. To mitigate 3D scan noise, the scene is augmented with spherical fillers for detecting collisions and SDF values. Our method detects if a test point in the environment can support an interaction by translating the descriptor to the test position over different orientations and measuring its alignment and collision rate. Then, the best-scored configuration is optimized to generate a more natural and physically plausible interaction with the environment.
3.2.1 Pose optimization
After a positive detection, we generate the body mesh representation used in training at the testing location. This generally has low levels of contact with the unseen environment. These gaps are because our descriptor based its construction on the bisector surface between the interacting entities. We can eliminate the gap by translating the body until it touches the environment. However, this naïve method generates configurations that visually lack naturalness, Figure 3 (Pose with best score).
Every human–environment configuration trained has an associated 3D human SMPL-X characterization that we keep and use to optimize the human pose as in the work of Zhang S. et al. (2020b) with the AdvOptim loss function, using the SDF values that have been pre-calculated in each scene with a grid of 256 × 256 × 256 positions.
Overall, we train a human interaction by generating its AROS descriptor from a single example, keeping the associated SMPL-X parameters of the body pose and defining the contact regions that the body has with the environment. After a positive detection with AROS, we use the associated SMPL-X body parameters and its contact regions to close the environment–body gap and generate a more natural body pose, as shown in Figure 3 (ouput). Our approach generalizes well on the description of interaction and generates natural and physically plausible body–environment configurations over novel environments with just one example for training (see Figure 4).
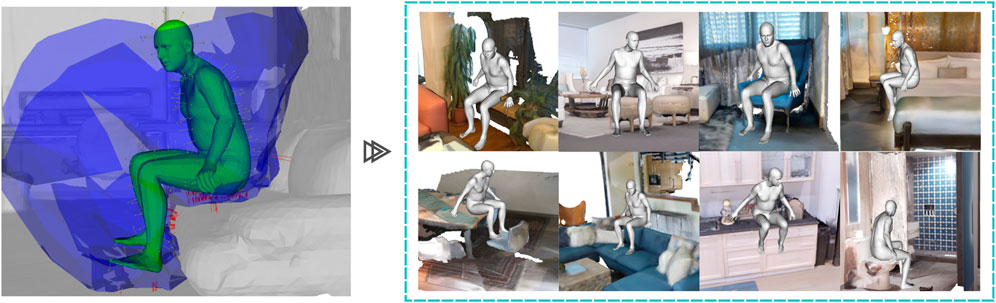
FIGURE 4. Our one-shot learning approach generalizes well on affordance detection. Only one example of an interaction is used to generate an AROS descriptor that generalizes well for the detection of affordances over previously unseen environments.
4 Experiments
We conduct experiments in various environment configurations to examine the effectiveness and usefulness of the affordance recognition performed by AROS. Our experiments include several perceptual studies, as well as a physical plausibility evaluation of the body–environment configurations generated.
Datasets: The PROX dataset (Hassan et al., 2019) includes data from 20 recordings of subjects interacting within 12 scanned indoor environments. An SMPL-X body model (Pavlakos et al., 2019) is used to characterize the shape and pose of humans within each frame in recordings. Following the setup in the work of Zhang S. et al. (2020b), we use the rooms MPH16, MPH1Library, N0SittingBooth, and N3OpenArea for testing purposes and training on data from other PROX scenes. We also perform evaluations on seven scanned scenes from the MP3D dataset (Chang et al., 2017) and five scenes from the Replica dataset (Straub et al., 2019). We calculate the spherical fillers and SDF values of all 3D scanned environments.
Training: We manually select 23 frames in which subjects interact in one of the following ways: sitting, standing, lying down, walking, or reaching. From these selected human–scene interactions, we generate the AROS descriptors and retain the SMPL-X parameters associated with human poses.
To generate the IBS associated with each trained interaction, we use an initial sampling set of ibsini = 400 on each surface, execute the counter-part sampling strategy ibscs = 4 times, and crop the generated IBS
The interaction-wise thresholds maxκ, maxmissings, and maxcollisions are established experimentally, and maxlong is 1.2 times the radius of the sphere used to crop
With 512 provenance vectors
Baselines: We compare our approach with the state-of-the-art PLACE (Zhang et al., 2020b) and POSA (contact only) (Hassan et al., 2021). PLACE is a pure scene-centric method that only requires a reference point on a scanned environment to generate a human body performing around it. However, PLACE does not have control over the type of interaction detected/generated. We used naive and optimized versions of this approach in experiments (PLACE, PLACE SimOptim, and PLACE AdvOptim). POSA is a human-centric approach that, given a posed human body mesh, calculates the zones on the body where contact with the scene may occur and uses this feature map to place the body in the environment. We encourage a fair comparison by evaluating the naive and optimized POSA versions that consider only contact information and excludes semantic information (POSA and POSA optimized). In our studies, POSA was executed with the same human shapes and poses used to train AROS.
4.1 Physical plausibility
We evaluate the physical plausibility of the compared approaches mainly by following the work of Zhang et al. (2020b) and Zhang et al. (2020c). Given the SDF values of a scene and a body mesh generated, 1) the contact score is assigned to 1 if any mesh vertex has a negative SDF value and is evaluated as 0, otherwise, 2) the non-collision score is the ratio of vertices with a positive SDF value, and 3) in order to measure the severity of the body–environment collision on positive contact, we include the collision-depth score, which averages the depth of the collisions between the scene and the generated body mesh.
4.1.1 Ablation study
We evaluate the influence of clearance vectors, spherical fillers, and different optimizers on the PROX dataset. Three different optimization procedures are evaluated. The downward optimizer translates the generated body downward (-Z direction) until it comes in contact with the environment. The ICP optimizer uses the well-known Interactive Closest Point algorithm to align the body vertices with the environment mesh. The AdvOptim optimizer is described in Section 3.2.1.
Table 1 shows that models without clearance vectors have the highest collision-depth scores on models with the same optimizer. AROS models present a reduction in contact and collision-depth scores in all cases that consider clearance vectors in their descriptors to avoid collision with the environment. Spherical fillers have a significant influence on avoiding collisions, producing the best scores in all metrics per optimizer. The ICP optimizer closes the body–environment gaps but drastically reduces the performance on both collision scores, while the AdvOptim and downward optimizers keep a trade-off between collision and contact. The best performance is achieved with affordance descriptors composed of provenance and clearance vectors, tested in scanned environments enhanced with spherical fillers, and where interactions are optimized with the AdvOptim optimizer.
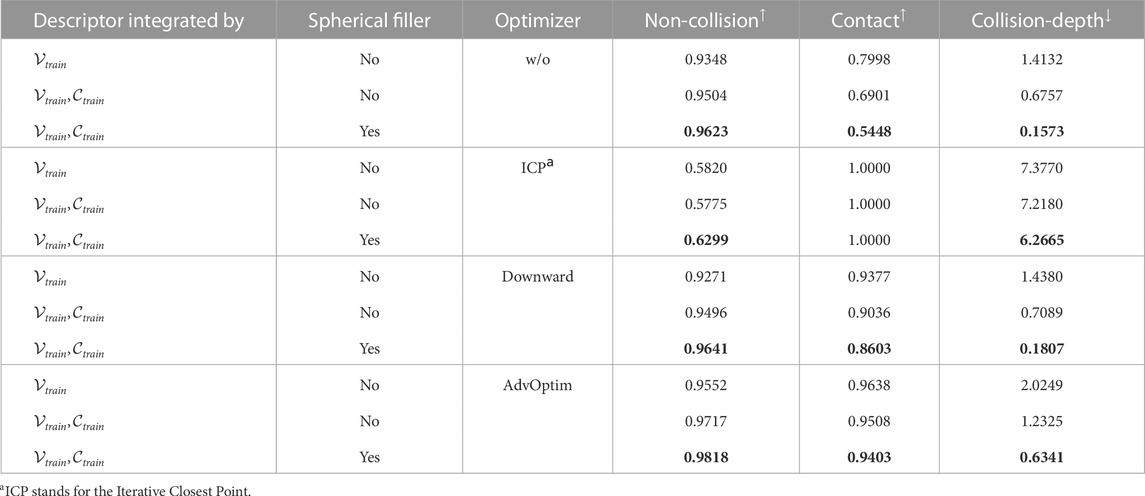
TABLE 1. Ablation study evaluation scores (↑: benefit; ↓: cost). The best trade-off between scores per optimizer are in boldface.
4.1.2 Comparison with the state of the art
We generated 1300 interacting bodies per model in each of the 16 scenes and reported the averages of calculated non-collision, contact, and collision-depth scores. The results are shown in Table 2. In all datasets, interacting bodies generated using our approach provided a good trade-off with high non-collision but low contact and collision-depth scores.
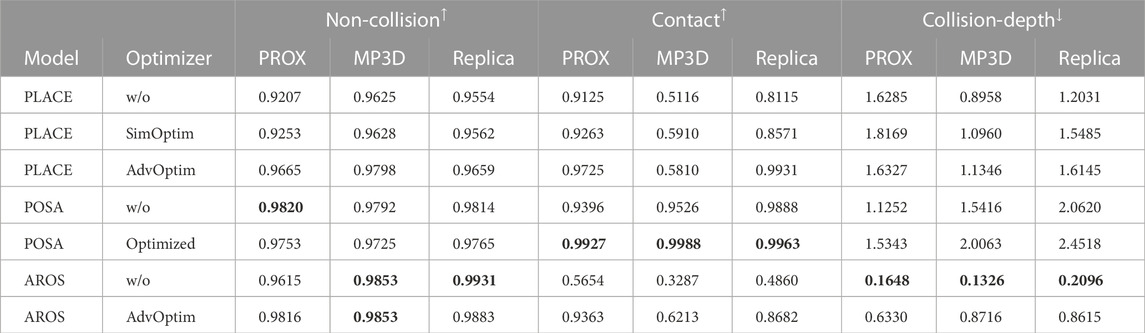
TABLE 2. Physical plausibility: Non-collision, contact, and collision-depth scores (↑: benefit; ↓: cost) before and after optimization. The best results are in boldface.
4.2 Perception of naturalness
We use Amazon Mechanical Turk to compare and evaluate the naturalness of body–environment configurations generated by our approach and baselines. We used only the best version of the compared methods (with optimizer). Each scene in our test set was used equally to select 162 locations around which the compared approaches generate human interactions. MTurk judges observed all human–environment pairs generated through dynamic views, allowing us to showcase them from different perspectives. Each judge performed 11 randomly selected assessments, without repetition, that included two control questions to detect and exclude untrustworthy evaluators. Three different judges accomplished each of the evaluations. Our perceptual experiments include individual and comparison studies for each comparison carried out.
In our side-by-side comparison studies, interactions detected/generated from two approaches are exposed simultaneously. Then, MTurkers were asked to respond to the question “Which example is more natural?” by direct selection.
We used the same set of interactions for individual evaluation studies, where judges rated every individual human–scene interaction by responding to “The human is interacting very naturally with the scene. What is your opinion?” with a 5-point Likert scale according to its agreement level: 1) strongly disagree, 2) disagree, 3) neither disagree nor agree, 4) agree, and 5) strongly agree.
4.2.1 Randomly selected test locations
The first group of studies compares human–scene configurations generated at randomly selected locations. On the side-by-side comparison study that contrasts AROS with PLACE, our approach was selected as more natural in 60.7% of all assessments. Compared to POSA, ours is selected in 72.6% of all tests performed. The results per dataset are shown in Table 4 (% preferences in random locations).
Individual evaluation studies also suggest that AROS produced more natural interactions (see Table 3). The mean and standard deviations of these scores obtained by the judges to PLACE are 3.23 ± 1.35 in comparison with AROS, 3.39 ± 1.25, while in the second study, these statistics obtained by POSA were 2.79 ± 1.18 in contrast with AROS, 3.20 ± 1.18. Evaluation scores of AROS have a larger mean and a narrower standard deviation compared to baselines. However, these descriptive statistics must be cautiously used as evidence to determine a performance difference because it assumes that the distribution of scores approximately resembles a normal distribution and that the ordinal variable was perceived as numerically equidistant by judges. Regrettably, Shapiro–Wilk tests (Shapiro and Wilk, 1965) performed on data show that the score distributions depart from normality in both evaluation studies, PLACE/AROS and POSA/AROS with p < 0.01.
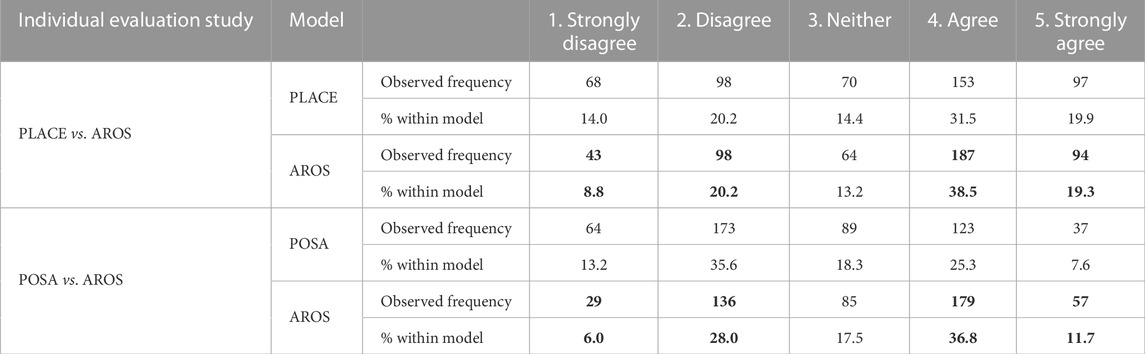
TABLE 3. Cross-tabulation data of individual evaluation studies on randomly selected locations. The best are in boldface.
Based on this, we performed a chi-square test of homogeneity (Franke et al., 2012) with a significance level α = 0.05, to determine if the distributions of evaluation scores are statistically similar. If we observe significance, the level of association between the approach and the distribution of the scores was determined by calculating Cramer’s V value (V) (Cramer, 1946).
In this first set of randomly selected locations, data from the PLACE/AROS evaluation suggest that there is no statistically significant difference between score distributions (
4.2.2 Challenging test locations
A random sampling strategy is insufficient to fully evaluate the performance of pose affordances, since what matters for such methods is how they perform under realistic albeit challenging specific scene locations. For example, a test can be oversimplified and inadequate for evaluations if the sampled scene has relatively large empty spaces where only the floor or a big plane surface surrounds the test locations. Therefore, we crowdsource the evaluations in a new set of more realistic locations provided by a golden annotator (none of the authors) tasked with identifying areas of interest for human interactions (Figure 5). These locations are available for comparison as part of our dataset (https://abelpaor.github.io/AROS/).
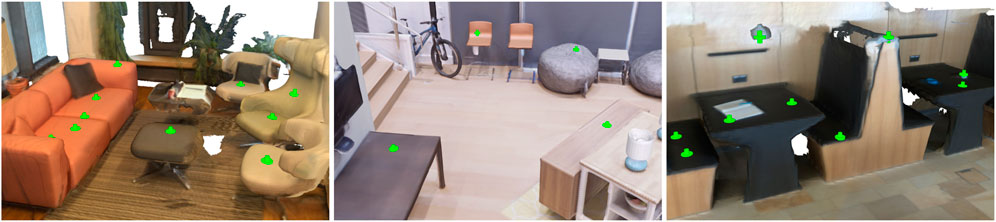
FIGURE 5. Selected by a golden annotator, green spots correspond to examples of meaningful, challenging locations for affordance detection.
The results of the side-by-side comparison studies confirm that in 60.6% of the comparisons with PLACE, AROS was considered more natural overall. Compared to POSA, AROS was marked with better performance in 76.1% of all evaluations with a notorious difference in MP3D locations, where AROS was evaluated to be more natural in 80.2% of the assessments. The results per dataset are shown in Table 4 (% preferences in challenging locations).
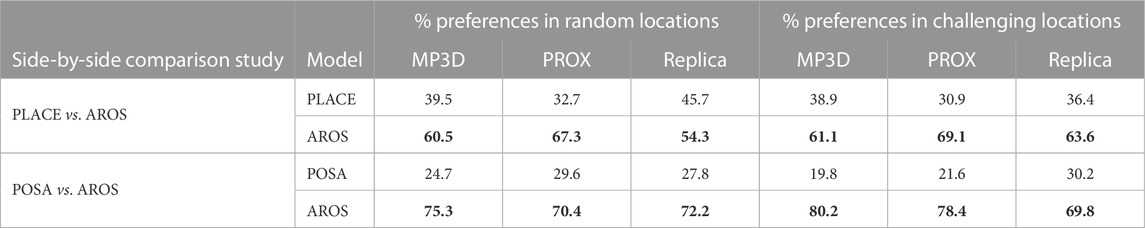
TABLE 4. MTurk side-by-side studies results in random and challenging locations. The best are in boldface.
As in the randomly selected test locations, a descriptive analysis of the data from individual evaluation studies on these new locations suggests that AROS performs better than other approaches with larger mean values and narrower standard deviations. The mean and standard deviation of the scores obtained by the judges to PLACE are 2.97 ± 1.33 in comparison with AROS, 3.44 ± 1.19, while in the second study, these statistics obtained by POSA were 2.79 ± 1.25 in contrast with AROS, 3.5 ± 1.25. However, a Shapiro–Wilk test performed on these data shows that the score distributions also depart from normality with p < 0.01 in both studies, PLACE/AROS and POSA/AROS.
A chi-square test of homogeneity, with α = 0.05, was used to determine whether both score distributions were statistically similar on the data from the PLACE/AROS evaluation study, providing evidence that there is a difference in score distributions (
However, an omnibus χ2 statistic does not provide information about the source of the difference between the score distributions. To this end, we performed a post hoc analysis following the standardized residuals method described in the work of Agresti (2018). As suggested by Beasley and Schumacker (1995), we corrected our significance level (α = 0.05) with the Sidak method (Šidák, 1967) to its adjusted version αadj = 0.005, with critical value z = 2.81. The study revealed a significant difference in the qualification of the interactions generated by PLACE and AROS, with ours being qualified as natural more frequently.
The residuals associated with AROS indicate, with significant difference, that the interactions generated by our approach were marked as “not natural” less frequently than expected: strongly disagree (z = −4.4, p < 0.001) and disagree (z = −2.98, p = 0.002). Data also show a significant difference in favorable evaluations, where PLACE has less frequently positive evaluations than predicted by the hypothesis of independence in agree (z = −3.04, p < 0.001). We also observed a marginal significance, still in favor of AROS, in the frequency of strongly agree evaluations (z = −2.3, p = 0.015).
Not surprisingly, the chi-square test of homogeneity (α = 0.05) on the data from the POSA/AROS evaluation study revealed that there is strong evidence of a difference in score distributions (
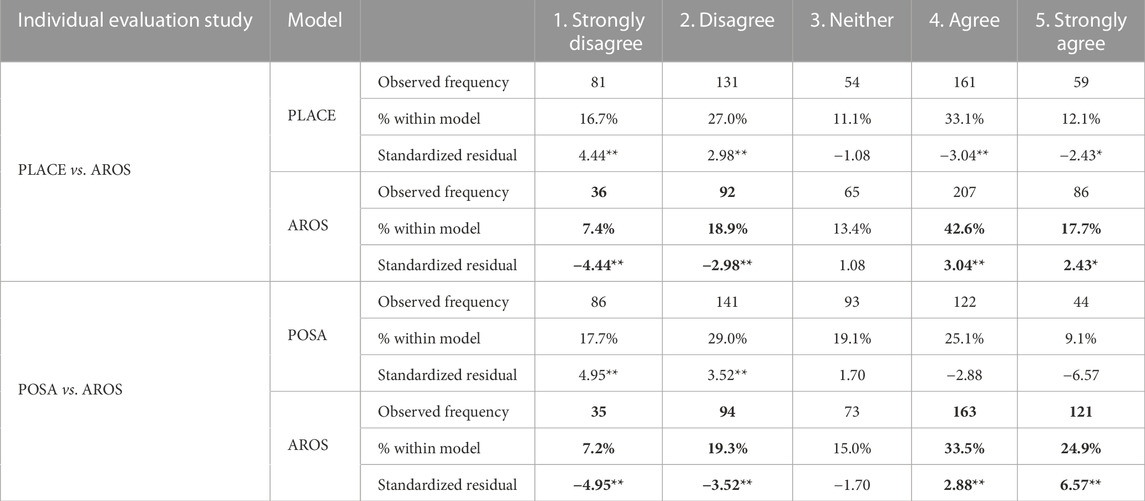
TABLE 5. Cross-tabulation data of individual evaluation studies on challenging locations. A chi-square test of homogeneity on data provides evidence of difference in the distribution of scores with α = 0.05. An analysis of residual indicates the source of such differences, an asterisk (*) indicates conservative statistical significance at α = 0.05, and a double asterisk (**) denotes statistical significance with αadj = 0.005. The best are in boldface.
4.3 Qualitative results
Experiments verify that our approaches can realistically generate human bodies that interact within a given environment in a natural and physically plausible manner. AROS allows us to not only determine the location on the environment in which we want the interaction to happen (the where) but also select the specific type of interaction to be performed (the what).
The number and variety of interactions detected by AROS can easily be increased as a result of its one-shot training capacity. The more trained the interactions, the more the human–scene configuration can detect/generate. Figure 6 shows examples of different affordance detections around single locations.
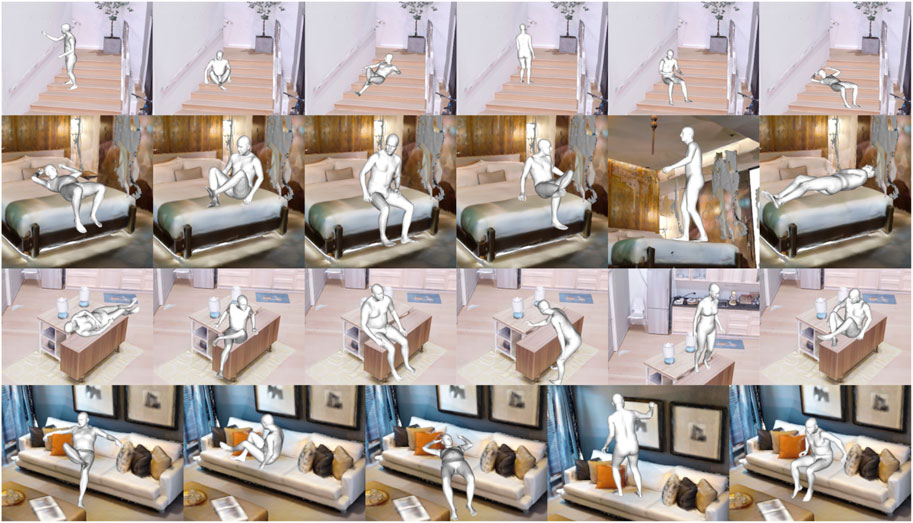
FIGURE 6. AROS shows good performance on a variety of novel scenes.
AROS showed better performance in more realistic environment configurations where elements, such as chairs, sofas, tables, and walls, are presented and must be considered during the generation of body interactions. Figure 7 shows some examples of interaction generated by AROS and baselines over challenging locations.
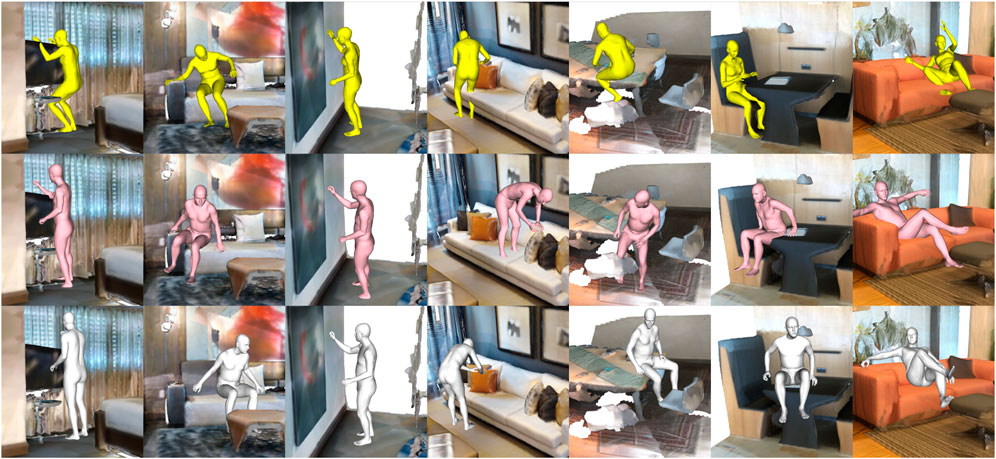
FIGURE 7. Qualitative challenging locations. PLACE (yellow), POSA (pink), and AROS (silver).
Alternatively, AROS can be used to concatenate affordances over several positions to generate useful affordance maps for action planners (see Figure 8). This can be used as a way to generate visualizations of action scripts or to plan the ergonomics and usability of spaces beyond individual objects.
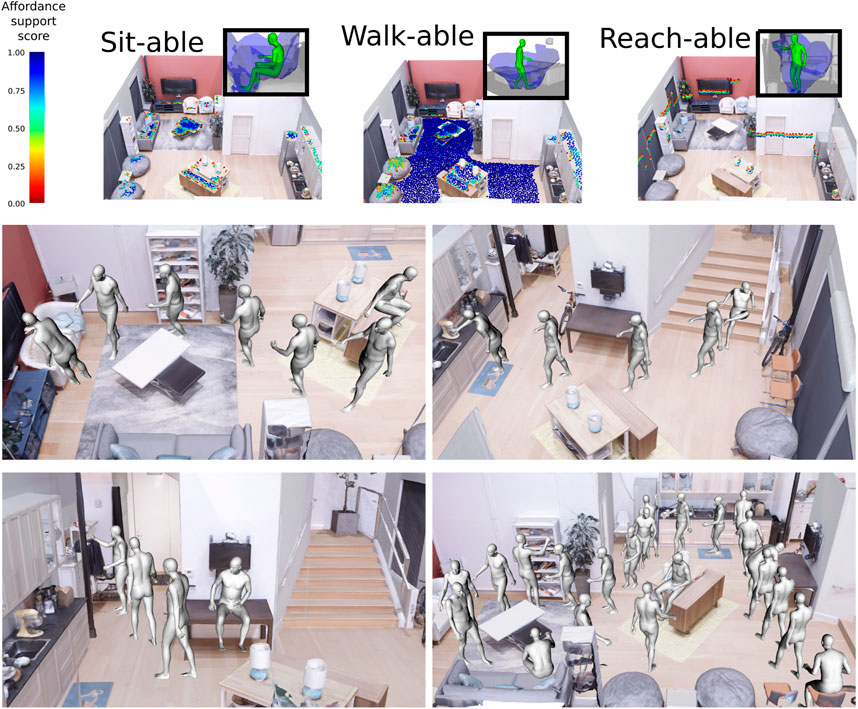
FIGURE 8. AROS can be used to create maps for action planning. Top: Many locations in an environment are evaluated for three different affordances (sit-able, walk-able, and reach-able). Bottom: AROS scores used to plan concatenated action milestones.
5 Conclusion
In this work, we present AROS, a one-shot geometric-driven affordance descriptor that is built on the bisector surface and combines proximity zones and clearance space to improve the affordance characterization of human poses. We introduced a generative framework that poses 3D human bodies interacting within a 3D environment in a natural and physically plausible manner. AROS shows a good generalization in unseen novel scenes. Furthermore, adding a new interaction to AROS is straightforward, since it requires only one example. Via rigorous statistical analysis, results show that our one-shot approach outperforms data-intensive baselines, with human judges preferring AROS proposals 80% of the time over the baselines. AROS can be used to concatenate affordances over several positions. This can be used as a way to generate visualizations of action scripts in 3D scenes or to plan the ergonomics and usability of spaces beyond individual object affordances. We believe that explicit and interpretable description is valuable for complementing data-driven methods and opens avenues for further work, including combining the strengths of both approaches.
Data availability statement
The datasets presented in this study can be found in online repositories. The names of the repository/repositories and accession number(s) can be found at: https://abelpaor.github.io/AROS/.
Author contributions
APO performed all experiments, data preparation, and coding. All authors contributed to the conception and design of the study. All authors contributed to writing, revising, reading, and reviewing the manuscript submitted.
Acknowledgments
APO thanks the Mexican Council for Science and Technology (CONACYT) for the scholarship provided for his postgraduate studies with the scholarship number 709908. WMC thanks the visual egocentric research activity partially funded by UK EPSRC EP/N013964/1. The authors thank Eduardo Ruiz-Libreros for sharing his efforts on the description of affordances. They also thank Angeliki Katsenou and Pilar Padilla Mendoza for their advice on the performed statistical analysis.
Conflict of interest
WMC was employed by Amazon.com.
The remaining authors declare that the research was conducted in the absence of any commercial or financial relationships that could be construed as a potential conflict of interest.
Publisher’s note
All claims expressed in this article are solely those of the authors and do not necessarily represent those of their affiliated organizations, or those of the publisher, the editors, and the reviewers. Any product that may be evaluated in this article, or claim that may be made by its manufacturer, is not guaranteed or endorsed by the publisher.
Supplementary material
Supplementary Material for this article can be found online at: https://www.frontiersin.org/articles/10.3389/frobt.2023.1076780/full#supplementary-material
References
Agresti, A. (2018). An introduction to categorical data analysis. Hoboken, NJ: John Wiley & Sons, 39–41.
Beasley, T. M., and Schumacker, R. E. (1995). Multiple regression approach to analyzing contingency tables: Post hoc and planned comparison procedures. J. Exp. Educ.64, 79–93. doi:10.1080/00220973.1995.9943797
Bochkovskiy, A., Wang, C.-Y., and Liao, H.-Y. M. (2020). YOLOv4: Optimal speed and accuracy of object detection. arXiv. Available at: http://arxiv.org/abs/2004.10934.
Carion, N., Massa, F., Synnaeve, G., Usunier, N., Kirillov, A., and Zagoruyko, S. (2020). “End-to-End object detection with transformers,” in Computer Vision – ECCV 2020 (Cham, Switzerland: Springer), 213–229. doi:10.1007/978-3-030-58452-8
Chang, A., Dai, A., Funkhouser, T., Halber, M., Niessner, M., Savva, M., et al. (2017). “Matterport3D: Learning from RGB-D data in indoor environments,” in International conference on 3D vision (3DV) (New York, NY: IEEE), 667–676. doi:10.1109/3DV.2017.00081
Cramer, H. (1946). “The two-dimensional case,” in Mathematical methods of statistics (Princeton, NJ: Princeton university press), 260–290.
Du, X., Lin, T.-Y., Jin, P., Ghiasi, G., Tan, M., Cui, Y., et al. (2020). “SpineNet: Learning scale-permuted backbone for recognition and localization,” in Proceedings of the IEEE/CVF conference on computer vision and pattern recognition (CVPR) (New York, NJ: IEEE), 11589–11598. doi:10.1109/CVPR42600.2020.01161
Fouhey, D. F., Wang, X., and Gupta, A. (2015). In Defense of the direct perception of affordances. arXiv preprint arXiv:1505.01085. doi:10.1002/eji.201445290
Franke, T. M., Ho, T., and Christie, C. A. (2012). The chi-square test: Often used and more often misinterpreted. Am. J. Eval.33, 448–458. doi:10.1177/1098214011426594
Gibson, J. J. (1977). “The theory of affordances,” in Perceiving, acting and knowing. Toward and ecological psychology (Mahwah, NJ: Lawrence Eribaum Associates).
Grabner, H., Gall, J., and Van Gool, L. (2011). “What makes a chair a chair?,” in 2011 IEEE conference on computer vision and pattern recognition (CVPR) (New York, NJ: IEEE), 1529–1536. doi:10.1109/CVPR.2011.5995327
Gupta, A., Satkin, S., Efros, A. A., and Hebert, M. (2011). “From 3D scene geometry to human workspace,” in CVPR 2011 (New York, NJ: IEEE), 1961–1968. doi:10.1109/CVPR.2011.5995448
Hassan, M., Choutas, V., Tzionas, D., and Black, M. J. (2019). “Resolving 3D human pose ambiguities with 3D scene constraints,” in Proceedings of the IEEE/CVF international conference on computer vision (New York, NJ: IEEE), 2282–2292. doi:10.1109/ICCV.2019.00237
Hassan, M., Ghosh, P., Tesch, J., Tzionas, D., and Black, M. J. (2021). “Populating 3D scenes by learning human-scene interaction,” in Proceedings of the IEEE/CVF conference on computer vision and pattern recognition (New York, NJ: IEEE), 14708–14718. doi:10.1109/CVPR46437.2021.01447
Hu, R., van Kaick, O., Wu, B., Huang, H., Shamir, A., and Zhang, H. (2016). Learning how objects function via co-analysis of interactions. ACM Trans. Graph.35, 1–13. doi:10.1145/2897824.2925870
Hu, R., Zhu, C., van Kaick, O., Liu, L., Shamir, A., and Zhang, H. (2015). Interaction context (ICON): Towards a geometric functionality descriptor. ACM Trans. Graph.34, 1–83:12. doi:10.1145/2766914
Jiang, Y., Koppula, H. S., and Saxena, A. (2016). Modeling 3d environments through hidden human context. IEEE Trans. Pattern Analysis Mach. Intell.38, 2040–2053. doi:10.1109/TPAMI.2015.2501811
Li, X., Liu, S., Kim, K., Wang, X., Yang, M.-H., and Kautz, J. (2019). “Putting humans in a scene: Learning affordance in 3d indoor environments,” in Proceedings of the IEEE conference on computer vision and pattern recognition (New York, NJ: IEEE), 12368–12376. doi:10.1109/CVPR.2019.01265
Luddecke, T., and Worgotter, F. (2017). “Learning to segment affordances,” in The IEEE international conference on computer vision (ICCV) workshops (New York, NJ: IEEE), 769–776. doi:10.1109/ICCVW.2017.96
Nekrasov, A., Schult, J., Litany, O., Leibe, B., and Engelmann, F. (2021). “Mix3D: Out-of-Context data augmentation for 3D scenes,” in 2021 international conference on 3D vision (3DV) (New York, NJ: Springer), 116–125. doi:10.1109/3DV53792.2021.00022
Pavlakos, G., Choutas, V., Ghorbani, N., Bolkart, T., Osman, A. A. A., Tzionas, D., et al. (2019). “Expressive body capture: 3d hands, face, and body from a single image,” in Proceedings of the IEEE/CVF conference on computer vision and pattern recognition (New York, NJ: IEEE), 10967–10977. doi:10.1109/CVPR.2019.01123
Peternell, M. (2000). Geometric properties of bisector surfaces. Graph. Models 62, 202–236. doi:10.1006/gmod.1999.0521
Piyathilaka, L., and Kodagoda, S. (2015). “Affordance-map: Mapping human context in 3D scenes using cost-sensitive SVM and virtual human models,” in 2015 IEEE international conference on Robotics and biomimetics (ROBIO) (New York, NJ: IEEE), 2035–2040. doi:10.1109/ROBIO.2015.7419073
Rhinehart, N., and Kitani, K. M. (2016). “Learning action maps of large environments via first-person vision,” in 2016 IEEE conference on computer vision and pattern recognition (CVPR) (New York, NJ: IEEE), 580. –588. doi:10.1109/CVPR.2016.69
Roy, A., and Todorovic, S. (2016). “A multi-scale CNN for affordance segmentation in RGB images,” in European conference on computer vision (Cham: Springer), 186–201.
Ruiz, E., and Mayol-Cuevas, W. (2020). Geometric affordance perception: Leveraging deep 3D saliency with the interaction tensor. Front. Neurorobotics14, 45. doi:10.3389/fnbot.2020.00045
Savva, M., Chang, A. X., Hanrahan, P., Fisher, M., and Nießner, M. (2014). SceneGrok: Inferring action maps in 3D environments. ACM Trans. Graph. (TOG)33, 1–10. doi:10.1145/2661229.2661230
Shapiro, S. S., and Wilk, M. B. (1965). An analysis of variance test for normality (complete samples). Biometrika52, 591–611. doi:10.2307/2333709
Šidák, Z. (1967). Rectangular confidence regions for the means of multivariate normal distributions. J. Am. Stat. Assoc.62, 626–633. doi:10.2307/2283989
Silberman, N., Hoiem, D., Kohli, P., and Fergus, R. (2012). “Indoor segmentation and support inference from RGBD images,” in European conference on computer vision (Berlin, Heidelberg: Springer), 746–760. doi:10.1007/978-3-642-33715-4_54
Straub, J., Whelan, T., Ma, L., Chen, Y., Wijmans, E., Green, S., et al. (2019). The Replica dataset: A digital Replica of indoor spaces. arXiv preprint arXiv:1906.05797.
Wang, X., Girdhar, R., and Gupta, A. (2017). “Binge watching: Scaling affordance learning from sitcoms,” in Proceedings of the IEEE conference on computer vision and pattern recognition (New York, NY: IEEE), 2596–2605. doi:10.1109/CVPR.2017.359
Wu, H., Misra, D., and Chirikjian, G. S. (2020). “Is that a chair? Imagining affordances using simulations of an articulated human body,” in 2020 IEEE international conference on Robotics and automation (ICRA) (New York, NY: IEEE), 7240–7246. doi:10.1109/ICRA40945.2020.9197384
Yuksel, C. (2015). Sample elimination for generating Poisson disk sample sets. Comput. Graph. Forum34, 25–32. doi:10.1111/cgf.12538
Zhang, H., Wu, C., Zhang, Z., Zhu, Y., Zhang, Z., Lin, H., et al. (2020a). ResNeSt: Split-Attention networks. arXiv.
Zhang, S., Zhang, Y., Ma, Q., Black, M. J., and Tang, S. (2020b). “Place: Proximity learning of articulation and contact in 3D environments,” in 8th international conference on 3D Vision (3DV 2020) (New York, NY: IEEE), 642–651. doi:10.1109/3DV50981.2020.00074
Zhang, Y., Hassan, M., Neumann, H., Black, M. J., and Tang, S. (2020c). “Generating 3D people in scenes without people,” in The IEEE/CVF conference on computer vision and pattern recognition (CVPR) (New York, NY: IEEE), 6193–6203. doi:10.1109/CVPR42600.2020.00623
Zhao, X., Choi, M. G., and Komura, T. (2017). Character-object interaction retrieval using the interaction bisector surface. Eurogr. Symposium Geometry Process. 36, 119–129. doi:10.1111/cgf.13112
Zhao, X., Hu, R., Guerrero, P., Mitra, N., and Komura, T. (2016). Relationship templates for creating scene variations. ACM Trans. Graph.35, 1–13. doi:10.1145/2980179.2982410
Zhao, X., Wang, H., and Komura, T. (2014). Indexing 3D scenes using the interaction bisector surface. ACM Trans. Graph.33, 1–14. doi:10.1145/2574860
Zhou, B., Zhao, H., Puig, X., Fidler, S., Barriuso, A., and Torralba, A. (2017). “Scene parsing through ADE20K dataset,” in Proceedings of the IEEE conference on computer vision and pattern recognition (New York, NY: IEEE), 5122–5130. doi:10.1109/CVPR.2017.544
Keywords: affordance detection, scene understanding, human interactions, visual perception, affordances
Citation: Pacheco-Ortega A and Mayol-Cuevas W (2023) AROS: Affordance Recognition with One-Shot Human Stances. Front. Robot. AI 10:1076780. doi: 10.3389/frobt.2023.1076780
Received: 01 December 2022; Accepted: 21 March 2023;
Published: 02 May 2023.
Edited by:
Fuqiang Gu, Chongqing University, ChinaCopyright © 2023 Pacheco-Ortega and Mayol-Cuevas. This is an open-access article distributed under the terms of the Creative Commons Attribution License (CC BY). The use, distribution or reproduction in other forums is permitted, provided the original author(s) and the copyright owner(s) are credited and that the original publication in this journal is cited, in accordance with accepted academic practice. No use, distribution or reproduction is permitted which does not comply with these terms.
*Correspondence: Abel Pacheco-Ortega, YWJlbC5wYWNoZWNvb3J0ZWdhQGJyaXN0b2wuYWMudWs=