 Jun-ichi Fukuda
- Department of Physics, Kyushu University, Fukuoka, Japan
We investigate the structure of a cholesteric blue phase (BP) liquid crystal cell of finite thickness under an electric field normal to the planar surfaces confining the liquid crystal. We carry out large scale simulations to consider cases in which the thickness of the BP liquid crystal is approximately 40 times the BP lattice constant (typical thickness in experiments), larger than that of previous simulation studies. Our calculations clearly demonstrate that the number of periodic structures along the thickness direction (thickness divided by the lattice constant) is discretized by the presence of confining surfaces. The stability of the so-called BP X structure over the BP I under the electric field, as well as the electrostriction, is confirmed. The metastability of the BP X structure after the cessation of the electric field, demonstrated in a recent experiment [Nat. Mater. 19, 94 (2020)] is also shown. We also perform calculations for the reflection spectra of the BP structures, and clearly observe the shift of the reflection peak due to electrostriction. Our study demonstrates the role of finite thickness on the behavior of a BP cell.
Introduction
Cholesteric blue phases (BPs) are complex three-dimensional ordered structures exhibited by highly chiral liquid crystals (Wright and Mermin 1989; Bahr and Kitzerow 2001). They comprise an intricate network of so-called double-twist cylinders and topological line defects of orientational order (disclination lines). In a double-twist cylinder, the orientational order is twisted along all directions perpendicular to the cylinder axis. Two thermodynamically stable blue phases are known to exhibit cubic symmetry: BP I with body-centered-cubic ordering with space group O8 (I4132), and BP II with simple cubic ordering with space group O2 (P4232) (A third stable blue phase, BP III, which is believed to be amorphous (Henrich et al., 2011; Gandhi and Chien 2017), is not the target of the present study). Cholesteric blue phases have been attracting interest from the viewpoint of basic science as an intriguing example of frustration-induced order (The inability of energetically favorable double-twist ordering to fill the whole space leads to the formation of disclination lines), and extensive studies have been carried out towards application for fast-switching displays (Kikuchi et al., 2002, 2007; Rahman et al., 2015; Tan et al., 2017).
The response of cholesteric blue phases to an applied electric field has been drawing considerable attention because it provides an interesting problem on structural transformation in soft materials, and its understanding is crucial for their potential applications. The electric field gives rise to intriguing behavior involving the change in the symmetry and the variation of lattice constants (electrostriction) (Kitzerow 1991). Hexagonal (Pieranski et al., 1985; Hornreich and Shtrikman 1989) and tetragonal (Cladis et al., 1986; Pieranski and Cladis 1987) blue phases have been identified that are thermodynamically stable only under an electric field. The latter, often referred to as BP X, has been shown to possess the space group symmetry I4122. Electrostriction of BPs and the resulting shift of reflection peak have been also attracting interest because of the potential of BPs as a tunable photonic material (Heppke. et al., 1989b; Yoshida et al., 2013; Chen et al., 2015; Guo et al., 2020).
Here we carry out a simulation study on how an applied electric field affect the structural and optical properties of a BP cell whose thickness is comparable with that of a real experimental cell (
There have been a number of simulation studies focusing on the behavior of BPs under an electric field (Alexander and Marenduzzo 2008; Alexander and Yeomans 2009; Fukuda et al., 2009; Fukuda and Žumer 2013; Henrich et al., 2010; Tiribocchi et al., 2011a; 2011b). However, most of them deal with purely bulk systems with periodic boundary conditions, or, even when a cell of finite thickness is considered, the cell thickness is much smaller than that of typical experimental systems. In the present work, the cell thickness is taken to be
This paper is organized as follows: In Calculation of BP structures and Calculation of reflection spectra, respectively, we describe how we calculate the structures of BPs and their reflection spectra. The results of the calculation of the structures are shown in Structures of cholesteric blue phase in a cell and Reflection spectra presents the reflection spectra. Discussion gives a concluding discussion.
Model
Calculation of BP structures
For the calculation of the structures of our cholesteric blue phase cell, we make use of the Landau-de Gennes continuum theory in which the orientational order of the liquid crystal is represented by a second-rank symmetric and traceless tensor χαβ. Details of the theory and the numerical calculation are presented in our previous papers (Fukuda et al., 2009; Fukuda and Žumer 2010a; 2010b; Fukuda and Žumer 2011a; 2011b; Nych et al., 2017; Fukuda et al., 2018; Fukuda and Žumer 2020; Fukuda 2022; Fukuda et al., 2022), and here we present their essence.
The geometry of the liquid crystal cell, shown in Figure 1, is such that it is confined by two planar surfaces that are parallel to the xy plane and located at z = 0 and z = L (The cell thickness is hence L. As mentioned below, length is appropriately rescaled). The free energy of the liquid crystal is given as a functional of the order parameter χαβ(r), where r represents the position. We introduce the rescaling of the free energy itself, order parameter, length and the material parameters as described in detail in Supplementary Appendix S1. The total free energy is the sum of the bulk part and the surface anchoring part, and the former is written as
where
is the local free energy given as a Landau expansion in terms of χαβ, and τ is the rescaled temperature. Tr means the trace of a tensor. The elastic energy taking care of the inhomogeneity of χαβ is written as
where κ is the rescaled elastic constant and can be regarded also as the strength of chirality inversely proportional to the cholesteric pitch p (See Supplementary Appendix S1). The parameter η represents the anisotropy of elasticity. In the present study η is set to one corresponding to the so-called one-constant approximation setting the splay, twist and bend Frank elastic constants to be equal. We have adopted this approximation just for simplicity, and in usual nematic liquid crystal made of rodlike molecules, twist elastic constant is smaller than the other two, and smaller twist elastic constant is realized by taking η > 1 (Wright and Mermin 1989; Fukuda 2022). Here and in the following, summations over repeated Greek indices are implied (Hence, in Eq. 3, the summation symbols ∑α=x,y,z and ∑β=x,y,z are omitted). Note that the length has been rescaled so that the cholesteric pitch is equal to 4π (See Appendix). Therefore the cholesteric pitch does not appear explicitly in Eq. 3. The sign of the chirality is determined by that of σ (|σ| = 1) and we here choose σ = +1, which yields right-handed helical order in the terminology of de Gennes and Prost 1995. The electrostatic energy is given by
where the electric field is assumed to be uniform and fixed, and the unit vector
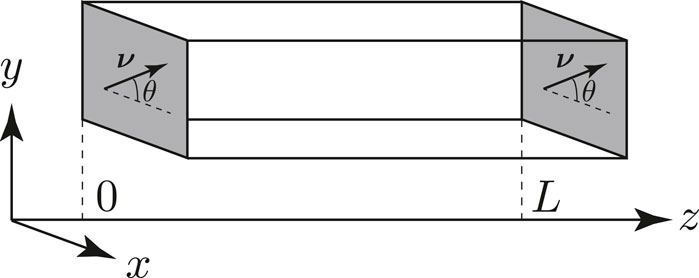
FIGURE 1. Geometry of the system for numerical calculation. The gray planes at z = 0 and L are the cell surfaces imposing unidirectional planar anchoring with its easy axis being ν. The angle theta specifies the direction of ν with respect to the x axis. Other white planes impose periodic boundary conditions.
The surface anchoring energy is expressed as
where φs0(χ) and φsL(χ) are the free energy density at z = 0 and z = L, respectively. As in our previous study (Fukuda and Žumer 2020), both φs0(χ) and φsL(χ) are given by the sum of the planar-degenerate part φpd and the unidirectional planar part φpd that are expressed as
Here ν is the direction of the orientational order imposed by the unidirectional planar anchoring (hereafter referred to as the easy axis), and taken to be parallel to the xy plane. Therefore ν can be written as ν = (cos θ, sin θ, 0), with θ being the azimuthal angle of the easy axis (Figure 1). The parameters w1, w2 and wud are rescaled anchoring strengths. In our system, θ is taken to be the same for both surfaces. In Fukuda and Žumer 2020, we discussed how the variation of θ affects the free energy of BP I with its (110) planes parallel to the confining surfaces. We showed that the free energy is minimized at θ = 38.5°. Similar calculation for BP X shows that θ = 38.5° minimizes the free energy of BP X as well, although we believe that this is a coincidence without a profound meaning (Note that the precision of θ is 0.1°). From these observations, we set θ = 38.5° for the present calculations.
For the convenience of the discussions that follow, we define the free energy per (rescaled) unit area:
where Fbulk and Fsurf are defined in Eqs. 1, 5, respectively.
In Table 1 we summarize the parameters used for all the simulations. See Supplementary Appendix S1 for more detail on how Table 1 is derived. As noted above, we consider the case of positive dielectric anisotropy
where
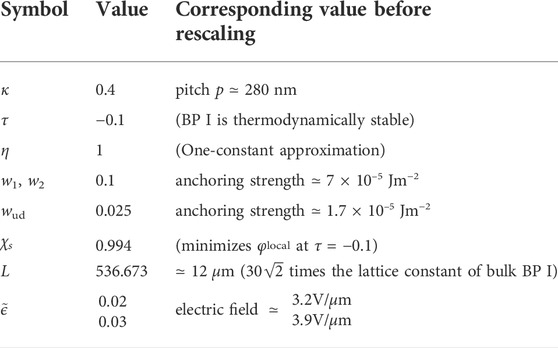
TABLE 1. Summary of parameters used for all the simulations. See Supplementary Appendix S1 for the correspondence between the parameters and the corresponding parameters before rescaling.
In the xy plane, periodic boundary conditions are imposed, and the system is discretized by Nx × Ny rectangular grid points with spacings Δx and Δy. We have chosen Nx = 45 and Ny = 32. In the z direction normal to the confining surfaces, Nz + 1 grid points with equal spacings Δz and Nz = 1350 are allocated (Hence the cell thickness is L = NzΔz). The minimization of the free energy is achieved by a simple relaxation equation:
where λ(r) is the Lagrange multiplier ensuring the tracelessness of χαβ(r), and the time t is rescaled so that the kinetic coefficient does not appear explicitly in Eq. 11. The technical details of the minimization procedures are described in detail in Fukuda and Žumer 2020. We just note here that not only the order parameter χαβ but also Δx and Δy are optimized in the minimization procedures.
Initial conditions necessary for the minimization procedure of the free energy are prepared as follows. In a smaller system with periodic boundary conditions in the x, y and z direction, we prepare a profile of BP I with its (110) plane parallel to the xy plane, and a profile of BP X. The initial condition is the repetition of one of these profiles along the z direction. We prepare different initial conditions containing different numbers of BP lattices in the z direction of the BP cell by changing the lattice constant of the BP lattice in the z direction.
Calculation of reflection spectra
For reflection spectra, we solve the Maxwell equations for electromagnetic wave of light as described in our previous studies (Fukuda et al., 2016; Nych et al., 2017; Fukuda and Žumer 2018; Cho et al., 2021). For a non-magnetic medium with no free charge or electric current, the magnetic field is safely eliminated and the Maxwell equation for the electric field E oscillating with a single frequency ω as ∝ exp (−iωt) reads (Landau et al., 1984)
Here
As noted in Calculation of reflection spectra, the liquid crystal fills the region 0 ≤ z ≤ L. The media outside the liquid crystal (z < 0, z > L) are an isotropic and homogeneous materials whose refractive index is set to noutside = 1.5 (or the dielectric constant ϵoutside = 2.25). The dielectric tensor of the liquid crystal is assumed to be a linear function of the order parameter, that is, ϵαβ = ϵisoδαβ + ϵaχαβ, where ϵiso = 2.571 and ϵa = 0.825 as in the previous studies (Nych et al., 2017), and δαβ is the Kronecker delta. The choice of ϵiso and ϵa is such that the average refractive index of the liquid crystal is nLC = 1.6, close to typical experimental values.
We consider the response of the liquid crystal to monochromatic light incident from z = −∞, whose electric field is given by E = Ei exp (iki ⋅r). As noted in Calculation of reflection spectra we assume the periodicity of χαβ in the xy direction, and then according to the Bloch theorem the electric field E is formally expanded as
where r⊥ = (x, y), and we have defined
The reflectivity for each mode (m, n) is given by
where Re denotes the real part (for evanescent contributions,
As we are dealing with a chiral system, we are interested in the dependence of reflectivity on the sense of circular polarization of incident light. We set
Results
Structures of cholesteric blue phase in a cell
Before presenting the details of the simulation results on the structures of cholesteric blue phase cell, let us characterize the periodicity of the cholesteric blue phase structure. For this purpose, we first introduce the Fourier transform of χαβ(r):
whose discretized version for q = 2π(jx/NxΔx, jy/NyΔy, jz/NzΔz) and r = (nxΔx, nyΔy, nzΔz) reads
Here the special treatment for nz = 0 and Nz is due to the absence of periodic boundary conditions in the z direction.
Now we define the average wavenumber of the structure in the z direction by
and the number of periodic structures in the z (cell normal) direction:
Note that |χαβ[0, 0, jz]|2 is sharply peaked, and that the summation over jz in Eq. 17 is taken over the small range containing the peak, more specifically, 40 ≤ jz ≤ 80, to eliminate possible undesirable contributions from higher and lower jz (See the discussion after presenting the real-space structures in Figures 2, 3). Note also that only positive jz is considered because |χαβ[0, 0, jz]|2 = |χαβ[0, 0, − jz]|2, and therefore the peaks appear symmetrically about jz = 0).
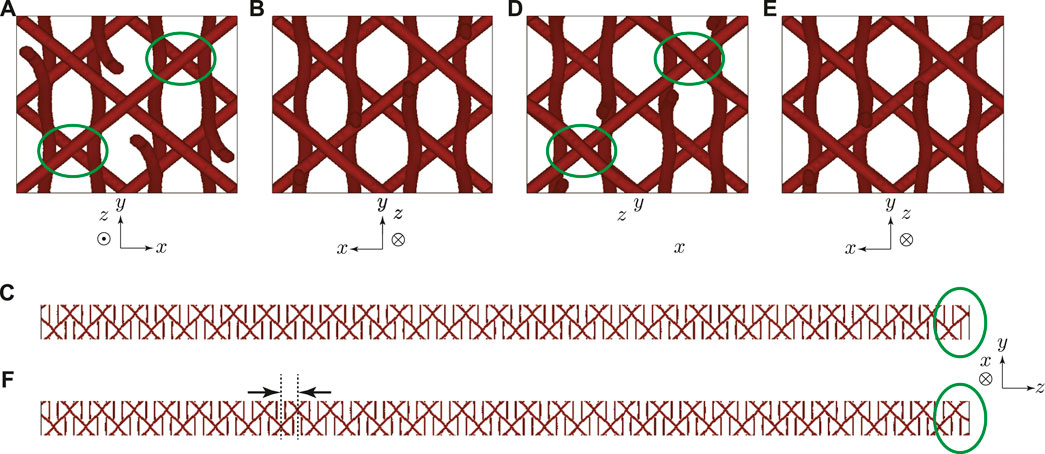
FIGURE 2. Numerically obtained BP I structures with (A–C) m = 56.0 and (D–F) m = 56.6, in orthographic view from (A,D) + z, (B,E) − z, and (C,F) − x direction. The interval sandwiched by arrows in (F) indicates the “wavelength” defined by
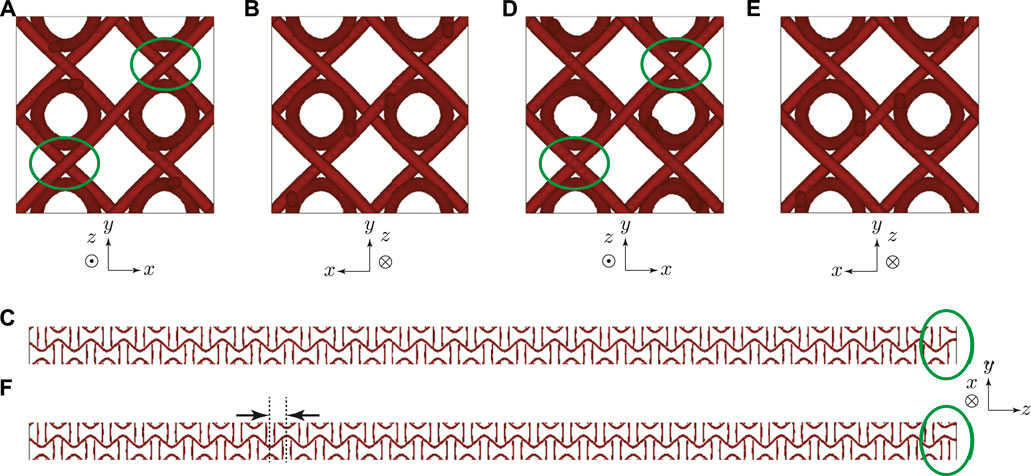
FIGURE 3. The same as Figure 2 for numerically obtained BP X structures with (A–C) m = 56.0 and (D–F) m = 56.3.
In Figure 2 we show the representative equilibrium structures of BP I with its (110) plane parallel to the xy plane in our finite-thickness cell. It is well known that the orientational order described by a tensor order parameter is weaker at the disclination (Schopohl and Sluckin 1987), and disclination lines are depicted by the isosurfaces Tr χ2 = 0.3 (when
Figure 3 shows two equilibrium structures of BP X with different m. The 41 screw axis of BP X is parallel to the z direction. Again the difference in the arrangement of disclination lines is found in the vicinity of the top surface (Figures 2A,D. Figures 2C,F also highlights the difference). Note that the disclination structure shown here has already been proposed as a candidate of BP X structure in earlier numerical studies (Alexander and Marenduzzo 2008; Alexander and Yeomans 2009).
Figure 4 shows |χαβ[0, 0, jz]|2 for the structures shown in Figures 2, 3. Indeed, |χαβ[0, 0, jz]|2 is sharply peaked around
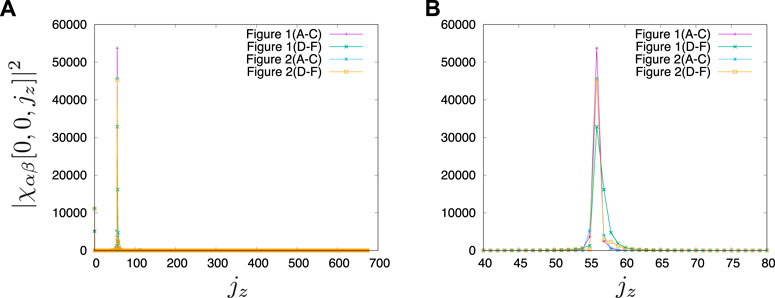
FIGURE 4. Plot of |χαβ[0, 0, jz]|2 as a function of jz for the structures in Figures 2, 3. The range of jz is (A) jz ≥ 0 and (B) 40 ≤ jz ≤ 80.
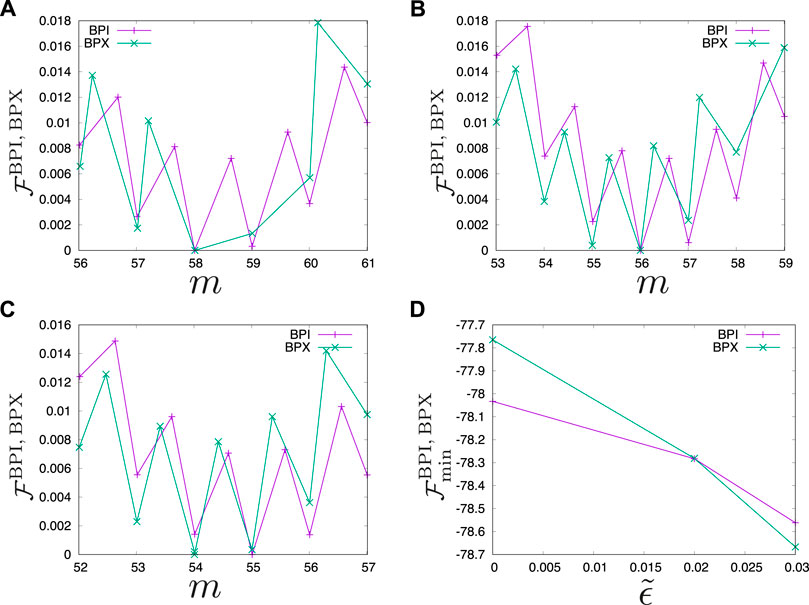
FIGURE 5. The free energy of the BP cell
To show how the free energy of the BP cell per unit area (hereafter denoted by
One finds that the local minima of
From Figure 5 we also find that stronger
Figure 5D demonstrates that a stronger field favors BP X, and the transition between BP I and BP X is located at
Guo et al., 2020 showed that BP X structures carefully prepared by applying an electric field can retain their ordering even after the cessation of the field, despite the energy gain by the transformation to BP I (estimated to be ≃ 1.8 × 10⁴kBT/μm2 from Figure 5D; Eq. 10). We first note that from our numerical results we cannot evaluate the energy barrier involved in the structural transformation from BP X to BP I, because its kinetic pathway is not clear. Nevertheless we comment that in the relaxation process to obtain the (meta)stable profiles we did not observe spontaneous transformation from BP X to BP I, suggesting non-negligible energy barriers. Now let us discuss the energy barrier involved in the variation of m or az. Suppose that the BP X structure with m = 56 is transformed to BP I with the same m after the electric field with
Reflection spectra
Here we consider how the BP cell reflects normally incident light, and Figure 6 shows the reflection spectra for the BP I and BP X structures that minimize the free energy and are presented in Structures of cholesteric blue phase in a cell. The horizontal axis represents λvac/p, where λvac is the wavelength of the incident light in vacuum, given by 2πnoutside/|ki|. Irrespective of whether the structure is BP I or BP X, when the sense of the polarization is the same as that of the twisted orientational order (right-circular in the present study), strong selective reflection occurs (Figures 6A,D) and otherwise reflection becomes much weaker (Figures 6B,E). Strong selective reflection of circularly polarized light has long been well known for a cholesteric liquid crystal cell (Berreman and Scheffer 1970; Dreher et al., 1971; Takezoe et al., 1983; de Gennes and Prost 1995; St. John et al., 1995), and similar selective reflection by BPs has been also drawing interest (Bohley and Scharf 2004; Yoshida et al., 2016; Cho et al., 2021). Reflection spectra for unpolarized light are also shown in Figures 6C,F that could be compared with some experiments.
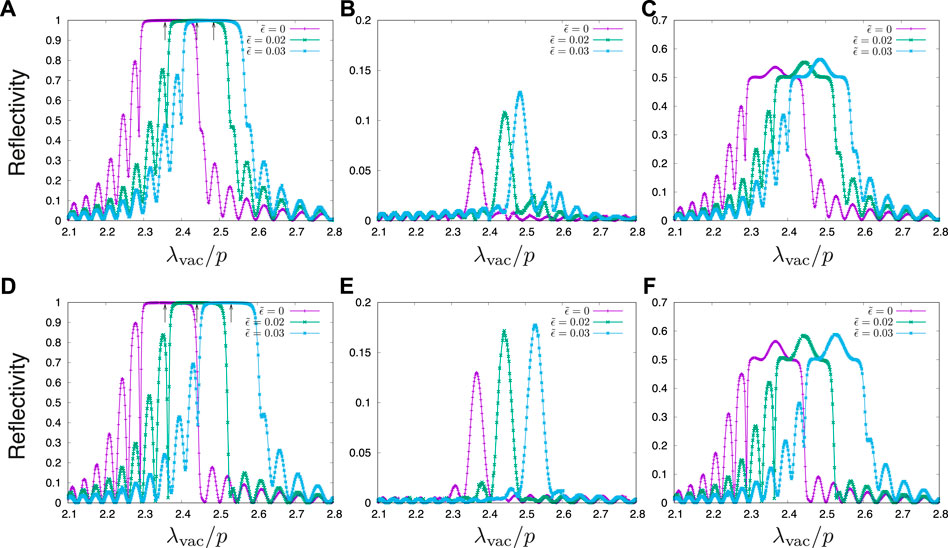
FIGURE 6. Reflection spectra for (A–C) BP I structures for
When the electric field is stronger, and the lattice spacing in the z direction, az, becomes larger, the shift of the reflection peak towards larger λvac is clearly observed, as expected and in agreement with experiments (Heppke et al., 1989b; Yoshida et al., 2013; Chen et al., 2015; Guo et al., 2020). The location of the peak agrees with that of the Bragg peak λvac = aznLC (See the arrows in Figures 6A,D). When the BP X structure with m = 56 turns out to be stable, the peak shift from that of BP I with no field (m = 58) is ≃ 3.6%, close to the typical values reported in Guo et al., 2020, again suggesting that the discretization of the BP structure by the confining surfaces is responsible for the stabilization of the BP structure with different lattice constant in Guo et al., 2020.
We note that the qualitative difference in shape between the reflection spectra of BP I (Figures 6A–C)) and BP X (Figures 6D–F)) is not pronounced. Therefore reflection spectra for normal incident alone cannot distinguish the structural difference of BPs, and other techniques such as Kossel diagrams (Heppke et al., 1989b; Yoshida et al., 2013; Chen et al., 2015; Guo et al., 2020) will be necessary. We further note that, in contrast to our calculation results (Figure 6), in many experiments the reflection spectra are bell-shaped, and that the fringes are not observed or far less visible if they exist. This difference could be due to the perfect ordering in our calculation not realized in experiments, a small distribution of the incident angle in experiments, or the fluctuation of the cholesteric pitch (St. John et al., 1995).
Discussion
We carried out a simulation study on the structures and optical properties of a cholesteric blue phase cell whose thickness is on the order of 10 μm, comparable to that of typical experimental systems, and much larger than that of previous simulation studies. Our numerical calculations were based on the Landau-de Gennes continuum theory describing the orientational order by a second-rank tensor. We focused on two blue phase structures: One is BP I with its (110) plane parallel to the confining surfaces, and the other is BP X with its 41 screw axis along the cell normal. The latter has been known to be not thermodynamically stable in the absence of an electric field. We were particularly interested in the effect of the applied electric field along the cell normal.
We showed that both BP I and BP X exhibit multiple (meta)stable structures with a different value of the lattice constant in the cell normal direction. The possibility of multiple states with distinct lattice constant is attributable to the presence of confining planes. The electrostriction, larger lattice constant along the field direction for a stronger field, was also clearly observed. From the evaluation of the free energy, we found that the (meta)stable structures of BP I and BP X can be stable enough with respect to the variation of the lattice constant in the cell normal. We also calculated the reflection spectra of these blue phase structures for normal incident light, and demonstrated the selective reflection of circularly polarized light arising from the chirality of the blue phase structure, and the shift of reflection peak due to electrostriction. These findings are in qualitative agreement with recent experimental results reported in Guo et al., 2020 on the stabilization of BP X structures with different reflection peak wavelength. The relative shift of the peak wavelength of a few percent in Guo et al., 2020 is safely accounted for by the discretization of the BP structure we found numerically.
Here we particularly focused on BP I, and the other cubic structure BP II is also expected to exhibit discretized behavior attributable to the cell surfaces, although further experimental and numerical studies will be necessary. How the presence of cell surfaces affects BP III that is believed to be amorphous is far from trivial, and because one cannot assume periodicity in the lateral directions, numerical calculations for BP III will be much more challenging, and experimental studies are first desirable.
As mentioned above, our study concerns only cases with specific orientation of the BP lattice, and there are other possibilities of lattice orientations (Kitzerow 1991; Miller and Gleeson 1996). Which lattice orientation is more easily realized in a BP cell of finite thickness, and how the lattice orientation with respect to the confining surfaces affects the response of BPs to an electric field will be interesting future directions of numerical studies.
We restricted ourselves to the (meta)stable static structures, and the investigation of dynamic behavior in a realistic time scale is a daunting task requiring an unrealistically long calculation time: In Guo et al., 2020 the duration of the electric field is tens of seconds, and in our present numerical system, simulation of the dynamics for 1 s will take almost 2 years (in some of the calculations we used 56 cores of Intel Xeon Gold 6330 CPU with OpenMP parallelization). We note that the incorporation of the backflow, not taken into account in our dynamic Equation (11), will further slow the calculation. Moreover, Guo et al., 2020 emphasized the importance of the application of the field without heating the liquid crystal. Most of the simulations based on the Landau-de Gennes formalism (including ours) assume an isothermal system, and incorporation of the effect of heating requires the formulation of the dynamics of the liquid crystal including inhomogeneous temperature field. Although such formalism based on non-equilibrium thermodynamics has been developed for a long time (Martin et al., 1972; De Groot and Mazur 1984), simulating liquid crystals with spatial variation of temperature does not seem to be drawing particular attention.
As mentioned above, simulation of the dynamics of a blue phase cell of realistic size and time scale is highly challenging. Nevertheless, our study reveals the necessity of such studies for the understanding of the behavior of a blue phase cell, especially when one is interested in its practical application.
Data availability statement
The raw data supporting the conclusion of this article will be made available by the authors, without undue reservation.
Author contributions
J-iF designed and carried out the study, and wrote the manuscript.
Funding
This work is supported by JSPS KAKENHI (Grant Numbers JP17H02947 and JP21H01049), and JSPS Bilateral Joint Research Project between Japan and Slovenia led by Professor Tomonari Dotera and Professor Primož Ziherl.
Acknowledgments
The author thanks Professor Slobodan Žumer for valuable discussions and suggestions that motivated the present study. Part of the numerical calculations was carried out using the facilities of the Supercomputer Center, the Institute for Solid State Physics, the University of Tokyo.
Conflict of interest
The author declares that the research was conducted in the absence of any commercial or financial relationships that could be construed as a potential conflict of interest.
Publisher’s note
All claims expressed in this article are solely those of the authors and do not necessarily represent those of their affiliated organizations, or those of the publisher, the editors and the reviewers. Any product that may be evaluated in this article, or claim that may be made by its manufacturer, is not guaranteed or endorsed by the publisher.
Supplementary material
The Supplementary Material for this article can be found online at: https://www.frontiersin.org/articles/10.3389/frsfm.2022.1011618/full#supplementary-material
References
Alexander, G. P., and Marenduzzo, D. (2008). Cubic blue phases in electric fields. Europhys. Lett. 81, 66004. doi:10.1209/0295-5075/81/66004
Alexander, G. P., and Yeomans, J. M. (2009). Numerical results for the blue phases. Liq. Cryst. 36, 1215–1227. doi:10.1080/02678290903057390
Berreman, D. W., and Scheffer, T. J. (1970). Bragg reflection of light from single-domain cholesteric liquid-crystal films. Phys. Rev. Lett. 25, 577–581. doi:10.1103/PhysRevLett.25.577
Bohley, C., and Scharf, T. (2004). Polarization of light reflected by cholesteric blue phases. J. Opt. A Pure Appl. Opt. 6, S77–S80. doi:10.1088/1464-4258/6/3/014
Chen, C.-W., Li, C.-C., Jau, H.-C., Yu, L.-C., Hong, C.-L., Guo, D.-Y., et al. (2015). Electric field-driven shifting and expansion of photonic band gaps in 3D liquid photonic crystals. ACS Photonics 2, 1524–1531. doi:10.1021/acsphotonics.5b00314
Cho, S., Takahashi, M., Fukuda, J., Yoshida, H., and Ozaki, M. (2021). Directed self-assembly of soft 3d photonic crystals for holograms with omnidirectional circular-polarization selectivity. Commun. Mat. 2, 39. doi:10.1038/s43246-021-00146-x
Cladis, P. E., Garel, T., and Pieranski, P. (1986). Kossel diagrams show electric-field-induced cubic-tetragonal structural transition in frustrated liquid-crystal blue phases. Phys. Rev. Lett. 57, 2841–2844. doi:10.1103/PhysRevLett.57.2841
de Gennes, P. G., and Prost, J. (1995). “The Physics of liquid crystals,” in International series of monographs on Physics. 2 edn (Oxford: Oxford University).
De Groot, S., and Mazur, P. (1984). Non-equilibrium thermodynamics. Dover Books on Physics Dover Publications.
Dreher, R., Meier, G., and Saupe, A. (1971). Selective reflection by cholesteric liquid crystals. Mol. Cryst. Liq. Cryst. 13, 17–26. doi:10.1080/15421407108083534
Fournier, J.-B., and Galatola, P. (2005). Modeling planar degenerate wetting and anchoring in nematic liquid crystals. Europhys. Lett. 72, 403–409. doi:10.1209/epl/i2005-10253-5
Fukuda, J. (2022). Exotic structures of a thin film of chiral liquid crystals: A numerical study based on the Landau–de Gennes theory. Liq. Cryst. Rev.. doi:10.1080/21680396.2022.2077256
Fukuda, J., Nych, A., Ognysta, U., Žumer, S., and Muševič, I. (2022). Liquid crystalline half-skyrmions and their optical properties. Ann. Phys. 534, 2100336. doi:10.1002/andp.202100336
Fukuda, J., Nych, A., Ognysta, U., Žumer, S., and Muševič, I. (2018). Liquid-crystalline half-skyrmion lattice spotted by kossel diagrams. Sci. Rep. 8, 17234. doi:10.1038/s41598-018-35514-0
Fukuda, J., Okumura, Y., and Kikuchi, H. (2016). Calculation of confocal microscope images of cholesteric blue phases. Proc. SPIE 9769, 976906. doi:10.1117/12.2209210
Fukuda, J., Yoneya, M., and Yokoyama, H. (2009). Simulation of cholesteric blue phases using a Landau–de Gennes theory: Effect of an applied electric field. Phys. Rev. E 80, 031706. doi:10.1103/PhysRevE.80.031706
Fukuda, J., and Žumer, S. (2010a). Cholesteric blue phases: Effect of strong confinement. Liq. Cryst. 37, 875–882. doi:10.1080/02678292.2010.481909
Fukuda, J., and Žumer, S. (2010b). Novel defect structures in a strongly confined liquid-crystalline blue phase. Phys. Rev. Lett. 104, 017801. doi:10.1103/PhysRevLett.104.017801
Fukuda, J., and Žumer, S. (2011a). Quasi-two-dimensional Skyrmion lattices in a chiral nematic liquid crystal. Nat. Commun. 2, 246. doi:10.1038/ncomms1250
Fukuda, J., and Žumer, S. (2011b). Ring defects in a strongly confined chiral liquid crystal. Phys. Rev. Lett. 106, 097801. doi:10.1103/PhysRevLett.106.097801
Fukuda, J., and Žumer, S. (2011c). Structural forces in liquid crystalline blue phases. Phys. Rev. E 84, 040701. doi:10.1103/PhysRevE.84.040701
Fukuda, J., and Žumer, S. (2013). Field-induced dynamics and structures in a cholesteric-blue-phase cell. Phys. Rev. E 87, 042506. doi:10.1103/PhysRevE.87.042506
Fukuda, J., and Žumer, S. (2018). Reflection spectra and near-field images of a liquid crystalline half-skyrmion lattice. Opt. Express 26, 1174–1184. doi:10.1364/OE.26.001174
Fukuda, J., and Žumer, S. (2020). Lattice orientation of cholesteric blue phases in contact with surfaces enforcing unidirectional planar anchoring. Phys. Rev. Res. 2, 033407. doi:10.1103/PhysRevResearch.2.033407
Gandhi, S. S., and Chien, L.-C. (2017). Unraveling the mystery of the blue fog: Structure, properties, and applications of amorphous blue phase iii. Adv. Mat. 29, 1704296. doi:10.1002/adma.201704296
Guo, D.-Y., Chen, C.-W., Li, C.-C., Jau, H.-C., Lin, K.-H., Feng, T.-M., et al. (2020). Reconfiguration of three-dimensional liquid-crystalline photonic crystals by electrostriction. Nat. Mat. 19, 94–101. doi:10.1038/s41563-019-0512-3
Henrich, O., Marenduzzo, D., Stratford, K., and Cates, M. E. (2010). Thermodynamics of blue phases in electric fields. Phys. Rev. E 81, 031706. doi:10.1103/PhysRevE.81.031706
Henrich, O., Stratford, K., Cates, M. E., and Marenduzzo, D. (2011). Structure of blue phase III of cholesteric liquid crystals. Phys. Rev. Lett. 106, 107801. doi:10.1103/PhysRevLett.106.107801
Heppke, G., Jérôme, B., Kitzerow, H.-S., and Pieranski, P. (1989a). Electrostriction of bpi and bpii for blue phase systems with negative dielectric anisotropy. J. Phys. Fr. 50, 549–562. doi:10.1051/jphys:01989005005054900
Heppke, G., Jérôme, B., Kitzerow, H.-S., and Pieranski, P. (1989b). Electrostriction of the cholesteric blue phases bpi and bpii in mixtures with positive dielectric anisotropy. J. Phys. Fr. 50, 2991–2998. doi:10.1051/jphys:0198900500190299100
Hornreich, R. M., and Shtrikman, S. (1989). Invited Lecture. Hexagonal cholesteric blue phases. Liq. Cryst. 5, 777–789. doi:10.1080/02678298908026384
Kikuchi, H., Higuchi, H., Haseba, Y., and Iwata, T. (2007). 62.2: Invited paper: Fast electro-optical switching in polymer-stabilized liquid crystalline blue phases for display application. SID Symposium Dig. Tech. Pap. 38, 1737–1740. doi:10.1889/1.2785662
Kikuchi, H., Yokota, M., Hisakado, Y., Yang, H., and Kajiyama, T. (2002). Polymer-stabilized liquid crystal blue phases. Nat. Mat. 1, 64–68. doi:10.1038/nmat712
Kitzerow, H.-S. (1991). The effect of electric fields on blue phases. Mol. Cryst. Liq. Cryst. 202, 51–83. doi:10.1080/00268949108035659
Landau, L. D., Lifshitz, E., and Pitaevskii, L. (1984). Electrodynamics of continuous media. 2 edn, 8. Elsevier.
Li, X., Martínez-González, J. A., Hernández-Ortiz, J. P., Ramírez-Hernández, A., Zhou, Y., Sadati, M., et al. (2017). Mesoscale martensitic transformation in single crystals of topological defects. Proc. Natl. Acad. Sci. U. S. A. 114, 10011–10016. doi:10.1073/pnas.1711207114
Martin, P. C., Parodi, O., and Pershan, P. S. (1972). Unified hydrodynamic theory for crystals, liquid crystals, and normal fluids. Phys. Rev. A 6, 2401–2420. doi:10.1103/PhysRevA.6.2401
Martínez-González, J. A., Li, X., Sadati, M., Zhou, Y., Zhang, R., Nealey, P. F., et al. (2017). Directed self-assembly of liquid crystalline blue-phases into ideal single-crystals. Nat. Commun. 8, 15854. doi:10.1038/ncomms15854
Miller, R. J., and Gleeson, H. F. (1996). Lattice parameter measurements from the Kossel diagrams of the cubic liquid crystal blue phases. J. Phys. II Fr. 6, 909–922. doi:10.1051/jp2:1996219
Nych, A., Fukuda, J., Ognysta, U., Žumer, S., and Muševič, I. (2017). Spontaneous formation and dynamics of half-skyrmions in a chiral liquid-crystal film. Nat. Phys. 13, 1215–1220. doi:10.1038/nphys4245
Pieranski, P., Cladis, P., and Barbet-Massin, R. (1985). Experimental evidence for a hexagonal blue phase. J. Phyique. Lett. 46, 973–977. doi:10.1051/jphyslet:019850046020097300
Pieranski, P., and Cladis, P. E. (1987). Field-induced tetragonal blue phase (BP X). Phys. Rev. A 35, 355–364. doi:10.1103/PhysRevA.35.355
Rahman, M. D. A., Said, S. M., and Balamurugan, S. (2015). Blue phase liquid crystal: Strategies for phase stabilization and device development. Sci. Technol. Adv. Mater. 16, 033501. doi:10.1088/1468-6996/16/3/033501
Schopohl, N., and Sluckin, T. J. (1987). Defect core structure in nematic liquid crystals. Phys. Rev. Lett. 59, 2582–2584. doi:10.1103/PhysRevLett.59.2582
St. John, W. D., Fritz, W. J., Lu, Z. J., and Yang, D.-K. (1995). Bragg reflection from cholesteric liquid crystals. Phys. Rev. E 51, 1191–1198. doi:10.1103/PhysRevE.51.1191
Takezoe, H., Ouchi, Y., Hara, M., Fukuda, A., and Kuze, E. (1983). Experimental studies on reflection spectra in monodomain cholesteric liquid crystal cells: Total reflection, subsidiary oscillation and its beat or swell structure. Jpn. J. Appl. Phys. (2008). 22, 1080–1091. doi:10.1143/jjap.22.1080
Tan, G., Lee, Y.-H., Gou, F., Chen, H., Huang, Y., Lan, Y.-F., et al. (2017). Review on polymer-stabilized short-pitch cholesteric liquid crystal displays. J. Phys. D. Appl. Phys. 50, 493001. doi:10.1088/1361-6463/aa916a
Tiribocchi, A., Gonnella, G., Marenduzzo, D., and Orlandini, E. (2011a). Switching dynamics in cholesteric blue phases. Soft Matter 7, 3295–3306. doi:10.1039/C0SM00979B
Tiribocchi, A., Gonnella, G., Marenduzzo, D., Orlandini, E., and Salvadore, F. (2011b). Bistable defect structures in blue phase devices. Phys. Rev. Lett. 107, 237803. doi:10.1103/PhysRevLett.107.237803
Wright, D. C., and Mermin, N. D. (1989). Crystalline liquids: The blue phases. Rev. Mod. Phys. 61, 385–432. doi:10.1103/RevModPhys.61.385
Yoshida, H., Anucha, K., Ogawa, Y., Kawata, Y., Ozaki, M., Fukuda, J., et al. (2016). Bragg reflection band width and optical rotatory dispersion of cubic blue-phase liquid crystals. Phys. Rev. E 94, 042703. doi:10.1103/PhysRevE.94.042703
Keywords: cholesteric blue phase, liquid crystal cell, electric field, electrostriction, reflection spectrum
Citation: Fukuda J-i (2022) Simulation of a cholesteric blue phase cell with large but finite thickness. Front. Soft. Matter 2:1011618. doi: 10.3389/frsfm.2022.1011618
Received: 04 August 2022; Accepted: 05 September 2022;
Published: 11 October 2022.
Edited by:
Hiroshi Yokoyama, Kent State University, United StatesReviewed by:
Alejandro D. Rey, McGill University, CanadaMiha Ravnik, University of Ljubljana, Slovenia
Copyright © 2022 Fukuda. This is an open-access article distributed under the terms of the Creative Commons Attribution License (CC BY). The use, distribution or reproduction in other forums is permitted, provided the original author(s) and the copyright owner(s) are credited and that the original publication in this journal is cited, in accordance with accepted academic practice. No use, distribution or reproduction is permitted which does not comply with these terms.
*Correspondence: Jun-ichi Fukuda, ZnVrdWRhLmp1bi1pY2hpQHBoeXMua3l1c2h1LXUuYWMuanA=