 Kalpana Manne
 Sofia Magkiriadou
 Pavel Yazhgur
 Ahmet F. Demirörs
 Frank Scheffold
- Department of Physics, University of Fribourg, Fribourg, Switzerland
We produce solid silica dry foam structures that exhibit structural color. For this purpose, we use densely packed colloidal microgels decorated with silica nanoparticles that are much smaller than the microgels. By concentrating and overpacking the microgel particles, we can control their morphology so that the silica nanoparticles spontaneously form honeycomb-like structures or networks. We obtain pure silica dry foam structures by burning the organic polymer, leaving behind silica networks. The resulting foams exhibit vivid structural colors. We can control the color by changing the microgel particles’ size and degree of compression. Furthermore, thanks to the softness of the particles, compression can also lead to the appearance of facets. This faceting behavior distinguishes microgels from hard spherical particles. We present details about the synthesis and fabrication strategies and report on a comprehensive characterization of optical and structural properties. Our study provides insight into the fabrication of innovative self-assembled materials with structural colors by colloidal templating.
1 Introduction
Solid foams are materials typically made by dispersing gas bubbles in a matrix that is subsequently solidified. Such materials are used in various fields, including food, acoustics, cosmetics, gas filters, construction, and insulation, making them an important class of materials in industry Liu et al. (2006); Yan et al. (2011). The pore sizes of foams can range from a few nanometres to hundreds of micrometres Luc et al. (2014). Foam structures are divided into two main groups: open cell and closed cell. In closed-cell foams, the cells are separated from each other by enclosing walls. Open-cell foams are made of struts and the cells are connected; they have holes through which liquid and air can easily travel Banhart (2001). Depending on the bubble size and the structure of foams the applications are different. For instance, closed-cell foams are shown to have better energy and sound absorption characteristics Du et al. (2020). They also make strong, durable, rigid materials that do not absorb water, for example, in athletic shoes. For photonics, it has been suggested that open-cell foams or network structures made of dielectric materials can exhibit a photonic band gap Klatt et al. (2019); Ricouvier et al. (2019); Maimouni et al. (2020), as opposed to closed-cell foams Bergman et al. (2022). Photonic applications in the visible range require small pore sizes. Researchers often opt for a sacrificial template method instead of directly foaming a material to achieve this. In this templating approach, small particles are dispersed in a matrix instead of air bubbles and subsequently removed. By manipulating the quantity, size, polydispersity, and shape of the sacrificial particulate materials, the foam’s structure and morphology can be fine-tuned Yu et al. (2021).
While some foams are colored due to absorption by chemical compounds or pigments Członka et al. (2019); Kim et al. (2009), nature offers another method of coloration through structural correlations at the nano- and mesoscale of dielectric materials. These so-called “structural colors” are non-fading and can be more environmentally friendly than pigment-based colors Chan et al. (2022); Galisteo-López et al. (2011). Structural colors originate from interactions between light waves scattered coherently by nanoscale structures. This phenomenon is widely seen in nature, for example, in opals, beetles, and the brilliant feathers of birds Zhao et al. (2012), Li et al. (2023). In 1998, Prum et al. first explained the color in the blue feather barbs of the plum-throated cotinga, consisting of a keratin matrix with air vacuoles of uniform diameter and spacing Prum et al. (1998). Dielectric materials arranged in a crystalline fashion produce angle-dependent structural color like in opals, whereas angle-independent structural color is produced when the materials have short-ranged order at the nanoscale and no long-ranged order Kawamura et al. (2016).
Blue and green structural colors are widely found in nature. Several groups have been successful in making synthetic structural colors, for instance, with polystyrene or silica particles Forster et al. (2010), Rojas-Ochoa et al. (2004) Demirörs et al. (2022), Højlund-Nielsen et al. (2014), Yazhgur et al. (2022), Wang et al. (2022). However, synthesizing materials with longer-wavelength colors like red and yellow has been more challenging. Researchers have set to understand why it is difficult to make red structural color and why it is absent in nature Magkiriadou et al. (2014); Jacucci et al. (2020). Later on, red photonic glass has been reported Kim et al. (2017) in inverse structures, i.e., structures that have low-refractive-index dielectric materials embedded in a matrix of higher-refractive-index dielectric materials. Dry foams can be considered as inverse structures, which makes them relevant for structural color applications. Moreover, they have the potential to show a photonic band gap when made from materials with a refractive index contrast greater than ≈ 2.5 Klatt et al. (2019).
In previous work, we reported the fabrication of macroporous silica foams by templating soft colloids Bergman et al. (2022) but we did not target nor characterize the structural color spectra of the materials. We have shown the synthesis of soft colloids, the fabrication of foams, and the relevance of these foams for photonic applications. Through simulations, we have confirmed that open-cell foams can show a photonic bandgap. In our experiments we used microgel colloidal particles as the sacrificial template. Microgel particles typically have diameters between one hundred nanometers and about 1 μm Saunders et al. (2009). Poly-NiPAm-based microgels are particularly appealing as building blocks of a colloidal template, because they are temperature sensitive: they undergo a volume phase transition at ≈ 32°C, corresponding to the polymer’s lower critical solution temperature (LCST). These microgels swell by about a factor of two in size when the temperature is decreased below
In the present work we report on synthesizing dry silica foam-like materials with structural colors that span the visible spectrum. Our approach begins by synthesizing microgel particles surrounded by inorganic silica nanoparticles. These composite particles are small enough that, when compressed, they become comparable in size to the wavelength of visible light. We take advantage of the microgels’ compressibility to produce disordered foam-like structures whose cells have flattened facets. After these are formed, we remove most of the organic polymer through calcination and obtain dry silica foams. We leave residues of carbonised polymer in the sample, which then act as light absorbers Demirörs et al. (2022). These foams exhibit vibrant structural colors. We show that the central resonant wavelength determining the color of the silica foams depends on the nanostructures’ characteristic length scale. In turn, this length scale is set by the size of the microgels, which allows us to target the color of the foam.
2 Results and discussion
2.1 Synthesis of silica-decorated microgels
We chose microgel colloids as the template for fabricating silica foams because of their softness, enabling the formation of flat walls between the cavities when the microgels are compressed. We synthesized thermoresponsive microgel particles with a shell composed of silica nanoparticles. The microgel particles are based on Poly-(N-isopropyl acrylamide) (PNiPAm) crosslinked with N,N’-methylenebis-(acrylamide) (BIS). A water-soluble initiator, Potassium PerSulphate (KPS), was used to initiate the reaction. We followed the semi-batch polymerization process described by Still et al. (2013), which results in microgel particles with a homogeneous crosslinking. The synthesis was divided into two parts. The initial part involved the growth of microgel particles that were uniformly crosslinked using NiPAm and BIS monomers. Subsequently, in the following part, we added a positively charged co-monomer, N-(3-aminopropyl)methacrylamide hydrochloride (APMA), and commercially available silica nanoparticles (LUDOX AS-40, ≈ 20 - 24 nm diameter, aqueous dispersion), Figure 1A. LUDOX AS-40 are negatively charged, with a zeta potential −47 mV measured on Litesizer (Anton Paar GmbH, Austria). The electrostatic interactions between the co-monomer and the silica nanoparticles allowed us to incorporate the silica into the microgel network. Our synthesis protocol follows the one described in our earlier work Bergman et al. (2022).
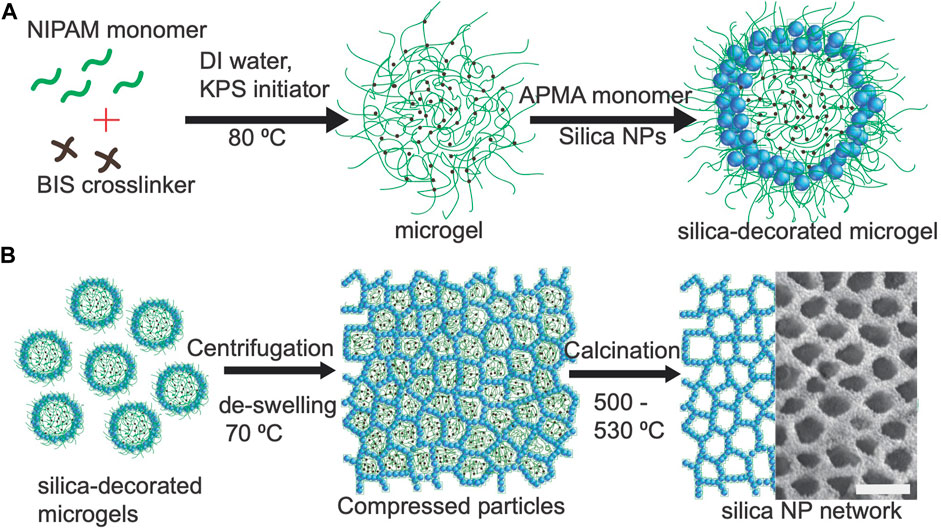
FIGURE 1. (A) Synthesis schematic showing the process of decorating microgel particles with silica. (B) Illustration of the fabrication of silica foams from silica-decorated microgel particles as suggested by Bergman et al. (2022) [adapted from Bergman et al. (2022) licensed CC-BY-NC]. The right half of the panel on the right shows an enlarged scanning electron microscope image of one of the resulting structures, where the individual silica nanoparticles can be distinguished. Scale bar: 0.5 μm.
We have synthesized silica-decorated microgel particles of various sizes. The mole ratios of NiPAm:BIS and APMA:NiPAm, as well as the monomer:silica mass ratios, are kept nearly constant in all the syntheses, as shown in Table 1, in order to maintain similar internal architecture in all the samples. This approach allows for the creation of particles with different hydrodynamic radii by adjusting the feeding time while maintaining the same monomer ratios.
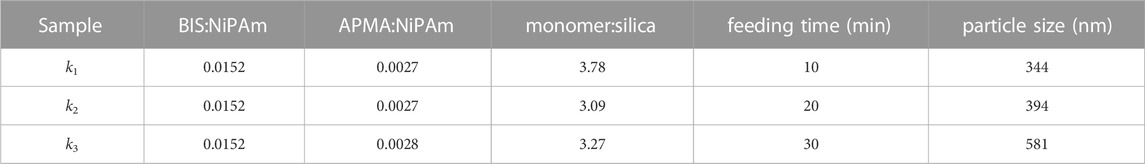
TABLE 1. Summary of the properties of the three different batches of microgel particles, encompassing the ratios of monomer moles, duration of feeding, and size of particles (hydrodynamic radius).
We present results for three different synthesis batches of silica-decorated microgel particles, named sample k1, k2, k3. The detailed syntheses are described in the Supplementary Material S1. We characterized the particle size in the swollen state by Static and Dynamic Light Scattering measurements (for details see Section 4.2). We find that the particles have average hydrodynamic radii of 344 ± 4 nm
2.2 Fabrication of solid foams
For the production of silica foams we proceeded as follows. First, a ∼0.5 mL suspension of silica microgel particles was centrifuged at room temperature for 15 min at 16,200 g and then the supernatant was carefully removed. The centrifugation process caused the particles to become densely packed and lightly compressed. The remaining residue was then placed in an oven at 70°C for 2 min, a temperature that exceeds the volume phase transition temperature of PNiPAm microgels. The microgels expelled water at this temperature, leading to particle shrinkage but also weak attraction and aggregation. The suspension was subsequently centrifuged again at 16,200 g for 5 min, and the supernatant was immediately removed. This second step compressed the shrunken particles even more. As they returned to room temperature they swelled, however constrained by the available water volume per particle. The result was a solid plug of gel, visible at the bottom of the Eppendorf tube, as illustrated in Supplementary Figure S2. In the process of compression and re-swelling, the microgel particles develop facets as shown in Figure 1B, which allows the silica shells around them to form cellular foams with faceted interfaces.
The compressed gel was calcined in a tubular oven, to remove the organic polymer and to obtain solid silica foams. When burnt at temperatures greater than 530°C, the organic phase is almost fully removed, and the remaining samples appear whitish due to multiple scattering of light Forster et al. (2010). Therefore, the temperature during calcination was adjusted in such a way that some amount of carbon remains inside the sample after calcination, with the aim to enhance broadband absorption and thus diminish multiple scattering. Samples k1, k2, k3 were calcined at 500°C–530°C (see experimental Section 4.1). After removal of the polymer we are left with solid silica foams that show color, Figure 2A. In the calcined samples we noticed some non-uniformity in the color, that could be explained by uneven compression during the centrifugation or heating of the particles, resulting in air pores of varying sizes. Another possible explanation is that the binding of silica nanoparticles may not be uniform for all microgel particles, leading to stratification and different silica filling fractions through the foam. We have not further explored the origins of these color variations and in the following we present our observations corresponding to the dominant colors in samples k1, k2, and k3, which are blue, green, and a mixture of pink and red color. The latter is represented by the RGB values (197, 136, 148), a hue referred to as “King’s cloak”. The colors of the samples shifted towards red when the hydrodynamic radius, RH, increased, as indicated above Figure 2A.
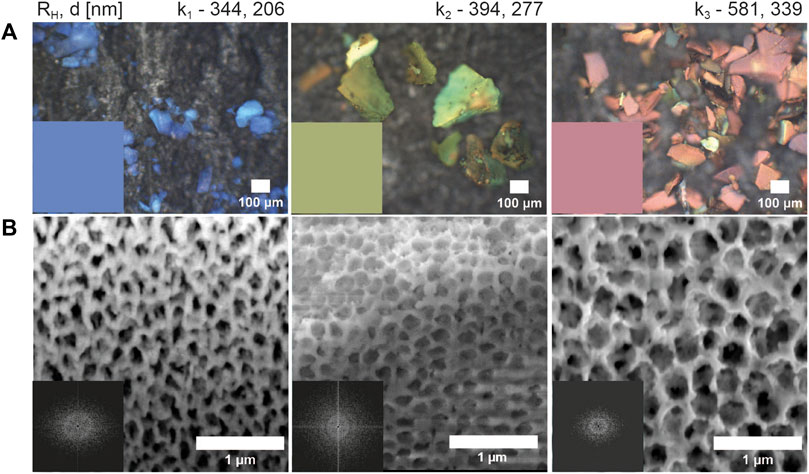
FIGURE 2. (A) Optical micrographs of structurally colored silica foams captured on a black sheet using reflection microscopy in bright field with a 10×/0.25 NA objective. The hydrodynamic radii (RH) of the templating particles in the swollen state and the correlation length (d) of the foam are indicated above the panel. The color of the foam shifts towards red with increasing RH. The insets in the lower left corner show the calculated color from the experimental reflection spectra. These colors agree well with the appearance of the samples. (B) Cross-sectional scanning electron micrographs of the foams shown in (A) reveal porous silica networks. The bright regions correspond to silica and the dark regions to air. The Fourier power spectra
We examined the internal nanoscale features of our samples with focused ion beam (FIB) milling and a scanning electron microscope (SEM, see experimental Section 4.4 for details). As shown in Figure 2B, the analysis revealed porous nanostructures. In the insets of Figure 2B, we plot the Fourier power spectrum of the cross-section micrographs versus the spatial frequency
2.3 Optical characterization
Before the removal of the polymer from the compressed silica-decorated microgel packing we observed a translucent gel that was not colored, as illustrated in Supplementary Figure S2E. While the refractive index contrast between the polymer (with n = 1.5) and the silica nanoparticles (with n = 1.475) was insufficient to produce colors prior, this changed after calcination. When the polymer was removed, the pores were filled with air (with n = 1), creating a refractive index contrast between air and silica that was sufficient to produce color as presented in Supplementary Figure S3. After calcination, no organic material was present in the sample except for some carbon residues.
We studied the optical properties of the colored samples through bright-field reflection microscopy and spectrometry, both in co-polarized and cross-polarized configurations, as detailed in the experimental Section 4.3 and shown in Figure 3. The co-polarized spectrum comprises of singly scattered and multiply scattered light, Figure 3A, while the crosspolarized spectrum contains only multiply scattered light, Figure 3B. By subtracting the cross-polarized spectrum from the co-polarized spectrum, we can isolate the features that are primarily due to single scattering, and which arise from constructive interference of light scattered from the nanostructures within our samples, Figure 3C (Noh et al., 2010; Hwang et al., 2020). We obtained spectra from five different areas on each sample and averaged them. We observe one distinct reflection peak for each sample, as depicted in Figures 3A, C. The peak wavelength red-shifts with the controlled increase in the correlation length d, Figure 3C. The values of the peak wavelengths are listed in Table 2. These observations confirm the structural origin of the color. We used the measured reflection spectra in Figure 3A to calculate the standard RGB colors, with standard illuminant D65 as the light source, in Matlab Guo (2023); CIE (2023). The calculated colors agree well with the colors we observe (Insets in Figure 2A).
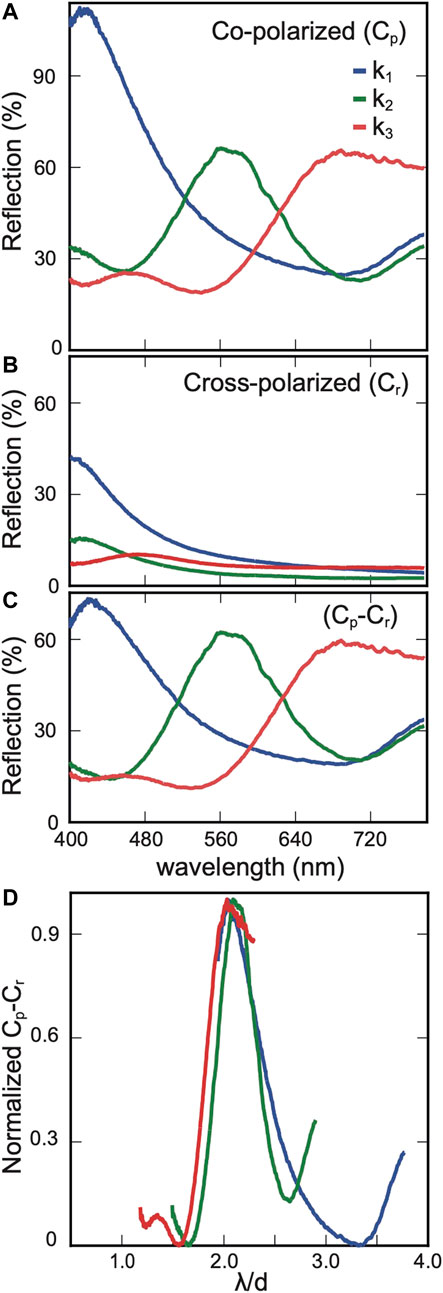
FIGURE 3. Reflection spectra of structurally colored foams captured in bright field microscopy using a 10x/0.25 NA objective. (A) Co-polarized reflection spectra. (B) Cross-polarized reflection spectra. (C) Reflection spectra approximating single scattering, obtained by calculating the difference between the co-polarized and cross-polarized reflection spectra. (D) Normalized single-scattering reflection spectra plotted against the ratio of wavelength (λ) to correlation length (d).
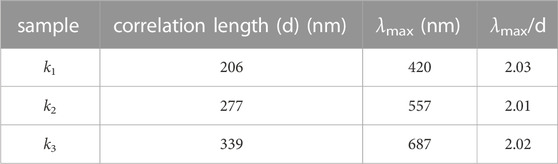
TABLE 2. Overview of the structural and spectral characteristics of the three samples. The structural correlation length, represented as d, was calculated by performing FFT analysis on SEM images and tomographic reconstructions. Each sample’s peak wavelength in reflection was determined from the spectra presented in Figure 3C. Furthermore, the peak wavelength normalized to d is also provided.
Previous studies have suggested that producing red structural color is difficult due to the occurrence of additional reflection peaks at shorter wavelengths. When creating blue structural color these peaks are in the ultraviolet range, invisible to the human eye, and they do not interfere with the perceived color of blue. In the case of red color, however, they can lead to the appearance of mixed colors. These shorter-wavelength peaks can arise from either single-particle resonances in direct structures (i.e., particle packings) Magkiriadou et al. (2014), or from structural correlations Jacucci et al. (2020). It has been suggested that better red hues can be obtained with inverted structures than direct structures. These findings were supported by theoretical Magkiriadou et al. (2014) and numerical analysis Jacucci et al. (2020). Later on, Kim et al. Kim et al. (2017) and Wang et al. Wang et al. (2022) experimentally demonstrated the advantage of inverse structures in achieving red hues. Consistent with the above, in our system of inverse structures with controlled deformation of the silica walls acquired by microgel templating, we observed only a gentle scattering peak in the blue spectral region for sample k3, as shown in Figures 3A, C clearly dominant reflection peak in the red. The peak intensity ratio of reflection peaks at 687 nm and 457 nm is ≈ 2.6 : 1, leading to a stronger contribution of red to structural color over the aforementioned works Xiao et al. (2015).
We studied the angular dependence of the scattering properties of these colored foams by capturing their scattering profiles in k-space, called scatterograms Stavenga et al. (2009). We illuminated the samples in wide-angle and collected scattered light with a ×50 objective. The resulting scattering angles range from 0° to 53.15°. In Figure 4 optical micrographs are shown in the left panel and the corresponding scatterograms in the right panel. These scatterograms exhibit uniform color across the angles, marked with circles, which shows the angle-independent nature of the color. This feature is consistent with the structural disorder observed in the 3D reconstructions (Supplementary Figure S4). And with the small-angle X-ray scattering (SAXS) analysis explained in Section 2.4.
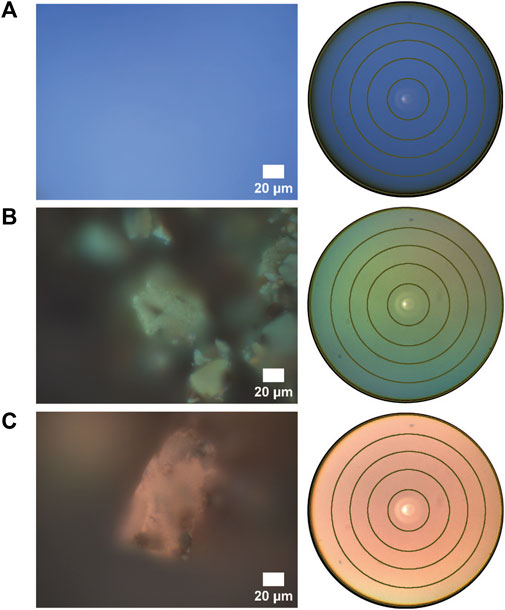
FIGURE 4. Left Panel: Optical micrographs captured in reflection mode under 50x/0.8 NA of (A) sample k1 (B) sample k2 (C) sample k3. Right Panel: Corresponding k-space images with wide-field illumination. The rings represent scattering angles of 10°, 20°, 30°, 40°, 53.15° (from inner to outer).
To better understand the structural colours of our samples and relate them to their nanostructure, we need to estimate their effective refractive index. This, in turn, requires estimating the refractive index of the silica walls, which are themselves a packing of silica nanoparticles in air. We assume random close packing of silica NPs, as the particles need temperatures as high as 1300°C to be fully sintered Hamzah et al. (2023), and moreover from our SEM images we can confirm that the particles remain distinct (Figure 1B, rightmost panel; Supplementary Figure S5). Assuming that the silica nanoparticles have a refractive index of 1.45 and are arranged in random close packing inside the walls at a volume fraction of 0.64, the Maxwell Garnett equation predicts an effective refractive index of 1.27 for the walls. From 3D reconstruction analysis, the volume fraction occupied by silica walls in the samples is approximately 0.45 (as explained in Section 4.6). Therefore, using again the Maxwell Garnett equation, the effective refractive index of the sample is calculated to be 1.12. For backscattering, the maximum reflection is at λmax = 4πneff/qmax, where neff is the effective refractive index of the material and qmax is the wavevector corresponding to the material’s characteristic lengthscale, given by the location of the structure factor peak. For a disordered dense packing of spheres, the structure factor peak is around qmax ≈ 2.2π/d Liu et al. (2000). Assuming a disordered packing of air spheres in the silica matrix for our case, we can use the above expressions with neff ≈ 1.12, and we obtain λmax/d ≈ 2.03. To compare this to our data, we normalize the reflectance data for single scattering (Cp - Cr in Figure 3C) and plot it against λ/d in Figure 3D. This data indicates an approximate ratio of λmax/d listed in Table 2, which is similar to the λmax/d value calculated above assuming a dense packing of air spheres in a porous silica matrix.
2.4 Structural analysis
To examine the structure and correlations of silica foams, we utilized a 3D reconstruction technique (outlined in Section 4.6) on pre-calcined samples. Figure 5A presents an example of such tomography reconstruction of sample k1 that was derived from focused ion beam milling and scanning electron microscopy sequences Groeber et al. (2006); Supplementary Figures S4B, S4C present the reconstruction of samples k2 and k3 respectively. The filling fractions (volume occupied by silica walls) for samples k1, k2 and k3 are 45%, 46% and 46% respectively, determined from tomographic reconstruction. From the 3D reconstructions we also calculated and analyzed the Fourier power spectra,
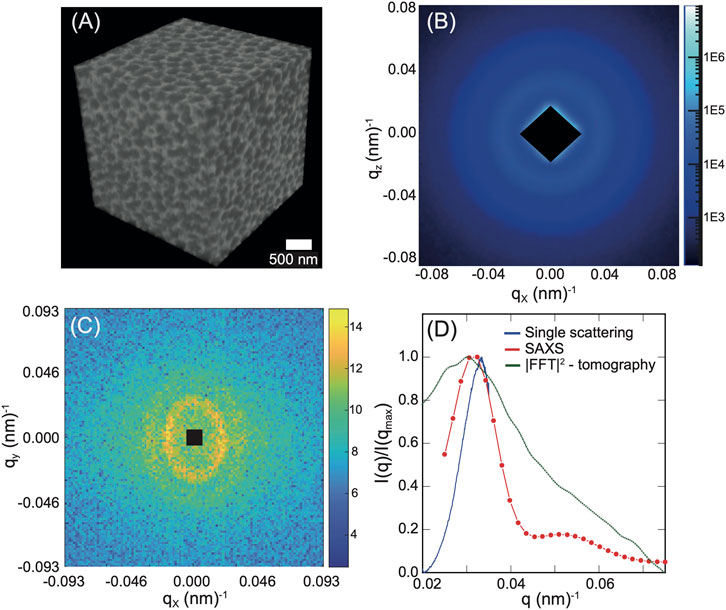
FIGURE 5. Structural analysis of pre-calcined foam monoliths. Panel (A) shows the three-dimensional tomographic reconstructions obtained from focused ion beam milling and scanning electron microscopy of sample k1 with cube dimensions of 2.7 × 2.7 × 2.7 μm3. (B) SAXS pattern from sample k1. Intensity bar in arbitrary units. (C) Modulus squared of a fast Fourier transform (FFT) spectrum presented on a logarithmic scale. This spectrum was derived from a 3D tomographic reconstruction of sample k1 by taking an xy cross-section. Color bar in arbitrary units. (D) The normalized and azimuthally averaged version of the same data set (green dotted line) compared to the reflectance spectrum of single scattering of k1 converted to q − space (blue line), and the azimuthally averaged SAXS pattern for the same sample (red line, circles). All curves were divided by their peak value I(qmax).
We performed 3D FFT on the reconstructions of pre-calcined samples to calculate the correlation length (d), listed in Table 2. We also examined one cross-section in the xy, yz, xz planes of k1 and k3 from the generated 3D FFTs. The correlation lengths calculated from the FFT in the xy, yz, xz planes of k1 and k3 are comparable in all planes, as shown in Supplementary Figures S6D, S7D (FFT spectra of the respective planes are included in the Supplementary Figures S6, S7). Although the correlation lengths are similar, the ring in the FFT spectra appears elongated for samples k1 and k3 (Supplementary Figures S6, S7). This might be an artifact in reconstructions which we have not analysed further.
To provide additional information about the structure of the samples, we utilized small angle X-ray scattering (SAXS) on calcined sample k1. The results of this analysis are presented in Figure 5B, which displays concentric rings of uniform intensity in the scattering pattern. These rings suggest that the structure of the sample is not crystalline but has short-range order, as no Bragg peaks are visible. Notably, the SAXS pattern in Figure 5B bears a resemblance to the FFT spectrum (in the xy plane) obtained from the 3D reconstruction of k1, as depicted in Figure 5C. The azimuthal average of the SAXS pattern, the azimuthal average of the FFT spectrum and the normalised single-scattering reflection spectrum of k1 (Figure 3C), converted to reciprocal or q-space, are plotted together in Figure 5D. In these plots, it can be seen that the first peak occurs at q = 0.03048 nm−1 from the 3D reconstruction, q = 0.03241 nm−1 from the SAXS analysis and q = 0.03346 nm−1 from the reflectance measurements. All these values agree well and correspond to correlation length scales of 206 nm, 193 nm, and 181.5 nm, respectively. This allows us to conclude that the structural colors originate from constructive interference.
In photonic foam materials or phoamtonics Klatt et al. (2019), the opening of the photonic band gap is found in open-cell structures or networks Ricouvier et al. (2019); Klatt et al. (2019); Bergman et al. (2022). Although both open and closed-cell foams should exhibit structural color, the distinct cell topologies observed in our study are still worth discussing. To provide additional clarity regarding the inherent structure of our silica foams, we focus on a specific region within the three-dimensional rendered images of k1 and k3. In k1 (Figures 6A, B), we see that the foams have closed cells, except for a small region (Figure 6A, circled in green) where there is an opening in the cell. In k3 (Figures 6C, D), it is interesting to note that the foams have larger openings in the cell compared to k1 (Figure 6C, circled in green). In Figures 6B, D, the circled areas in red highlight the walls of the cell foams. k1 has smaller pores compared to k3 and the cell openings are narrower than in k3.
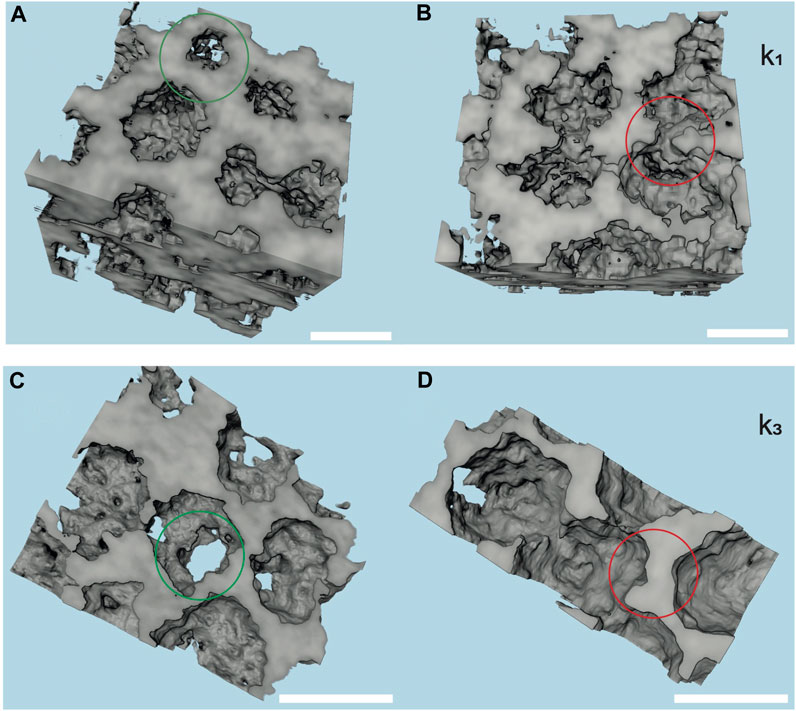
FIGURE 6. Close-up view of 3D tomographic reconstructions. (A,B) Sample k1. The green circle indicates cell opening and the red circle highlights closed cells. (C,D) show the same for sample k3. Scale bars for (A,B) are 250 nm, and for (C,D) are 500 nm.
The synthesis of the silica-decorated microgel particles can explain this. k1 has a hydrodynamic radius of 344 nm, and the silica shell is thicker in relation to the microgel core. In comparison, k3 has a hydrodynamic radius of 581 nm and the silica nanoparticles are distributed over a larger surface area, resulting in a comparably thinner shell. The openings in the cell may then be caused by an inhomogeneous distribution of silica on the microgel particles or by stresses during drying and calcination. Therefore, it is possible that our foams have (partially) open cell structures. By controlling the silica content, we can possibly adapt foams to have either open-cell or closed-cell structures. A systematic analysis of how to control the cell topology is beyond the scope of the present work.
3 Summary and conclusion
In summary, this study demonstrates how microgel colloidal templating can be used to assemble silica nanoparticles in foam-like structures with structural color. We obtain pure silica dry foams by calcining the silica-decorated microgel polymer, and removing water and the polymer. The structural colors of the samples are vivid. The primary color can be adjusted by controlling the size and degree of compression of the microgel particles. This work demonstrates the feasibility of self-assembling foams at length scales comparable to visible wavelengths.
Previous work has shown that silicon dioxide can be reduced to pure silicon by a magnesiothermic reaction, potentially increasing the refractive index from 1.45 to 3.6 Ibisate et al. (2009). The implementation of this approach in developing silicon foam structures has the potential to facilitate the development of photonic foam materials that possess a photonic band gap. This possibility has been demonstrated through numerical analysis conducted by Bergman et al. (2022), for a near-infrared silicon refractive index contrast of 3.6. Furthermore, the silica nanoparticles used in this study are building blocks of foam structures and can be exchanged for any other type of nanoparticle with different functions. This possibility suggests that our method can be used as a general and simple way to obtain mesoscale foam structures of many materials, from high refractive index to magnetic or plasmonic nanoparticles.
4 Experimental section
4.1 Sample preparation
An Eppendorf tube containing 1 mL of the microgel colloids (2–5 wt%) was centrifuged at 16,200 g at room temperature for 15 min and subsequently the supernatant was removed. The sample was then placed in an oven at 70°C for 2 min to induce the microgel deswelling. The sample was immediately centrifuged (16,200 g for 5 min) at room temperature and the supernatant was removed again. The resulting monolith (non-calcined samples) was glued on an aluminium stub with conducting silver paste and left to dry in the oven at 70°C for electron microscopy analysis. The monoliths were calcined in an open tubular oven to remove the microgel template from the networks. The samples were heated to 500°C–530°C (ramp—100°C/hour) and left for 7 h, followed by cooling to 40°C (150 °C/hour) Silencieux et al. (2015).
4.2 Light scattering analysis
A glass vial with a dilute suspension of 10 μL stock solution plus 500 μL de-ionized water was placed inside a 3D—DLS light scattering spectrometer (LS Instruments, Switzerland) operating at a laser wavelength of 660 nm Block and Scheffold (2010). The scattered intensity was collected at angles 15°–135° with step size 3°–5°. Measurements were preformed in 3D—modulated cross correlation mode which suppresses multiple scattering if present. Three measurements were obtained at each angle with a duration of 60 s or 120 s. The hydrodynamic radius was calculated via a standard first cumulant fit on the auto-correlation functions.
4.3 Spectral measurements
To characterize the reflection spectra of the samples, the measurements were performed using a Zeiss Axio Scope. A1 light microscope (Carl Zeiss AG, Oberkochen, Germany) outfitted with a CCD camera (GS3-U3-28S5C-C, FLIR Integrated Imaging Solutions Inc., Richmond, Canada). The calcined samples were analyzed in bright field with a halogen white lamp (Zeiss HAL100) using a Zeiss, EC Epiplan-Neofluar 10X, NA = 0.25 objective, capturing spectra (400 nm–800 nm) from the point of interest. The reflected light was collected by an optical fiber (Ocean Optics QP230-2-XSR, 230 μm core) with a spot size of 25 μm at a magnification of ×10. The collected light was analyzed with an Ocean Optics Maya2000 Pro spectrometer (Ocean Optics, Dunedin, FL, United States). The reflectance spectra were normalized with respect to a white Spectralon diffuse reflectance standard (Labsphere). The spectra were obtained in Oceanview software. The optical micrographs and the scatterograms were captured with the CCD camera; for the micrographs the samples were placed on a black background. For the polarization measurements, one polarizer was placed in front of the light source that illuminates the sample, and another polarizer in the direction of backscattered light.
4.4 Electron microscopy and tomography
The dried-out monolith or calcined sample was sputter-coated with platinum to minimize charging and imaged in a Scios 2 Focused Ion Beam SEM, ThermoFisher. To access the interior network for SEM imaging, the region of interest was chosen and cross-sectioned using a focused ion beam (FIB). A focused beam of gallium ions (voltage 30 kV, current 0.3–0.5 nA) was chosen to mill the region of interest perpendicularly to the surface of the sample. Cross-sectional images were acquired using an electron beam (voltage 5 kV, current 0.2–0.4 nA) under OptiTilt mode with different detectors.
Tomography of the pre-calcined samples was performed using FIB-SEM. The region of interest (ROI) was coated with Pt using built-in Pt deposition induced by ion beam, so that the ROI was not destroyed during tomography. A rough cut was milled in front of the ROI to expose the imaging plane and trenches were milled on the sides to provide a deposition site for the milled material and prevent re-deposition on the exposed section. A fiducial marker was created near the ROI, to monitor drift. The tomography was performed in Auto Slice and View Software (4.2). Slices of 10 nm or 15 nm thickness were milled with a Galium ion beam set at 30 kV acceleration voltage and 0.3 nA beam current. Images were captured after each slice in the OptiTilt configuration using the built-in SEM Everhart-Thornley (ETD, secondary electrons) and T1 detector (back-scattered electrons) set to a voltage of 5 kV and current of 0.2–0.4 nA.
4.5 Small angle X-ray scattering (SAXS) analysis
SAXS X-ray scattering measurements were performed on calcined samples with a Xeuss 3.0 UHR SAXS system (Xenocs SAS, Grenoble, France) equipped with a GeniX 3D Cu Kalpha radiation source (λ ≈ 1.54 Å) and a Q-Xoom in-vacuum motorized Eiger2 R 1 M detector (Dectris Ltd., Switzerland) for data collection. The reduction of 2D data into 1D plots of the scattering intensities, I (q), was performed automatically using the Xenocs XSACT software. The scattering vector q was calculated using the relation q = 4π sin θ/λ where θ is half the scattering angle.
4.6 3D reconstruction and image analysis
Image processing was done in Fiji ImageJ Schneider et al. (2012) and Matlab 2021a (MathWorks Inc., United States) MATLAB (2010). The raw image stack was drift-corrected using the Fiji StackReg plug-in Jain and Healey (1998). The stack was analysed using image analysis scripts in Matlab. The images were resized in the y direction to compensate for the image distortion induced by the acquisition at a 52° angle between the sample and the SEM column. The drift was removed again by calculating the correlation between consecutive slices. Later, the images were resized in the x and y directions as in the z direction, so as to have a cubic voxel. The 3D reconstruction was converted into a 3D matrix. n-dimensional fast Fourier transform (fftn) with absolute squared intensities in log scale was applied separately to these 3D matrices to generate the 3D FFT of the images. The structural correlation lengths were calculated for xy, yz and xz planes on one cross-section picked from the centre of the matrix. The 2D FFTs in all planes were azimuthally averaged to obtain the structural correlation length. For the filling fraction calculation, the images were binarized using adaptive thresholding.
Data availability statement
The datasets generated and analyzed in this study have been uploaded to the Zenodo repository and are available at https://doi.org/10.5281/zenodo.8092541.
Author contributions
KM performed most of the experiments and data analysis, including synthesis, SEM, FIB-SEM tomography, optical characterisation of the materials, and light scattering of the particles. PY contributed to the optical characterization and provided the code for image analysis; KM performed the analysis. AD performed the SAXS measurements. SM contributed to the analysis and interpretation of the data. FS designed and supervised the study. KM wrote the manuscript with contributions from all authors. All authors contributed to the article and approved the submitted version.
Funding
This research was supported by the Swiss National Science Foundation through the National Centre of Competence in Research Bio-Inspired Materials (No. 205603) and through projects No. 188494 and No. 169074.
Acknowledgments
The authors are grateful to Dimitri Vanhecke (Adolphe Merkle Institute-University of Fribourg) for his help with the FIB/SEM tomography, Thomas Weber (ETH Zurich, Department of Materials) for his assistance with the SAXS measurements and Viola Bauernfeind (Adolphe Merkle Institute-University of Fribourg) for her help with k-space analysis.
Conflict of interest
The authors declare that the research was conducted in the absence of any commercial or financial relationships that could be construed as a potential conflict of interest.
Publisher’s note
All claims expressed in this article are solely those of the authors and do not necessarily represent those of their affiliated organizations, or those of the publisher, the editors and the reviewers. Any product that may be evaluated in this article, or claim that may be made by its manufacturer, is not guaranteed or endorsed by the publisher.
Supplementary material
The Supplementary Material for this article can be found online at: https://www.frontiersin.org/articles/10.3389/frsfm.2023.1224158/full#supplementary-material
References
Banhart, J. (2001). Manufacture, characterisation and application of cellular metals and metal foams. Prog. Mater. Sci. 46, 559–632. doi:10.1016/S0079-6425(00)00002-5
Bergman, M. J., García-Astrain, C., Fuchs, N., Manne, K., Yazhgur, P., Froufe-Pérez, L. S., et al. (2022). Macroporous silica foams fabricated via soft colloid templating. Small Methods 6, 2101491. doi:10.1002/smtd.202101491
Block, I. D., and Scheffold, F. (2010). Modulated 3d cross-correlation light scattering: improving turbid sample characterization. Rev. Sci. Instrum. 81, 123107. doi:10.1063/1.3518961
Chan, C. L. C., Lei, I. M., van de Kerkhof, G. T., Parker, R. M., Richards, K. D., Evans, R. C., et al. (2022). 3d printing of liquid crystalline hydroxypropyl cellulose—Toward tunable and sustainable volumetric photonic structures. Adv. Funct. Mater. 32, 2108566. doi:10.1002/adfm.202108566
CIE (2023). CIE standard illuminant D65. http://cie.co.at/datatable/cie-standard-illuminant-d65.
Conley, G. M., Aebischer, P., Nöjd, S., Schurtenberger, P., and Scheffold, F. (2017). Jamming and overpacking fuzzy microgels: deformation, interpenetration, and compression. Sci. Adv. 3, e1700969. doi:10.1126/sciadv.1700969
Conley, G. M., Zhang, C., Aebischer, P., Harden, J. L., and Scheffold, F. (2019). Relationship between rheology and structure of interpenetrating, deforming and compressing microgels. Nat. Commun. 10, 2436–2438. doi:10.1038/s41467-019-10181-5
Członka, S., Sienkiewicz, N., Kairytė, A., and Vaitkus, S. (2019). Colored polyurethane foams with enhanced mechanical and thermal properties. Polym. Test. 78, 105986. doi:10.1016/j.polymertesting.2019.105986
Demirörs, A. F., Poloni, E., Chiesa, M., Bargardi, F. L., Binelli, M. R., Woigk, W., et al. (2022). Three-dimensional printing of photonic colloidal glasses into objects with isotropic structural color. Nat. Commun. 13, 4397. doi:10.1038/s41467-022-32060-2
Du, Z., Yao, D., Xia, Y., Zuo, K., Yin, J., Liang, H., et al. (2020). Highly porous silica foams prepared via direct foaming with mixed surfactants and their sound absorption characteristics. Ceram. Int. 46, 12942–12947. doi:10.1016/j.ceramint.2020.02.063
Forster, J. D., Noh, H., Liew, S. F., Saranathan, V., Schreck, C. F., Yang, L., et al. (2010). Biomimetic isotropic nanostructures for structural coloration. Adv. Mater. 22, 2939–2944. doi:10.1002/adma.200903693
Galisteo-López, J. F., Ibisate, M., Sapienza, R., Froufe-Pérez, L. S., Blanco, Á., and López, C. (2011). Self-assembled photonic structures. Adv. Mater. 23, 30–69. doi:10.1002/adma.201000356
Groeber, M., Haley, B., Uchic, M., Dimiduk, D., and Ghosh, S. (2006). 3D reconstruction and characterization of polycrystalline microstructures using a FIB–SEM system. Mater. Charact. 57, 259–273. doi:10.1016/j.matchar.2006.01.019
Guo, T. (2023). Color calculation from spectrum. https://www.mathworks.com/matlabcentral/fileexchange/98289-convert-spectrum- to-color.
Hamzah, M. S., Wildan, M. W., Kusmono , , and Suharyadi, E. (2023). Effect of sintering temperature on physical, mechanical, and electrical properties of nano silica particles synthesized from Indonesia local sand for piezoelectric application. J. Asian Ceram. Soc. 11 (1), 178–187. doi:10.1080/21870764.2023.2173851
Højlund-Nielsen, E., Weirich, J., Nørregaard, J., Garnaes, J., Asger Mortensen, N., and Kristensen, A. (2014). Angle-independent structural colors of silicon. J. Nanophot. 8, 083988. doi:10.1117/1.jnp.8.083988
Hwang, V., Stephenson, A. B., Magkiriadou, S., Park, J. G., and Manoharan, V. N. (2020). Effects of multiple scattering on angle-independent structural color in disordered colloidal materials. Phys. Rev. E 101, 012614. doi:10.1103/PhysRevE.101.012614
Ibisate, M., Golmayo, D., and López, C. (2009). Silicon direct opals. Adv. Mater. 21, 2899–2902. doi:10.1002/adma.200900188
Jacucci, G., Vignolini, S., and Schertel, L. (2020). The limitations of extending nature’s color palette in correlated, disordered systems. Proc. Natl. Acad. Sci. U. S. A. 117, 23345–23349. doi:10.1073/pnas.2010486117
Jain, A., and Healey, G. (1998). A multiscale representation including opponent color features for texture recognition. IEEE Trans. Image Process. 7, 124–128. doi:10.1109/83.650858
Kawamura, A., Kohri, M., Morimoto, G., Nannichi, Y., Taniguchi, T., and Kishikawa, K. (2016). Full-color biomimetic photonic materials with iridescent and non-iridescent structural colors. Sci. Rep. 6, 33984–34010. doi:10.1038/srep33984
Kim, S.-H., Magkiriadou, S., Rhee, D. K., Lee, D. S., Yoo, P. J., Manoharan, V. N., et al. (2017). Inverse photonic glasses by packing bidisperse hollow microspheres with uniform cores. ACS Appl. Mater. Interfaces 9, 24155–24160. doi:10.1021/acsami.7b02098
Kim, S., Barraza, H., and Velev, O. D. (2009). Intense and selective coloration of foams stabilized with functionalized particles. J. Mater. Chem. 19, 7043–7049. doi:10.1039/b908054f
Klatt, M. A., Steinhardt, P. J., and Torquato, S. (2019). Phoamtonic designs yield sizeable 3D photonic band gaps. Proc. Natl. Acad. Sci. U. S. A. 116, 23480–23486. doi:10.1073/pnas.1912730116
Li, F., Fen, W., Hongjie, L., and Boxin, Q. (2023). Review of recent advancements in the biomimicry of structural colors. Dyes Pigments 210, 111019. doi:10.1016/j.dyepig.2022.111019
Liu, J., Schöpe, H.-J., and Palberg, T. (2000). An improved empirical relation to determine the particle number density of fluid-like ordered charge-stabilized suspensions. Part. Part. Syst. Charact. 17, 206–212. doi:10.1002/1521-4117(200012)17:5/6<206:aid-ppsc206>3.0.co;2-c
Liu, Y. M., Feng, W. L., Li, T. C., He, H. Y., Dai, W. L., Huang, W., et al. (2006). Structure and catalytic properties of vanadium oxide supported on mesocellulous silica foams (MCF) for the oxidative dehydrogenation of propane to propylene. J. Catal. 239, 125–136. doi:10.1016/j.jcat.2005.12.028
Luc, S., Guilhem, M., Mathieu, S., Ariane, M., Rémy, D., and Jean-Jacques, B. (2014). Processing and structures of solids foams. Comptes Rendus Phys. 15, 662–673. doi:10.1016/j.crhy.2014.10.006
Magkiriadou, S., Park, J. G., Kim, Y. S., and Manoharan, V. N. (2014). Absence of red structural color in photonic glasses, bird feathers, and certain beetles. Phys. Rev. E - Stat. Nonlinear, Soft Matter Phys. 90, 062302–062308. doi:10.1103/PhysRevE.90.062302
Maimouni, I., Morvaridi, M., Russo, M., Lui, G., Morozov, K., Cossy, J., et al. (2020). Micrometric monodisperse solid foams as complete photonic bandgap materials. ACS Appl. Mater. Interfaces 12, 32061–32068. doi:10.1021/acsami.0c04031
Noh, H., Liew, S. F., Saranathan, V., Prum, R. O., Mochrie, S. G. J., Dufresne, E. R., et al. (2010). Contribution of double scattering to structural coloration in quasiordered nanostructures of bird feathers. Phys. Rev. E 81, 051923. doi:10.1103/PhysRevE.81.051923
Prum, R. O., and Torres, R. H. (2003). A fourier tool for the analysis of coherent light scattering by bio-optical nanostructures. Integr. Comp. Biol. 43, 591–602. doi:10.1093/icb/43.4.591
Prum, R., Torres, R., Williamson, S., and Dyck, J. (1998). Coherent light scattering by blue feather barbs. Nature 396, 28–29. doi:10.1038/23838
Ricouvier, J., Tabeling, P., and Yazhgur, P. (2019). Foam as a self-assembling amorphous photonic band gap material. Proc. Natl. Acad. Sci. U. S. A. 116, 9202–9207. doi:10.1073/pnas.1820526116
Rojas-Ochoa, L. F., Mendez-Alcaraz, J., Sáenz, J., Schurtenberger, P., and Scheffold, F. (2004). Photonic properties of strongly correlated colloidal liquids. Phys. Rev. Lett. 93, 073903. doi:10.1103/physrevlett.93.073903
Saunders, B. R., Laajam, N., Daly, E., Teow, S., Hu, X., and Stepto, R. (2009). Microgels: from responsive polymer colloids to biomaterials. Adv. colloid interface Sci. 147, 251–262. doi:10.1016/j.cis.2008.08.008
Schneider, C., Rasband, W., and Eliceiri, K. (2012). Nih image to imagej: 25 years of image analysis. Nat. Methods 9, 671–675. doi:10.1038/nmeth.2089
Silencieux, F., Bouchoucha, M., Mercier, O., Turgeon, S., Chevallier, P., Kleitz, F., et al. (2015). Mesoporous silica nanoparticles under sintering conditions: A quantitative study. Langmuir 31, 13011–13021. doi:10.1021/acs.langmuir.5b02961
Stavenga, D., Leertouwer, H., Pirih, P., and Wehling, M. (2009). Imaging scatterometry of butterfly wing scales. Opt. Express 17, 193–202. doi:10.1364/OE.17.000193
Stieger, M., Richtering, W., Pedersen, J. S., and Lindner, P. (2004). Small-angle neutron scattering study of structural changes in temperature sensitive microgel colloids. J. Chem. Phys. 120, 6197–6206. doi:10.1063/1.1665752
Still, T., Chen, K., Alsayed, A. M., Aptowicz, K. B., and Yodh, A. (2013). Synthesis of micrometer-size poly (n-isopropylacrylamide) microgel particles with homogeneous crosslinker density and diameter control. J. colloid interface Sci. 405, 96–102. doi:10.1016/j.jcis.2013.05.042
Wang, Z., Chan, C. L. C., Haataja, J. S., Schertel, L., Li, R., van de Kerkhof, G. T., et al. (2022). Deconvoluting the optical response of biocompatible photonic pigments. Angew. Chem. - Int. Ed. 61, e202206562. doi:10.1002/anie.202206562
Xiao, M., Li, Y., Allen, M. C., Deheyn, D. D., Yue, X., Zhao, J., et al. (2015). Bio-inspired structural colors produced via self-assembly of synthetic melanin nanoparticles. ACS Nano 9, 5454–5460. doi:10.1021/acsnano.5b01298
Yan, X., Zhang, L., Zhang, Y., Qiao, K., Yan, Z., and Komarneni, S. (2011). Amine-modified mesocellular silica foams for CO2 capture. Chem. Eng. J. 168, 918–924. doi:10.1016/j.cej.2011.01.066
Yazhgur, P., Muller, N., and Scheffold, F. (2022). Inkjet printing of structurally colored self-assembled colloidal aggregates. ACS Photonics 9, 2809–2816. doi:10.1021/acsphotonics.2c00627
Yu, C., Nannan, W., Oluwafunmilola, O., Yongde, X., and Yanqiu, Z. (2021). Porous ceramics: light in weight but heavy in energy and environment technologies. Mater. Sci. Eng. R Rep. 143, 100589. doi:10.1016/j.mser.2020.100589
Keywords: microgels, structural color, light scattering (LS), FIB tomography, photonic crystals (PC), self-assembly phenomena, colloids
Citation: Manne K, Magkiriadou S, Yazhgur P, Demirörs AF and Scheffold F (2023) Structurally colored silica foams using colloidal templating. Front. Soft Matter 3:1224158. doi: 10.3389/frsfm.2023.1224158
Received: 17 May 2023; Accepted: 04 July 2023;
Published: 13 September 2023.
Edited by:
Pei-Xi Wang, Chinese Academy of Sciences (CAS), ChinaReviewed by:
Yuanyuan Cao, East China University of Science and Technology, ChinaGuang Chu, Southeast University, China
Yi-Tao Xu, University of British Columbia, Canada
Copyright © 2023 Manne, Magkiriadou, Yazhgur, Demirörs and Scheffold. This is an open-access article distributed under the terms of the Creative Commons Attribution License (CC BY). The use, distribution or reproduction in other forums is permitted, provided the original author(s) and the copyright owner(s) are credited and that the original publication in this journal is cited, in accordance with accepted academic practice. No use, distribution or reproduction is permitted which does not comply with these terms.
*Correspondence: Frank Scheffold, ZnJhbmsuc2NoZWZmb2xkQHVuaWZyLmNo