 Huong T. Trinh1,2*†
 Burra D. Dhar1*†
 Michel Simioni3
 Stef de Haan4†
 Tuyen Thi Thanh Huynh1
 Tung V. Huynh5
 Andrew D. Jones6
- 1Alliance Bioversity International and CIAT, Asia Hub, Hanoi, Vietnam
- 2Department of Mathematics and Statistics, Thuongmai University, Hanoi, Vietnam
- 3INRAE, MOISA, University of Montpellier, Montpellier, France
- 4International Potato Center, Lima, Peru
- 5Can Tho Socio-Economic Institute, Can Tho, Vietnam
- 6School of Public Health, University of Michigan, Ann Arbor, MI, United States
Food environments in Southeast Asia's emerging economies are rapidly evolving, alongside fast-paced socioeconomic and demographic changes. The widespread expansion of supermarkets and parallel restructuring of traditional markets in Vietnam are likely to impact patterns of household food acquisition. Using provincial-level time series data on the abundance of supermarkets and multiyear household survey data, this paper examines the impact of the differential country-wide presence of supermarkets with indices of food quality and quantity acquired by households. We classified provinces into three clusters based on the number of supermarkets: high (HighSM), medium (MedSM), and low (LowSM). We found that a higher number of supermarkets associated with the exceedable Vietnamese recommendation composition of macronutrients at the household-level, but not food quantity. Households with higher per capita food expenditure in HighSM provinces tended to procure foods with higher protein content and lower shares of fat and carbohydrate as compared to similar households in the others provinces. Ethnic minority households in MedSM clusters obtained food with lower carbohydrate and higher fat:protein ratios in comparison to ethnic majority households. Additionally, larger-sized households in HighSM provinces typically bought foods with higher fat shares than smaller-sized households. In contrast, in MedSM and LowSM provinces, larger-sized households typically procured foods with higher protein and lower fat shares. The diversity of foods obtained by households in MedSM and LowSM provinces decreased over time. Within the Midlands and Northern Mountains Area we observed a decrease in the diversity of food acquired among households in the LowSM clusters. This study elucidates potential impacts of the supermarket expansion on household food baskets. Insights from this study can be used to provide evidences for policy recommendation and to design and target interventions aimed at strengthening food environments to address the challenge of the double burden of malnutrition in the country.
Introduction
There has been an ongoing evolution in food retail in both developed and developing countries for the past century. This evolution is characterized by the transition from local traditional stores to supermarkets and e-commerce platforms. The rapid spread of supermarkets has transformed food environments in several countries, including Vietnam (Reardon and Timmer, 2007; Reardon et al., 2012; Lu and Reardon, 2018). Furthermore, supermarkets have influenced the traditional relationships between household socioeconomic status, population demographics, and food acquisition and consumption patterns (Popkin and Gordon-Larsen, 2004; Chandon and Wansink, 2012; Rischke et al., 2015; HLPE, 2017).
The Doi Moi reforms in Vietnam, launched in the late 1980's and early 1990's, enabled Vietnam to achieve impressive economic growth (Barker and Üngör, 2019). This growth has been associated with the introduction and expansion of supermarkets, supported by increased foreign direct investments in the food retail sector (Reardon et al., 2012). Local, traditional traders, often linked to informal markets still predominate in Vietnam though (Vo and Smith, 2017; Umberger et al., 2018). Therefore, the complex food environment in Vietnam is characterized by the coexistence of an expanding supermarket sector, and a large presence of traditional markets. Sales from modern retail food markets (that include supermarkets, shopping malls and markets) more than doubled between 2011 and 2018 from 30.9 to 70.9 trillion VND. This steep increase in sales has been associated with an increase in the number of modern supermarkets nationally from 897 in 2012 to 3,272 in 2017 (Vo and Francic, 2018).
There are multiple trade-offs resulting from this increase in supermarkets. For instance, supermarkets offer the opportunity to enhance food safety. Food-borne diseases and food poisoning are a concern in Vietnam (Nguyen-Viet et al., 2017), and local authorities are currently promoting policies that provide improved support for the establishment and spread of supermarkets, and various traceability solutions to ensure delivery and sale of safe food (Government of Vietnam, 2017). In contrast, the expansion of supermarkets has also led to increased availability of readymade and processed foods that do not likely contribute to healthy diets (Asfaw, 2008; Hawkes, 2008; Zhou et al., 2015). While the effects of supermarket expansion in Vietnam on crop value chains, farmer incomes, and food quality have been evaluated (Cadilhon et al., 2006; Maruyama and Trung, 2010; Moustier et al., 2010; Viet Nam National Institute of Nutrition, 2013; Umberger et al., 2018; Raneri et al., 2019), quantitative evidence on the associations of supermarkets on household-level food acquisition patterns is sparse. One reason for this limited evidence is the lack of data: (1) with satisfactory spatial and temporal resolutions; (2) that measures the intended outcome (e.g., food consumption rather than food purchase data); (3) collected in a consistent, integrated, and open manner (Dharani et al., 2018; Raneri et al., 2019).
This paper examines the associations of supermarkets in Vietnam with household socioeconomic and demographic characteristics, and household food acquisition patterns across years and provinces. Existing administrative data have been used in the past to investigate transitions in patterns of food groups acquired among Vietnamese households (Hoang, 2009; Mishra and Ray, 2009), however, these have not yet been described in the context of the expansion of supermarkets, across both time and geographies. To our knowledge, this is the first comprehensive attempt to elucidate this link at the national level. With this study, we seek to inform the development of national- and provincial-level policies in Vietnam aimed at modernizing food markets, and strengthening food environments for the advancement of healthy diets.
Methodology
Data Analysis Strategy
This study uses two data sources from the General Statistics Office (GSO) of Vietnam: (1) annual data 2010–2014 from Trade and Service Statistics Department on the number of supermarkets1 in 63 Vietnamese provinces from 2010 to 2014; (2) data on household socioeconomic status and food acquisition behaviors from the Vietnam Household Living Standard Survey2 (VHLSS) for 2010, 2012, and 2014 from the Social and Environmental Statistics Department. Although the data used in the study were collected by different government institutions using different methods, a data analysis strategy (Figure 1) was designed that enabled interoperability, and facilitated integrated analysis of the two data sets.
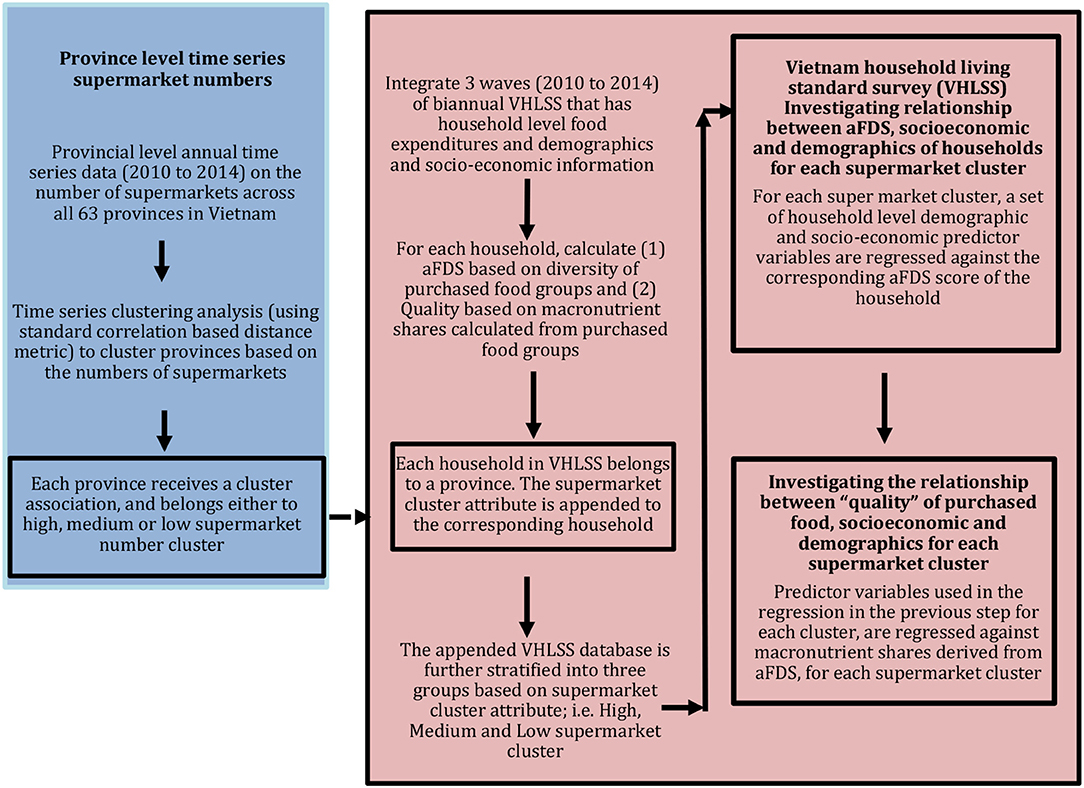
Figure 1. A data analysis strategy that facilitates interoperability of two independent data sets was implemented, which are the province level time series data on supermarket numbers (in the blue colored box), and the Vietnam household living standard survey (in orange colored box). The blue box represents steps taken for time series clustering and statistical analysis of supermarket numbers and the identified clusters, while the orange box describes calculation of the response variables, i.e., aFDS and derived quality indices (i.e., Household macronutrient share of acquired food groups), and the regression strategies used to estimate relationship between the response variables and socioeconomic, demographic characteristics of the household. The dashed line connecting the two boxes indicates the step at which supermarket cluster information was appended to the VHLSS data set.
The supermarket enumeration data were subjected to time series clustering analysis (Aghabozorgi et al., 2015). The TSclust package in R was used to cluster provinces based on supermarket numbers. Provinces were classified into three distinct clusters with significant differences in the number of supermarkets between clusters across time. The three clusters correspond to: (1) provinces with relatively higher number of supermarkets (HighSM) across time; (2) provinces with a medium presence of supermarkets (MedSM) (i.e., a number much higher than low supermarket clusters); and (3) provinces with the least presence or absence of supermarkets (LowSM). The spatial distribution of clusters is shown in Figure 2.
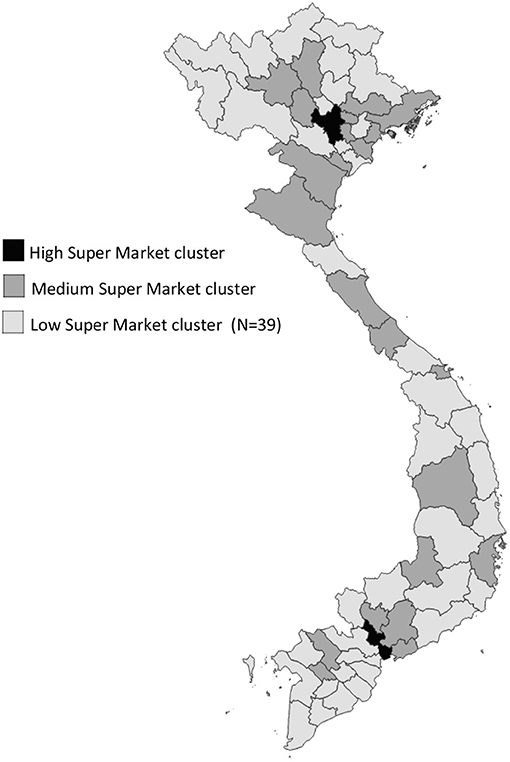
Figure 2. Spatial distribution of clusters.
The VHLSS belongs to the family of Household and Expenditure Surveys (HCES) which have been conducted regularly in several countries over several years (Kilic et al., 2017). HCES have also been used previously to study food consumption and nutrition at national levels, with the objective of supporting the Sustainable Development Goals (SDG) (Zezza et al., 2017). VHLSS surveys comprise about 9,000 households in each wave and they are representative at the national and provincial levels. Using data from three rounds of the VHLSS (i.e., 2010, 2012, and 2014), we extracted data on the socioeconomic and demographic characteristics of households, and the provincial location of households. Cluster information of the province, obtained as a result of time series clustering of supermarket numbers, was then appended to the VHLSS dataset, by matching the province (i.e., location) information. The appended VHLSS data set with supermarket cluster information was then stratified into subsamples (i.e., HighSM, MedSM, LowSM), each representing a supermarket cluster. Each cluster contained the extracted household-level socioeconomic and demographic data that were extracted from the VHLSS.
Measuring the Acquired Food Diversity Score and Food Basket Quality of Households
We assessed household-level diversity of food acquisition over the past 30 days from VHLSS food acquisition data. Household food acquisition patterns are based on the quantity (in kg) of acquisition of 56 regular food items including purchased goods, home-produced food, and food received in-kind. A continuous acquired food diversity score (aFDS) was constructed based on a count of the following nine food groups: (1) starchy staple foods; (2) flesh foods; (3) eggs; (4) nuts and seeds; (5) pulses; (6) dark green leafy vegetables; (7) other vegetables; (8) other fruits; and (9) dairy products (see Table 1 for food items under each food group). We included no “other vitamin A-rich fruits and vegetables” group due to the limited information about acquired vegetables and fruits in the VHLSS survey. These food groups are similar to those used to inform the Minimum Dietary Diversity for Women (MDD-W) indicator (FAO, 2016; Jones, 2016).
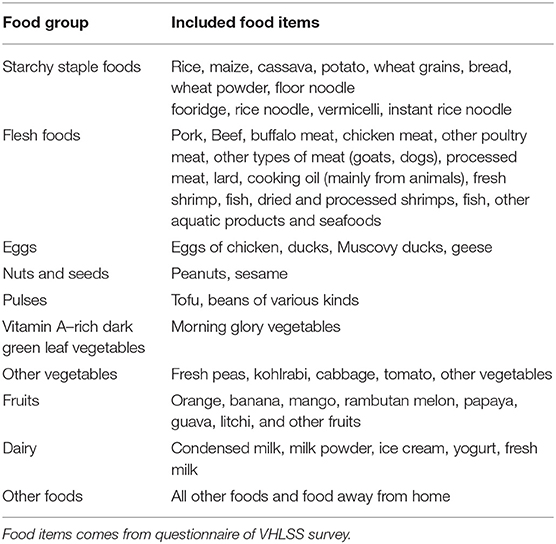
Table 1. Description of food groups from the VHLSS questionnaires.
We also calculated the relative macronutrient share of fats, carbohydrates and proteins of acquired food groups as previously described (Trinh et al., 2018b). Household food acquisition was converted into a total household availability of kilocalories (kcal), as well as total household availability of carbohydrates, protein, and fat (in grams) using the Vietnamese food composition table (Viet Nam National Institute of Nutrition, 2007). As total energy availability comes from three types of macronutrients (i.e., protein, fat, and carbohydrate), the macronutrient shares, denoted by SP, SF and SC, are defined as the proportion (in percentage) of calories coming from protein, fat and carbohydrate3.
Measuring Socioeconomic and Demographic Characteristics of Households
Using VHLSS data we calculated the following household-level socioeconomic variables: (1) per capita expenditure (USD)4; (2) proportion of food acquired from purchases (i.e., the proportion of food consumed that originated from purchased source over the total amount of consumed food); (3) location of households (i.e., dummy variable equal to 1 if the household is located in an urban area and equal to 0 otherwise); (4) household size, and (5) characteristics of the head of household including ethnicity, ender, and education level. These variables have been previously used to study the impact of socioeconomic characteristics on Vietnamese food consumption previously (Trinh et al., 2018a,b; Kim et al., 2019; Bairagi et al., 2020).
Regression Model
Two different regression approaches, one for aFDS as the outcome variable, and the other for household macronutrient share of acquired food groups were used to model the relationships between outcome variables, and various household-level socioeconomic and demographic predictor variables for each supermarket cluster separately, i.e.,
where Yi, s is acquired food indicator of household i in cluster s, and Xi, s is a vector of characteristics of household i in cluster s, including per capita expenditure, proportion of food consumed from acquired food items, location (urban/rural sites and socio-economic regions), ethnicity, household size and year. Model 1 covers two indicators:
(i) aFDS: Parameter estimates were calculated using Poisson regression techniques (see more details in Supplementary Material, Poisson regression analysis)
(ii) Household macronutrient share of acquired food groups, or SP, SF, SC: Estimates of parameters were used by compositional data analysis (CoDa). These three shares are transformed in two coordinates:
where Ilr1 is thus the ratio of carbohydrate share over the geometric mean of other shares while Ilr2 corresponds to the ratio of fat share over protein share [more details are given in Supplementary Material, Compositional data analysis (CODA)].
Results and Discussion
Distribution of Supermarkets, Household Acquired Food Diversity Score, Food Basket Quality, and Socioeconomic Characteristics Among Three Clusters
Time-series cluster analysis identified three distinct clusters. Figure 2 describes the spatial distribution. As expected, provinces largely dominated by urban areas like Hanoi and Ho Chi Minh City were associated with the HighSM cluster (126 supermarkets per province, on average), while medium provinces like Tuyen Quang, Hai Phong, and Quang Binh had lower supermarket counts than those in the HighSM cluster, and hence were clustered in the MedSM cluster (13 supermarkets per province on average). Poor provinces such as Ha Giang, Ha Tinh, and Quang Nam had a significantly lower number of supermarkets than the provinces in the HighSM and MedSM clusters (three supermarkets per province, on average).
The distributions of the number of supermarkets in each cluster are depicted in Figure 3. There was an increase in the number of supermarkets over time in the HighSM provinces with a slowdown in 2012 and 2014. This increase also appears for provinces in the MedSM cluster but is less pronounced, while it is very slow for LowSM provinces. We also calculated the number of supermarkets per 100,000 households by year and by cluster5. This number increased in MedSM and HighSM clusters over years (on average, from 7.21 supermarkets in 2010 in HighSM cluster (vs. 3.27 supermarkets in MedSM cluster) to 9.29 supermarkets in 2014 in HighSM cluster (vs. 5.11 supermarkets in MedSM cluster). The number of supermarkets per 100,000 households in LowSM clusters was stable over the period (from 1.40 in year 2010 to 1.61 in 2014).
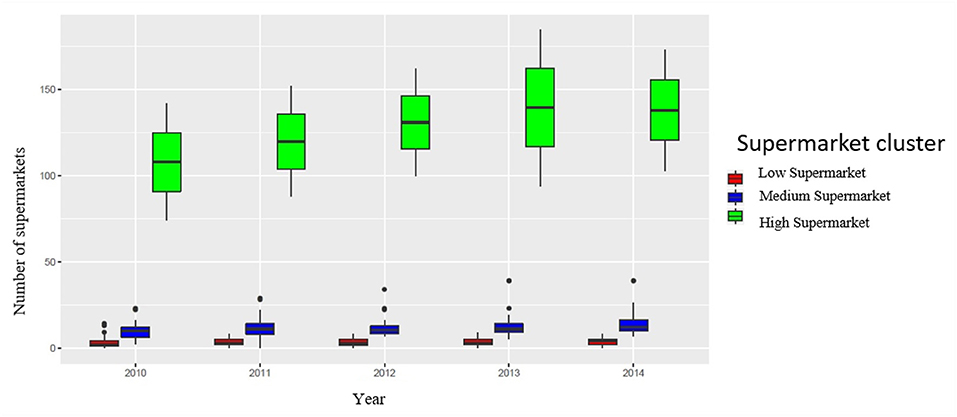
Figure 3. Distributions of the number of supermarkets according to clusters and over time. Each boxplot shows the distribution of data based on the five number summary: minimum, first quartile, median, third quartile, and maximum.
The aFDS was significantly different among the three clusters. Figure 4 shows the percentage of households consuming 9, 8, 7 6, and <6 food groups. Over 3 years, the percentage of households who acquired 9 and 8 food groups was much higher in HighSM, than in MedSM and LowSM clusters.
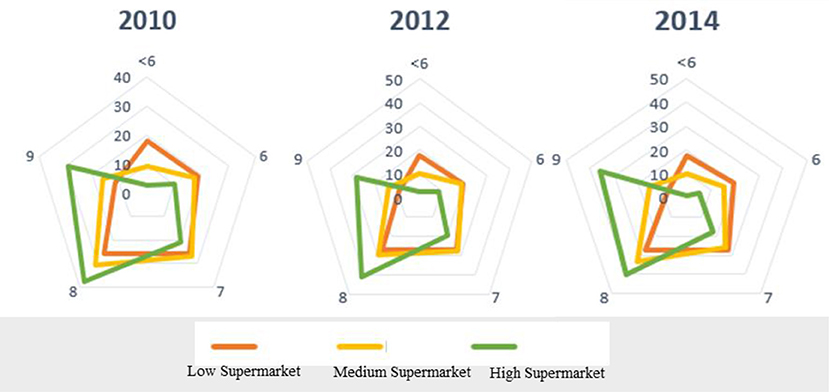
Figure 4. Acquired food diversity score distributions by cluster and year. Each axis represents the percentage of households who acquired 9, 8, 7, 6, and less than 6 (<6) food groups.
Macronutrient shares of acquired foods differ gradually among the three clusters. Table 2 shows the evolution of macronutrient shares by supermarket cluster between 2010 and 2014. MedSM and LowSM clusters tended to have similar mean profiles, even if in 2010 carbohydrate shares were higher in the LowSM cluster. The HighSM cluster differed markedly from the other two clusters with higher average fat and protein levels, and consequently lower average carbohydrate share. The recommended composition of macronutrients in a Vietnamese diet, according to the Vietnamese Ministry of Health, is 14% kcal from protein, 18% from fat, and 68% from carbohydrate (Vietnam Ministry of Health, 2012). A comparison of average macronutrient shares in supermarket clusters to this recommended pattern is given in Figure 5 using a ternary diagram. Households in both MedSM and LowSM clusters achieved the recommended pattern, while households in HighSM clusters exceeded it, with higher protein and fat shares, and, consequently, smaller carbohydrate shares. Finally, household sociodemographic characteristics differ among the three clusters (Table 3). As expected, households living in HighSM cluster provinces had a higher per capita expenditure, and were more likely to reside in urban areas than those living in the other two clusters. More households are headed by women in HighSM cluster provinces, and most households in this cluster belong to the dominant ethnicity in Vietnam, i.e., Kinh. Moreover, in HighSM cluster provinces, households consumed more purchased food items than households in the other two clusters. Households in MedSM cluster provinces were also more educated. Ethnic minorities were more prevalent among households in the LowSM cluster provinces.
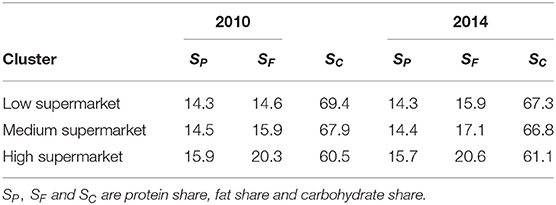
Table 2. Evolution of macronutrient shares by supermarket clusters and over years.
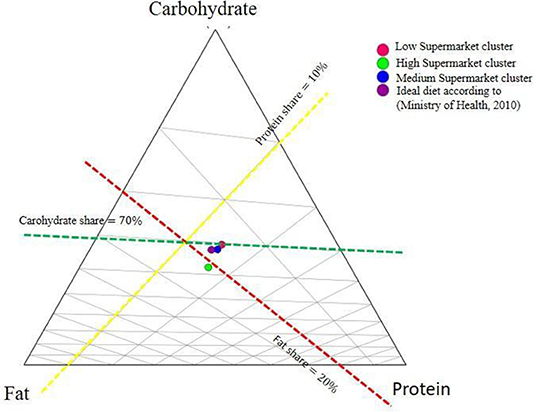
Figure 5. Ternary diagram of average macronutrient shares for each supermarket cluster. A ternary diagram is a triangular coordinate system where the edges of the triangle are the axes. Each axe is associated with a component with a variation from 0 to 100%. So, for example, the axis from the top titled “Carbohydrate” to the top “Protein” is associated with the variation in protein component. The location of the vector with SP = 10%, SF = 20%, SC = 70% are added to make this diagram reading easier.
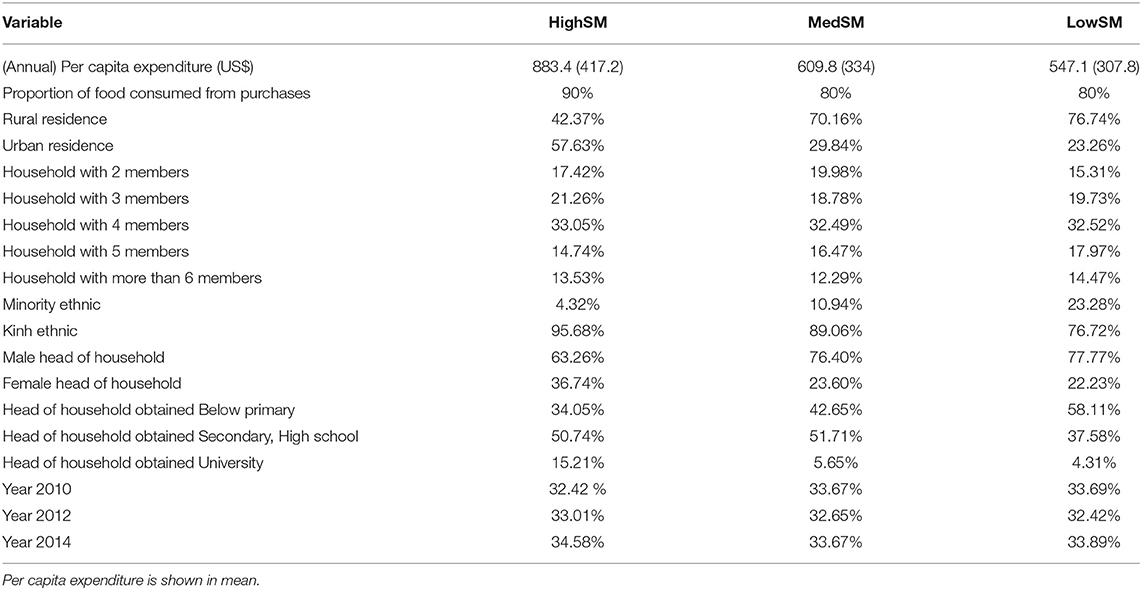
Table 3. Descriptive statistics of social, economic and demographic variables by supermarket clusters.
Influence of Household Socioeconomic, Demographic, and Location Characteristics on Food Acquisition Across Supermarket Clusters
Table 4 summarizes the results of the estimation of the two different regression models. For simplicity, we report the signs of associations with variables. We only consider impacts on the different outcomes that are significantly different from zero for each supermarket cluster. Detailed estimation results are given in Tables A-1, A-2.
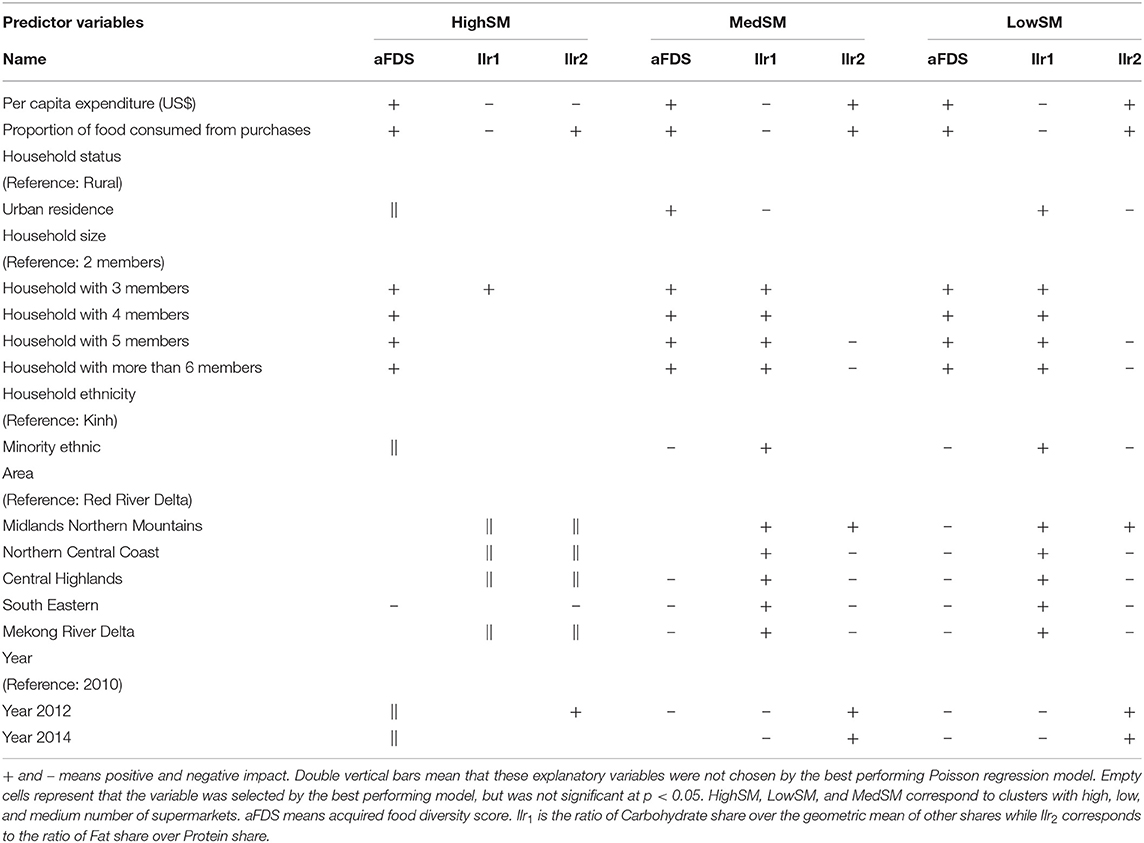
Table 4. Summary of estimation results: directions of significant impacts.
Differential Effects of Per Capita Expenditure and Proportion of Food Consumed From Purchases on Acquired Food Diversity Score and Food Basket Quality Across Supermarket Clusters
The strong growth in the Vietnamese economy has improved the financial capabilities of households in recent years with an increase in per capita expenditure and a proportional increase in the total acquired food groups from purchases. From 2010 to 2014, households in LowSM and MedSM showed an increase of 3.5% in total proportion of acquired food from purchases, in contrast to households in the HighSM cluster that showed a smaller increase (2.4% on average). Our results clearly indicate a positive association of per capita expenditure and proportion of food consumed from purchases with acquired food diversity as has been shown in previous studies (Drescher et al., 2009; Chandon and Wansink, 2012; Rupa et al., 2019). Interestingly though, presence of supermarkets in the food environment is not associated with this positive relationship, as this trend was observed across all supermarket clusters. This finding further suggests that, in recent years, the food supply in Vietnam has diversified, thereby enabling diversification in food purchases.
These results from the regression analysis seem to translate firstly into a wealth effect. The results show that as the per capita expenditure of households increases their proportion of food purchases also increases. Households with higher per capita expenditure, and increased proportion of food purchases, also have higher aFDS scores. This finding indicates that higher wealth is potentially related to acquiring a more diverse food basket. This relationship does not change across supermarket clusters. The impacts of per capita expenditure on food quality are much more nuanced. We observed that across all supermarket clusters, an increase in per capita expenditure was associated with acquisition of food items with low carbohydrate, and high protein shares (i.e., a negative impact on Ilr1), suggesting no impact of supermarkets on food basket quality. We identified differential effects of per capita expenditure on the ratio between protein and fat shares of foods (i.e., a negative impact on Ilr2), across supermarket clusters. An increase in per capita expenditure was associated with acquisition of foods with high protein, and lower fat shares in households in the HighSM cluster. However, among households in MedSM and LowSM cluster, an increase in per capita expenditure was associated with acquisition of food items with high fat and low protein shares.
Socioeconomic and Demographic Characteristics of Households, and Differences in Food Diversity and Quality Across Supermarket Clusters
Significant impacts of living in an urban area (vs. rural) on aFDS and macronutrient shares only appeared in MedSM clusters, suggesting pronounced differences in quantity, and quality of foods acquired by urban and rural households in MedSM clusters but not in the other supermarket clusters. Urban households in MedSM cluster provinces had higher aFDS scores with acquired food items characterized by high protein and fat shares and lower carbohydrate shares. These results, in combination with the trends identified with per capita expenditure variable suggest that a higher number of supermarkets, and relatively easier access (assuming that urban households have easier access to supermarkets than rural households) promote acquisition of food items with high protein and lower carbohydrate shares.
A substitution effect in quality of acquired food groups is also observed in ethnic minority households of LowSM and MedSM clusters. In these clusters, ethnic minority households have a lower aFDS score in comparison to ethnic majority (i.e., Kinh) households. Interestingly, quality of food groups acquired by ethnic minority households, differ in terms of carbohydrate shares between the two clusters. Acquired food groups of ethnic minority households, in comparison to Kinh households in MedSM (vs. LowSM) cluster, are characterized by lower (vs. higher) carbohydrate and larger (vs. lower) protein and fat shares. This further strengthens our observation, that increased number of supermarkets in the local food environment, promotes acquisition of food baskets associated with higher protein, and lower carbohydrate shares for minorities.
Larger sized households across all clusters acquired more diverse food item (i.e., positive aFDS values), compared to households with <3 members. The magnitude of incidence rate ratios in Table A-1 confirm this increasing effect. Moreover, an increase in household size also was significantly associated with acquired food groups characterized by higher carbohydrate share, and lower protein/fat shares, which was observed in all supermarket clusters. In addition, larger sized households in HighSM (vs. MedSM and LowSM) cluster acquired foods with higher (vs. lower) fat and lower (vs. higher) protein shares, in relation to smaller-sized households in the same cluster. The observation that larger-sized households in HighSM clusters acquired foods with higher fat shares contrasts with the finding that foods of households with higher per capita expenditure in HighSM clusters were characterized by higher protein shares. These contrasting findings suggest that larger-sized households in HighSM clusters are characterized by lower per capita expenditure, and therefore are able to acquire only “fat” and not high protein share foods from the supermarkets in their local food environment.
Differences Between Household Location and Household Level Food Diversity and Quality, Across Supermarket Clusters
Limited access to supermarkets in food environments is also reflected when assessing the impact of household location. The association of the urban location variable was observed across all supermarket clusters. In the HighSM cluster, which only had the South Eastern region and the Red River Delta region, aFDS was significantly lower than in the Red River Delta region. Across the remaining supermarket clusters, we observed a similar trend, wherein all areas captured in the VHLSS had significantly lower aFDS in comparison to the Red River Delta with the exception of the Midlands Northern Mountainous region in the MedSM cluster. The Red River Delta is a low lying, fertile area of Vietnam with diverse agricultural production systems (Kurosawa et al., 2004). This region has a relatively large presence of supermarkets than other regions, and may explain our observation of the differences in aFDS between regions. Impacts on food quality are also consistent with presence of a relatively greater number of supermarkets in the Red River Delta region, as acquired food groups of households in this region were characterized by higher protein and fat shares, in comparison to households in other regions (again with the exception of the Midlands Northern Mountainous region in the MedSM cluster). Results from the households in the MedSM and LowSM clusters in the Midlands Northern Mountainous region showed important patterns. Firstly, in terms of aFDS, households in Midlands Northern Mountainous region did not differ from those in the Red River Delta region in the MedSM cluster, but differed significantly in the LowSM cluster, suggesting disproportionate access to supermarkets between the MedSM and LowSM clusters within this region. Surprisingly, despite the possible disproportionate access to supermarkets, households across both MedSM and LowSM clusters in the Midlands Northern Mountainous region acquired foods with higher fat to protein shares relative to the Red River Delta region, and unlike the remaining areas across the two supermarket clusters. The Midlands Northern Mountainous region was unique, as it was characterized by complex terrain and climatic conditions that supported limited diversity in agricultural production systems (focused on rice and corn production), with limited infrastructure development. Additionally, this area of Vietnam was also inhabited by a large diversity of ethnic minority communities with relatively lower incomes and education levels (Vien, 2003). In fact, the regression results showed that households with relatively higher incomes in fertile areas acquired foods with a lower fat-to-protein ratio. These results did not hold in the Midlands Northern Mountainous region, which may explain the observation of higher fat-to-protein ratio food acquisition patterns among households in the Midlands Northern Mountainous region.
The response of the time variable (i.e., year) also supports the argument, that presence of a larger number of supermarkets in the food environment partly supports acquisition of diverse foods, as we observed a significant decrease in aFDS values across time, only in MedSM and LowSM clusters, but not in the HighSM cluster.
Traditional markets are however still the most predominant channel for sourcing food for households in Vietnam (Maruyama and Trung, 2007; Vo and Smith, 2017). Our analysis points to the observation that traditional markets are a significant source of food groups with larger carbohydrate and smaller fat share in Vietnam. In contrast, supermarkets, as observed from the quality of acquired food by ethnic minority households, larger-sized families both in low and medium supermarket clusters, or households in Central Highlands, South East, Northern Central Coast areas, that have relatively lower per capita expenditure, and acquire major proportion of their food is sourced from traditional markets. Among households in HighSM clusters or households living in cities in MedSM clusters, this pattern differs in that these households have higher per capita expenditures, and acquired food is associated with high fat and low carbohydrate shares.
Limitations of the Study
Overall, analysis of existing data reveals that supermarkets have had, and continue to have complex and profound influences on food environment in Vietnam. However, there are also specific relationships within this complex food environment that have not yet been studied in this work. We recognize that by using yearly data for supermarket we oversimplify the complexity of the Vietnamese food environment in an assumed duality between supermarkets (i.e., modern) and traditional markets. Thus, we cannot address the issue of the diversity in retail assortment, even if it is well-known that outcomes on healthy or unhealthy diets may depend on the presence of “safe” fresh foods, ultra-processed foods in supermarkets (Monteiro et al., 2013). But, here too, the official data that are available, which we used, does not allow us to capture the highly complex and dynamic features of the retail environment in Vietnam. Nevertheless, clustering analysis of provinces will take into account some interesting characteristics of supermarket presence in Vietnam. In addition, belonging to a given supermarket cluster is a very crude measure of supermarket accessibility for households. We do not have sufficiently disaggregated information on spatial coordinates describing the exact location of each supermarket or at least the commune where the supermarket is located. Thus, we cannot associate with each household an indicator of its accessibility to supermarkets other than that provided by the clusters. In addition, this study also does not go in-depth with other quality indicators of diet, which have been used in literature such as “problem foods” (Kelly et al., 2014), shares of eight food groups in total calorie availability (Asfaw, 2008), and Diet Quality Index International (Tessier et al., 2008). Most of these indicators are not computable from data such as VHLSS because they require information not available in this kind of survey. In addition, this study does not concern the price of foods across clusters. Similarly, food away from home (FAFH) is only measured by expenditure in VHLSS and this may lead to inaccurate reporting of FAFH, preventing us from taking into account the growth in the segment of consumers eating food away from home in Vietnam. Another type of survey should be implemented for better capturing FAFH and determining what type of foods are more acquired (Vakis, 2019). Finally, this research does not link with any retailing policies in Vietnam.
Conclusion
Existing public data (such as the VHLSS and others) have been used in the past to investigate transitions in patterns of food groups procured among Vietnamese households. However, these data have not yet been used to describe associations between the expansion in supermarkets and patterns of food acquisition across both time and space In addition, the use of relatively new statistical approaches, such as compositional data regression analysis to capture nuanced associations of quality of food group procured in relation to supermarkets have also not been performed previously.
A data strategy that builds on analysis across two disparate public datasets (i.e., abundance of supermarket and household-level information from the VHLSS), and a combination of statistical approaches, provided insights into the diversity and quality of procured foods for different socioeconomic strata in three supermarket clusters. We were able to show that specific household characteristics—per capita expenditure, proportion of food consumed from purchases and patterns of household food acquisition—are associated with an abundance of supermarket in the food environment. However, household food quality, with respect to the relative proportions of fat, carbohydrate, and protein shares of acquired food, was not associated with this presence of supermarkets. We also show that aFDS, household macronutrient share of acquired food groups, and a household's location and behavior across time, were significantly associated with a larger presence of supermarkets in the food environment.
Vietnam like other emerging economies is experiencing the problem of the double burden of malnutrition with the co-existence of both undernutrition, overnutrition, and related chronic disorders (Khan and Khoi, 2008; Nguyen and Hoang, 2018). Results from this study seek to inform the development of national- and provincial-level policies in Vietnam aimed at modernizing food markets options to contribute to address this issue. On the one hand, the expansion of supermarkets can be an opportunity to upgrade food environments to address challenges related to the double burden of malnutrition. As supermarkets tend to tailor to increasingly larger audiences, there is an opportunity to work with the sector to work on behavior change communication to promote healthy and safe food and lifestyles. On the other hand, there is a need to catalyze equitable infrastructure development and social inclusion in areas with income and infrastructure disparities. Upgrading traditional markets and small to medium-size family businesses are key in the retail landscape. Given the right policy measures these may also help households in more marginal environments to have enhanced availability to a larger diversity of food groups. Retail diversity can potentially translate in healthy diets if the food access and nutrition messaging for marginalized groups is improved.
The increased acquisition of diverse food groups does not automatically imply healthy diets though. Results from this work provide ample evidence of this, such as increased proportion of fats and proteins in relation to carbohydrates in food groups purchased (and not consumed) in food environments with a higher presence of supermarkets. Additionally, previous work has shown that over time it has become relatively easier to purchase fats, in comparison to proteins (Khoury and Andy, 2014), and we in fact observed this from our analysis, as acquisition of foods with higher fat-to-protein ratio has increased over time in Vietnam. Additional evidence for this also comes from our observation that households in relatively poor area such as the Midlands Northern Mountainous region, also acquire foods with higher fat to protein ratios. Food environments need to be designed in a manner, that facilitate the ability to acquire diverse food groups, but also balances the macronutrient shares closer to the recommended diet. Our results show that it is possible to achieve this through a mix of improved ability to spend (increased per capita expenditure) by a household, and interestingly by increasing the number of supermarkets in the food environments of relatively poor households. However, the growth and expansion of supermarkets needs to be balanced, as there is a strong possibility of facing the negative effects of development, such as increased incidence of diabetes, obesity etc., which is starting to be observed especially in the urban areas of Vietnam (Walls et al., 2009). Supermarkets are bound to expand in the future. Yet, it is important that food environments remain conduce to retail diversity, the participation of consumers and producers in food systems governance, small and medium-size businesses, and adequate lifestyle information provision to trigger positive health outcomes for both consumers and the environment.
The Contribution of Results and Conclusions Into the Perspective of the SDGs
The need for conducive food environments has gained programmatic prominence among national governments, as a result of their pledged support to the 2030 Sustainable Development agenda (SDG's). The SDGs are highly interconnected and food retail, including supermarkets, can impact the 17 SDG's in multiple ways. First of all, the data analysis strategy used in this paper shows the importance of data monitoring and accountability goal under SGD 17 (especially sub-section 17.18 that refers to increasing availability of timely and reliable data). This paper also contributes to previous empirical results from households survey (Zezza et al., 2017; Blesh et al., 2019; Heller et al., 2019) on food consumption and nutrition at national levels to support SDG 2 related to ending hunger, reducing food insecurity and improving nutrition.
Data Availability Statement
Publicly available datasets were analyzed in this study. This data can be found here: https://www.gso.gov.vn/default_en.aspx?tabid=780.
Author Contributions
All authors contributed to the study and analytical design, interpretation, and writing. HT and BD prepared the datasets and conducted the statistical analysis. SH, AJ, and MS contributed to the preliminary results. TTH and TVH contributed general knowledge on the supermarket system and foods in Vietnam.
Funding
This research was funded by the CGIAR Research Program on Agriculture for Nutrition and Health (CRP-A4NH) through its Flagship Program on Food Systems for Healthy Diets, the University of Michigan Graham Institute of Sustainability through the project Leveraging existing data and insights into the policy process to accelerate progress toward achieving sustainable diets in the Global South, and the INRA-CIRAD GloFoodS meta-program.
Conflict of Interest
The authors declare that the research was conducted in the absence of any commercial or financial relationships that could be construed as a potential conflict of interest.
Acknowledgments
We would like to thank the Editor of the review and two referees for their thoughtful comments and suggestions on the earlier draft of this paper. This paper has also benefited from valuable discussions with participants at the Postharvest Management for Better Food Security, Hanoi, November, 2018 and the Vietnamese Economists Annual Meeting, Dalat, June 2019. We specially thank Sigrid C.O. Wertheim-Heck for valuable comments at the 170th Seminar of the European Association of Agricultural Economists, Montpellier, May 2019.
Supplementary Material
The Supplementary Material for this article can be found online at: https://www.frontiersin.org/articles/10.3389/fsufs.2020.00015/full#supplementary-material
Footnotes
1. ^Download from the website https://www.gso.gov.vn/
2. ^Data results of the Viet Nam Household Living Standards Survey 2012 https://www.gso.gov.vn/default_en.aspx?tabid=483&idmid=4&ItemID=13888,
Data results of the Viet Nam Household Living Standards Survey 2010
https://www.gso.gov.vn/default_en.aspx?tabid=515&idmid=5&ItemID=12426
3. ^The quantity of protein in grams (vs. fat) is converted into kilocalories by multiplying by 4 (vs. 9).
4. ^Nominal money has been adjusted for inflation to year 2014 using CPI indicators in http://data.worldbank.org/indicator/PA.NUS.FCRF?page=1
5. ^Total number of households in each province and each year is calculated using sample weight of VHLSS.
References
Aghabozorgi, S., Shirkhorshidi, A. S., and Wah, T. Y. (2015). Time-series clustering – A decade review. Inf. Syst. 53, 16–38. doi: 10.1016/j.is.2015.04.007
Asfaw, A. (2008). Does supermarket purchase affect the dietary practices of households? Some empirical evidence from Guatemala. Dev. Policy Rev. 26, 227–243. doi: 10.1111/j.1467-7679.2008.00407.x
Bairagi, S., Mohanty, S., Baruah, S., and Thi, H. T. (2020). Changing food consumption patterns in rural and urban Vietnam: Implications for a future food supply system. Aust. J. Agric. Resour. Econ. 1–26. doi: 10.1111/1467-8489.12363. [Epub ahead of print].
Barker, T., and Üngör, M. (2019). Vietnam: the next Asian tiger? North Am. J. Econ. Financ. 47, 96–118. doi: 10.1016/j.najef.2018.11.010
Blesh, J., Hoey, L., Jones, A. D., Friedmann, H., and Perfecto, I. (2019). Development pathways toward “zero hunger.” World Dev. 118, 1–14. doi: 10.1016/j.worlddev.2019.02.004
Cadilhon, J.-J., Moustier, P., Poole, N. D., Phan, T. G. T., and Fearne, A. P. (2006). Traditional vs. modern food systems? Insights from vegetable supply chains to Ho Chi Minh City (Vietnam). Dev. Policy Rev. 24, 31–49. doi: 10.1111/j.1467-7679.2006.00312.x
Chandon, P., and Wansink, B. (2012). Does food marketing need to make us fat? A review and solutions. Nutr. Rev. 70, 571–593. doi: 10.1111/j.1753-4887.2012.00518.x
Dharani, B. D., Thi Huong, T., Duong, T. T., Huynh, T., De Haan, S., Sanchez, A., et al. (2018). VIETNAM Food Systems : Summary of Available Data. Available online at: https://hdl.handle.net/10568/100747 (accessed February 14, 2020).
Drescher, L. S., ansd Thiele, S., Roosen, J., and Mensink, G. B. (2009). Consumer demand for healthy eating considering diversity – an economic approach for German individuals. Int. J. Consum. Stud. 33, 684–696. doi: 10.1111/j.1470-6431.2009.00812.x
Government of Vietnam (2017). Report No. 211/BC-CP of May 18, 2017 by the Central Goverment of Vietnam on Reporting the Situation of Policy Implementation on Food Safety Management in the Period of 2011-2016 in Vietnam. Hanoi: Government of Vietnam.
Hawkes, C. (2008). Dietary implications of supermarket development: a global perspective. Dev. Policy Rev. 26, 657–692. doi: 10.1111/j.1467-7679.2008.00428.x
Heller, M. C., Walchale, A., Heard, B. R., Hoey, L., Khoury, C. K., De Haan, S., et al. (2019). Environmental analyses to inform transitions to sustainable diets in developing countries: case studies for Vietnam and Kenya. Int. J. Life Cycle Assess. doi: 10.1007/s11367-019-01656-0. [Epub ahead of print].
HLPE (2017). Nutrition and Food Systems. A Report by the High Level Panel of Experts on Food Security and Nutrition of the Committee on World Food Security. Rome: FAO.
Hoang, L. V. (2009). Estimantion of Food Demand from Household Survey Data in Vietnam. DEPOCEN. Working Paper Series. (Hanoi), 12.
Jones, A. D. (2016). On-farm crop species richness is associated with household diet diversity and quality in subsistence-and market-oriented farming households in Malawi−3. J. Nutr. 147, 86–96. doi: 10.3945/jn.116.235879
Kelly, M., Seubsman, S. A., Banwell, C., Dixon, J., and Sleigh, A. (2014). Thailand's food retail transition: supermarket and fresh market effects on diet quality and health. Br. Food J. 116, 1180–1193. doi: 10.1108/BFJ-08-2013-0210
Khan, N. C., and Khoi, H. H. (2008). Double burden of malnutrition: the Vietnamese perspective. Asia Pac. J. Clin. Nutr. 17, 116–118. doi: 10.6133/apjcn.2008.17.s1.28
Khoury, C. K., and Andy, J. (2014). The Changing Composition of the Global Diet: Implications for CGIAR Research. Cali: Centro Internacional de Agricultura Tropical. 1–6.
Kilic, T., Serajuddin, U., Uematsu, H., and Yoshida, N. (2017). Costing Household Surveys for Monitoring Progress Toward Ending Extreme Poverty and Boosting Shared Prosperity. World Bank Working Paper. doi: 10.2343/geochemj.26.435
Kim, C., Sattar, A., Alvarez, C., Haile, B., Moltedo, A., and Azzarri, C. (2019). Production, Nutrition, and Food Security in Viet Nam Diagnostic Overview. The International Dietary Data Expansion (INDDEX) Project. 1–71.
Kurosawa, K., Nguyen Hai, D., Huu Thanh, N., Thi Lam Tra, H., Tat Canh, N., and Egashira, K. (2004). Monitoring of inorganic nitrogen levels in the surface and ground water of the Red River Delta, northern Vietnam. Commun. Soil Sci. Plant Anal. 35, 1645–1662. doi: 10.1081/CSS-120038560
Lu, L., and Reardon, T. (2018). An economic model of the evolution of food retail and supply chains from traditional shops to supermarkets to e-commerce. Am. J. Agric. Econ. 100, 1320–1335. doi: 10.1093/ajae/aay056
Maruyama, M., and Trung, L. V. (2007). Supermarkets in Vietnam: opportunities and obstacles. Asian Econ. J. 21, 19–46. doi: 10.1111/j.1467-8381.2007.00245.x
Maruyama, M., and Trung, L. V. (2010). The nature of informal food bazaars: empirical results for Urban Hanoi, Vietnam. J. Retail. Consum. Serv. 17, 1–9. doi: 10.1016/j.jretconser.2009.08.006
Mishra, V., and Ray, R. (2009). Dietary diversity, food security and undernourishment: the vietnamese evidence. Asian Econ. J. 23, 225–247. doi: 10.1111/j.1467-8381.2009.02010.x
Monteiro, C. A., Moubarac, J.-C., Cannon, G., Ng, S. W., and Popkin, B. (2013). Ultra-processed products are becoming dominant in the global food system. Obes. Rev. 14, 21–28. doi: 10.1111/obr.12107
Moustier, P., Phan, T. G. T., Dao, T. A., Vu, T. B., and Nguyen, T. T. L. (2010). The role of farmer organizations in supplying supermarkets with quality food in Vietnam. Food Policy 35, 69–78. doi: 10.1016/j.foodpol.2009.08.003
Nguyen, T. T., and Hoang, M. V. (2018). Non-communicable diseases, food and nutrition in Vietnam from 1975 to 2015: the burden and national response. Asia Pac. J. Clin. Nutr. 27, 19–28. doi: 10.6133/apjcn.032017.13
Nguyen-Viet, H., Tuyet-Hanh, T. T., Unger, F., Dang-Xuan, S., and Grace, D. (2017). Food safety in Vietnam: where we are at and what we can learn from international experiences. Infect. Dis. Poverty 6, 1–6. doi: 10.1186/s40249-017-0249-7
Popkin, B. M., and Gordon-Larsen, P. (2004). The nutrition transition: worldwide obesity dynamics and their determinants. Int. J. Obes. 28:S2. doi: 10.1038/sj.ijo.0802804
Raneri, J. E., Kennedy, G., Nguyen, T., Wertheim-Heck, S., Do, H., Stef, D. H., et al. (2019). Determining Key Research Areas for Healthier Diets and Sustainable Food Systems in Vietnam. Washington, DC: International Food Policy Research Institute (IFPRI). doi: 10.2499/p15738coll2.133433
Reardon, T., and Timmer, C. P. (2007). Transformation of markets for agricultural output in developing countries since 1950: how has thinking changed? Handb. Agric. Econ. 3, 2807–2855. doi: 10.1016/S1574-0072(06)03055-6
Reardon, T., Timmer, C. P., and Minten, B. (2012). Supermarket revolution in Asia and emerging development strategies to include small farmers. Proc. Natl. Acad. Sci. U.S.A. 109, 12332–12337. doi: 10.1073/pnas.1003160108
Rischke, R., Kimenju, S. C., Klasen, S., and Qaim, M. (2015). Supermarkets and food consumption patterns: the case of small towns in Kenya. Food Policy 52, 9–21. doi: 10.1016/j.foodpol.2015.02.001
Rupa, J. A., Umberger, W. J., and Zeng, D. (2019). Does food market modernisation lead to improved dietary diversity and diet quality for urban Vietnamese households? Aust. J. Agric. Resour. Econ. 63, 499–520. doi: 10.1111/1467-8489.12308
Tessier, S., Traissac, P., Maire, B., Bricas, N., Eymard-Duvernay, S., El Ati, J., et al. (2008). Regular users of supermarkets in greater Tunis have a slightly improved diet quality. J. Nutr. 138, 768–774. doi: 10.1093/jn/138.4.768
Trinh, T. H., Morais, J., Thomas-Agnan, C., and Simioni, M. (2018a). Relations between socio-economic factors and nutritional diet in Vietnam from 2004 to 2014: new insights using compositional data analysis. Stat. Methods Med. Res. 28, 2305–2325. doi: 10.1177/0962280218770223
Trinh, T. H., Simioni, M., and Thomas-Agnan, C. (2018b). Assessing the nonlinearity of the calorie-income relationship: an estimation strategy – with new insights on nutritional transition in Vietnam. World Dev. 110, 192–204. doi: 10.1016/j.worlddev.2018.05.030
Umberger, W., Zeng, D., Rupa, J., Dumbrell, N., and Nguyen, A. D. (2018). The Vietnam Urban Food Consumption and Expenditure Study. Factsheet 4: Where do Consumers Shop? Wet Markets Still Dominate. Available online at: https://www.adelaide.edu.au/global-food/research/international-development/vietnam-consumer-survey/ (accessed February 14, 2020).
Vakis, G. F. K. R. M. J. P. R. (2019). Poverty Measurement in the Era of Food Away from Home: Testing Alternative Approaches in Vietnam. Hanoi: The World Bank. doi: 10.1596/1813-9450-8692
Vien, T. D. (2003). Culture, environment, and farming systems in Vietnam's Northern Mountain Region. Southeast Asian Stud. 41, 180–205. Available online at: https://kyoto-seas.org/pdf/41/2/410203.pdf (accessed February 14, 2020).
Viet Nam National Institute of Nutrition (2007). Vietnamese Food Composition Table. Hanoi: Vietnam Med. Publ. House.
Viet Nam National Institute of Nutrition (2013). Nutrition Surveillance Profiles: 2013. Hanoi: Viet Nam National Institute of Nutrition. 1–307.
Vietnam Ministry of Health (2012). National Nutrition Strategy for 2011–2020, With a Vision Toward 2030. Hanoi: Med. Publ. House.
Vo, K., and Francic, M. (2018). Vietnam Retail Foods Sector Report 2018. Rep. Number VM8053 (Global Agric. Inf. Network). USDAA Foreign Agric. Serv. Available online at: https://bit.ly/3bEv964 (accessed February 14, 2020).
Vo, K., and Smith, G. (2017). Vietnam Retail Foods - Sector Report 2016. 1–30. Available online at: https://bit.ly/37nv4AB (accessed February 14, 2020).
Walls, H. L., Peeters, A., Son, P. T., Quang, N. N., Hoai, N. T. T., Loi, D. D., et al. (2009). Prevalence of underweight, overweight and obesity in urban Hanoi, Vietnam. Asia Pac. J. Clin. Nutr. 18, 234–239. doi: 10.6133/apjcn.2009.18.2.12
Zezza, A., Carletto, C., Fiedler, J. L., Gennari, P., and Jolliffe, D. (2017). Food counts. Measuring food consumption and expenditures in household consumption and expenditure surveys (HCES). Introduction to the special issue. Food Policy 72, 1–6. doi: 10.1016/j.foodpol.2017.08.007
Keywords: supermarkets, household food diversity score, macronutrient shares, Poisson regression, compositional data analysis, Vietnam household living standard survey
Citation: Trinh HT, Dhar BD, Simioni M, de Haan S, Huynh TTT, Huynh TV and Jones AD (2020) Supermarkets and Household Food Acquisition Patterns in Vietnam in Relation to Population Demographics and Socioeconomic Strata: Insights From Public Data. Front. Sustain. Food Syst. 4:15. doi: 10.3389/fsufs.2020.00015
Received: 10 October 2019; Accepted: 03 February 2020;
Published: 27 February 2020.
Edited by:
Hans De Steur, Ghent University, BelgiumReviewed by:
Gudrun Barbara Keding, University of Göttingen, GermanyAida Turrini, Council for Agricultural and Economics Research, Italy
Copyright © 2020 Trinh, Dhar, Simioni, de Haan, Huynh, Huynh and Jones. This is an open-access article distributed under the terms of the Creative Commons Attribution License (CC BY). The use, distribution or reproduction in other forums is permitted, provided the original author(s) and the copyright owner(s) are credited and that the original publication in this journal is cited, in accordance with accepted academic practice. No use, distribution or reproduction is permitted which does not comply with these terms.
*Correspondence: Huong T. Trinh, VC5IdW9uZ0BjZ2lhci5vcmc=; Burra D. Dhar, RC5CdXJyYUBjZ2lhci5vcmc=
†ORCID: Huong T. Trinh orcid.org/0000-0002-5615-5787
Burra D. Dhar orcid.org/0000-0002-2638-3420
Stef de Haan orcid.org/0000-0001-8690-1886