- 1Northwest A&F University, Xianyang, China
- 2Chinese Academy of Sciences and Ministry of Water Resources, Institute of Soil and Water Conservation, Xianyang, China
The limited available water resources and competition among different water use sectors have become the main constraints of food security and sustainability. Faced with the inability to expand the area of cultivated land due to urbanization and population growth, one of the biggest challenges and risks for developing countries is to ensure the supply of food quantity and quality under extremely limited water resources. To achieve water-saving and improve calorie supply by adjusting crop production allocations, three objectives—of minimum blue water footprint, maximum calorie production, and each crop production no less than the reference level of nine main crops in China—were achieved using a non-dominated sorting genetic algorithm II. The results display that compared with the reference year, model Maize+ (maize production increased) had significant blue water saving (~32%), the blue water footprint of crop production in all provinces reduced, and its calorie production increased by 4%. This solution is not realistic for China because wheat and rice production need to be reduced by 82 and 80%, respectively. However, model Citrus– (citrus production decreased) reduced the blue water footprint of crop production (~16%), and increased calorie production (~12%). Compared with other solutions, it is a sustainable crop production structure that is easier to realize because it is better at meeting the production of each crop. Therefore, China can appropriately increase the planting area of maize and reduce the planting of citrus and other crops that consume more blue water and produce fewer calories to ensure the security and sustainability of food supplies. However, the improvement of water saving-technology, rationalization of agricultural water resources management, crop production allocations mentioned in this study, and other efforts are necessary to achieve this goal.
Introduction
Water crises have become one of the top five key global risks (WEF World Economic Forum, 2017). Global agricultural water consumption accounts for 92% of total water use (Hoekstra and Mekonnen, 2012). By 2050, the global population will increase by 2 billion (UN United Nations Department of Economic Social Affairs Population Division, 2019); thus, if we do not seek transformation, more water will be consumed to produce calories that sustain human life than now (Tuninetti et al., 2020). Simultaneously, competition for limited water resources among different industries is increasing in developing countries. Faced with the inability to increase the cultivated land area owing to the expansion of urban areas and population growth (Seto and Ramankutty, 2016; Liu et al., 2020; Sun et al., 2020), one of the biggest challenges and risks for developing countries is to securing food quantity and quality under extremely limited water resources. Thus, we must consider both natural resources and food supply to provide acceptable solutions (Davis et al., 2017).
Different industries consume and compete for extremely limited blue water (surface water and groundwater) resources. Therefore, reducing the blue water footprint (BWF) of agricultural production and improving the utilization efficiency of agricultural blue water resources are key to achieving food safety and sustainability globally, especially in developing countries and regions. On the regional scale, defining the crop planting structure through an objective optimization model is considered to be an effective method to improve the utilization efficiency of agricultural blue water resources (Singh, 2012). Many studies have explored the optimization of planting structures for different regions. For example, Chouchane et al. (2020) adopted a linear optimization method to reduce the global BWF of crop production by 21% by adjusting the rainfed harvested area, irrigation-harvested area, and planting location of crops in the world. Osama et al. (2017) increased the economic benefits of Egypt by 6.44% ± 0.84 under the restriction of water and land resources, but the planting area of non-strategic crops decreased significantly. All the above studies take a single condition as the optimization goal, but in practical applications, multiple objectives have to be achieved simultaneously, such as resource efficiency, stable crop production allocation, and consumption demand satisfaction. Several studies use a multi-objective optimization model to optimize the crop planting structure. For example, Davis et al. (2017) identified global crop planting patterns that can minimize the crop demand for blue and green water (rainwater that will not become runoff), and increase calorie and protein production by combining a process-based crop water model with maps of spatially interpolated yields for 14 major food crops. However, the allocation of global crop production changed significantly. Neamatollahi et al. (2018) aimed to maximize the net income of farmers, minimize agricultural water use, minimize the use of chemical fertilizers and chemical pesticides, reduced agricultural water consumption by 27% in the Mashhad Plain, but significantly reduced the planting area of crops such as wheat and barley. Under constraints or other objectives, there is a trade-off between the water-saving potential and crop production allocations on each scale. The conclusions of the above studies ignore the realistic constraint of the stability of crop production allocations, and it is difficult to achieve the corresponding optimization results in the production practice within the effective time. Hoekstra (2003) proposed the concept of the water footprint in 2002. It refers to the total water consumption of a product in the entire production supply chain at a specific time and place. In agricultural production, the consumption water footprint includes the BWF and green water footprint (Hoekstra et al., 2011). Only part of the irrigation water supplied forms the evapotranspiration of crops, which is utilized and produced by crops. The remaining return flow is used for other purposes through runoff and groundwater recharge (Hoekstra and Mekonnen, 2012; Zhao et al., 2016; Zhuo et al., 2016). The BWF of crop production represents the actual consumption of irrigation water by crops, and it is a more accurate measure of water resource occupation by crop production activities (Hoekstra and Mekonnen, 2012). Reducing the BWF of crop production rather than reducing the return flow is the real improvement in crop water use efficiency (Zhao et al., 2016).
Therefore, to ensure the stability of the crop production allocation and improve the feasibility of the scheme, we take, as the optimization objectives, the minimum BWF of crop production, maximum calorie production (CP), and production of each crop to be not lower than the production level of the reference year. Furthermore, we sought to adjust crop production allocations to achieve blue water-saving and improve the calorie supply. Using China as an example (Figure 1), this study selects 9 main crops for optimization whose calories provided Chinese residents with 81% of the daily calories supplied by all fruits, oil crops, cereals, starchy roots, and vegetables (FAOSTAT Food Agriculture Organization of the United Nations, 2014). Specifically, the cereal and oil crops considered in this study accounted for 98 and 93% of all cereal and oil crops consumption as food, respectively (FAOSTAT Food Agriculture Organization of the United Nations, 2014). Additionally, we establish the provincial scale crop planting structure optimization model using the non-dominated sorting genetic algorithm II (NSGA-II) (Deb et al., 2002).
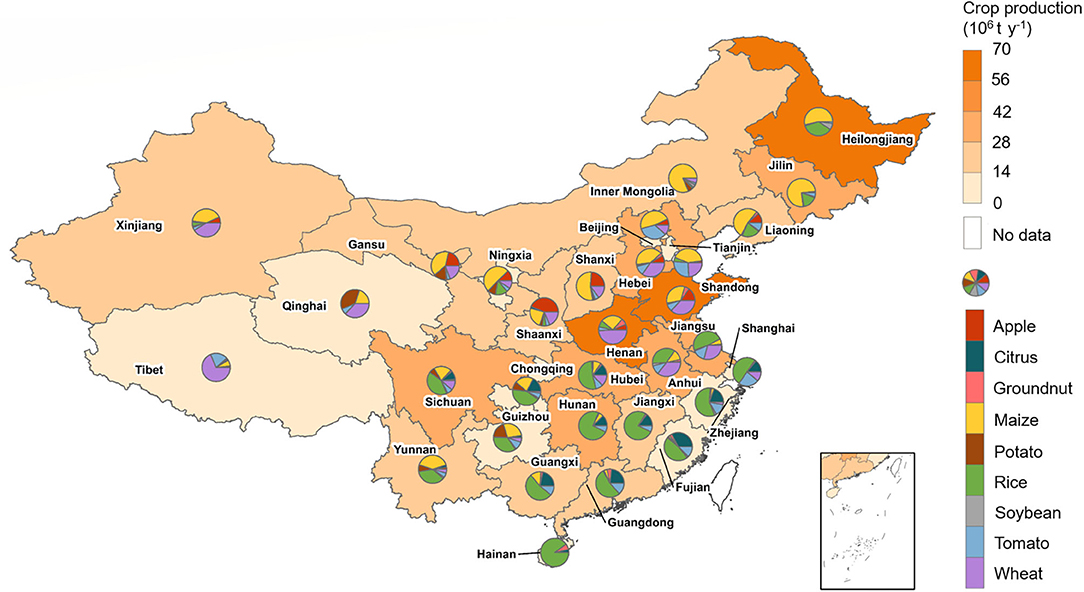
Figure 1. Distribution of total production and production proportion of 9 crops in Chinese mainland provinces (2014).
Materials and Methods
Data Sources
The yield and planting area of each province was obtained from NBSC National Bureau of Statistics (2014). The data of daily precipitation, daily mean maximum temperature, and daily mean minimum temperature of 698 meteorological stations used for the Aquacrop model were retrieved from CMDC (2014). The irrigation and rainfed areas of 9 crops came from MIRCA2000 (Portmann et al., 2010). The soil texture data were obtained from the ISRIC database (Dijkshoorn et al., 2008). The soil water content data were taken from Batjes (2012). The date of crop planting refers to Chen et al. (1995). The harvest index was from Zhang and Zhu (1990) and Xie et al. (2011). Crop growth period and maximum root depth were obtained from Allen et al. (1998) and Hoekstra and Chapagain (2007). The calorie content of crops was provided by the FAO “Nutritive Factors” database (FAO Food Agriculture Organization of the United Nations, 2012).
Calculating BWF per Unit Mass of Crop
The BWF per unit mass of crop (uBWF, m3 kg−1) is calculated from the daily blue evapotranspiration (ETb[t], mm) and crop yield (Y, kg ha−1) during the growing period (Hoekstra et al., 2011) as follows:
where 10 is the conversion coefficient and gp (d) refers to the length of the growing period. The ETb[t] and Y during the growth period were simulated using the AquaCrop model. AquaCrop is a water-driven crop growth model developed by the FAO. Compared with other crop growth models, it has fewer parameters for yield and water response studies and provides a better balance between simplicity, accuracy, and robustness (Hsiao et al., 2009). The simulated values of crop yield at each station acquired from the model are aggregated by province and checked at the provincial scale by using national statistical data.
The dynamic soil water balance in the AquaCrop model is demonstrated in the formula:
where S[t] (mm) is the soil moisture content at the end of day t. PR[t] (mm) and IRR[t] (mm) are the rainfall and the quantity of irrigation on day t, respectively. CR[t] mm is the capillary rise from groundwater. RO[t] (mm) and DP[t] (mm) refer to the surface runoff generated by rainfall and irrigation, and the quantity of deep percolation on day t, respectively. RO[t] is obtained from the Soil Conservation Service curve-number equation (USDA, 1964; Rallison, 1980; Steenhuis et al., 1995):
where Ia (mm) is the initial water loss before surface runoff. S (mm) refers to the maximum potential storage, which is a function of the soil curve number. DP[t] mm is determined by the drainage capacity (m3 m−3day−1). When the soil water content is less than or equal to the field capacity, the drainage capacity equals 0 (Raes et al., 2017) The daily inflow and outflow at the root zone boundary are simulated using the AquaCrop model. On this basis, we used the BWF calculation framework (Chukalla et al., 2015; Zhuo et al., 2016) combined with the model of soil water dynamic balance to separate the daily blue ET (mm). The formula is:
where Sb[t] represents the blue soil water content at the end of day t. According to Siebert and Döll (2010), we set the initial soil moisture as the maximum soil moisture of rainfed fallow land 2 years before planting. Simultaneously, we assume that the initial soil water during the growing period is green water (Zhuo et al., 2016).
Calculating BWF per Unit of Calorie Production and Calorie Production per Unit Area
The BWF per unit of calorie production (ucBWFc, m3 kcal−1) refers to the quantity of blue water required to produce 1,000 calories. The BWF per unit of calorie production for crops was calculated from the BWF per unit mass of crops (uBWF, m3 kg−1) and the calorie content per unit mass of crops (CC, kcal kg−1) (FAO Food Agriculture Organization of the United Nations, 2012). The BWF per unit of calorie production in crop production for a country (ucBWFn, m3 kcal−1) is calculated from the total BWF (BWF, m3 y−1) for crop production and CP (CP, kcal y−1):
The CP per unit area of crops (YC, kcal ha−1) refers to the calories provided by the crop produced per unit area, and is calculated from yield and calorie content per unit mass of crops:
Multi-Objective Optimization
NSGA-II is an effective multi-objective evolutionary algorithm (Deb et al., 2002) and has been widely used to find optimal solutions for optimization problems (Penn et al., 2013; Reed et al., 2013; Zhang et al., 2014; Ye et al., 2018). Based on the principle of evolution, it iterates from an initial population through random selection, crossover, and mutation. After the survival of the fittest, the population finally converges into a group of individuals who are most suitable for the environment, thus obtaining a Pareto-optimal solution set (a solution is called Pareto optimal if none of the objective functions can be improved without degrading several of the other objective values) (Ömer Faruk and Mehmet Bülent, 2018).
In this study, a multi-objective optimization model is established based on NSGA-II, and the methodology flowchart is displayed in Figure 2. In the process of optimization, we assume that the proportion of irrigated and rainfed areas and the yield of each crop in each province of China are consistent with the reference year (2014), so the BWF of each crop in each province is constant. The planting structure of 9 crops in China was the control variable of this optimization, and the following two constraints were considered. First, the total planting area of crops in each province remains unchanged. Second, the total CP of the entire country is greater than or equal to the CP of the reference year. For each crop planting structure, the corresponding BWF, CP, and the degree of crop production no lower than the production level of the reference year was calculated:
where BWF (m3 y−1), CP (kcal y−1), and SC refer to the total BWF, total CP, and score of crop production no lower than the production level of reference year in China, respectively. The SC was aimed to measure the feasibility of the scheme. uBWFi, j (m3 kg−1), Ai, j (ha y−1), Yi, j(kg ha−1), and Pi, j (kg y−1) refer to the BWF per unit mass, planting area, yield, and production of crop j in the reference year, respectively. For province i, which has never planted crop j, we assume that it is not suitable for planting this crop, so the yield of the corresponding crop is 0. CCj (kcal kg−1) is the calorie content per unit mass of the crop (FAO Food Agriculture Organization of the United Nations, 2012). SCj is an index to evaluate the degree of national crop j production (Pj,kg y−1), which is not lower than the production level of the reference year, using the scoring system. If crop j production is greater than or equal to the production of crop j in the reference year (, kg y−1), plus one point; otherwise, the deviation degree is calculated as follows:
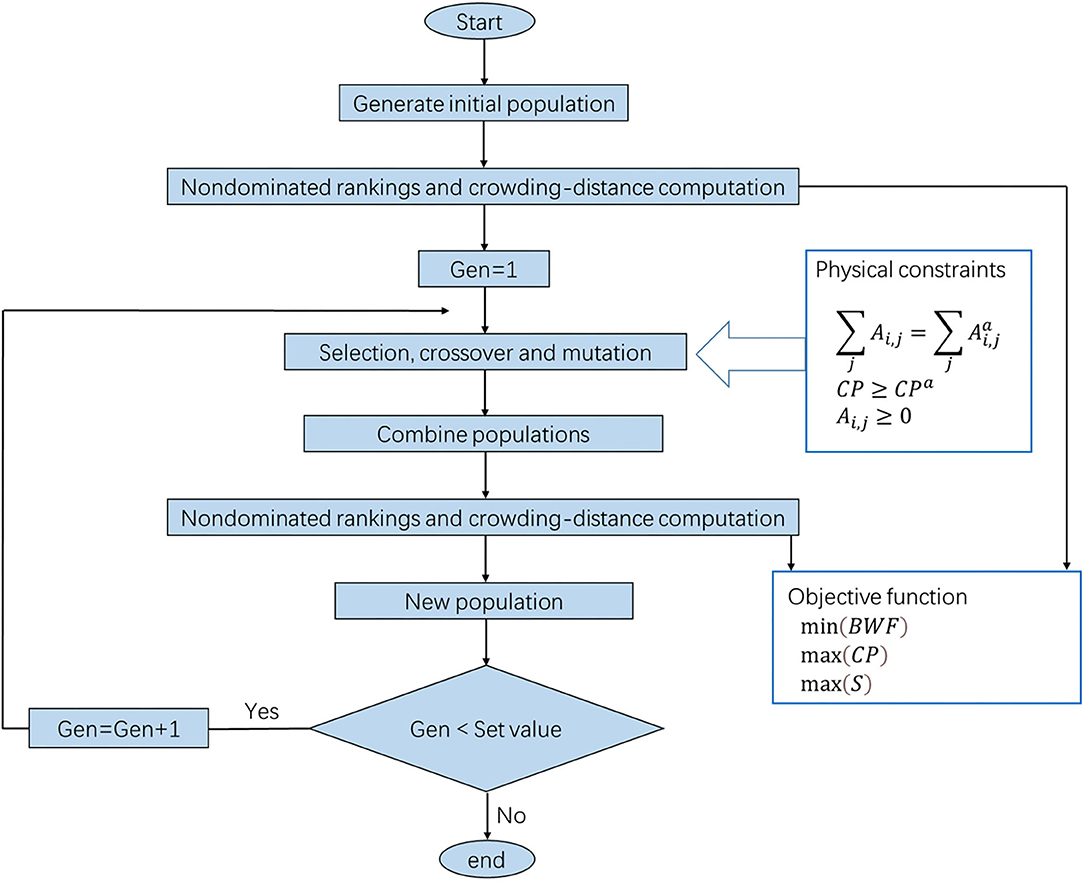
Figure 2. Methodology flowchart. Each national crop planting structure represents an individual, and these different individuals form a population. By calculating the BWF, CP, and the degree of crop production no lower than the production level of reference year of everyone, the relatively optimal individual is selected as the new parent population. After iteration and evolution, it approximates the optimal population.
The goals of the optimization are to minimize the BWF of crop production, maximize CP, and crop production is no lower than the production level of the reference year. The three objective functions are as follows:
Owing to the acceleration of urbanization and industrialization in China, cultivated land resources are constantly being occupied (Liu et al., 2020; Sun et al., 2020). The Chinese government has issued a “red line” policy, which limits the area of cultivated land in China and each province to ensure national and regional food security (Seto and Ramankutty, 2016; MNRPRC Ministry of Natural Resources of the People's Republic of China, 2017). Under such conditions, the cultivated land area of the entire country and each province undergoes little change (NBSC National Bureau of Statistics, 2019). Therefore, we assume that the total planting area of each province is constant, and the planting area of each crop in each province is not negative. Unlike land, which is immobile, water resources can be regulated within a space, such as the allocation and regulation of trans provincial river basins and the South-North Water Transfer Project. Moreover, the actual water consumption of each province does not represent the optimal allocation, and the constraints on the water consumption of each province will seriously reduce the search space for optimization, resulting in unsatisfactory results. Therefore, this study does not restrict the water consumption of each province. Additionally, to ensure an increase in CP, we restrict the total CP to be greater than or equal to the actual CP. The constraints are as follows:
where (ha y−1) is the planting area of crop j in province i of the reference year, and CPr (kcal y−1) is the total CP in China of the reference year.
After obtaining Pareto solutions, we use the BWF per unit of calorie production in crop production for China (ucBWFn) as an external criterion to select the planting structure with the highest water-use efficiency in each scored segment for analysis and comparison.
Results
BWF of Crop Production and Calorie Production in the Reference Year
In the reference year, the Chinese total BWF and CP were 186.2 billion m3 y−1 and 1925.4 billion kcal y−1 for 9 crop production, respectively. Among the provinces (Figure 3A), Henan was the region with the highest crop production, accounting for 10% of the total crop production in China (Figure 1). Therefore, its BWF (~21.3 billion m3 y−1) of crop production and CP (~211.6 billion kcal y−1) were the highest (Figure 3), accounting for 11% of the national BWF of crop production and CP. Since the crop production in both Qinghai and Tibet was <1% of the total Chinese crop production, their BWF (~120 million m3 y−1) of crop production and CP (~913 million kcal y−1) were the lowest—both <1% of the national BWF of crop production and CP.
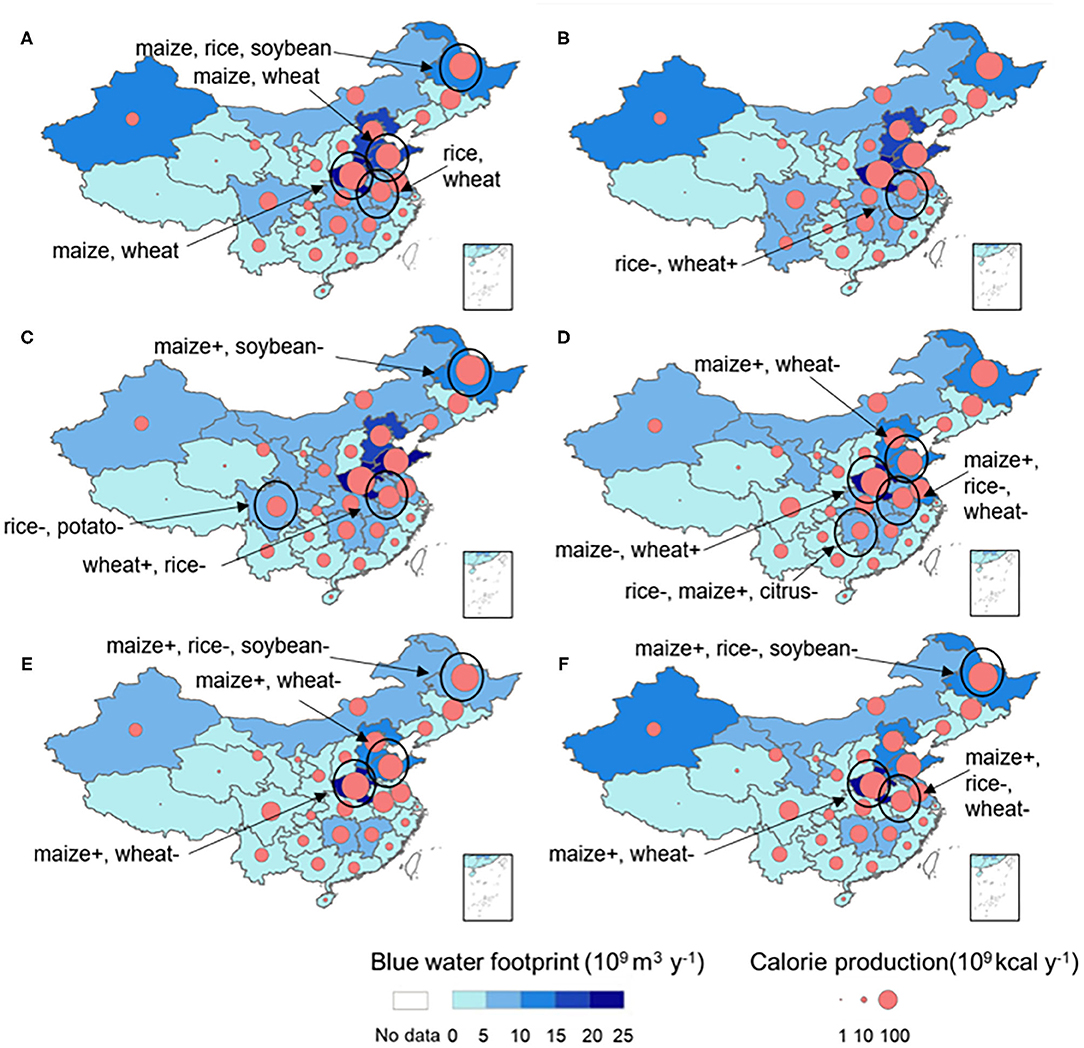
Figure 3. Spatial distribution of BWF and CP in China under different crop production allocations. The six maps correspond to reference (A), Rice - (B), Potato - (C), Citrus - (D), Maize + (E), and Maize ++ (F). The darker the color of each region, the larger the BWF of crop production; the size of the pink circle represents the value of CP in each province. The regions with large adjustment of crop planting area are marked in the figure, and the texts indicate the increase (+) or decrease (–) state of corresponding crop planting area.
In the reference year, the BWF per unit of calorie production and the CP per unit area of each crop in each region differed more significantly between crops than provinces (Figure 4). The difference in BWF per unit of calorie production and CP per unit area among crops were mainly related to the BWF per unit mass and crop yield. Under the national average, citrus not only had the largest BWF per unit of calorie production (~183 m3 10−3 kcal−1) (Figure 4A) but also had a lower CP per unit area, which was only 4 kcal ha−1 (Figure 4B). Although potato had the smallest BWF per unit of calorie production (~16 m3 10−3 kcal−1), it had the lowest CP per unit area (~3 kcal ha−1). Owing to the high yield and calorie content per unit mass, maize, rice, and wheat as the three staple crops were the three crops with the highest CP per unit area. Among them, the BWF per unit of calorie production of maize was relatively low (~59 m3 10−3 kcal−1). Simultaneously, the CP per unit area of maize was the highest (~20, 680 kcal ha−1) because of its higher calorie content per unit mass. The BWF per unit of calorie production of rice and wheat were relatively high, 1.9 and 2.4 higher than that of maize, respectively. Additionally, the CP per unit area was 92 and 85% of that of maize, respectively. By comparison, maize was a crop with advantages in saving blue water and increasing CP.
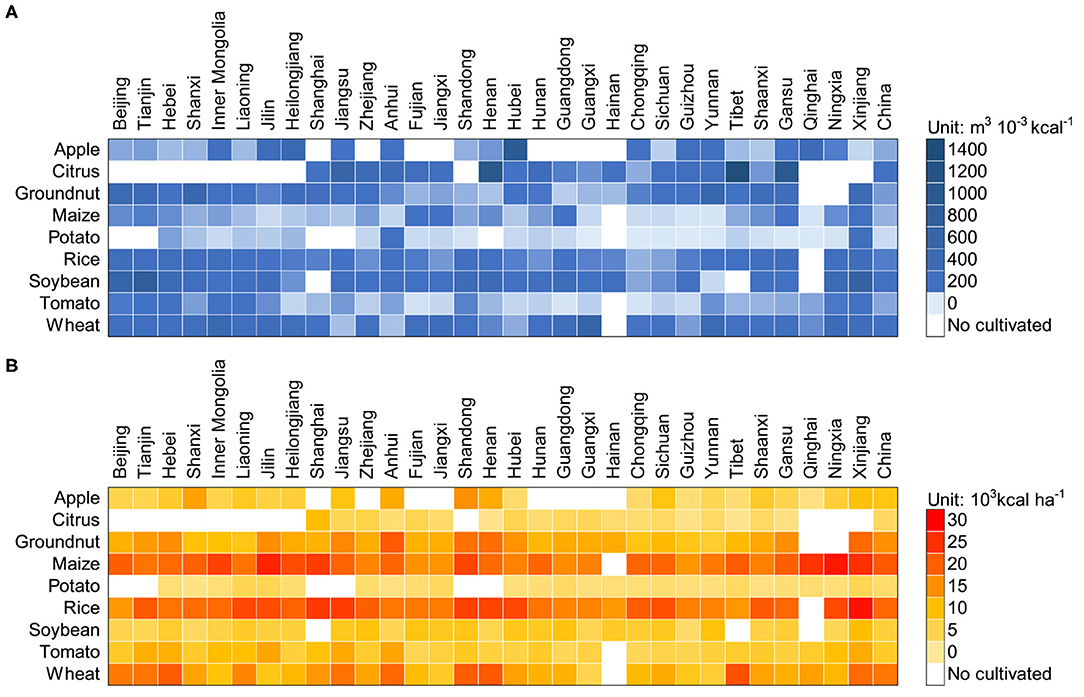
Figure 4. Spatial difference of BWF per unit of calorie production (ucBWF) and CP per unit area (YC) of crops. (A,B) reveal the BWF per unit of calorie production and the CP per unit area of different crops planted in different regions, respectively.
The differences in the BWF per unit of calorie production and the CP per unit area of crops in different regions were mainly caused by the local climate and yield levels (Figure 4). Xinjiang, Gansu, and Ningxia had a higher BWF per unit of calorie production of crops, and at least 6 crops had higher BWFs per unit of calorie production than the national average. The BWF per unit mass of the crop in these three provinces was generally higher than the national average because they are located in the arid northwestern region of China with an average annual rainfall of 23, 43, and 58% of the national level, respectively. Additionally, they rely on irrigated agriculture (MWRPRC Ministry of Water Resources of the People's Republic of China, 2014; NWC Ningxia Water Conservancy, 2014; WRDG Water Resources Department of Gansu, 2014; WRDX Water Resources Department of Xinjiang, 2014), and have relatively high evapotranspiration (Wang et al., 2019). The BWF per unit of calorie production of crops in Chongqing and Sichuan were relatively low. As a result, the BWF per unit mass of crops in these provinces was generally lower than the national average due to the abundant rainfall (SPDRD Sichuan Provincial Water Resources Department, 2014; WRBC Water Resources Bureau of Chongqing, 2014) and humid climate in these regions. As far as the CP per unit area of each crop, Shandong and Henan were higher, while Guizhou, Guangxi, and Jiangxi provinces were lower. This was related to the yield of crops.
Results of Multi-Objective Optimization
Figure 5 illustrates the Pareto solution set obtained by NSGA-II. According to the situation of crop production allocations displayed on the z-axis, we divided the results into 5 categories (8–9, 7–8, 6–7, 5–6, and 4–5) based on scores. A score of 9 indicated that all crop productions were higher than or equal to the production level of the reference year and the scheme was the easiest to implement. The lower the score, the farther away the crop production allocation was from the goal of not lowering the reference production level. All solutions were from 4–9 points. The crop production allocations <4 points were eliminated because the CP constraint could not be met. There was an obvious trade-off between the BWF of crop production, CP, and the degree of no lower than the reference production level in the solutions. Comparing the BWF of crop production and CP in each scored segment with the reference year, we found that the crop production allocations in 5–6 points with the largest BWFs reduction (17–32%) increased the CPs (4–13%) second only to those of 6–7 points. The crop production allocations in 6–7 points increased the largest CPs (10–20%), but the BWFs were 0.8–1.1 times that of the reference year. Although the crop production allocations in 8–9 points were the solutions with the highest degree of no lower than the reference production level, their corresponding BWFs were reduced the least (0–5%), and the CP was almost unchanged.
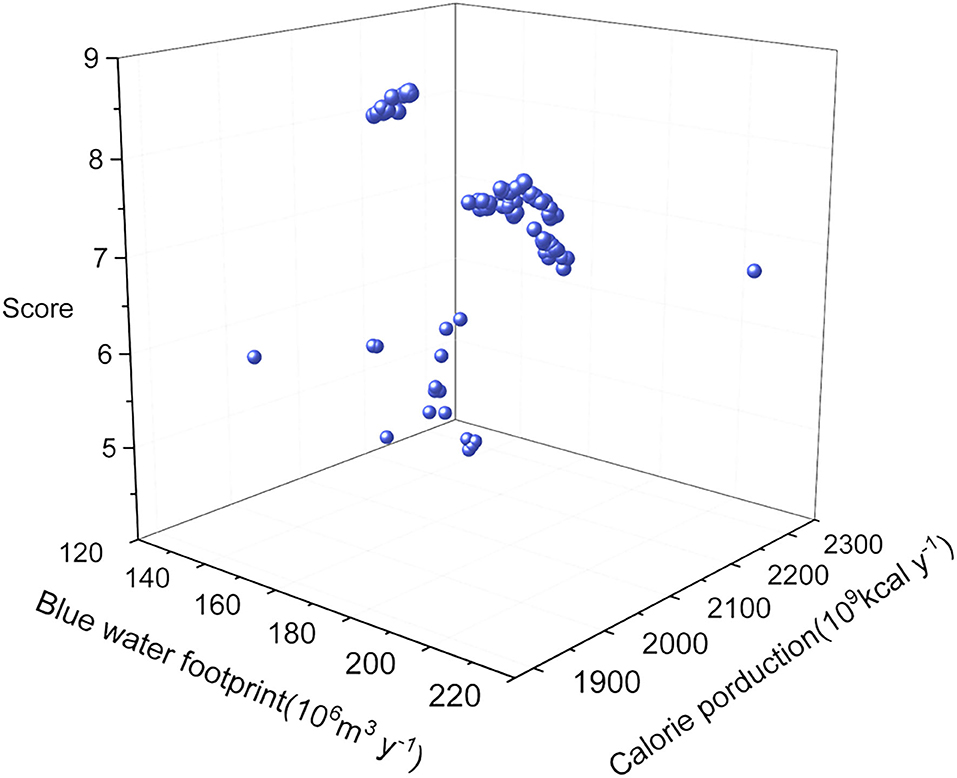
Figure 5. Pareto solution set obtained by NSGA-II. Each point in the figure represents an optimization result.
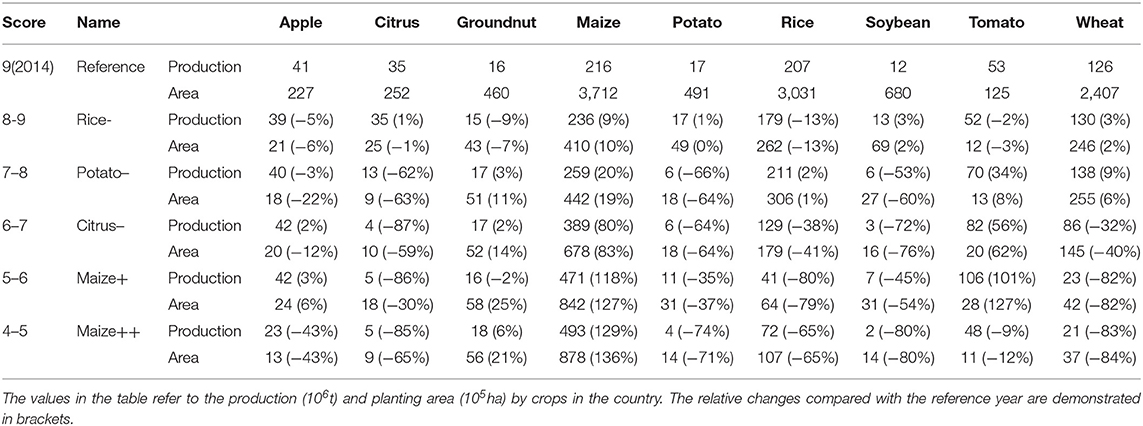
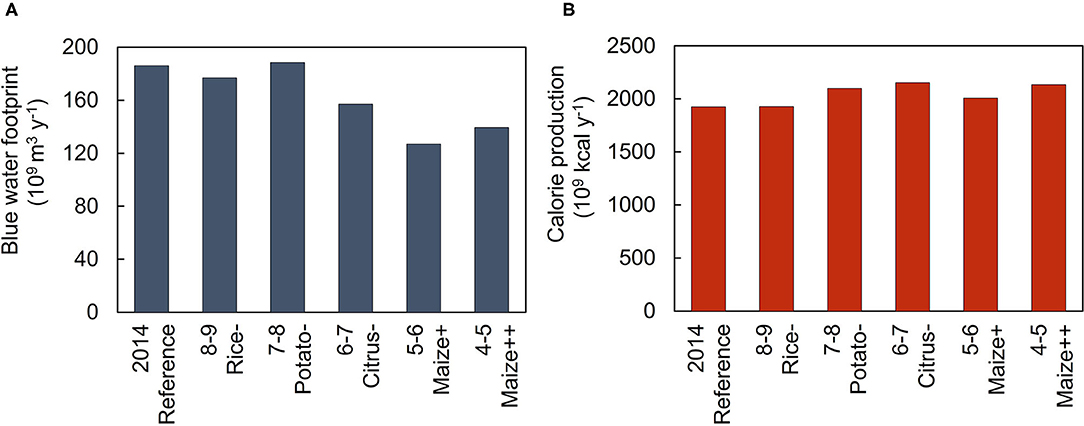
In the five scored segments, we selected the optimization results with the smallest BWF per unit of calorie production in the country as a representative for further analysis (Figure 6). The total production and planting area of various crops of each representative is showed in Table 1. According to this, each optimization result was named according to the crop with the largest relative change and its change state (“+” represents increase and “–” represents decrease) in production (Table 1, see Data Sheet for the data of crop planting area, crop production, BWF of crop production and CP of crop production in Chinese provinces under different crop production allocations). Figure 6A illustrates that the farther the crop production allocation is from the goal of no lower than the reference production level (the lower the score), the smaller its BWF per unit of calorie production is, with Maize + reaching the lowest (~35% reduction compared to the reference year). Simultaneously, the relative contribution of crops to the BWF of crop production, CP, and crop production changed significantly (Figure 6). The proportion of maize in the BWF of crop production, CP, and crop production increased significantly by 193, 106, and 140%, respectively. The proportion of rice was significantly reduced by 53, 69, and 63%, respectively. Except for the reference year, Rice—had the highest BWF per unit of calorie production (~91 m3 10−3 kcal−1). Similar to the reference year, regarding the BWF for crop production in Rice -, the BWF of rice production accounted for the largest proportion of the total BWF, at 32%. However, maize was the largest contributor to CP and crop production, accounting for 44 and 33%, respectively. Maize + had the lowest BWF per unit of calorie production (~63 m310−3 kcal−1), and was the crop with the largest proportion of its BWF of crop production, CP, and crop production, accounting for 76, 84, and 65%, respectively.
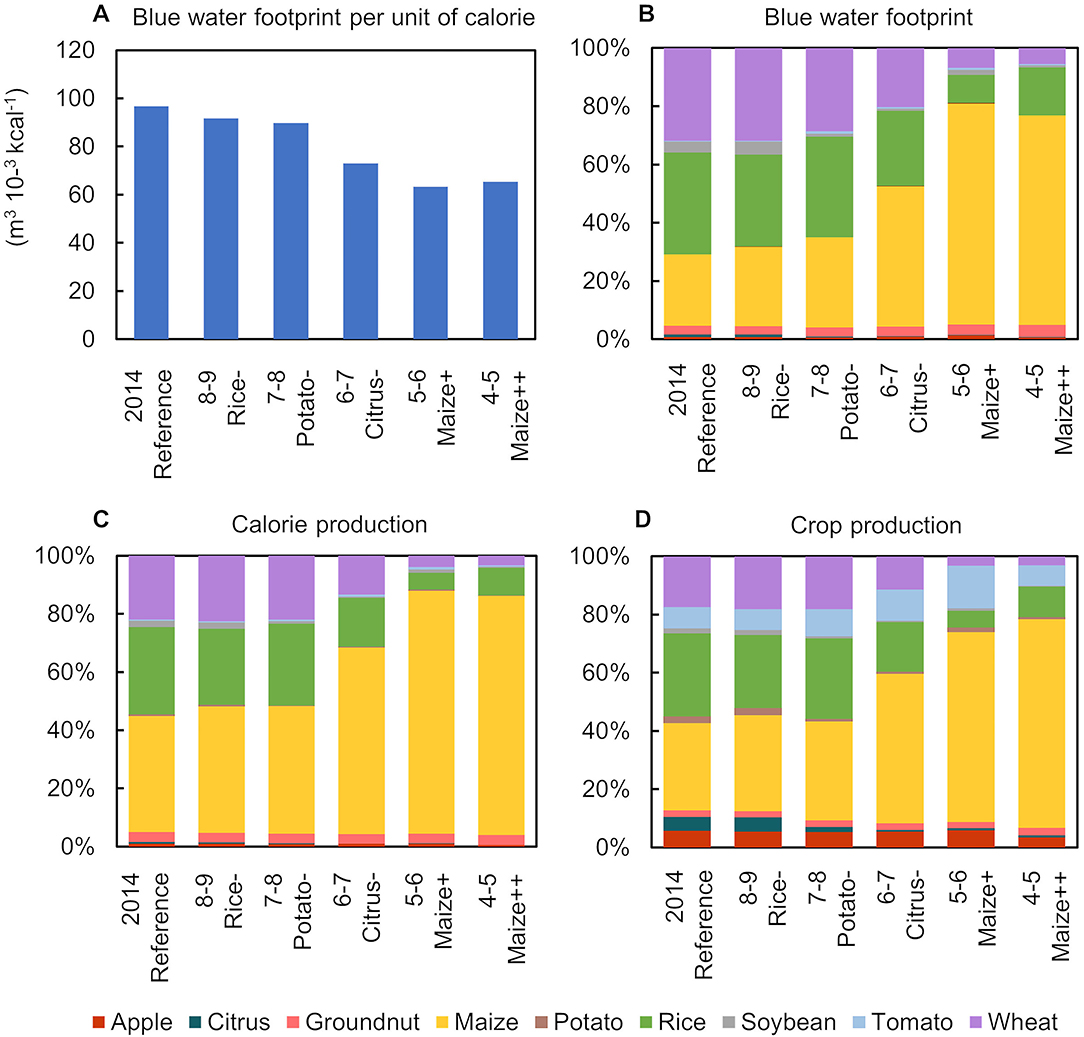
Figure 6. Characteristics of different crop production allocations. The BWF per unit of calorie production in different crop production allocations (A), relative contribution of crops to the BWF of crop production (B), calorie production (C), and crop production (D) under different crop production allocations (the legend below is for B–D).
Crop Production Allocations for Saving Blue Water and Improving Calories Supply
Under all crop production allocations, the national BWF of crop production and CP were reduced and increased by varying degrees, respectively, but the areas with a large BWF of crop production and CP were unchanged (Figures 3B–F, 7). Among the different optimization results, Maize +, Citrus –, and Rice—all effectively achieved the goals of reducing the BWF and increasing the CP (Figure 7). Compared with the reference year, Maize + increased the production of maize and tomato (with a low BWF per unit of calorie production of approximately 70 m3 10−3 kcal−1) by 118 and 101%, respectively, its BWF of crop production was reduced the most (~32%) and the CP, increased by 4% (Figure 7). Under this crop production allocation, the BWFs of crop production in all provinces were reduced by varying degrees (Figure 3). Among them, wheat and rice production in Yunnan was reduced (decreased by 98 and 89%, respectively). Its BWF was reduced the most (~80%). The CP did not increase in any of the provinces. The province with the highest increase was Anhui (~14%), which was due to an increase in maize production by 495%. The province with the largest decrease in CP was Henan (~1%) because of its 73% reduction in wheat production. Simultaneously, Henan still had the highest BWF of crop production (~20.5 billion m3 y−1), accounting for 16% of the national BWF of crop production. This is because wheat and maize production in Henan was 38 and 11% of the Chinese total crop production, respectively, and the BWF per unit of calorie production of maize was 1.6 times the national average. Due to the increase in maize production (~69%), Heilongjiang had the highest CP (~214.7 billion kcal y−1), accounting for 11% of the national total CP. Qinghai still had the lowest BWF (~40 million m3 y−1) of crop production, which was <1% of the national total BWF of crop production, and Tibet still had the lowest CP (~930 million kcal y−1), which was <1% of the national total CP. This was because their crop production was lower than 1% of the national total crop production.
The Citrus-'s BWF of crop production was reduced by 16%, and its CP increased the most (~12%) (Figure 7). This was mainly due to the increase in maize production (~80%) and a decrease in citrus production (~87%). Under this crop production allocation, the province with the largest increase in the BWF of crop production was Hubei (~33%) because of a 71% increase in rice production. Simultaneously, Shandong became the province with the largest reduction in BWF of crop production (~32%) due to an 87% reduction in wheat production. Sichuan had the largest increase in CP (~28%) due to a 274% increase in maize production. However, Shanxi had the largest reduction in CP (~1%) because of a 79% reduction in wheat production. Henan was the main wheat-producing area, accounting for 77% of the national production. Thus, its BWF of crop production (~23.2 billion m3 y−1) and CP (~226.6 billion kcal y−1) was the highest, accounting for 15 and 11% of the total BWF and CP of national crop production, respectively. Qinghai (~41 million billion m3 y−1) and Tibet (~950 million kcal y−1) remained the provinces with the lowest BWF of crop production and the lowest CP, respectively, both of which were <1% of the national BWF of crop production and CP.
Although Rice- was closest to the goal of not lowering the reference production level, its BWF of crop production was only reduced by 5%, and its CP increased by <1% (Figure 7). Regarding changes in the BWF of crop production in various regions, Shanxi had the largest increase in the BWF of crop production (~17%) because of the increase in wheat production (~56%). Anhui had the largest reduction in BWF of crop production (~45%) due to the reduction in rice production (100%). Regarding changes in the CP of various regions, except for Qinghai and Gansu whose CP decreased by 20 and 10%, respectively, the changes in CP in other regions were relatively small (~± 6%). The regions with the highest and lowest BWF of crop production and CP were consistent with the reference year (Figure 3).
Discussion and Conclusion
In this study, for the first time, we take the minimum BWF, maximum CP, and each crop production no less than the reference level as optimization objectives, and evaluate the impact of different crop production allocations on water saving and CP under certain conditions. At present, the research results at different scales all reveal a phenomenon where there is a trade-off between the water-saving of each scale and crop production allocations under the limits of constraints or other objectives (Davis et al., 2017; Osama et al., 2017; Neamatollahi et al., 2018). However, these studies ignore the stability of crop production allocations and the feasibility of the optimization scheme. Only when we pay attention to this point can we formulate a more reliable water-saving plan and explore more ways to achieve the security and sustainability of food supplies.
Therefore, we consider nine major crops in China as an example and establish a model of multi-objective optimization to obtain the Pareto solutions through NSGA-II to determine the trade-off between the BWF of crop production, CP, and crop production allocations. The Pareto solution set obtained in this study is only approximate to the optimal solution set rather than the optimal solution set. Generally, it is just able to approach the optimal solutions infinitely (Liu Y. et et al., 2018).
Among all the crop production allocations, maize and citrus were the crops with the largest increase and decrease in the planting area, respectively. As a result of the smaller BWF per unit of calorie production and the highest CP per unit area of maize, it can consume less blue water to produce higher calories (Meng et al., 2017; Zhong et al., 2017; Luo et al., 2018). However, citrus had the highest BWF per unit of calorie production and lower CP per unit area, so citrus planting cannot achieve the purpose of saving blue water and providing high calories. Under all crop production allocations, in terms of regions, Henan, Anhui, Shandong, and Heilongjiang had larger adjustments of the planting area, while Beijing, Hainan, and Tibet had smaller adjustments. This was determined by their adjustable planting area. Compared with the reference year, among the different crop production allocations, Maize + had significant blue water saving (~32%) with the BWFs for crop production in all provinces reduced, and its CP increased by 4%. Under this solution, the planting area of maize was increased by 127%, and the planting areas of citrus, wheat, and rice were reduced by 84, 82, and 79%, respectively. Among them, Henan had the largest adjustment in the planting area of various crops, whose maize planting area increased by 6, 346 thousand hectares, and wheat planting area reduced by 3,970 thousand hectares. Although Maize + had high blue water saving, it would be difficult to implement this scheme. Because wheat and rice are staple crops in China, the production of which would be reduced by 82 and 80%, respectively. Additionally, Citrus—had a good performance in reducing the BWF (~16%) of crop production and increasing CP (~12%). Under such a solution, the planting area of maize increased by 83%, and that of citrus decreased by 86%. Among them, Henan still had the largest adjustment in planting area, whose wheat planting area increased by 5,435 thousand hectares, and maize planting area decreased by 3,284 thousand hectares. Henan was the only province except Heilongjiang that increased the wheat planting area, and the increase in maize planting area was reflected in other provinces. This is because Henan has advantages in wheat planting on account of the wheat grown in Henan with a low BWF per unit of calorie production (~103 m310−3 kcal−1) and the highest CP per unit area (~20.6 kcal ha−1). In this solution, national rice and wheat production was reduced by 38 and 32%, respectively. Compared with other solutions, there is a better ability to meet the production of various crops and better effect of saving blue water and improving CP in Citrus–, which is a more easily realizable crop production allocation for the security and sustainability of food supplies.
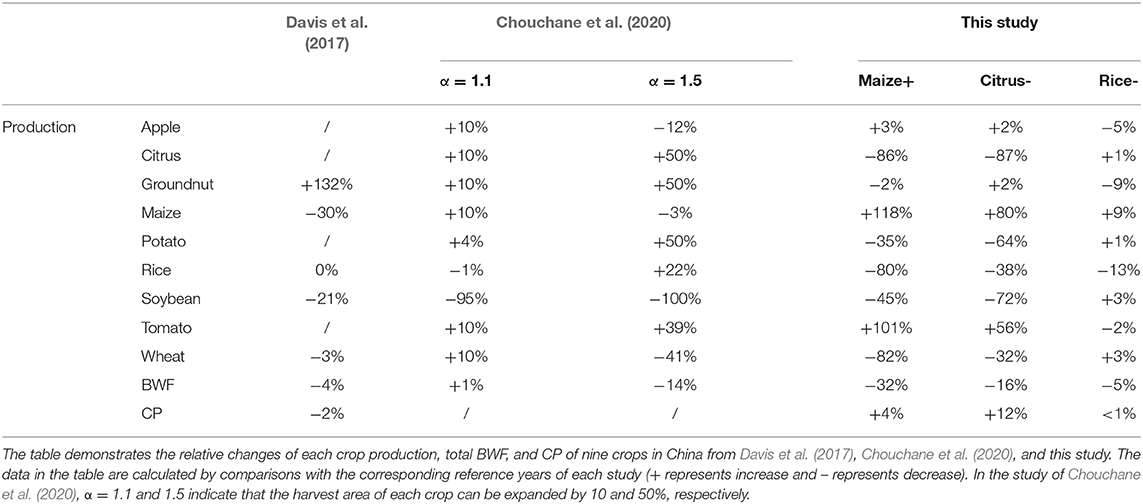
When changing the crop production allocations in China, Maize +, Citrus–, and Rice—effectively achieved the optimization objectives of reducing the BWF of crop production and increasing the CP. These results suggest that the change in crop production allocations has significant effects on the reduction of BWF and the increase in CP, and the increase in maize production is the primary reason for the realization of these two goals. Regarding reducing the BWF of crop production, the role of maize is consistent with other research results (Meng et al., 2017; Zhong et al., 2017; Luo et al., 2018). In this study, soybean and wheat production decreased and tomato production increased in Maize + and Citrus–, which is consistent with the results of Chouchane et al. (2020) (Table 2). Moreover, Chouchane et al. (2020) pointed out that China has comparative advantages in soybean and wheat planting, and has a comparative disadvantage in tomato planting. In the study of Davis et al. (2017), soybean production is also reduced in the optimization, but the production changes of other crops are not consistent with this paper. This is mainly due to the low coincidence between the crops selected in their research and this study, and the crop productions in their research do not achieve the optimization objectives of reducing the BWF of crop production and increasing the CP simultaneously. Additionally, increasing maize production can effectively meet the growing demand for feed crops and alleviate the resulting crisis of edible crops (SCIOPRC State Council Information Office of the People's Republic of China, 2019).
This study has several limitations. First, in terms of economy, the state pays more attention to food security, and farmers with profit loss due to the adjustment of planting structure should be given corresponding subsidies; while in downscaled regional scale, the change of farmers' income cannot be ignored. In terms of society, Chinese current calorie supply has reached the affluent level (3,000 kcal cap−1 day−1) (Yu, 2019). More comprehensive consideration should be given to residents' nutrient intake (protein, fat, nutrient trace elements, etc.) and food diversity (meat, dairy products, etc.). However, due to the lack of data on agricultural product cost-benefit, dietary habits and nutrition intake data in provincial scale, these factors are not considered in this paper. These factors must be studied more comprehensively and carefully to ensure the implementation of the results to smaller local scales. Second, because that the NSGA-2 is only suitable for solving the problem of 2 or 3 optimization objectives (Deb and Jain, 2014), in the three objectives of this study, the optimization of water resources only involves blue water, while the green water sensitive to climate factors and water quality have not been involved. This should be the focus of future research. Third, we only consider adjusting the crop production allocations in mainland China from the perspective of production, without considering the impact of trade structure. However, these limitations do not affect the conclusions of this study. The adjustment of crop production allocations can alleviate the pressure on water resources due to population growth and other factors, and ensure the security and sustainable food supplies. For example, China can appropriately increase the planting area of maize and reduce the planting of citrus and other crops that consume more blue water and produce fewer calories. Additionally, reasonable irrigation water-saving technology (Sadler et al., 2005; Greenwood et al., 2010; Duan et al., 2020) and more sustainable food trade can also save water during food production. With the acceleration of the construction of the Chinese modern food circulation system (Chapagain et al., 2006; SCIOPRC State Council Information Office of the People's Republic of China, 2019), wise management of the flow of water resources embedded in food trade will be more conducive to water-saving and the alleviation of regional water pressure (Liu W. et al., 2018; Wu et al., 2019).
Data Availability Statement
The original contributions presented in the study are included in the article/Supplementary Material, further inquiries can be directed to the corresponding author/s.
Author Contributions
YL: software, methodology, validation, formal analysis, and writing—original draft. LZ and PW: conceptualization, writing—review and editing, and supervision. XY: software and data. XJ, ZY, and DZ: visualization and formal analysis. All authors contributed to the article and approved the submitted version.
Funding
The research was financially supported by the West Light Talent Program of the Chinese Academy of Sciences to LZ.
Conflict of Interest
The authors declare that the research was conducted in the absence of any commercial or financial relationships that could be construed as a potential conflict of interest.
Supplementary Material
The Supplementary Material for this article can be found online at: https://www.frontiersin.org/articles/10.3389/fsufs.2021.632199/full#supplementary-material
References
Allen, R. G., Pereira, L. S., Raes, D., and Smith, M. (1998). Crop Evapotranspiration-Guidelines for Computing Crop Water Requirements-FAO Irrigation and Drainage Paper 56. Rome: FAO.
Batjes, N. (2012). ISRIC-WISE Derived Soil Properties on a 5 by 5 Arc-Minutes Global Grid (ver. 1.2). Wageningen: Netherlands, Available online at: www.isric.org (accessed January 10, 2019).
Chapagain, A., Hoekstra, A., and Savenije, H. (2006). Water saving through international trade of agricultural products. Hydrol. Earth Syst. Sci. 10, 455–468. doi: 10.5194/hess-10-455-2006
Chen, Y., Guo, G., Wang, G., Kang, S., Luo, H., and Zhang, D. (1995). Main Crop Water Requirement and Irrigation of China. Beijing: Hydraulic and Electric Press.
Chouchane, H., Krol, M. S., and Hoekstra, A. Y. (2020). Changing global cropping patterns to minimize national blue water scarcity. Hydrol. Earth Syst. Sci. 24, 3015–3031. doi: 10.5194/hess-24-3015-2020
Chukalla, A., Krol, M., and Hoekstra, A. (2015). Green and blue water footprint reduction in irrigated agriculture: effect of irrigation techniques irrigation strategies and mulching. Hydrol. Earth Syst. Sci. Discussions 12, 4877–4891. doi: 10.5194/hess-19-4877-2015
CMDC (2014). China Meteorological Data Service Center. Available online at: http://data.cma.cn/en (accessed January 10, 2019).
Davis, K. F., Rulli, M. C., Seveso, A., and D'Odorico, P. (2017). Increased food production and reduced water use through optimized crop distribution. Nat. Geosci. 10, 919–924. doi: 10.1038/s41561-017-0004-5
Deb, K., and Jain, H. (2014). An evolutionary many-objective optimization algorithm using reference-point-based nondominated sorting approach, Part I: solving problems with box constraints. IEEE Trans. Evolut. Comput. 18, 577–601. doi: 10.1109/TEVC.2013.2281535
Deb, K., Pratap, A., Agarwal, S., and Meyarivan, T. (2002). A fast and elitist multiobjective genetic algorithm: NSGA-II. IEEE Trans. Evol. Comput. 6, 182–197. doi: 10.1109/4235.996017
Dijkshoorn, J. A., Engelen, V. W. P. V., and Huting, J. R. M. (2008). Soil and Landform Properties for LADA Partner Countries (Argentina, China, Cuba, Senegal, South Africa and Tunisia). Wageningen: ISRIC–World Soil Information and FAO.
Duan, C., Chen, G., Hu, Y., Wu, S., Feng, H., and Dong, Q. (2020). Alternating wide ridges and narrow furrows with film mulching improves soil hydrothermal conditions and maize water use efficiency in dry sub-humid regions. Agric. Water Manag. 245:106559. doi: 10.1016/j.agwat.2020.106559
FAO Food and Agriculture Organization of the United Nations (2012). Nutritive Factors. Rome. Available online at: www.fao.org/economic/the-statistics-division-ess/publications-studies/publications/nutritive-factors/en/ (accessed July 7, 2020).
FAOSTAT Food and Agriculture Organization of the United Nations (2014). FAOSTAT Statistics Database. Rome: FAOSTAT.
Greenwood, D. J., Zhang, K., Hilton, H. W., and Thompson, A. J. (2010). Opportunities for improving irrigation efficiency with quantitative models, soil water sensors and wireless technology. J. Agric. Sci. 148, 1–16. doi: 10.1017/S0021859609990487
Hoekstra, A. Y. (2003). Virtual Water Trade: Proceedings of the International Expert Meeting on Virtual Water Trade. Delft: UNESCO-IHE.
Hoekstra, A. Y., and Chapagain, A. K. (2007). Water footprints of nations: water use by people as a function of their consumption pattern. Water Resour. Manage. 21, 35–48. doi: 10.1007/s11269-006-9039-x
Hoekstra, A. Y., Chapagain, A. K., Aldaya, M. M., and Mekonnen, M. M. (2011). The Water Footprint Assessment Manual: Setting the Global Standard. London: Earthscan.
Hoekstra, A. Y., and Mekonnen, M. M. (2012). The water footprint of humanity. Proc. Natl. Acad. Sci. U.S.A. 109, 3232–3237. doi: 10.1073/pnas.1109936109
Hsiao, T., Heng, L., Steduto, P., Rojas-Lara, B., and Fereres, E. (2009). AquaCrop—the FAO crop model to simulate yield response to water: III. parameterization and testing for maize. Agron. J. 101, 448–459. doi: 10.2134/agronj2008.0218s
Liu, W., Antonelli, M., Kummu, M., Zhao, X., Wu, P., Liu, J., et al. (2018). Savings and losses of global water resources in food-related virtual water trade. Wiley Interdiscip. Rev. 6:e1320. doi: 10.1002/wat2.1320
Liu, X., Huang, Y., Xu, X., Li, X., Li, X., Ciais, P., et al. (2020). High-spatiotemporal-resolution mapping of global urban change from 1985 to 2015. Nat. Sustain. 3, 564–570. doi: 10.1038/s41893-020-0521-x
Liu, Y., Ishibuchi, H., Nojima, Y., Masuyama, N., and Shang, K. (2018). A Double-Niched Evolutionary Algorithm and Its Behavior on Polygon-Based Problems. Cham: Springer International Publishing, 262–273. doi: 10.1007/978-3-319-99253-2_21
Luo, J., Shen, Y., Qi, Y., Zhang, Y., and Xiao, D. (2018). Evaluating water conservation effects due to cropping system optimization on the Beijing-Tianjin-Hebei plain, China. Agric. Syst. 159, 32–41. doi: 10.1016/j.agsy.2017.10.002
Meng, Q., Wang, H., Yan, P., Pan, J., Lu, D., Cui, Z., et al. (2017). Designing a new cropping system for high productivity and sustainable water usage under climate change. Sci. Rep. 7:41587. doi: 10.1038/srep41587
MNRPRC Ministry of Natural Resources of the People's Republic of China (2017). Outline of national Land Planning (2016-2030). Available online at: http://www.mnr.gov.cn/zt/td/gtgh/201702/t20170205_1998937.html (accessed October 17, 2020).
MWRPRC Ministry of Water Resources of the People's Republic of China (2014). China Water Resources Bulletin 2014. Available online at: http://www.mwr.gov.cn/sj/tjgb/szygb/ (accessed October 17, 2020).
NBSC National Bureau of Statistics (2014). National Data. Beijing. Available online at: http://data.stats.gov.cn/english/easyquery.htm?cn=E.0103 (accessed October 17, 2020).
NBSC National Bureau of Statistics (2019). National Data. Beijing. Available online at: http://data.stats.gov.cn/english/easyquery.htm?cn=E0103 (accessed October 17, 2020).
Neamatollahi, E., Vafabakhshi, J., Jahansuz, M. R., and Sharifzadeh, F. (2018). Agricultural optimal cropping pattern determination based on fuzzy system. Fuzzy Inform. Eng. 9, 479–491. doi: 10.1016/j.fiae,.2017.12.004
NWC Ningxia Water Conservancy (2014). Ningxia Water Resources Bulletin 2014. Available online at: http://slt.nx.gov.cn/ (accessed October 17, 2020).
Ömer Faruk, Y., and Mehmet Bülent, D. (2018). “Evolutionary algorithms for multi-objective scheduling in a hybrid manufacturing system,” in Handbook of Research on Applied Optimization Methodologies in Manufacturing Systems, eds. Y. Ömer Faruk and T. Süleyman. (Hershey, PA: IGI Global), 162–187. doi: 10.4018/978-1-5225-2944-6.ch008
Osama, S., Elkholy, M., and Kansoh, R. M. (2017). Optimization of the cropping pattern in Egypt. Alexandria Eng. J. 56, 557–566. doi: 10.1016/j.aej.2017.04.015
Penn, R., Friedler, E., and Ostfeld, A. (2013). Multi-objective evolutionary optimization for greywater reuse in municipal sewer systems. Water Res. 47, 5911–5920. doi: 10.1016/j.watres.2013.07.012
Portmann, F., Siebert, S., and Doell, P. (2010). MIRCA2000 - global monthly irrigated and rainfed crop areas around the year 2000: a new high-resolution data set for agricultural and hydrological modeling. Global Biogeochem. Cycles 24:GB1011. doi: 10.1029/2008GB003435
Raes, D., Steduto, P., Hsiao, T. C., and Fereres, E. (2017). Reference Manual for AquaCrop version 6.0 - Chapter 3. Rome: Food and Agriculture Organization.
Rallison, R. (1980). “Origin and evolution of the SCS runoff equation,” in Symposium on Watershed Management (New York, NY: ASCE), 912–924.
Reed, P. M., Hadka, D., Herman, J. D., Kasprzyk, J. R., and Kollat, J. B. (2013). Evolutionary multiobjective optimization in water resources: the past, present, and future. Adv. Water Resour. 51, 438–456. doi: 10.1016/j.advwatres.2012.01.005
Sadler, E., Evans, R. G., Stone, K., and Camp, C. R. (2005). Opportunities for conservation with precision irrigation. J. Soil Water Conserv. 60, 371–379. Available online at: https://www.jswconline.org/content/60/6/371
SCIOPRC State Council Information Office of the People's Republic of China (2019). Food Security in China. Available online at: http://www.scio.gov.cn/ztk/dtzt/39912/41906/index.htm (accessed October 17, 2020).
Seto, K. C., and Ramankutty, N. (2016). Hidden linkages between urbanization and food systems. Science 352, 943–945. doi: 10.1126/science.aaf7439
Siebert, S., and Döll, P. (2010). Quantifying blue and green virtual water contents in global crop production as well as potential production losses without irrigation. J. Hydrol. 384, 198–217. doi: 10.1016/j.jhydrol.2009.07.031
Singh, A. (2012). An overview of the optimization modelling applications. J. Hydrol. 466-467, 167–182. doi: 10.1016/j.jhydrol.2012.08.004
SPDRD Sichuan Provincial Water Resources Department (2014). Sichuan Water Resources Bulletin 2014. Available online at: http://slt.sc.gov.cn/ (accessed October 17, 2020).
Steenhuis, T., Winchell, M., Rossing, J., Zollweg, J., and Walter, M. (1995). SCS runoff equation revisited for variable-source runoff areas. J. Irrig. Drain. Eng. Asce 121, 234–238. doi: 10.1061/(ASCE)0733-9437(1995)121:3(234)
Sun, L., Chen, J., Li, Q., and Huang, D. (2020). Dramatic uneven urbanization of large cities throughout the world in recent decades. Nat. Commun. 11:5366. doi: 10.1038/s41467-020-19158-1
Tuninetti, M., Ridolfi, L., and Laio, F. (2020). Ever-increasing agricultural land and water productivity: a global multi-crop analysis. Environ. Res. Lett. 15:0940a0942. doi: 10.1088/1748-9326/abacf8
UN United Nations Department of Economic and Social Affairs Population Division (2019). World Population Prospects 2019: Highlights (New York, NY).
USDA (1964). “Chapter 4-Estimation of direct runoff from storm rainfall,” in National Engineering Handbook, ed V. Mockus (Washington, DC: Section 4 Hydrology), 1–24.
Wang, W., Zhuo, L., Li, M., Liu, Y., and Wu, P. (2019). The effect of development in water-saving irrigation techniques on spatial-temporal variations in crop water footprint and benchmarking. J. Hydrol. 577:123916. doi: 10.1016/j.jhydrol.2019.123916
WRBC Water Resources Bureau of Chongqing (2014). Chongqing Water Resources Bulletin 2014. Available online at: http://slj.cq.gov.cn/ (accessed October 17, 2020).
WRDG Water Resources Department of Gansu (2014). Gansu Water Resources Bulletin 2014. Available online at: http://slt.gansu.gov.cn/, (accessed October 17, 2020).
WRDX Water Resources Department of Xinjiang (2014). Xinjiang Water Resources Bulletin 2014. Available online at: http://slt.xinjiang.gov.cn/ (accessed October 17, 2020).
Wu, P., Zhuo, L., Liu, Y., Gao, X., Wang, Y., Zhao, X., et al. (2019). Assessment of regional crop-related physical-virtual water coupling flows. Sci. Bull. 64, 1953–1966. doi: 10.1360/N972018-00997
Xie, G., Han, D., Wang, X., and Lv, R. (2011). Harvest index and residue factor of cereal crops in China. J. China Agric. Univ. 16, 1–8.
Ye, Q., Li, Y., Zhuo, L., Zhang, W., Xiong, W., Wang, C., et al. (2018). Optimal allocation of physical water resources integrated with virtual water trade in water scarce regions: a case study for Beijing, China. Water Res. 129, 264–276. doi: 10.1016/j.watres.2017.11.036
Yu, C. (2019). The coupled effects of water and nitrogen on China's food and environmental securities (in Chinese). Sci. Sinica Terrae 49, 2018–2036. doi: 10.1360/SSTe-2019-0041
Zhang, F., and Zhu, Z. (1990). Harvest index for various crops in China. Sci. Agric. Sinica 23, 83–87.
Zhang, W., Wang, C., Li, Y., Wang, P., Wang, Q., and Wang, D. (2014). Seeking sustainability: multiobjective evolutionary optimization for urban wastewater reuse in China. Environ. Sci. Technol. 48, 1094–1102. doi: 10.1021/es404082f
Zhao, X., Liu, J., Yang, H., Duarte, R., Tillotson, M., and Klaus, H. (2016). Burden shifting of water quantity and quality stress from megacity Shanghai. Water Resour. Res. 52, 6916–6927. doi: 10.1002/2016WR018595
Zhong, H., Sun, L., Fischer, G., Tian, Z., van Velthuizen, H., and Liang, Z. (2017). Mission Impossible? Maintaining regional grain production level and recovering local groundwater table by cropping system adaptation across the North China Plain. Agric. Water Manage. 193, 1–12. doi: 10.1016/j.agwat.2017.07.014
Keywords: crop production allocation, blue water footprint, calorie production, multiple obecjtive optimization, provincial level
Citation: Liu Y, Zhuo L, Yang X, Ji X, Yue Z, Zhao D and Wu P (2021) Crop Production Allocations for Saving Water and Improving Calorie Supply in China. Front. Sustain. Food Syst. 5:632199. doi: 10.3389/fsufs.2021.632199
Received: 22 November 2020; Accepted: 13 January 2021;
Published: 09 February 2021.
Edited by:
Wenfeng Liu, UMR8212 Laboratoire des Sciences du Climat et de l'Environnement (LSCE), FranceCopyright © 2021 Liu, Zhuo, Yang, Ji, Yue, Zhao and Wu. This is an open-access article distributed under the terms of the Creative Commons Attribution License (CC BY). The use, distribution or reproduction in other forums is permitted, provided the original author(s) and the copyright owner(s) are credited and that the original publication in this journal is cited, in accordance with accepted academic practice. No use, distribution or reproduction is permitted which does not comply with these terms.
*Correspondence: La Zhuo, emh1b2xhQG53YWZ1LmVkdS5jbg==; Pute Wu, Z2p6d3B0QGhvdG1haWwuY29t
 Yilin Liu
 La Zhuo
 Xi Yang1