 Enrique Zunzunegui Escamilla1Gonzalo Ángeles Ordoñez2Quetzalcóatl Orozco-Ramírez3
 Maribel A. Caballero Castrillo4
 Miguel A. Morales Mora1,2*
- 1Colegio de Puebla, Dirección Académica, Puebla, Mexico
- 2Comisión Reguladora de Energía, Ciudad de México, Mexico
- 3Unidad Académica de Estudios Territoriales Oaxaca, Instituto de Geografía, Universidad Nacional Autónoma de México, Oaxaca, Mexico
- 4Consejo Nacional de las Humanidades, Ciencia y Tecnología, Ciudad de México, Mexico
Given the environmental challenges of soil depletion, water scarcity, and resource competition, the agricultural products market demands a continuous increase in annual crop productivity. Nevertheless, it is often overlooked whether there are favorable conditions within the biophysical constraints of the natural system to meet such a requirement. This paper contemplates an integrated analysis that connects the interaction of water-land-food and production value (WLFPV) from the availability, requirement, and scarcity of water based on the Multi-Scale Integrated Analysis of Societal and Ecosystem Metabolism (MuSIASEM) framework. This study evaluates nine crops (agave, avocado, berries, coffee, figs, native maize, pitaya-pitahaya, critical banana, and vanilla) of high commercial value from the central-eastern region of Mexico to obtain their metabolic profiles and answer this question. For this, relative water stress index (RWSI) was used as well as intensity and metabolic density indicators for each crop. The findings were then visualized and communicated through maps. The results indicate that: (1) The annual available water satisfies the total water requirement of the crops of 1,782.6 hm3, planted in 276,965 hectares that produce 803,191 tons of food with a value of 165.2 million USD. (2) 65% of the area dedicated to the production of agave, pitaya-pitahaya, and other crops is affected by a water deficit. This area’s relative water stress index (RWSI) ranges from moderate to high. In the short term, they can constrain agricultural development areas. (3) The metabolic intensity and density indicators show that the combined efficiency of the water demand/supply relationship for native maize was very deficient in 23 of the 50 municipalities. From our analysis perspective, it was possible to understand the changes occurring in the Socio-Ecological System of the nine agricultural chains. A trend in decreased rainfall and water levels in the aquifers for food production was observed.
1. Introduction
The relationship between water, land and food has been one of the bases for the economic development of all civilizations. In the last 70 years, economic development and population growth have been the main agents of change in relation to the quantity and current deterioration of the quality of water used in agriculture. Anthropogenic activities are the main cause of the depletion of groundwater reserves and the contamination of surface water at the local, regional, or national level (Rodríguez et al., 2020; WWAP, 2022). Groundwater is under heavy pressure because 69% of the water withdrawn annually is used for food production (WWAP, 2022). This percentage could increase since international food trade demands greater volumes of water from exporting countries, such as the United States, Mexico, Iran, and China, affecting the availability of aquifers (Dalin et al., 2017, 2019; Gumidyala et al., 2020; Debaere and Konar, 2022).
In this sense, it is estimated that the global depletion rate of aquifer reserves is at least between 100 and 200 km3/year (WWAP, 2022). Depending on the seasonality, rainfall and other meteorological factors, plants or crops may receive dehydration and their photosynthetic capacity to produce their fruits (Seleiman et al., 2021). The aforementioned anthropogenic and environmental causes, added to social inequality and poverty, are also responsible for the lack of food security suffered by 928 million people (11.9% of the world population) in 2020 (FAO, FIDA, OMS, PMA, UNICEF, 2021). These socioeconomic factors also impact the balance that must exist in the complex and dynamic interrelations of the nexus among water, land use and food (Tejedor, 2018; Cadillo-Benalcazar et al., 2022; Taghdisian et al., 2022). That is, causal relationships that take up natural resources beyond the limits of sustainability with severe consequences for the population: hunger or malnutrition (FAO, FIDA, OMS, PMA, UNICEF et al., 2021). But feeding such population adequately stresses the supply–demand relationship of water to produce more crops, which might diminish the total amount of water available. We face wicked problems by inherent complexity (Rayner, 2012).
From the pressure-state point of view, in the case of Mexico, the fragility of the balance of the water and food nexus is palpable, due to the decrease in the volume of rainwater and the planted area (REPDA, 2021; SIAP, 2021; SMN, 2021). Between 2010 and 2020, 70% of the agricultural area in the country (SIAP, 2021), which depends of rainfall (rainfed agriculture), experienced a 19% reduction in rainwater. This decrease amounted to 263 mm, the result of precipitation levels dropping from 1,368 mm in 2010 to 1,185 mm in 2020 (SMN, 2021). In the same period, the total cultivated agricultural area fell 17.4% (3,823,353 ha); the rainfed land contracted 23% (3,687,791 ha); and the low irrigation one decreased at 2.4% (135,562 ha; CONAGUA, 2021; SIAP, 2021). The extraction of groundwater for agricultural use represented 71%, equivalent to 25,006 hm3 [from a total volume extracted of 35,314 hm3 in 2020 (REPDA, 2021)]. Understandably, while rainwater decreased, groundwater extraction increased 20% (4,092 hm3) between 2010 and 2020, exacerbating the problem of 157 (24%) overexploited aquifers out of the 653 that the country has (CONAGUA, 2021). In turn, the volume of surface water used in food production grew 6% (2,245 hm3), going from 40,575 hm3 in 2010, to 42,820 hm3 in 2020 (REPDA, 2021).
The prevailing conditions significantly affect the food supply, as evidenced by the decline in volume. In 2010, Mexico produced a total of 210,141,709 tons, but by 2020, this figure decreased by 10.9% or 22,878,511 tons. Consequently, the country only managed to obtain 187,263,198 tons of products during that year (SIAP, 2021). This reduction occurred mainly in foods produced under the rainfed agriculture, with a contraction of 32% (SIAP, 2021). Due to inadequate food production, not even sufficient to meet self-consumption needs, the number of undernourished individuals in Mexico rose from 4.7 million (equivalent to 4.6% of the total population) in the 2004–2006 period to 9.2 million (representing 7.3% of the total population) in 2018–2020 (FAO, FIDA, OMS, PMA, UNICEF et al., 2021). The sixth report of the IPCC (2022) reveals that within the next 50 years, nearly half of the country’s regions could experience an elevated risk of heatstroke-related deaths. This increased risk arises from the projected rise in the number of days per year featuring high temperatures.
Thus, it is essential to know the pressure that the water requirement of crops exerts on the water available in particular regions (García, 2017). In the last decades, an index of water stress in crops has been established based on surface and underground water availability within the water footprint framework (Cao et al., 2017, 2023). This index evaluates the scarcity in the region from the relationship between water supply versus crop demand from a reductionist approach and without considering multiple scales or dimensions.
The analysis of the water-food-energy (WFE) nexus has gained momentum in recent decades, especially in the United States and the EU (Pimentel et al., 1973; FAO, 2014; Cabello et al., 2019; Cadillo-Benalcazar et al., 2022; Voelker et al., 2022), allowing progress in the science of sustainability toward comprehensive approaches, given the natural ecological and economic complexity of modern societies. Particularly, the Multi-Scale Integrated Analysis of Societal and Ecosystem Metabolism (MuSIASEM) is beginning to gain space in studying socioecological systems (SES). It is a transdisciplinary approach developed to investigate the interactions of the natural and social system based on considering restrictions between biophysical limits and demand growth of modern societies through the use of a set of extensive and intensive variables at different scales and dimensions (Giampietro and Mayumi, 2000a,b; Giampietro et al., 2012).
In this sense, MuSIASEM is positioned as one of the most effective theoretical and methodological frameworks to characterize the relations of the nexus of resources and needs of society as a dissipative structure (FAO, 2013; Gerber and Scheidel, 2018; Haberl et al., 2019; Taghdisian et al., 2022). In Latin America (LA), MuSIASEM has been an approach to analyze various economic and energy issues (La Rota-Aguilera et al., 2022). It has recently been used to characterize a society-agriculture-forest system in Peru (Cadillo-Benalcazar et al., 2022).
In an effort to stimulate production and support rural development, the State of Puebla’s government in Mexico has implemented a strategy that focuses on cultivating high-value crops. This approach aims to strengthen production chains within nine strategically chosen sectors of the agricultural industry. The crops are (i) agave, (ii) avocado, (iii) berries, (iv) coffee, (v) figs, (vi) native corn, (vii) pitaya-pitahaya, (viii) banana and citrus, and (ix) vanilla, which depend on the rainy cycle for their production.
The objective is to provide support to producers by investing in improvements to production practices and the integration of technology, equipment, and vegetative materials. These investments aim to enhance the volume, production value, and market conditions for the producers (SDR, 2021). Nevertheless, this policy is not aligned with the seasonal imbalance of natural hydraulic availability, characterized by lower and uncertain rainfall patterns of varying intensity, primarily caused by the impacts of climate change.
Boosted by regional policy to produce value-hight crops for the domestic and export market (SDR, 2021; Morales-Mora et al., 2022), this article aims to characterize the metabolic profile of the nine crops through an integrated analysis that connects the water-land-food and production value (WLFPV) from the availability, requirements, and scarcity of water, expressed through a relative water stress index and indicators of metabolic intensity and density illustrated through maps.
This research makes a valuable contribution by developing benchmark indicators that consider the metabolic characteristics of crops within specific local and regional contexts. These indicators take into account biophysical restrictions, for which no previous studies in Latin America or Mexico have been conducted (La Rota-Aguilera et al., 2022). Furthermore, the proposed methodology combines the MuSIASEM (FAO, 2013) approach with the utilization of conventional water demand estimations and additional risk factors. This allows for determining metabolic profiles for each crop based on a relative water stress index (RWSI) and indicators of intensity and metabolic density. These profiles can then inform the development of more effective public policies that account for the limitations imposed by the natural system.
The document has the following structure: Section one (I.1 and I.2) describes the agricultural and hydrological context of the State of Puebla as a case study and the MuSIASEM framework. Section II presents the methodology, and section III condenses the main results, expressed in four blocks. Finally, section IV paper focuses on the discussion, while section V provides the conclusions.
1.1. Agricultural and hydrological context of the state of Puebla, Mexico
The State of Puebla is located in the central-eastern region of Mexico and has an area of 34,309.6 km2, representing 1.7% of the surface of Mexico. For the State Government, there are nine production chains, namely: (i) agave, (ii) avocado, (iii) berries, (iv) coffee, (v) figs, (vi) native maize, (vii) pitaya-pitahaya, (viii) banana and citrus and (ix) vanilla, which depend on rain for their production (SDR, 2021).
From a territorial perspective, the nine agricultural production chains encompass 154 municipalities (see Supplementary Figure SM-1; Supplementary Table SM-1), accounting for approximately 71% of the total 217 municipalities in the state. These municipalities are home to 276,965 hectares of strategic crop cultivation in nine agricultural development centers (ADC), commonly known as Development Poles (SDR, 2021).
The nine production chains contribute 32% of the total planted area (864,785 hectares) in the state and 20.7% of the entity’s production value (799.4 million USD). At the national level, it represents 6.1% of the total volume of food production (13,128,898 tons) (SIAP, 2021).
Table 1 shows the characteristics of the production chains. The native (white) maize chain is the most socially important and occupies 68.9% of the planted area. It accounts for 49.8% of the total production and contributes 47.4% of its overall value.
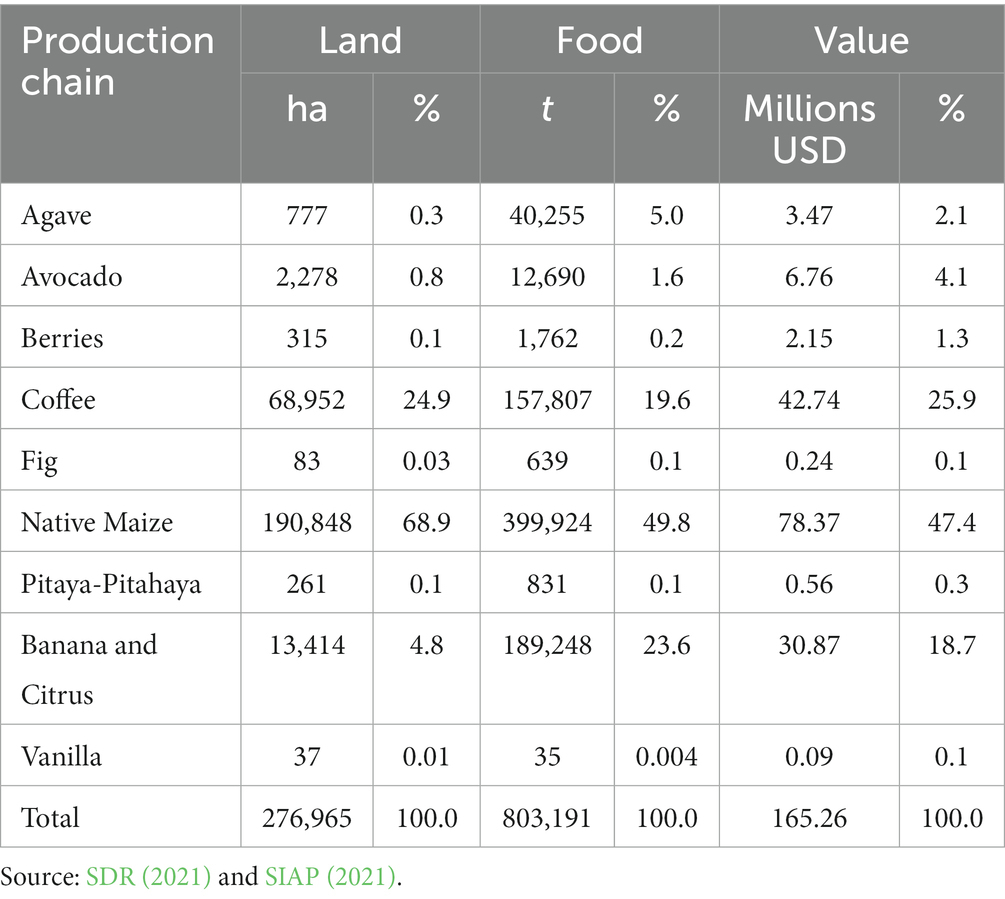
Table 1. Agricultural statistics by production chain in the Development Poles of SDR (2021).
In Puebla state, the rain cycle on which rainfed agriculture depends has been erratic. During the period from 2010 to 2020, there was a notable decrease in annual rainfall by 263.4 mm (19%) (SMN, 2021), which had a significant impact on the low crop yields per hectare (Figure 1).
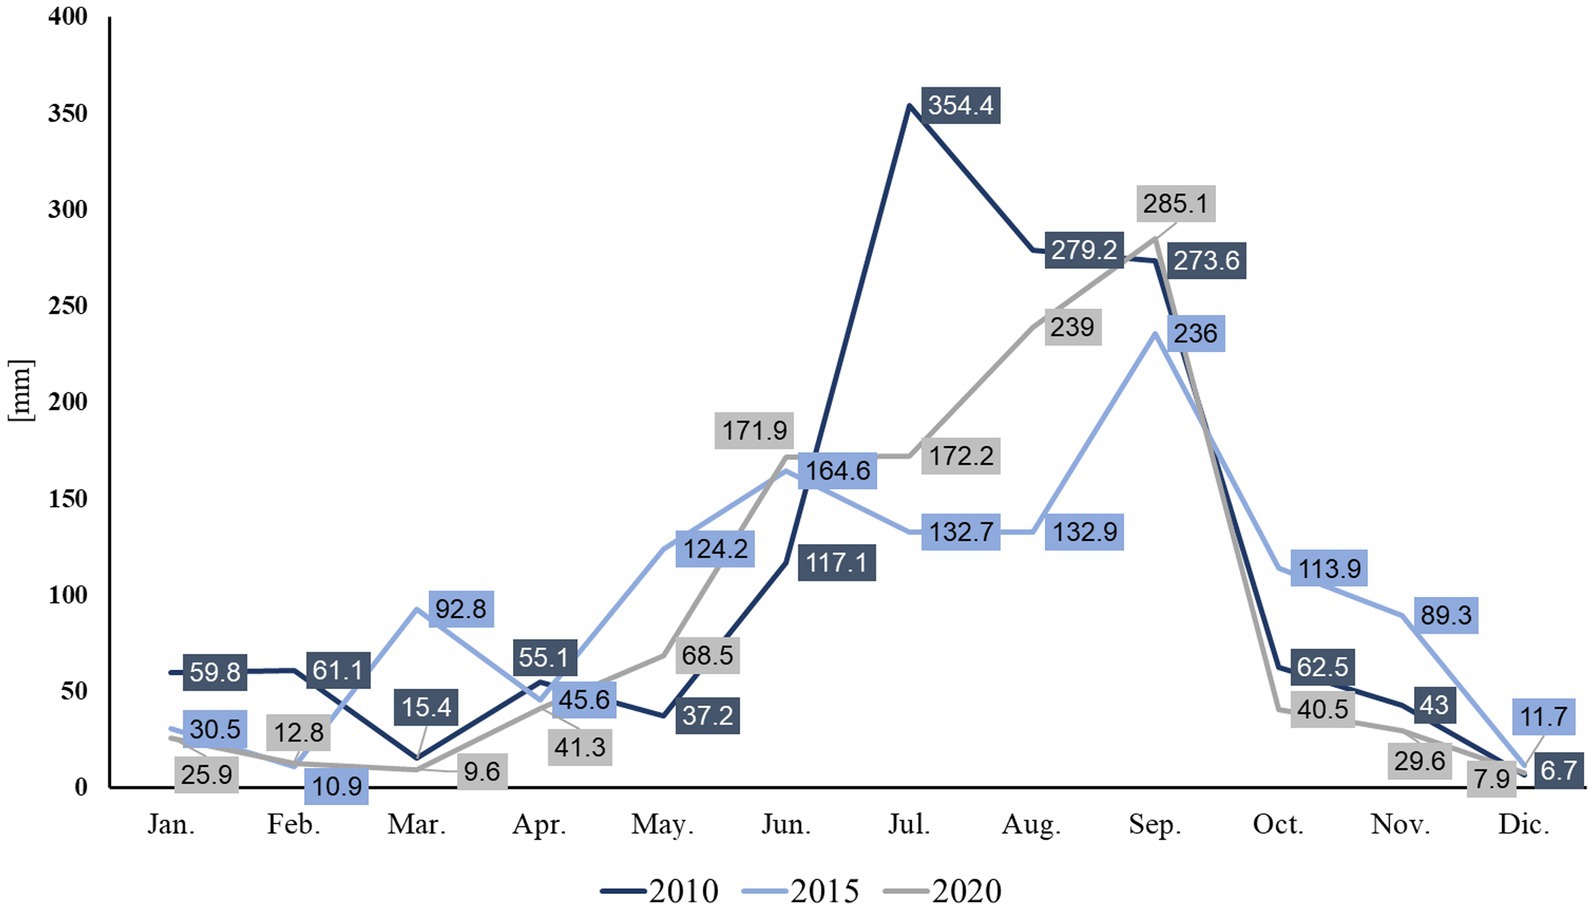
Figure 1. Monthly rainfall 2010, 2015, and 2020 in the state of Puebla. Source: Own elaboration with information from SMN (2021).
Similarly, this was evident in the state’s annual average per capita consumption of maize, which stood at 159 kilograms. This figure represents a 53% decrease compared to the national average of 335.8 kilograms (SIAP, 2021).
According to CONEVAL (2021), the inadequate water supply from the natural system has resulted in reduced cultivation areas and limited work allocated to agriculture by the population in the socioeconomic system. As a consequence, approximately 31% (2,041,500 people) of the population of the state of Puebla lacks access to nutritious and high-quality food. This is exacerbated by meteorological flash droughts (MFDs) (Sreeparvathy and Srinivas, 2022). It is worth noting that an increase in the frequency, duration, and maximum intensity of droughts has been observed in various regions of the Americas (Chiang et al., 2021).
1.2. MuSIASEM framework
Starting from the analogy of the metabolism of an organism, MuSIASEM (Giampietro and Mayumi, 2000a,b; Giampietro et al., 2021) studies the metabolism that occurs in the interaction of the SES, which is made up of functional and structural elements. It has been developed with four conceptual frameworks: (i) the pressure-state relationship from non-equilibrium thermodynamics, (ii) the Georgescu-Roegen (1971) flow-fund model, (iii) the relational analysis (Rosen, 1991; Louie, 2017), which is supported by the four Aristotelian causes: material, formal, efficient, and final (Müller-Merbach, 2005) and (iv) the hierarchical theory.
Within this framework, MuSIASEM provides a methodology to evaluate the quantitative metabolic pattern of a complex system by maintaining the sequence or succession of interrelated elementary processes. This evaluation is conducted through a matrix-based approach, adaptable to different scales, with the ultimate goal of achieving a specific purpose. To harmonize this process, the flow-fund model helps reveal and describe the various elements and operations contributing to achieving a specific result or product. The flows are the process elements that enter, disappear, or appear (outputs) as products or residuals in the established analytical temporality. The funds are the elements that carry out the transformation of the flows and remain over time. Both flows and funds may have restrictions. The availability of the primary streams depends on the environmental conditions (outside human control) and the funds (within human control) suffer wear and have a specific useful life that must be considered.
The relationship between funds and temporal flows, representing the inflows entering the process within a specific time frame, constitutes extensive variables (e.g., hm3/year). These variables allude to the magnitude or size of the metabolic process. On the one hand, the flow-fund relationships are intensive variables in which metabolic rates have been divided based on time (e.g., m3/h.) and metabolic density rates in space (e.g., kg of crops produced per hectare of land planted). To quantify this relationship, a metabolic processor (MP) supported by the four Aristotelian causes is used (Müller-Merbach, 2005; Guiampietro, 2019). An MP is a way of specifying the interdependence relationships that exist between flows and funds, that is, impredicative relationships (the chicken-and-egg paradox) that allow the system, in this case, the agricultural system, to fulfill a task (Figure 2). In this way, the quantity and quality of primary and tertiary flows and funds depend on the material cause, that is, the biosphere, which transforms the necessary flows using the structural elements (formal cause) and the input and output functions (efficient cause), associated with the expected result. In other words, its transformation into internal outputs, such as agricultural products and monetary value (final cause), is connected to another subsystem or system (Guiampietro, 2019). Once the metabolic processor is established, it becomes a relational data matrix comprising the different input and output flows and funds, constituting the metabolic profile that characterizes, in this case, the agricultural system of the state of Puebla.
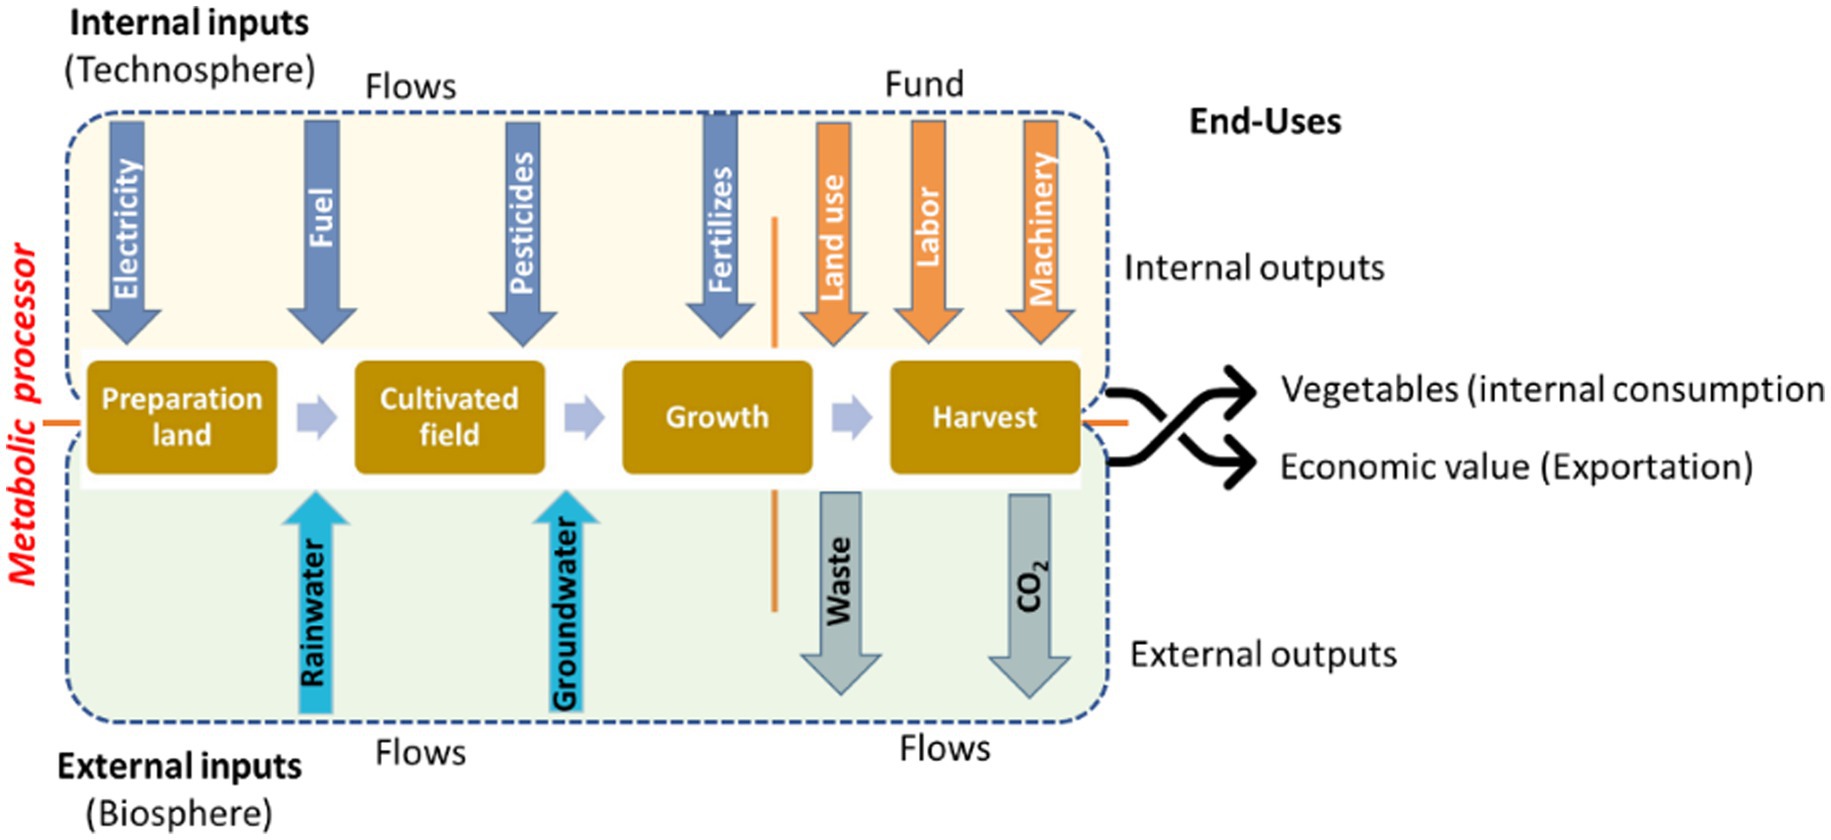
Figure 2. Conceptual scheme of the metabolic processor establishes the relationships and transformations between flows and funds based on the four Aristotelian causes to generate a metabolic profile of the system to be evaluated. Source: Own elaboration, 2023.
2. Material and method
2.1. Indicators of metabolic density and intensity
To characterize the metabolic pattern of the water-food nexus, the calculation of the water requirements of each productive chain by municipality was used as the basis (Villanueva et al., 2001; FAO, 2006; Madrid and Velázquez, 2008; Fernández et al., 2009; Ruiz et al., 2013; Mayor, 2017; Villareal, 2020), to later determine the Water Stress Indices (García, 2017) and obtain the intensity and metabolic density rates (Giampietro et al., 2013; Ruggerio, 2015; Tejedor, 2018).
From the estimation of the requirement of the plants and the sources of availability, the relative water stress index was constructed for the nine priority agricultural chains in the nine agricultural development centers in the state of Puebla, see Supplementary Figures SM-2, SM-3, which are shown in section Data and Calculations of the Supplementary material.
2.2. Combined efficiency index of water-food metabolic intensity and density
The combined efficiency index of the metabolic intensity and density of water-food was calculated, establishing the degree to which the demand is satisfied based on the population’s pressure on the crop supply in a given territory. The index was calculated using the following formulas:
Where:
CEIWFMID = Combined Efficiency Index of Water-Food Metabolic Intensity and Density (in %).
RWSI = Relative Water Stress Index (demand/supply) (in %).
EIFP = Efficiency Index in Food Production (demand/supply) (in %).
The qualitative rating of the results is shown in Table 2. When the values are close to 0, the Index is more efficient. In contrast, when it approaches 100% it is more deficient and when it exceeds 100%, the local production does not satisfy the food demand of the population.
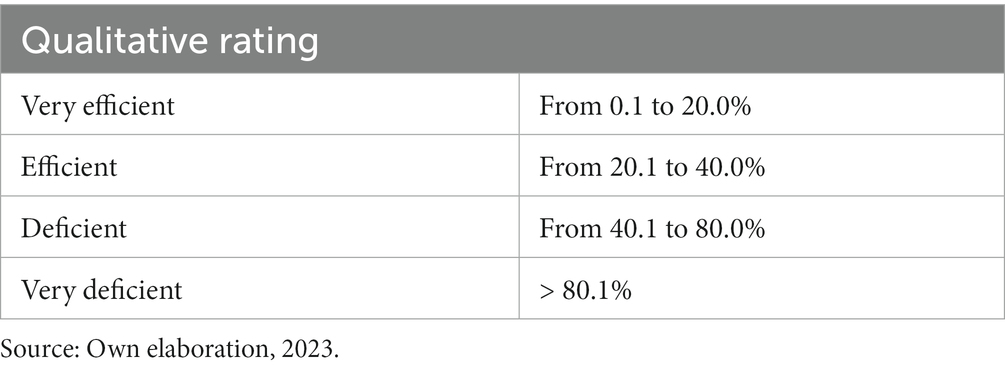
Table 2. Qualitative rating of CEIWFMID (Combined Efficiency Index of Water-Food Metabolic Intensity and Density).
In general terms, this research considers an integrated analysis that connects the structure and function of a metabolic processor (Figure 2) to the quantified and characterized metabolic profile of nine crops in 154 municipalities of Puebla, using the following elements:
1. The availability and water requirements of crops
2. The index of relative water stress
3. Water metabolism in food production
4. The grammar of the WLFPV
5. Metabolic intensity and density rates as a product of the water-food relationship
That is the ecological and social system (SES) interrelations.
2.3. Source data and collection
The official statistics used in this research refer to the agricultural and agroclimatic year 2020. The climatology data (temperature and precipitation) were obtained from the historical data of 54 stations of the National Meteorological Service (SMN) of the National Water Commission (CONAGUA), located in the state of Puebla (SMN, 2021).
The data of agricultural statistics (surfaces sown and harvested, volume and value of production, yield, and water regime) correspond to agricultural production in 2019 and 2020 from the Agro-Food and Fisheries Information Service (SIAP) of the Secretary of Agriculture and Rural Development (SADER, 2016; SIAP, 2021).
The crop development coefficient (Kc) and the percentage of daylight hours per month were used for the months of the year by FAO (2016). The volumes of allocated water (both surface and groundwater) for urban, agricultural, and public use in the year 2020 were obtained from the Public Registry of Water Rights (REPDA) maintained by CONAGUA (REPDA, 2021). The volumes of conceded water (surface and underground) for urban agricultural and public use for the year 2020 were obtained from the Public Registry of Water Rights (REPDA) of the CONAGUA (REPDA, 2021). Population data from the 2020 Population and Housing Census (INEGI, 2011) was used. Finally, the data from the INEGI Geostatistical Framework and the SDR were consulted for constructing the maps of the state of Puebla using QGIS 3.30.0.
For this study, only one flow element was considered: rainwater and aquifer water on the Biosphere side, while the tilled land surface was the fund element for each of the nine crops from the Technosphere of the metabolic processor, according to Figure 2.
3. Results
3.1. Available and effective water for the crops
In the 2020 agricultural year, the ecological system contributed a total gross volume of water of 3,367.26 hm3 to produce the nine productive chains. This volume consisted of 99.9% rainwater and only 0.04% underground water. When discounting losses due to evaporation, infiltration, and runoff, the total effective water available was 2,087.8 hm3, equivalent to 62%. The agricultural chains with the highest losses in water were coffee, with 873.74 hm3 or 49% of total losses, followed by banana and citrus with 103.2 hm3 or 37%, avocado with 10.4 hm3 or 32%, and native maize varieties with 289.04 hm3 or 31%. Conversely, the agricultural chains with the lowest recorded losses were berries, which accounted for 0.98 hm3 or 6% of total losses, and pitaya-pitahaya, which recorded 0.17 hm3 or 9%. See Table 3.
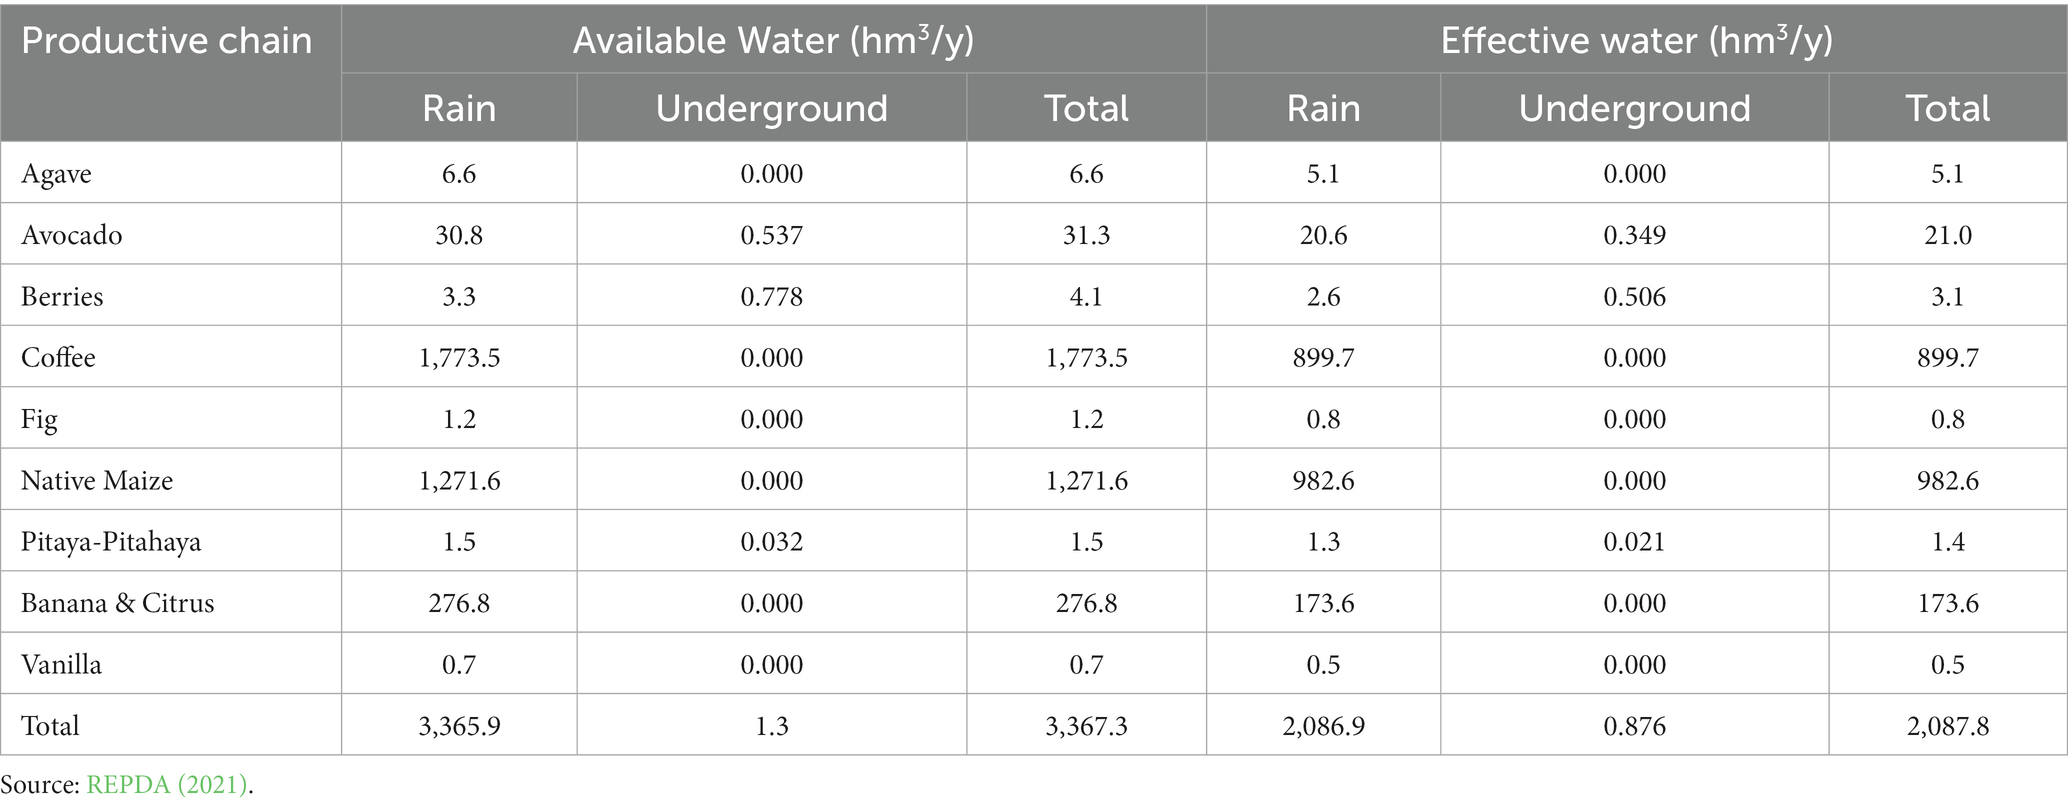
Table 3. Productive chain (volume, hm3/year).
The multidimensional flow-fund matrix presented in Table 4 establishes the relationship of the water-food nexus for each productive chain. It shows the available volume of water for an area of 276,965 hectares, which produced 803,191 tons of food with a value of 165.3 million USD.
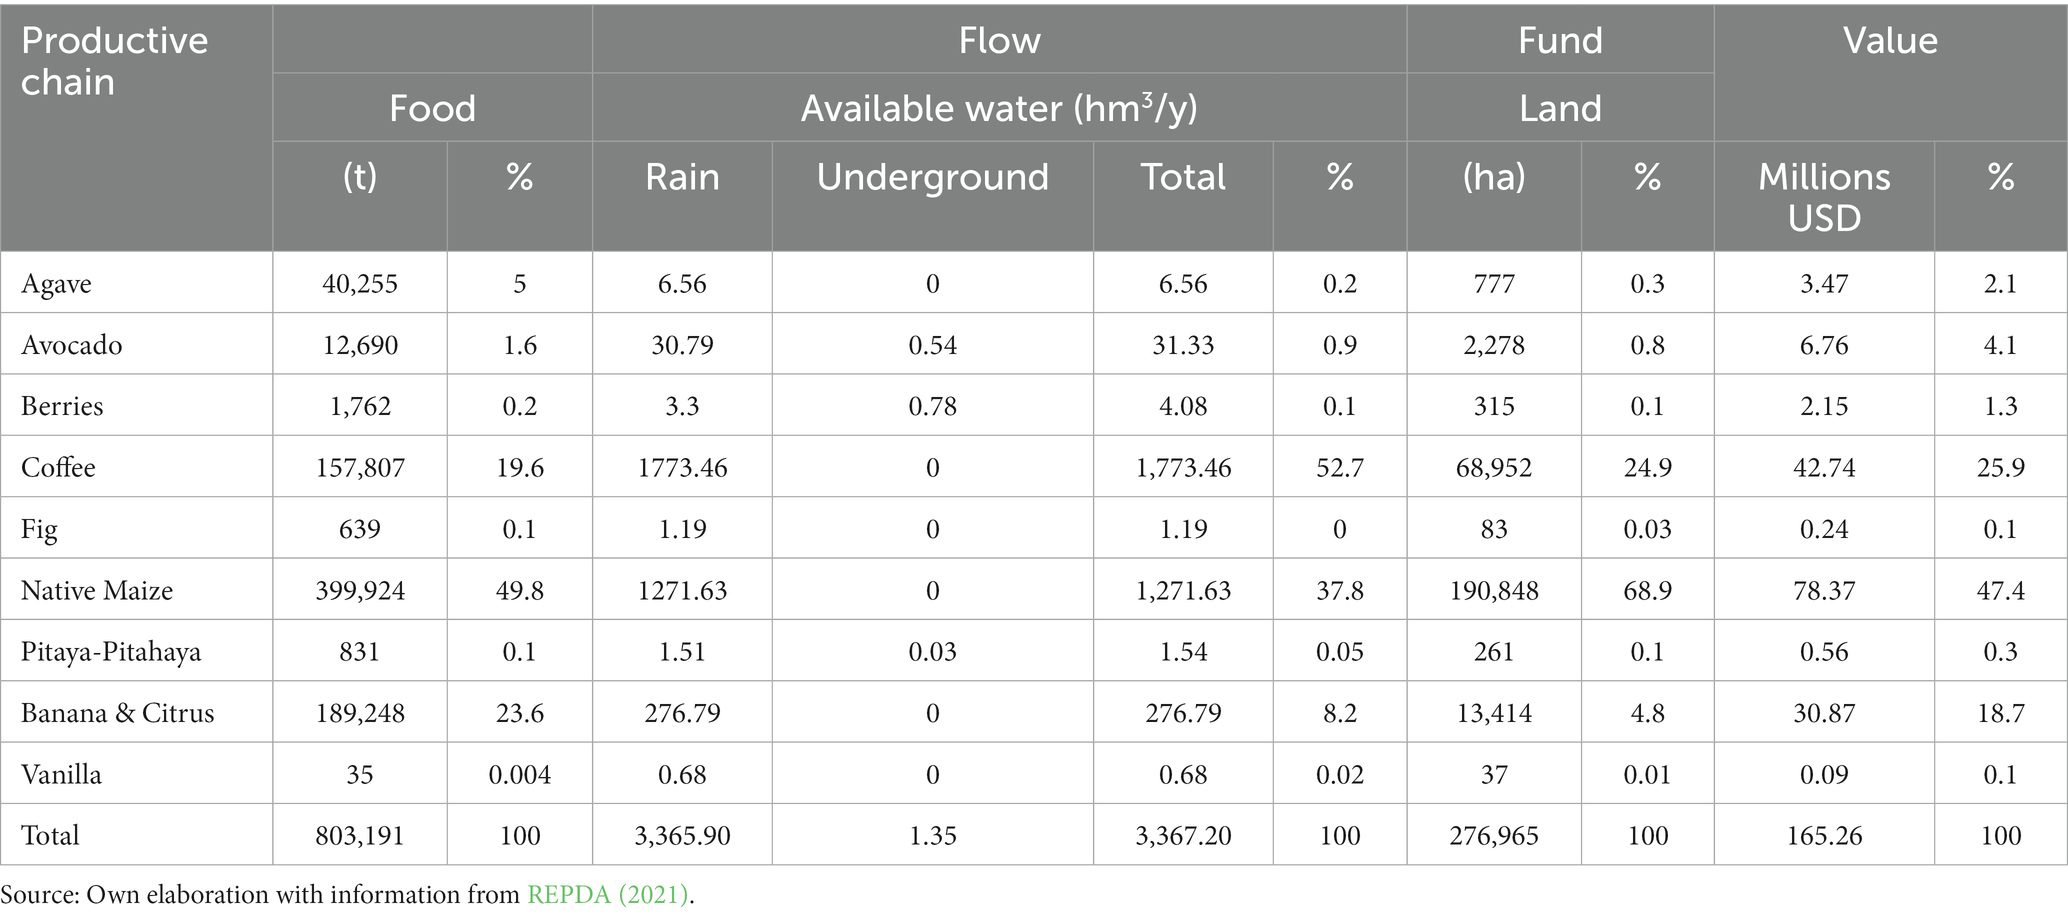
Table 4. Multidimensional matrix Flow (water)–Fund (surface) of the processes of the interrelationship between water and food of the Productive Chains, 2020.
Among the nine products, the banana and citrus demonstrate the highest metabolic efficiency regarding utilizing available water for production. This chain utilizes only 8.2% of the water and generates 23.6% of the production. The native maize chain utilizes 37.8% of the water, accounting for 49.8% of crop production. In this sense, the coffee chain exhibits metabolic losses regarding the ratio of used water to its production. This chain utilizes 52.7% of the water and contributes 19.6% to the total production. From the economic point of view, of the nine crops analyzed, native maize contributes 47.4, followed by coffee at 25.9 and Banana & Citrus with 18.7% of the total value (Table 4).
It is important to highlight that the annual volume of available rainwater in the state of Puebla can vary due to the diverse orographic and climatic conditions across different geographic locations within the state, varying from 300 to 400 mm in the Tehuacán region, to 4,400–4,500 mm in the Cuetzalan region. Moreover, there is a reduction in the average annual precipitation in the state and a variation in the monthly precipitation in the last decade running from 2010 to 2020 (see Figure 1).
Table 5 shows that the water demand of the crops of the nine productive chains was 1,782.64 hm3 in 2020, which was satisfied with 2,087.79 hm3 of available water, resulting in a surplus of 305.1 hm3, equivalent to 15%.
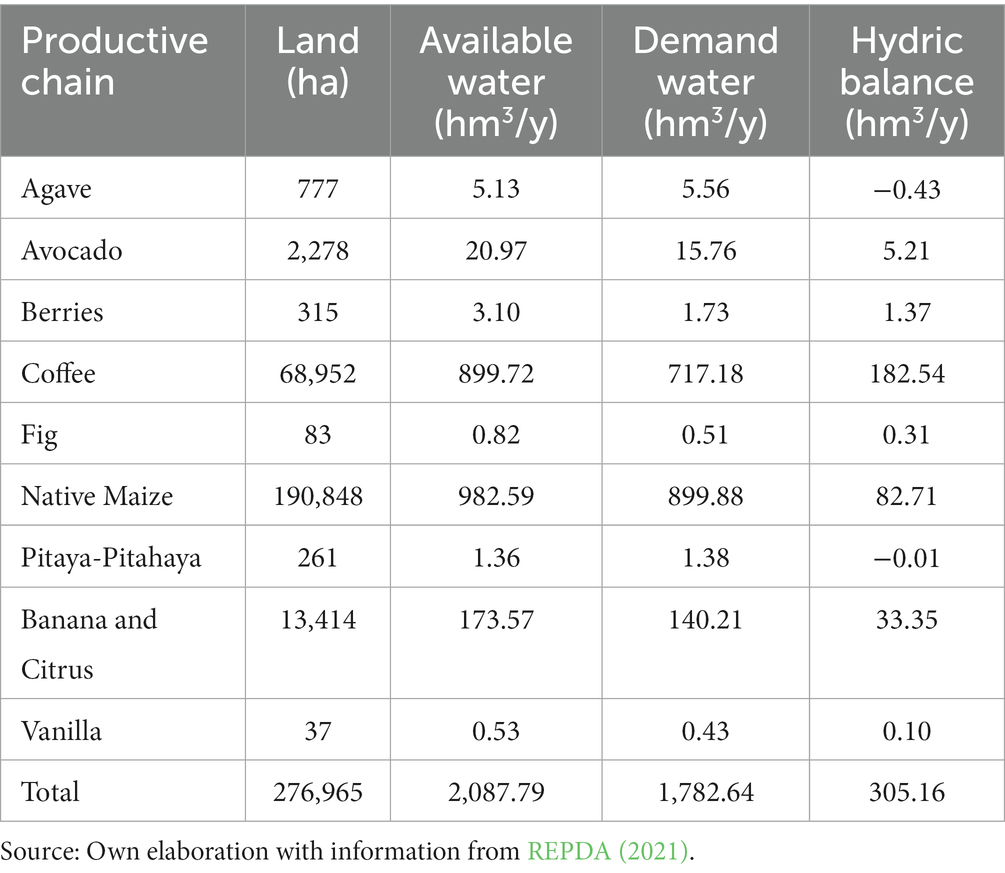
Table 5. Water demand by the productive chain in 2020.
From data in Table 5, the productive chains that resulted in a surplus, expressed as a percentage, are coffee: (59.82%), native maize (27.10%), banana and citrus (10.93%), avocado (1.71%), berries (0.45%), figs (0.10%) and vanilla (0.03%); on the one hand, the chains with the deficit are agave (−0.14%) and pitaya-pitahaya (−0.004%). Furthermore, the vanilla chain has the highest water demand (17.14%) per hectare, concerning the total water demand; the banana and citrus chains follow it at 15.3%, coffee with 15.3%, agave at 10.5%, avocado at 0.1%, figs with 8.9%, berries with 8.05%, pitaya-pitahaya with 7.7% and native maize with 6.9%.
3.2. Relative water stress index
Figure 3 illustrates the percentage contribution of the Relative Water Stress Index (RWSI) to the total of the nine productive chains, with the following distribution: 35,566 ha (13%) are classified as having a high index, 29,364 ha (11%) as medium, 113,752 ha (41%) as moderate, and 98,284 ha (35%) as low.
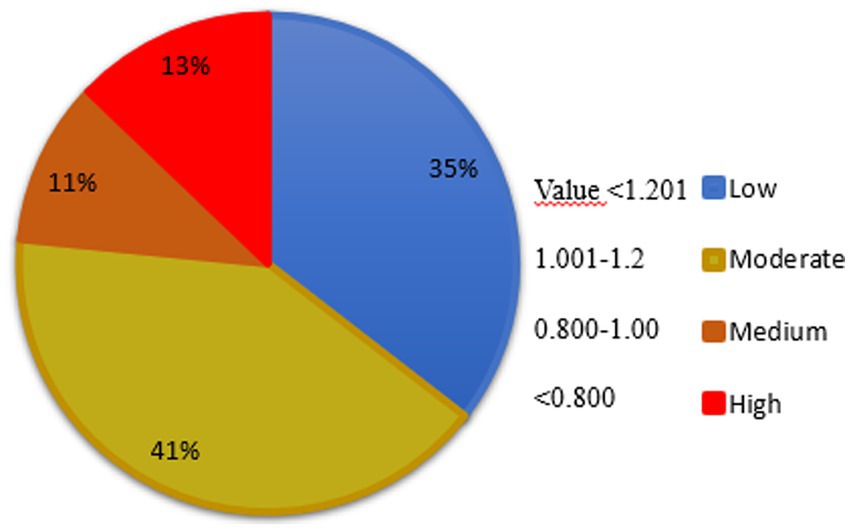
Figure 3. RWSI (Relative Water Stress Index) by area and value range for the nine agricultural development centers and productive chains. Source: Own elaboration, 2023.
For further analysis, Figure 4 shows the characterization of the RWSI by productive chain. The municipalities with high RWSI by productive chain are: agave: Huehuetlán el Grande (267 ha) and Tepeojuma (46 ha); avocado: Chapulco (5 ha), Cohuecan (27 ha), Coxcatlán (8 ha), Coyomeapan (9 ha) and Tehuacán (2 ha); coffee: Acateno (136 ha), Coyomeapan (245 ha), Jalpan (3,527 ha) and Pantepec (1,029 ha); native maize: Acteopan (370 ha), Altepexi (285 ha), Cohuecan (710 ha), Santiago Miahuatlán (1,320 ha), Tecamachalco (3,080 ha), Tehuacán (2,403 ha), Tepanco de López (1,756 ha), Tepeyahualco (10,252 ha), Tlacotepec de Benito Juárez (4,510 ha), Tochtepec (1,243 ha), Xochitlán Todos Santos (2,020 ha) and Yehualtepec (2,250 ha); and pitaya-pitahaya: Caltepec (41 ha), Coxcatlán (1 ha), San Gabriel Chilac (7 ha), San José Miahuatlán (7 ha), Santiago Miahuatlán (3 ha), Tehuacán (4 ha) and Zinacatepec (3 ha).
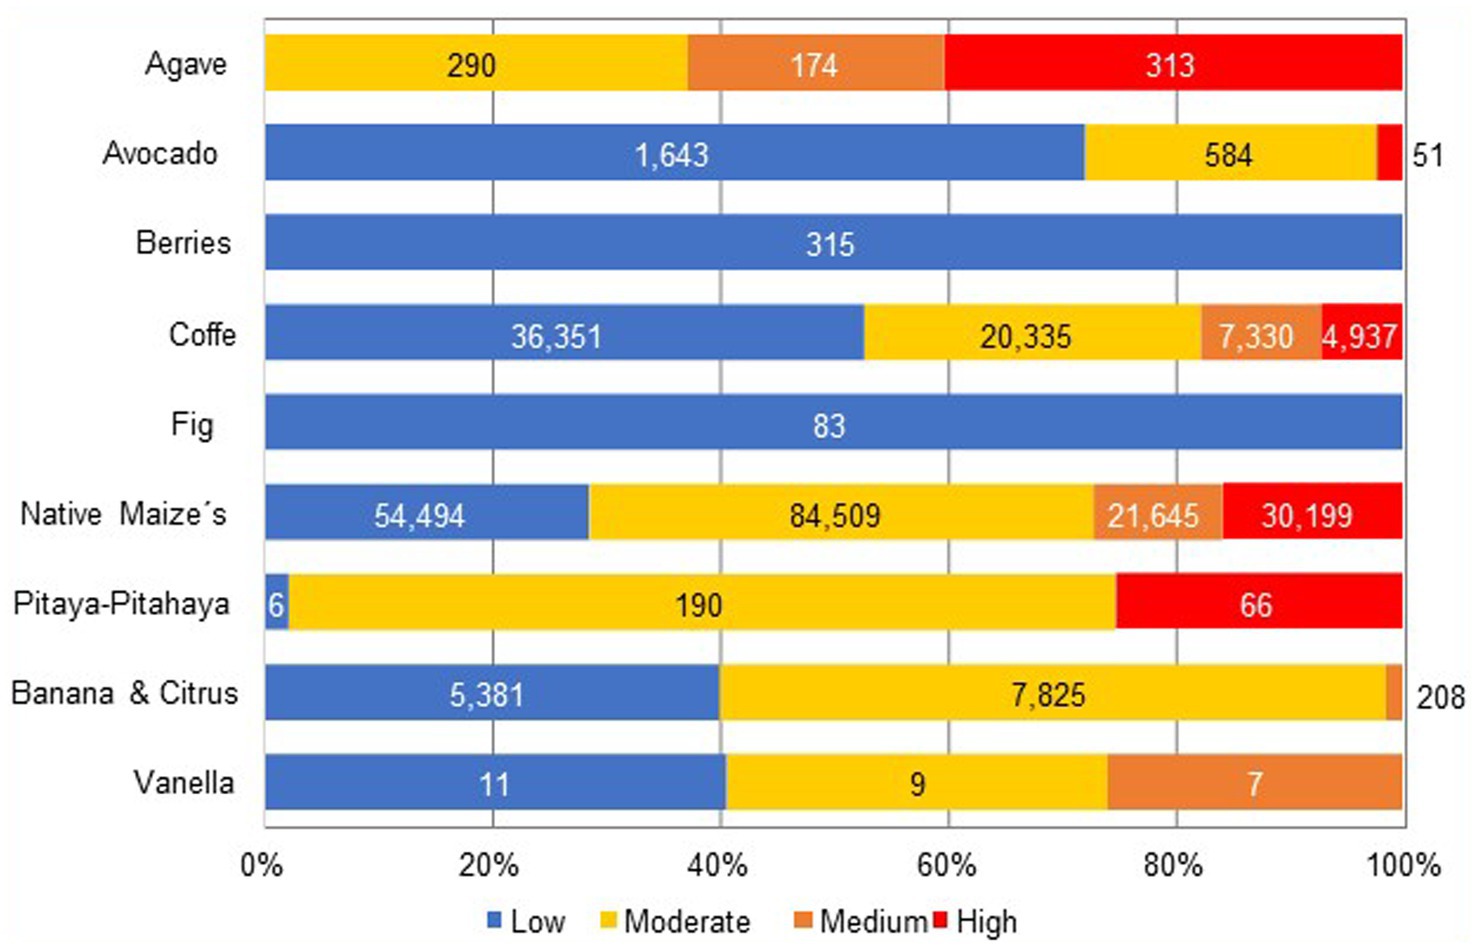
Figure 4. RWSI (Relative Water Stress Index) by the productive chain in percentage. The land use (ha) is also indicated for each crop. Source: Own elaboration, 2023.
According to Supplementary Figure SM-4, about 56 municipalities registered a low RWSI (Relative Water Stress Index), in which they do not experience pressures on the water resource. It is even possible to improve productivity by increasing the density of the plant population. While about 62 municipalities present a moderate RWSI. Therefore, water availability can become a limitation of agricultural development in these.
A medium RWSI was registered in 12 municipalities, which means that the water supply is reaching the maximum limit to meet the demand, so there is a high risk of becoming a limiting factor for development. Finally, 24 municipalities registered a high RWSI; this means that the water supply is insufficient to meet the demand for water.
3.3. Grammar water-land-food nexus and rates of intensity and density metabolic
Using the metabolic processor framework (Figure 2) and the data in Tables 3–5; Figure 5 shows the metabolic profile of the nine productive chains. It visualizes the interrelation of water-land Ecological System (ES) and food production Social System (SS) as part of the Socio-Ecological System (SES) and the processes through which water is metabolized, from its availability in supply sources (water of rain and groundwater), and land (material cause), its utilization to meet the water demand of crops (formal cause) on a given area, food production (efficient cause), until its transformation into economic value (final cause). The productive chains of coffee and native maize stand out, which used 90% of the effective water, occupying 94% of the planted area and contributing 73% of the production value. The grammar of each of the nine crops (Supplementary Figures SM-5–SM-13) can be consulted in section II of the SM.
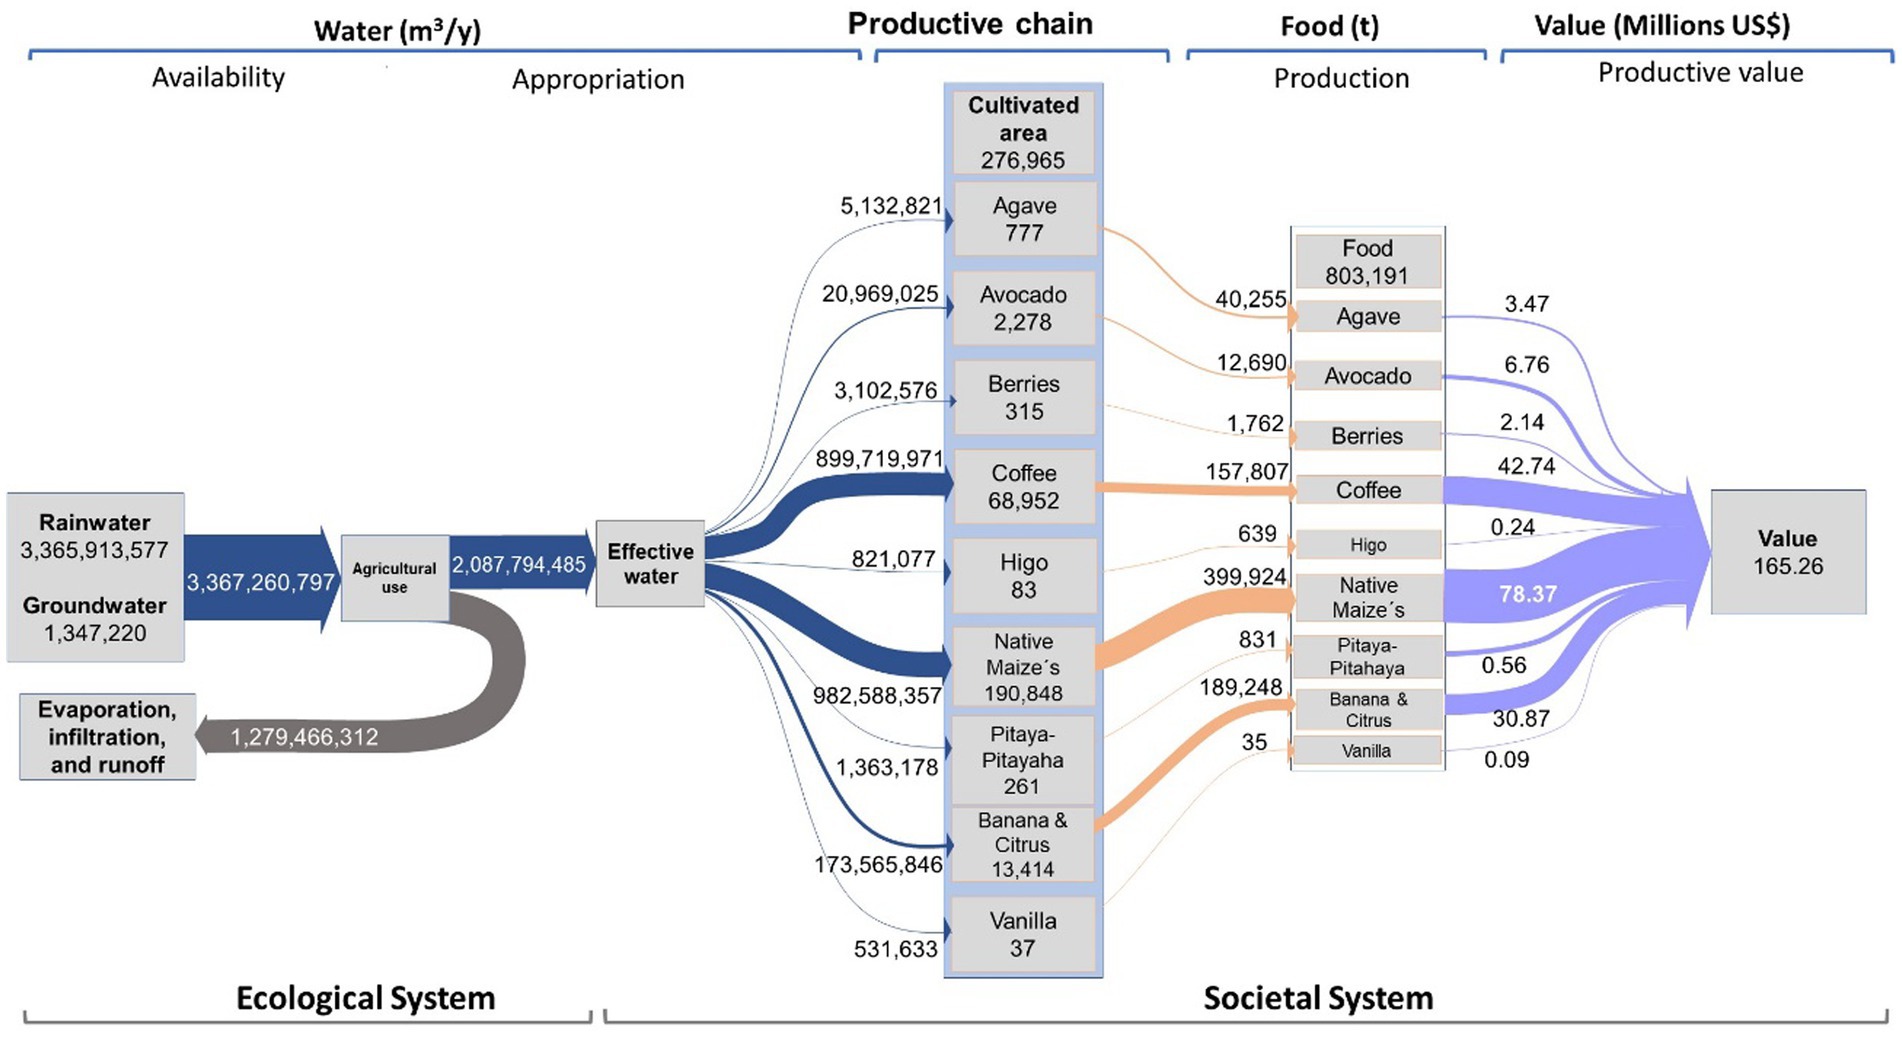
Figure 5. Grammar of the water-land-food nexus of the nine production chains, based on the flow-fund model and relational analysis (four Aristotelian causes) between the ES Ecological System and the Societal System. Source: Own elaboration, 2023.
Complementarily, as shown in Table 6, the results of the metabolic intensity and density rates are as follows:
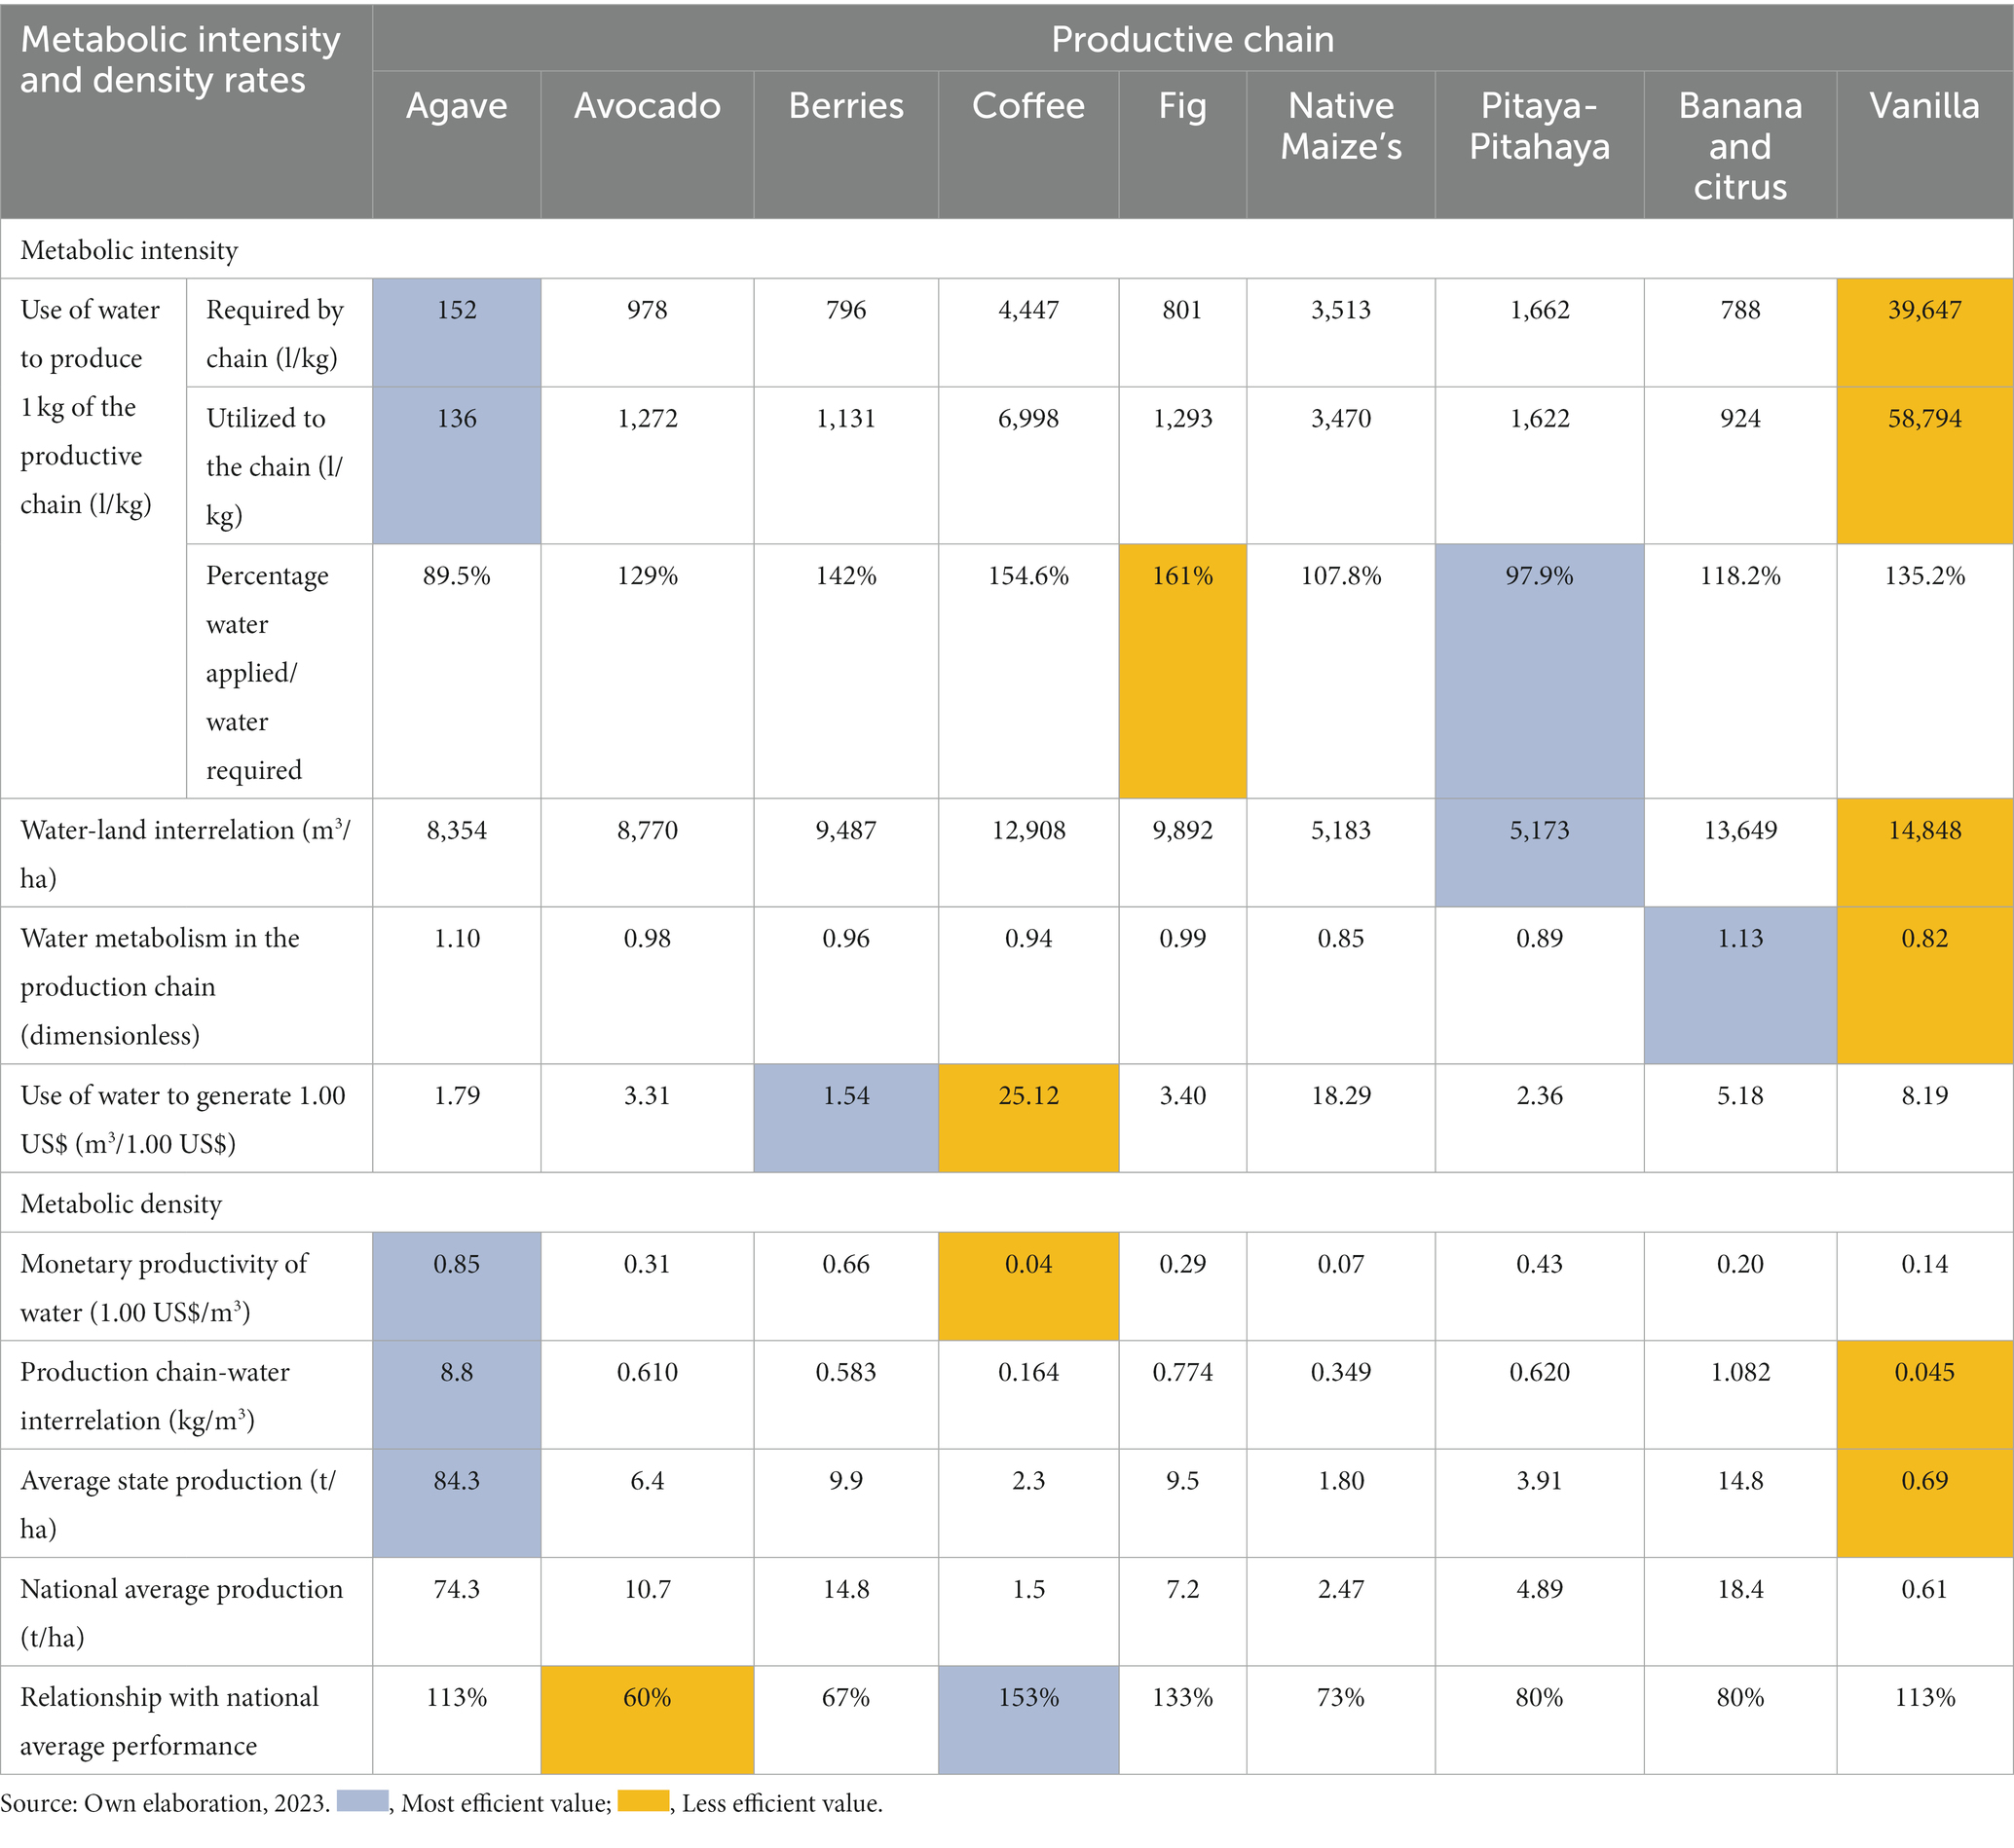
Table 6. Rates of metabolic intensity and density by the productive chain, 2020.
Metabolic intensity rates:
a. For the water required to produce a kilogram of food (l/kg), the agave chain has the lowest rate (152 L/kg), while the vanilla chain has the highest rate (39,647 L/kg).
b. Regarding the available water used to produce a kilogram of food (l/kg), in the same way, the agave chain presents the lowest value (136 L/kg) and vanilla the highest (58,794 L/kg).
c. Regarding the percentage of available water used/water requirement, the pitaya-pitahaya chain presents the most efficient rate with 97.9%, and the rate with the least efficiency is that of the fig chain with 161%.
d. In the water-soil rate (m3/ha), the pitaya-pitahaya occupies the most efficient value (5,173 m3/ha), while the vanilla chain is the least efficient with 14,848 m3/ha.
e. According to the metabolism of water in production value, the banana and citrus chain is the most efficient, with a value of 1.13, while vanilla is the least efficient, with 0.83.
f. Concerning the use of water to generate 1 USD, the berries use just 1.54 m3/1 USD, while the coffee chain uses 25.12 m3/1 USD.
Metabolic density rates:
a. According to the monetary productivity per cubic meter of water (1 USD/m3), the agave production chain is the most productive, with 0.85 USD/m3, and the least productive is the coffee chain, with 0.04 USD/m3.
b. Considering the rate of production volume per cubic meter of water (kg/m3), the agave chain is the most efficient with 8.8 kg/m3, and the vanilla chain is the least efficient with only 0.045 kg/m3.
c. Regarding the average yield (t/ha) of the productive chains, agave has the highest yield (84.3 t/ha), and vanilla has the lowest yield (0.69 t/ha).
d. Comparing the average yield (t/ha) of the crops in the ADC concerning the national level, the coffee chain is above with a value of 153%, while the avocado is below the national yield by 60%.
4. Discussion
The nine productive chains respond to a relational structure, which is explained and understood through the four Aristotelian causes and follow the following structure, adding the market as the fifth cause: (i) availability of water, (ii) getting water rights, (iii) use of water in the planted area, (iv) conversion of water into food, and (v) transformation of water into the monetary value of food (Madrid and Velázquez, 2008; Giampietro et al., 2013; Mayor, 2017).
It is important to note that the values of the water requirements of each crop are specific and depend on various agroclimatic factors such as: (i) geographic location (Supplementary Figure SM-1), (ii) rainfall, (iii) maximum and minimum temperatures (Figure 1), (iv) the vegetative development period and (v) the crop coefficient (Villanueva et al., 2001; Fernández et al., 2009). For this reason, only some of them are included in this discussion.
The results show that the water-land-food nexus had a gross volume of water of 3,367 hm3/y, coming from rainwater (99.9%) and groundwater (0.04%). 38% of said volume returned to the ES as losses due to evaporation, infiltration, and runoff (Table 3). On the side of the SS, farmers used 2,087.8 hm3/y (62%) of effective water to sow 276,965 hectares of nine productive chains that produced 803,191 tons of food with a value of 165.26 million USD (see Figure 5). Native maize had the highest water utilization rate at 47%, closely followed by coffee at 43%. This can be attributed to the fact that these two crops occupy 94% of the entire area of the ADC, as indicated in Tables 1, 4.
The average water demand of agave is in the optimal range of 700–1,000 mm determined by Ruiz et al. (2013). As for avocado, it is 39% higher than the World Avocado Organization (WAO) recommended. Madrid and Velázquez (2008) found that in eight provinces of Andalusia, in Spain, variability in water demand ranges from 1,200 to 3,000 m3/ha, 45% lower than the average water demand for the same crop in Puebla. Regarding coffee, its water requirements (879–1,178 mm) are lower than those suggested as optimal by Ruiz et al. (2013), with values of 1,200–1,800 mm.
In the case of native maize, the average water demand of the entire productive chain is similar to the value found by Villanueva et al. (2001) for the High Plateau and Middle Zones of San Luis Potosí. Specifically, the result obtained for the Tecamachalco region is lower than that reported (Villareal, 2020) and higher than that calculated using the FAO software (CROPWAT). However, the latter only considers four of the 6 months of the vegetative cycle.
Concerning the Relative Water Stress Index (RWSI), García (2017) found that, of five Study Networks evaluated in the Río Naranjo hydrographic basin in Cuba, 60% show a high index and 40% a medium index. In the case of the State of Puebla, out of the 154 municipalities evaluated, 13% have a high index; 11% medium; 41% moderate; and 35% low, under the following considerations:
a. In the 56 municipalities with low RWSI, which do not experience pressure on water availability, it is possible to expand the area and/or the density of sowing or planting crops in this classification. However, it is necessary to expand the study to analyze production costs.
b. In the rest of the municipalities with moderate (62), medium (12), and high (24) RWSI, the water supply is a limiting factor for the development or even insufficient for food production, so it is recommended to strengthen the institutional strategy through the execution of rainwater harvesting, storage practices and works.
Concerning the rates of metabolic intensity and density, the average water profitability of avocado (8 kg/m3) is higher than the estimate (3.87 kg/m3) by Madrid and Velázquez (2008) for six regions of Andalusia, Spain, although with different agroclimatic. Regarding the average yield of native maize in municipalities classified as very efficient and efficient (2.04 t/ha and - 2.87 t/ha, respectively), it is similar to that reported by Velázquez et al. (2019) for the high production region (2.6 t/ha). In municipalities classified as deficient, the average yield (1.38 t/ha) ranges from 0.49 t/ha to 2.0 t/ha in the medium production region. In the very deficient municipalities, the average yield (1.21 t/ha) is higher than that of the low-production region (0.60 t/ha). In these municipalities, the supply of maize does not satisfy the demand of 41.2% of the population, which consumes it through tortillas or atole. Such a population is part of the 31% of the state’s total population with access to healthy and accessible food (CONEVAL, 2021).
The agave productive chain presented the highest profitability related to water, which was 0.85 USD per cubic meter, and the highest productive chain-water interrelation: 8.8 kilograms per cubic meter. The coffee production chain uses the most significant volume of water (25.1 m3) to generate 1.00 USD, and its yield (2.3 t/ha) is 153% higher than the national average yield (SIAP, 2021). The pitaya-pitahaya production chain is the one that comes closest to the water requirement of the crops, with 97.9% of the required water/applied water ratio. The agave and pitaya-pitahaya productive chains present deficits in the water balance since the effective water is insufficient to satisfy the water requirements of the crops (SMN, 2021).
The state of Puebla’s public agricultural policy aims to enhance the productivity of nine high-value commercial chains. It encompasses various measures, including the reinforcement of regional productive systems to ensure food security and the implementation of innovative mechanisms and productive reconversion (Gobierno del Estado de Puebla, 2019a). The government’s goal is to achieve a 40.49% growth (353.73 million USD) in the total value of agricultural production, from 873.73 million USD in 2018 to a target of 1,227.46 million USD by 2024 (Gobierno del Estado de Puebla, 2019b). Based on this projection and applying the same percentage (40.5%), it can be inferred that the value of the agricultural production of the nine productive chains will have to go from 137.49 million USD in 2018 to 193.15 million USD in 2024, with a growth of 55.67 million USD.
Nevertheless, to achieve the 2024 goal in the productive chains, such strategy faces SES restrictions such as: (i) a decrease in rainfall (263.4 mm or 19%) from 2010 to 2020 (SMN, 2021), (ii) depletion of aquifers and contamination of surface waters, especially the Atoyac river (CONAGUA, 2021; REPDA, 2021), (iii) the decrease in the economically active population dedicated to the primary sector (INEGI, 2021) and (iv) insufficient supply of basic foods that do not satisfy the demand of the population in some specific territories, as is the case of native maize.
These restrictions have the following effects: the nine productive chains depend on 99.9% of rainwater, and the remaining 0.04% is extracted from aquifers. Although, at the overall level, there is a 15% surplus of water in the agave and pitaya-pitahaya chains, and in some municipalities of other productive chains, there are water deficiencies (Figure 4; Supplementary Figure SM-4). The direct effect is that, of the total planted area, 98,284 ha (35%), 56 municipalities have a low RWSI, whose communities do not experience pressure on water resources; improving productivity by increasing the plant population density is even possible. Besides, 113,752 ha (41%) of 62 municipalities present a moderate RWSI. The availability of water can become a limitation of agricultural development. This means that the water supply is reaching the maximum limit to meet the demand, so there is a high risk of becoming a limiting factor for development.
Other contributions to the discussion are: (1) 35,566 ha (13%) of 24 municipalities register a high RWSI, the water supply is insufficient to meet the water demand. Other information about water is the fact that 35,566 hectares (13%) of the total area assessed across 24 municipalities report a high Rural Water Security Index (RWSI), indicating that the available water supply is insufficient to meet the demand. The productive chains of these municipalities can be shown in Supplementary Figure SM-14.
(2) In relation to the above, in seven of the nine productive chains, a greater volume of water was used than that which the crops should have required: avocado (129%), berries (142%), coffee (154.6%), fig (161%), native maize (107.8%), plantain-citrus (118.2%) and vanilla (135.2%), while just two chains used less water than that demanded by the crop: agave (89.5%) and pitaya-pitahaya (97.9%), which means the need to increase the efficiency in the use of water resources.
According to the rates of metabolic intensity and density, a direct effect of the variability in water availability and its level of efficiency in agricultural use is reflected in the numbers between local average yields and national ones. As an illustration, the local average yields for certain crops demonstrate the impact of water availability and its efficiency in agricultural use. The average yield of avocados, for instance, is 60% compared to the national average, while berries yield 67%, native maize yields 73%, and pitaya-pitahaya yields 65% in comparison. The most worrying case is for native maize: 23 municipalities (46%) register a very deficient CEIWFMID (Supplementary Figure SM-15; Supplementary Table SM-1). The supply of maize is 81,937 tons per year short to meet the demand, affecting 776,652 inhabitants (41.0% of the total population of the chain). This deficiency in the demand/supply of maize occurs mainly in the municipality of Tehuacán. The supply of native maize in this region, reaching 2,613 t/y, falls considerably short of the demand which amounts to 34,531 t/y, taking into account the needs of its 327,312 inhabitants. This supply is only sufficient to meet the annual per capita grain needs of 7.57% of the population, corresponding to 24,768 individuals. Also in this municipality, the supply of water (8,649 hm3/y) is way below the demand from the crop (14,197 hm3/y).
Focusing on profitability, in general terms, agave is the most efficient chain related to water, with a value of 0.85 m3 of water to generate 1 USD; the production-water ratio is 8.8 kg/m3. In contrast, the vanilla chain is the least efficient, with values of 0.045 kg/m3. This lower efficiency is because in the municipality of Ayotoxco, with 16% of the planted area of the crop, the yield is only 0.28 t/ha.
Additionally, in the study area, the number of individuals engaged in paid work within the agriculture sector decreased by 7.1% (12,314 people) between 2010 and 2020. Similarly, at the state level, the proportion of this population declined from 22% in 2010 to 18% in 2020 (INEGI, 2021). This is the effect of a notable trend of individuals abandoning agricultural activities in order to seek supplementary income through migration to other sectors or occupations. The need to supplement family income is the driving force behind this shift.
Immediate actions are imperative to capture and store rainwater to alleviate the mounting pressure on aquifer and basin by water extraction. Neglecting this issue poses a significant threat to the availability of water for both agricultural use and human consumption. The projected estimation for the Valle de Tecamachalco aquifer shows a concerning availability deficit of −25.89% (−47,745 hm3/year) by the year 2070. In the case of the Valle de Puebla aquifer, it will be −5.04% (−11.48 hm3/year); and the Libres-Oriental aquifer will present a deficit of −21.17% (−30,224 hm3/year) (Villareal, 2017, 2018, 2020). As regards the availability of surface water, five basins to which the State of Puebla belongs to present a deficit in the available volume: Río Alto Atoyac (−6,549 hm3/year), Río Nexapa (−4,309 hm3/year), Río Bajo Atoyac (−738.81 hm3/year), Río Mixteco (−137,313 hm3/year), and Río Libres Oriental (−9,238 hm3/year) (National Water Information System, 2022).
Our findings will aid in the identification of potential limitations within the natural system (feasibility) and internal barriers to agricultural development (viability) within the socio-ecological system (SES) (FAO, 2013; Cabello et al., 2019; Cadillo-Benalcazar et al., 2022). Additionally, our research aims to address the question regarding the significance of the State of Puebla’s public policy in revitalizing the rural areas. This can be achieved through the promotion of high-value productive chains, according to such policy. Instead of focusing on resilient native crops that can withstand drought conditions (González-Lemes et al., 2023). For instance, polyculture practices involving maize, beans, and squash have shown promise (Fonteyne et al., 2023). It is essential to consider that the occurrence of droughts, attributed to anthropogenic climate change, will persist (Yuan et al., 2023). Hence, the public agricultural policy of the State of Puebla aligns with the Business as Usual (Bau) scenario (A2) but contradicts global development strategies (B1) aimed at keeping global temperatures below 1.5° C. To address this, it is crucial to implement new economic models and local development strategies in line with the recommendations outlined by the Intergovernmental Panel on Climate Change (IPCC, 2023).
4.1. Strengths and improvements for the accounting model
The results confirm the assumption that water appropriation processes are governed by the agroclimatic conditions of crops and the quantity and quality of available water in the side of the natural system (Yuan et al., 2023). The validation of these results through the methods used in the present investigation is supported by the grammar of water metabolism and the grammar of the water-food nexus, based on the flow-fund rations and relational analysis (four Aristotelian causes) and their interrelation between the ecological and social system. With the RWSI and the metabolic intensity and density rates, it was possible to compare the productive effectiveness and water use of all the crops of the nine production chains at the municipal level. Hence, it was possible to understand the changes occurring in the SES of the nine ADC boosted by regional public policy. That is the pressure-state relationship, by observing, on the one hand, a trend in the decrease of rainfall and water level in aquifers for food production. The stress on agriculture can be observed through the trend of decreasing rainfall and water levels in aquifers, which impacts food production. Additionally, the main concern lies in the simultaneous increase in crop demand and the reduced time allocated to agricultural activities. The results presented here illustrate the potential use of the proposed approach to support the design of current public policies for different Ministries of Agricultural and Rural Development levels of the Mexican Government. Finally, a notable limitation of the proposal is the lack of availability and compatibility between historical and current data on official crop statistics at the municipal level, in contrast to the data available at the state or national scale for watersheds, aquifers, precipitation, or droughts.
5. Conclusion
By conducting a metabolic characterization of crops, it becomes possible to identify agricultural production strategies while taking into account the limitations imposed by water resources. From our analysis perspective, it was possible to understand the changes occurring in the Socio-Ecological System of the nine agricultural chains. On the one hand, a trend in the decrease in rainfall and water level in the aquifers for food production was observed. On the other hand, there is an increase in the demand for crops, but at the same time, there is a reduction in the time allocated to labor in agricultural activities.
The Relative Water Stress Index (RWSI) helped understand the demand/supply ratio of water required by each crop at the municipal level and categorize the effects of limitations on food production caused by insufficient water availability. This analysis revealed that in 65% of the cultivated area, these limitations have a negative effect on both the volume and value of food production. Additionally, in the short term, these constraints have the potential to impede development.
The Metabolic Intensity and Density Rates made it possible to compare the productive effectiveness and water use of all the crops of the nine productive chains, even at the municipal level. The agave chain obtained the best results, while vanilla was the least efficient. Regarding the combined effectiveness of the rates of metabolic intensity and density of the demand/supply of water and food of the native maize chain, it was identified that in 23 municipalities, they are classified as very deficient, according to the Combined Efficiency Index of Water-Food Metabolic Intensity and Density (CEIWFMID), in which the supply of maize is in deficit, especially in the municipality of Tehuacan, State of Puebla.
Moreover, the estimated 2024 goal of increasing food production value in production chains by 40.49% leads to an advance of 20.2% until 2020 concerning 2018. However, given that the production value depends on the prices set by the supply–demand of the markets, it is further necessary to deepen the analysis to identify in what proportion the production costs increase and the farmers’ gross and net profit.
It is crucial to ensure the correct treatment of data to maintain the authenticity, reliability, and accuracy of research related to official statistics at various levels, including crops, watersheds, aquifers, rainfall, and droughts. Furthermore, an important limitation of our analysis was the lack of detailed information regarding the allocation of labor time in agricultural activities, which should be considered in future research.
Data availability statement
The original contributions presented in the study are included in the article/Supplementary material, further inquiries can be directed to the corresponding author.
Author contributions
EE: investigation, methodology, validation, and formal analysis. GO, QO-R, and MC: review and editing. MM: conceptualization, methodology, validation, formal analysis, and writing-original draft preparation and editing. All authors contributed to the article and approved the submitted version.
Funding
The authors would like to express their gratitude to the Consejo de Ciencia y Tecnología del Estado de Puebla (CONCYTEP), Mexico, for funding research support.
Acknowledgments
Thanks to the support provided by Cesar V. Hernández for this project in the elaboration of some maps.
Conflict of interest
The authors declare that the research was conducted in the absence of any commercial or financial relationships that could be construed as a potential conflict of interest.
Publisher’s note
All claims expressed in this article are solely those of the authors and do not necessarily represent those of their affiliated organizations, or those of the publisher, the editors and the reviewers. Any product that may be evaluated in this article, or claim that may be made by its manufacturer, is not guaranteed or endorsed by the publisher.
Supplementary material
The Supplementary material for this article can be found online at: https://www.frontiersin.org/articles/10.3389/fsufs.2023.1252546/full#supplementary-material
References
Cabello, V., Renner, A., and Giampietro, M. (2019). Relational analysis of the resource nexus in arid land crop production. Adv. Water Resour. 130, 258–269. doi: 10.1016/j.advwatres.2019.06.014
Cadillo-Benalcazar, J., Silva-Macher, J. C., and Salinas, N. (2022). Applying the multi-scale integrated analysis of societal and ecosystem metabolism (MuSIASEM) to characterize the society–agriculture–forest system: the case of Huayopata, Cuzco (Peru). Environ. Dev. Sustain. 2022, 1–24. doi: 10.1007/s10668-022-02457-6
Cao, X., Bao, Y., Li, Y., Li, J., and Wu, M. (2023). Unravelling the effects of crop blue, green and grey virtual water flows on regional agricultural water footprint and scarcity. Agric. Water Manag. 278:108165. doi: 10.1016/j.agwat.2023.108165
Cao, X., Mengyang, W., Xiangping, G., Yalian, Z. B., Yan, G., Nan, W. B., et al. (2017). Assessing water scarcity in agricultural production system based on the generalized water resources and water footprint framework. Sci. Total Environ. 609, 587–597. doi: 10.1016/j.scitotenv.2017.07.191
Chiang, F., Mazdiyasni, O., and AghaKouchak, A. (2021). Evidence of anthropogenic impacts on global drought frequency, duration, and intensity. Nat. Commun. 12:2754. doi: 10.1038/s41467-021-22314-w
CONAGUA . (2021). Detalle de los acuíferos en México al 2021. Comisión Nacional del Agua. Available at: http://sina.conagua.gob.mx/sina/tema.php?tema=acuiferos&ver=reporte&o=1&n=nacional (Accessed August 23, 2022).
CONEVAL . (2021). Treinta años de evolución de las carencias sociales a partir de instrumentos censales y la Encuesta Intercensal, 1990–2020. Consejo Nacional de Evaluación de la Política de Desarrollo Social. Available at: https://www.coneval.org.mx/Medicion/Documents/Carencias_sociales_censales_90_20/Presentacion_evolucion_carencias_sociales_censales_1990_2020.pdf (Accessed August 26, 2022).
Dalin, C., Taniguchi, M., and Green, T. R. (2019). Unsustainable groundwater use for global food production and related international trade. Glob. Sustain. 2, 1–11. doi: 10.1017/S2059479819000073
Dalin, C., Wada, Y., Kastner, T., and Puma, M. (2017). Groundwater depletion embedded in international food trade. Nature 543, 700–704. doi: 10.1038/nature21403
Debaere, P., and Konar, M. (2022). Water resources and trade: A research vision. PLoS Water 1:e0000010. doi: 10.1371/journal.pwat.0000010
FAO . (2006). Evapotranspiración del cultivo. Guías para la determinación de los requerimientos de agua de los cultivos. Estudio FAO Riego y Drenaje. 56. Food and Agriculture Organization of the United Nations. Available at: https://www.fao.org/3/x0490s/x0490s00.htm (Accessed September 19, 2022).
FAO . (2013). An innovative accounting framework for the food-energy-water Nexus. Application of the MuSIASEM approach to three case studies. Food and agriculture Organization of the United Nations. Available at: https://www.fao.org/3/i3468e/i3468e.pdf (Accessed May 29, 2022).
FAO . (2014). The water-energy-food Nexus A new approach in support of food security and sustainable agriculture. Food and Agriculture Organization of the United Nations. Available at: https://www.fao.org/3/bl496e/bl496e.pdf (Accessed May 30, 2022).
FAO . (2016). Farmer field school guidance document. Planning for quality programmers. Available at: https://www.fao.org/3/i5296e/i5296e.pdf (Accessed June 18, 2022).
FAO, FIDA, OMS, PMA, UNICEF . (2021). El estado de la seguridad alimentaria y la nutrición en el mundo 2021. Transformación de los sistemas alimentarios en aras de la seguridad alimentaria, una nutrición mejorada y dietas asequibles y saludables para todos. Rome, Italy: FAO.
Fernández, D., Martínez, M., Tavarez, C., Castillo, R., and Salas, R. (2009). Estimación de las demandas de consumo de agua. Colegio de Postgraduados. Available at: https://www.academia.edu/32110228/ESTIMACI%C3%93N_DE_LAS_DEMANDAS_DE_CONSUMO_DE_AGUA_COLEGIO_DE_POSTGRADUADOS_SECRETAR%C3%8DA_DE_AGRICULTURA_GANADER%C3%8DA_DESARROLLO_RURAL_PESCA_Y_ALIMENTACI%C3%93N_Subsecretar%C3%ADa_de_Desarrollo_Rural_Direcci%C3%B3n_General_de_Apoyos_para_el_Desarrollo_Rural_2_CONTENIDO (Accessed July 23, 2022).
Fonteyne, S., Castillo Caamal, J. B., Lopez-Ridaura, S., Van Loon, J., Espidio Balbuena, J., Osorio Alcalá, L., et al. (2023). Review of agronomic research on the milpa, the traditional polyculture system of Mesoamerica. Front. Agron. 5:1115490. doi: 10.3389/fagro.2023.1115490
García, Y. (2017). Índice de vulnerabilidad del recurso hídrico con fines de riego en la cuenca hidrográfica del Río Naranjo, Cuba. Rev. Geogr. Am. Central 1, 315–330. doi: 10.15359/rgac.58-1.13
Georgescu-Roegen, N. (1971). The entropy law and the economic process. Cambridge, MA: Harvard University Press.
Gerber, J. F., and Scheidel, A. (2018). In search of substantive economics: comparing Today’s two major socio-metabolic approaches to the economy–MEFA and MuSIASEM. Ecol. Econ. 144, 186–194. doi: 10.1016/j.ecolecon.2017.08.012
Giampietro, M., Aspinall, R., Bukkens, S., Benalcazar, J., Diaz, F., Flammini, A., et al. (2013). An innovative accounting framework for the food-energy-water Nexus. Application of the MuSIASEM approach to three case studies. Rome, Italy: FAO.
Giampietro, M., Cadillo Benalcazar, J. J., Di Felice, L. J., Manfroni, M., Pérez Sánchez, L., Renner, A., et al. (2021). Report on the experience of applications of the Nexus structuring space in quantitative storytelling, MAGIC (H2020–GA 689669) project deliverable 4.4, revision (version 2.0). First published 30 august 2020, revised 25 January 2021.
Giampietro, M., and Mayumi, K. (2000a). Multiple-scale integrated assessment of societal metabolism: introducing the approach. Popul. Environ. 22, 109–153. doi: 10.2307/27503739
Giampietro, M., and Mayumi, K. (2000b). Multiple-scale integrated assessments of societal metabolism: integrating biophysical and economic representations across scales. Popul. Environ. 22, 155–210. doi: 10.1023/A:1026643707370
Giampietro, M., Mayumi, K., and Sorman, A. H. (2012). The metabolic pattern of societies: Where economists fall short. Abingdon: Routledge.
Gobierno del Estado de Puebla . (2019a). Plan Estatal de Desarrollo Gobierno del Estado de Puebla 2019–2024. Available at: https://repositorio.buap.mx/rcontraloria/public/inf_public/2019/0/Plan_Estatal_de_Desarrollo_2019-2024.pdf (Accessed June 15, 2022).
Gobierno del Estado de Puebla . (2019b). Programa Sectorial Desarrollo Rural 2019–2024. Available at: https://planeader.puebla.gob.mx/pdf/ProgramasSectoriales2020/PROGRAMA%20SECTORIAL%20DE%20DESARROLLO%20RURAL%202019-2024.pdf (Accessed June 15, 2022).
González-Lemes, I., Acosta-Maspons, A., Cetz-Chel, J. E., Polania, J. A., Acosta-Gallegos, J. A., Alfredo Herrera-Estrella, A., et al. (2023). Carbon-concentrating mechanisms in pods are key elements for terminal drought resistance in Phaseolus vulgaris. J. Exp. Bot. 74, 1642–1658. doi: 10.1093/jxb/erac504
Guiampietro, M. (2019). “Anticipation in Agriculture” in Handbook of anticipation. ed. R. Poli (New York: Springer)
Gumidyala, S., Ruess, P. J., Konar, M., Marston, L., Dalin, C., and Wada, Y. (2020). Groundwater depletion embedded in domestic transfers and international exports of the United States. Water Resour. Res. 56:24986. doi: 10.1029/2019WR024986
Haberl, H., Wiedenhofer, D., Pauliuk, S., Krausmann, F., Müller, D. B., and Fischer-Kowalski, M. (2019). Contributions of sociometabolic research to sustainability science. Nat Sustain 2, 173–184. doi: 10.1038/s41893-019-0225-2
INEGI . (2011). Censo de Población y Vivienda 2010. Tabulados del cuestionario ampliado. Instituto Nacional de Estadística y Geografía. Available at: https://www.inegi.org.mx/programas/ccpv/2010/ (Accessed on July 21, 2022).
INEGI . (2021). Censo de Población y Vivienda. Tabulados del cuestionario ampliado. Instituto Nacional de Estadística y Geografía. Available at: https://www.inegi.org.mx/programas/ccpv/2020/ (Accessed on July 21, 2022).
IPCC . (2022). Impacts, Adaptation and Vulnerability. Summary for Policymakers, Technical Summary and Frequently Asked Questions. Working Group II contribution to the Sixth Assessment Report of the Intergovernmental Panel on Climate Change. Available at: www.ipcc.ch/report/ar6/wg2/downloads/report/IPCC_AR6_WGII_SummaryVolume.pdf
IPCC . (2023). CLIMATE CHANGE 2023 Synthesis Report Summary for Policymakers. Available at: www.ipcc.ch/report/ar6/syr/downloads/report/IPCC_AR6_SYR_SPM.pdf
La Rota-Aguilera, M. J., Delgadillo-Vargas, O. L., and Tello, E. (2022). Sociometabolic research in Latin America: A review on advances and knowledge gaps in agroecological trends and rural perspectives. Ecol. Econ. 193:107310. doi: 10.1016/j.ecolecon.2021.107310
Louie, A. H. (2017). “Relational biology” in Handbook of anticipation. ed. R. Poli (New York: Springer)
Madrid, C., and Velázquez, E. (2008). El metabolismo hídrico y los flujos de agua virtual. Una aplicación al sector hortofrutícola de Andalucía (España). Rev. Iberoam. Econ. Ecol. 8, 29–47.
Mayor, B. (2017). El nexo Agua-Energía-Alimentación: tendencias, intercambios e implicaciones para energías estratégicas. Tesis Doctoral. Facultad de Ciencias Geológicas. Universidad Complutense de Madrid.
Morales-Mora, M. A., Zunzunegui, E. E., and Fuentes Hernández, M. M. (2022). Atlas Fisiográfico de la disponibilidad hídrica para la producción de cultivos estratégicos de Puebla, Evaluación de nueve estudios de caso desde la perspectiva del metabolismo social y ecosistémico del agua. CONCYTEP. Available at: https://concytep.gob.mx/publicaciones/libro-c-l-2022-07-42-atlas-fisiografico-de-la-disponibilidad-hidrica#1.
Müller-Merbach, H. (2005). How to structure knowledge: Aristotle and the four causes. Knowl. Manage. Res. Pract. 3, 183–184. doi: 10.1057/palgrave.kmrp.8500070
National Water Information System . (2022). Watersheds. Available at: http://sina.conagua.gob.mx/sina/tema.php?tema=cuencas (Accessed August 12, 2022).
Pimentel, D., Hurd, L. E., Belloti, A. C., Forster, M. J., Oka, I. N., Sholes, O. D., et al. (1973). Food production and the energy crisis. Science 182, 443–449. doi: 10.1126/science.182.4111.443%0A
Rayner, S. (2012). Uncomfortable knowledge: the social construction of ignorance in science and environmental policy discourses. Econ. Soc. 41, 107–125. doi: 10.1080/03085147.2011.637335
REPDA . (2021). Volúmenes inscritos nacionales. Obtenido de Conagua. Subdirección General de Administración del Agua: Available at: http://sina.conagua.gob.mx/sina/tema.php?tema=usosAgua&ver=reporte&o=0&n=nacional (Accessed June 19, 2022).
Rodríguez, D., Serrano, H., Delgado, A., Nolasco, D., and Saltiel, G. (2020). De residuo a recurso: Cambiando paradigmas para intervenciones más inteligentes para la gestión de aguas residuales en América Latina y el Caribe. Banco Mundial. Available at: https://openknowledge.worldbank.org/handle/10986/33436?locale-attribute=es (Accessed June 19, 2022).
Rosen, R. (1991). Life itself: A comprehensive inquiry into the nature. Columbia: Columbia University Press.
Ruggerio, C. (2015). Desarrollo de un Modelo de Metabolismo Hídrico para el Análisis de la Sustentabilidad Hídrica de Cuencas Hidrológicas de Llanura. Tesis Doctoral. Universidad Nacional de General Sarmiento. Available at: https://www.ungs.edu.ar/wp-content/uploads/2020/11/Ruggerio-DCyT-Final.pdf (Accessed June 19, 2022).
Ruiz, C., Medina, G., González, A., Flores, L., Ramírez, O., Ortiz, T., et al. (2013). Requerimientos agroecológicos de cultivos. Segunda Edición. Libro Técnico Núm. 3. INIFAP. Instituto Nacional de Investigaciones Forestales Agrícolas y Pecuarias-CIRPAC-Campo Experimental Centro Altos de Jalisco. Tepatitlán de Morelos, Jalisco, México. p. 564.
SADER . (2016). Escuelas de Campo, enseñanza sin muros. Available at: https://www.gob.mx/agricultura/articulos/escuelas-de-campo-ensenanza-sin-muros (Accessed June 9, 2022).
SDR . (2021). Identificación de Polos de Desarrollo 2021. Secretaría de Desarrollo Rural. Puebla. Periódico Oficial del Gobierno del Estado de Puebla. Acuerdo de la Secretaría de Desarrollo Rural del Gobierno del Estado de Puebla, por el que establece las Reglas de Operación de los Programas para el Campo Poblano. Available at: https://sdr.puebla.gob.mx/media/k2/attachments/REGLAS_DE_OPERACI%C3%93N_SDR_2022_compressed.pdf (Accessed July 3, 2022).
Seleiman, M. F., Al-Suhaibani, N., Ali, N., Akmal, M., Alotaibi, M., Refay, Y., et al. (2021). Drought stress impacts on plants and different approaches to alleviate its adverse effects. Plan. Theory 10:259. doi: 10.3390/plants10020259
SIAP . (2021). Cierre de la producción agrícola 2010–2020. Servicio de Información Agroalimentaria y Pesquera de la Secretaría de Agricultura y Desarrollo Rural. Obtenido de Gobierno de México. Available at: http://infosiap.siap.gob.mx/gobmx/datosAbiertos_a.php (Accessed June 19, 2022).
SMN . (2021). Nonmales climatológicas por estado. Servicio Meteorológico Nacional de la Comisión Nacional del Agua. Available at: https://smn.conagua.gob.mx/es/climatologia/informacion-climatologica/normales-climatologicas-por-estado. (Accessed June 10, 2022).
Sreeparvathy, V., and Srinivas, V. V. (2022). Meteorological flash droughts risk projections based on CMIP6 climate change scenarios. NPJ Clim. Atmos. Sci. 5:77. doi: 10.1038/s41612-022-00302-1
Taghdisian, A., Bukkens, S. G. F., and Giampietro, M. (2022). A societal metabolism approach to effectively analyze the water–energy–food Nexus in an agricultural Transboundary River basin. Sustainability 14:9110. doi: 10.3390/su14159110
Tejedor, N. (2018). Desarrollo Sostenible y Nexo Agua-Energía-Alimentos: Una Perspectiva Multivariante. Tesis doctoral. Universidad de Salamanca. Available at: https://www.researchgate.net/publication/328199675_Desarrollo_Sostenible_y_Nexo_Agua-Energia-Alimentos_Una_Perspectiva_Multivariante (Accessed June 7, 2022).
Velázquez, J., Ramírez, V., and Juárez, J. (2019). Regionalización de la producción de maíz de temporal en el Estado de Puebla, México. Cuadernos Geográficos 58, 152–167. doi: 10.30827/cuadgeo.v58i2.7531
Villanueva, J., Loredo, C., and Hernández, A. (2001). Requerimientos hídricos de especies anuales y perennes en la zona media y altiplano de San Luis Potosí. Instituto Nacional de Investigaciones Forestales, Agrícolas y Pecuarias. INIFAP. Available at: http://www.inifapcirne.gob.mx/Biblioteca/Publicaciones/755.pdf.
Villareal, L. (2017). Disponibilidad y demanda de agua en el acuífero Libres-Oriental, Puebla, en el periodo 2015–2070. Colegio de Postgraduados.
Villareal, L. (2018). Proyección de la disponibilidad y demanda de agua en el acuífero valle de puebla, en el período 2015–2070. Colegio de Postgraduados.
Villareal, L. (2020). Proyección de la disponibilidad y demanda de agua del acuífero de Valle de Tecamachalco, Puebla. Colegio de Postgraduados.
Voelker, T., Blackstock, K., Kovacic, Z., Sindt, J., Strand, R., and Waylen, K. (2022). The role of metrics in the governance of the water-energy-food nexus within the European Commission. J. Rural. Stud. 92, 473–481. doi: 10.1016/j.jrurstud.2019.08.001
WWAP . (2022). Aguas subterráneas. Hacer visible el recurso invisible. Informe Mundial de las Naciones Unidas sobre el Desarrollo de los Recursos Hídricos. UNESCO. Available at: https://www.undp.org/es/publications/informe-mundial-de-las-naciones-unidas-sobre-el-desarrollo-de-los-recursos-hidricos-2022-aguas-subterraneas-hacer-visible-el-recurso#:~:text=La%20edici%C3%B3n%20de%202022%20del,las%20aguas%20subterr%C3%A1neas%20en%20todo (Accessed on July 9, 2022).
Keywords: metabolic density and intensity indicators, MuSIASEM, drought risk, sustainable water management, water allocation, water stress index, water-land-food nexus
Citation: Escamilla EZ, Ordoñez GÁ, Orozco-Ramírez Q, Caballero Castrillo MA and Morales Mora MA (2023) Applying societal metabolism to characterize water availability, requirement, and scarcity in agriculture. A case study of Mexico. Front. Sustain. Food Syst. 7:1252546. doi: 10.3389/fsufs.2023.1252546
Edited by:
Abdelazim Negm, Zagazig University, EgyptReviewed by:
El-Sayed Ewis Omran, Suez Canal University, EgyptHalah El_Said Mohamed Bassiony, Zagazig University, Egypt
Copyright © 2023 Escamilla, Ordoñez, Orozco-Ramírez, Caballero Castrillo and Morales Mora. This is an open-access article distributed under the terms of the Creative Commons Attribution License (CC BY). The use, distribution or reproduction in other forums is permitted, provided the original author(s) and the copyright owner(s) are credited and that the original publication in this journal is cited, in accordance with accepted academic practice. No use, distribution or reproduction is permitted which does not comply with these terms.
*Correspondence: Miguel A. Morales Mora, bWlndWVsLm1vcmFsZXNAY29scHVlLmVkdS5teA==