 Getachew Eshetu Gidelew
 Bamlaku Alamirew Alemu3
 Koyachew Enkuahone Kassie
- 1Department of Rural Development and Agricultural Extension, College of Agriculture and Environmental Sciences, Bahir Dar University, Bahir Dar, Ethiopia
- 2Department of Rural Development and Agricultural Extension, College of Agriculture, Wollo University, Dessie, Ethiopia
- 3Food and Agriculture Organization, Addis Ababa, Ethiopia
Introduction: In Ethiopia and other developing countries, the commercialization of smallholder agriculture is a key strategy for achieving agricultural and overall economic growth. Crop cluster farming has emerged as a growing trend in Ethiopia to support these commercialization efforts. This study assesses the impact of cluster farming on crop commercialization among smallholder farmers in Northwestern Ethiopia. It offers novel insights by considering the commercialization of both cluster and non-cluster crops, highlighting potential spillover benefits of cluster farming practices on non-target commodities—an area often overlooked in prior research.
Methods: This study used a cross-sectional research design. Data were gathered from 421 farming households through face-to-face interviews. The data was analyzed using Endogenous Switching Regression and inferential statistics, including t-tests and chi-square tests. Commercialization was measured using two indicators: the total value of crops sold and the proportion of crops sold.
Results: The results showed that, on average, participating households earned 1,106 USD annually from crop sales, while non-participating households earned 731 USD. Additionally, participant households sold on average 50% of the crops they produced, compared to 36% for non-participants. Similarly, households engaged in cluster farming of wheat, maize, and teff reported higher incomes and proportion of sales than those who did not engage.
Conclusion: Our findings suggest that there is a positive association between cluster farming participation and commercialization in both indices. Thus, the scaling up of cluster farming to a wider farming community is recommended to enhance the commercialization of smallholder farmers.
1 Introduction
Smallholder-dominated agriculture is a vital sector in least-developed countries, contributing more than 25% to their Gross Domestic Product (GDP) (World Bank, 2024) and playing a significant role in promoting global food security and nutrition (Gomez y Paloma et al., 2020; Temesgen and Aweke, 2023). In Ethiopia, smallholder agriculture holds a controversial position. On one hand, it provides livelihoods for over three-quarters of the population, contributes about 33% to the national GDP (Woolfrey et al., 2021), and generates 75% of foreign currency (Zandstra et al., 2024). On the other hand, the sector is criticized for its failure to improve farmers’ livelihoods (Wendimu, 2021), mainly due to its subsistence nature, which results from the low adoption of improved technologies, farming practices, and weak market linkages (Gidelew et al., 2022; Girma and Kelil, 2021). This may be due to a combination of household-level factors, such as low education levels, small farm sizes, and land fragmentation, and a lack of policy support, including poor infrastructure, weak financial institutions (e.g., credit providers), and inadequate policy incentives such as subsidies (FAO, 2023). Therefore, transforming subsistence agriculture into a commercially oriented sector is seen as a pathway to enhancing smallholder farmers’ livelihoods (Belay et al., 2021; Gebiso et al., 2023).
Cognizant of the aforementioned advantages of smallholder agriculture, Ethiopia has emphasized supporting agricultural commercialization as a key driver of agricultural and overall economic growth (Cheber, 2018; Getahun, 2021; Tabe-Ojong and Geffersa, 2024). Since the 1990s, the government of Ethiopia has formulated an agricultural development-led industrialization (ADLI) strategy to transform smallholder agriculture (Dube et al., 2019). As part of this ADLI framework, the Ethiopian government has recently introduced two interconnected initiatives: the Agricultural Commercialization Cluster (ACC), also known as the economic corridor or cluster program and the agro-industrial park development (Alemu and Berhanu, 2018). Though the two approaches are interlinked through forward-backwards linkage (Pauw, 2017), this study primarily focuses on the former.
The ultimate goal of the cluster farming approach is to exploit the comparative advantage of a particular geographic area by improving the productivity and income of farmers (Karki et al., 2021). In cluster farming, farmers in adjacent farmland share a proportion of their land to grow selected crops collectively, primarily for commercial purposes (Degefu et al., 2024). A cluster farming program helps shift smallholder agriculture from subsistence to commercial orientation by increasing the quality and productivity of cluster-priority commodities (Cheffo et al., 2023). There are 10 priority commodities for cluster farming: tomato (Solanum lycopersicum), onion (Allium cepa), banana (Musa), mango (Mangifera indica), avocado (Persea americana), teff (Eragrostis tef), wheat (Triticum aestivum), maize (Zea mays), sesame (Sesamum indicum), and malt barley (Hordeum vulgare) (Tafesse, 2022). Additionally, cluster farming can increase the level of commercialization among smallholder farmers by connecting them to emerging market value chains (Endalew et al., 2024).
The concept of cluster farming was introduced in Ethiopia by the Agricultural Transformation Institute (ATI), the then Agricultural Transformation Agency (ATA) in 2004 (Mamo, 2020). It was first introduced in the Amhara, Oromia, Tigray and Southern Nations, Nationalities and Peoples (SNNP) regions (Alemu and Berhanu, 2018). Teff, wheat and maize are the major cereal crops prioritized under the cluster farming program (Louhichi et al., 2019). These commodities are also produced under a cluster approach in the East and North Gojjam Zones of the Amhara region, where this study was conducted. In terms of area coverage, in the 2021/2022 production season, teff and wheat cover 166,189 and 122,912 hectares, respectively [East Gojjam Office of Agriculture (EGoA), 2023], while maize covers 59,629.5 hectares [South Achefer Office of Agriculture (SAoA), 2023]. However, to our knowledge, no empirical evidence exists on the association between cluster farming and commercialization in the study area. Moreover, although few literature exists on cluster farming-related issues (Degefu et al., 2024; Hussen and Geleta, 2021; Tabe-Ojong and Dureti, 2022; Wardhana, 2018; Wardhana et al., 2021; Washim et al., 2015), the existing literature has given little emphasis to the effect of cluster farming on farmers’ commercialization (Abate, 2021; Dureti et al., 2023; Endalew et al., 2024).
Previously, Abate (2021) used the Propensity Score Matching (PSM) model to investigate the effect of cluster farming on farmers’ commercialization of a single commodity (maize) and used the commercialization index measured as the ratio of maize sold to maize produced as a proxy measure of commercialization. However, using only the proportion of crops sold as a measure of commercialization may be inadequate and misleading, as it overlooks factors like selling price, timing, and quantity sold. For instance, assume a scenario where one farmer produces 2 quintals of maize and sells 1 quintal, while another produces 8 quintals and sells 4 quintals. Although the commercialization index would suggest that both farmers have a 50% degree of commercialization, the actual value generated by each farmer is significantly different. Even the value of the same quantity of a commodity can vary depending on the timing of the sale.
Endalew et al. (2024) followed the same procedure as that of Abate (2021) except that they studied a different commodity (teff) and employed the Endogenous Switching Regression (ESR) model. However, it is very essential to investigate the degree of commercialization across various crop types or geographic locations by examining a broader range of clustering commodities, as this study does. This can guide policy decisions by exploring why certain commodities are more or less associated with commercialization. Dureti et al. (2023) utilized market surplus value (MSV), market surplus price (MSP), and Commercialization Index (CI) as a proxy measure of commercialization to assess the impact of cluster farming. In contrast to the foregoing studies, they aimed to use a more comprehensive proxy for commercialization. Building on their methodology, this study used the actual value of the crop sold, calculated as the product of quantity sold and selling price, along with the commercialization index (proportion of crop sold expressed as a percentage) as a proxy measure for commercialization. This approach accounts for both the quantities sold and the selling price, recognizing the correlation between the quantities sold and the value of the crop sold, while acknowledging that the selling price can also impact the value of the crop sold. Thus, commercialization should be measured not only by the quantity supplied to the market but also by the crop’s market value.
Against the backdrop of the gaps identified in the existing literature, this study aimed to evaluate the effect of cluster farming on commercialization. It seeks to provide important insights into the existing literature in terms of commercialization measurement and the effect of cluster farming on commercialization.
Our study differs from that of Dureti et al. (2023), who examined cluster farming and smallholder agriculture in Ethiopia, by focusing on the commercialization of non-clustered commodities. As cluster farming is still in its early stage in Ethiopia, farmers often do not allocate all their land to cluster crops but also grow other crops outside the cluster. Therefore, it is necessary to consider non-clustering crops to understand the commercialization patterns of participants and non-participants fully. Additionally, evaluating the commercialization of other crops is paramount, especially for cluster participants, as they may apply knowledge and other agronomic practices gained from cluster farming to non-clustering crops, which could influence their commercialization. Neglecting the impact of cluster farming on non-clustering crops could overlook the knowledge spillover or a domino effect of cluster participation on non-clustering commodities. Using the ESR model and inferential statistics such as t-test and chi-square test, this study offered evidence of the impact of cluster farming on the commercialization level of smallholder farmers in Northwestern Ethiopia.
2 Research methodology
2.1 Description of the study area
The study was conducted in the East and North Gojjam zones of the Amhara Regional State, both of which are well-known for their high potential for crop production. East Gojjam zone is one of the region’s 11 zones, consisting of 18 districts and four town administrations. Its capital, Debre Markos, is located 265 km from Bahir Dar and 300 km northwest of Addis Ababa. The zone is situated at latitude 10°20′North and longitude 37°43′East, with a total land area of 1.46 million hectares. Of this, 45% is arable land and 8% is land suitable for irrigation. The geographic features include 67.3% flat landscape, 7.8% mountainous and 24.9% gorge scenery (Ferede et al., 2020). Wheat and teff are the predominant cereal crops grown in the zone, but crops such as maize, barley, fava bean (Vicia faba), sorghum (Sorghum bicolor), sesame, haricot bean (Phaseolus vulgaris L.), and triticale (X Triticosecale Wittmack) are also produced to some extent. Since 2015/16, wheat and teff have been produced under a cluster farming approach in the zone [East Gojjam Office of Agriculture (EGoA), 2023]. North Gojjam zone is also a crop potential area in the Amhara region, located in Ethiopia’s Northwestern and North-Central regions, with an average elevation of 1920 m above sea level. The zone comprises 13 rural districts and two city administrations, encompassing 362 rural villages and 15 urban villages (Munea et al., 2022). North Gojjam is known as one of the maize crop belt areas in the country (Ashenafi et al., 2022).
2.2 Target population and sampling procedures
This study aimed to investigate the impact of cluster farming on the level of farmers’ commercialization. The target populations of the study were wheat, teff and maize-producing farmers using both cluster and non-cluster farming methods. First, districts where cluster farming was practiced were purposively identified and randomly selected. The cluster farming districts were stratified into wheat, teff, and maize clusters. The goal of stratification was to have representative households of cluster farming as cluster farming in the study areas is expressed along with these commodities. Three districts—Basoliben, Aneded, and South Achefer—were randomly selected as representative clusters for wheat, teff, and maize, respectively (Figure 1).
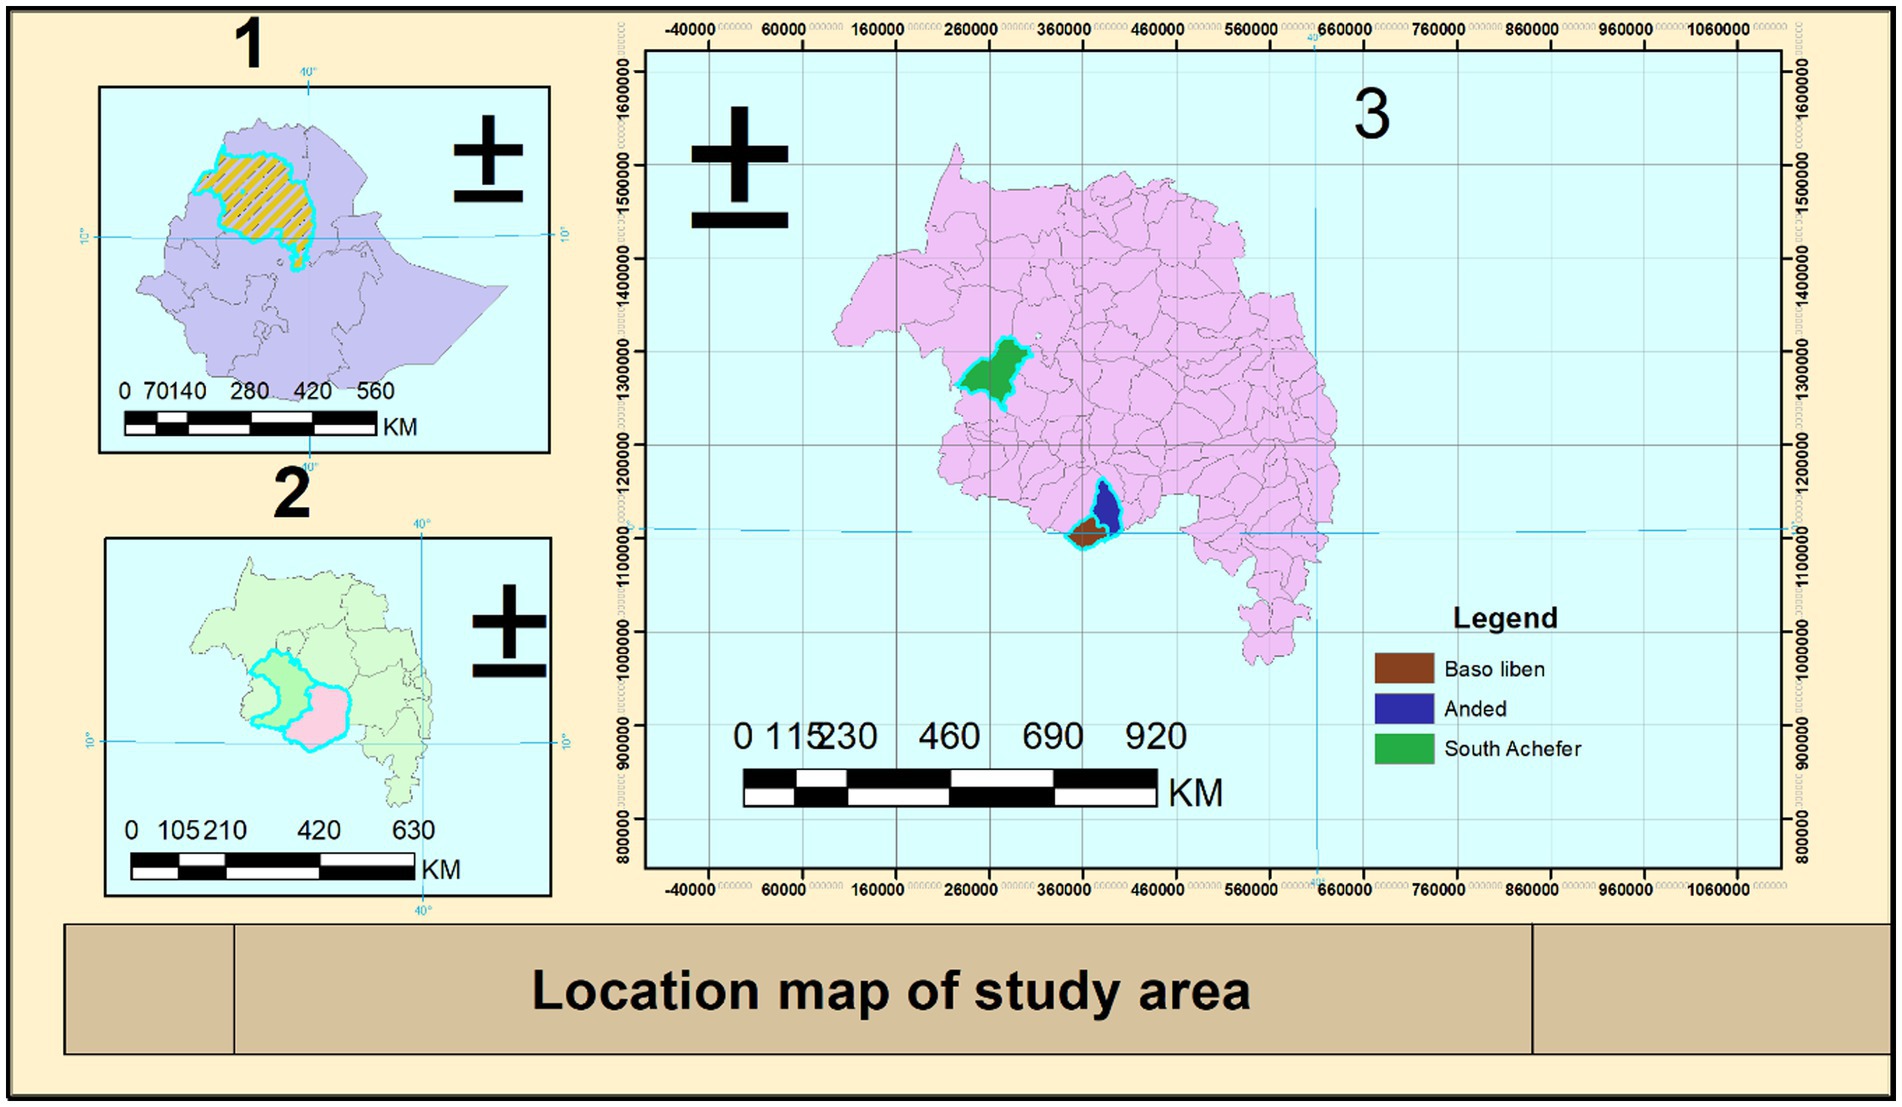
Figure 1. Map of the study areas. 1 represents the Amhara Region, Ethiopia; 2 represents East and North Gojjam Zones; and 3 represents the study districts.
Second, major villages in which cluster farming takes place were identified, and eight villages were then randomly selected from these districts: Dendegeb, Michig, Limicim, Gurach, Ahuri, Abchikli, Amber Zuria, and Wonga Nifasam. The first three were from Baso Liben, the next three from South Achefer and the last two from Aneded district. The reason for selecting an equal number of villages from the Baso Liben and South Achefer districts is that the number of major villages practicing cluster farming is equal in both districts (seven villages). In contrast, the Aneded district has fewer such villages (five villages), which is why only two were selected from it.
Third, the sample respondents were stratified into cluster farming participants and non-participants. Finally, a proportional random sampling method was used to select respondents from each village.
A sample of 424 households was drawn based on the Kothari (2004) formula (see Appendix, Equation A1), accounting for an 11% contingency for non-response based on a 10–20% contingency sample recommendation given by Naing et al. (2006). All respondents were interviewed, and no data were lost except for three respondents who were dropped because they quit cluster farming participation. Table 1 presents the proportional distribution of the proposed sample size across the selected villages.
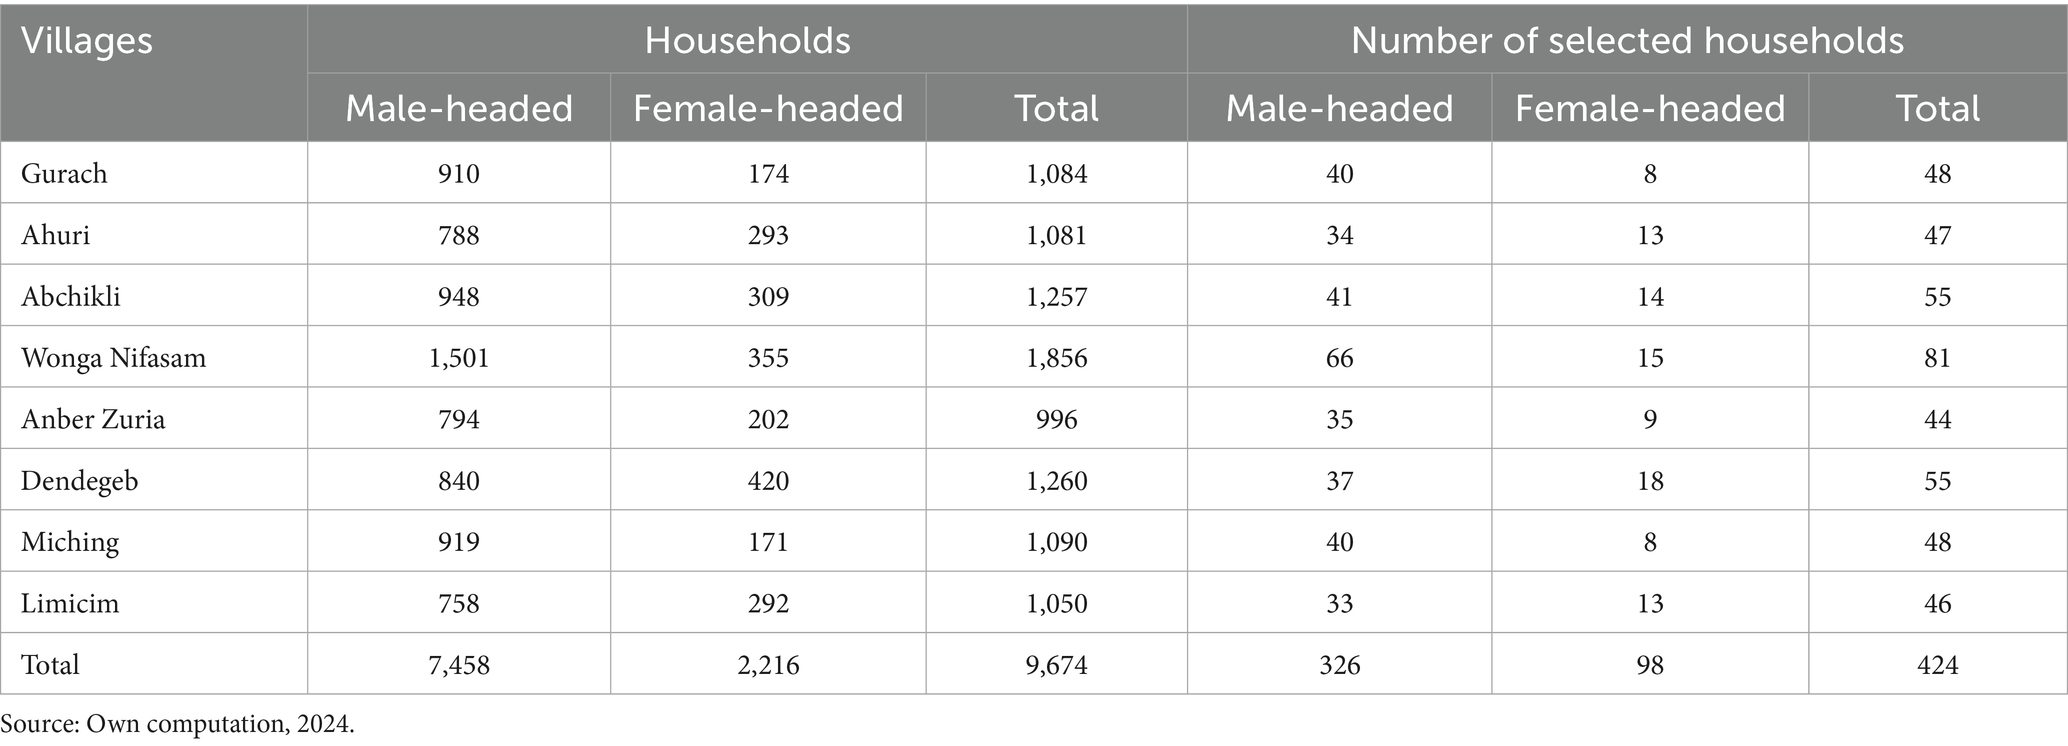
Table 1. Sample distribution across the selected villages.
2.3 Procedures and data collection methods
Enumerators conducted a face-to-face interview under the close supervision of a recruited supervisor at each study site. For the interviews, a structured questionnaire was initially prepared and then carefully loaded into the Kobo Toolbox account. Enumerators were subsequently recruited and trained. However, due to the lack of internet access in the Aneded district, we could not download the questionnaire from the Kobo Toolbox into the mobile Kobo Collect apps. As a result, a printed version of the questionnaire was used in this district. The survey questionnaire addressed background information on respondents (such as age, gender, educational level, and family size), and socio-economic characteristics such as farm size, livestock ownership, access to credit, quantity of crops harvested and sold, selling time and average selling price. Data collection took place from November 2023 to February 2024.
2.4 Concepts and measurements of commercialization
Although there is no universally accepted definition of commercialization, smallholder commercialization can be viewed from three perspectives: the goal of farmers’ agricultural production, their participation in input and output markets, and the types of crops they cultivate (Boka, 2016). From the goal of smallholder farmers’ point of view, agricultural commercialization is noticed as profit maximization. Agricultural commercialization is attained when a household product choice and input use decisions are made based on the principles of maximizing profit and commercialized households are those targeting markets in their production decisions, rather than simply the amount of product they would likely to sell due to surplus production (Jaleta et al., 2009). According to Berhanu and Jaleta (2010), agricultural commercialization entails market orientation and market participation. The former refers to agricultural products destined for the market based on market signals while the latter refers to products offered for sale after fulfilling consumption and seed needs (Gebremedhin and Jaleta, 2012). Market orientation is inclined to profit maximization while market participation aims at utility maximization (Boka, 2017).
Although the primary aim of cluster farming is commercialization, it is premature to conclude that farmers engaged in cluster farming are primarily motivated by profit maximization. In the context of developing countries like Ethiopia, where farmers have not yet fully transitioned to profit-driven agricultural production, commercialization in terms of market participation is more relevant. From this viewpoint, it is unlikely to find any households in the sample that do not sell at least small quantities of their products. Therefore, measuring commercialization with a simple dummy variable may not be appropriate; instead, it should be computed as a continuous indicator. The commercialization level can be measured from the output and input side. In most cases, commercialization is gauged from the output side than from the input side as commercialization on the input side is likely to proceed in tandem with the degree of participation in the output market (Melesse, 2016). Thus, output-side commercialization measurement was employed in this study. From the types of crop perspective, traditionally, commercialization was defined as the production and sale of cash crops (Linderhof et al., 2019), but today, it is understood as farmers’ market participation regardless of crop type (Ayele, 2022; Beyene and Gashu, 2022; Konja and Mabe, 2023; Pender and Alemu, 2007). This definition is particularly relevant in many developing countries, including Ethiopia, where the production and sale of staple food crops are common.
2.5 Proxies of commercialization
In this study, we analyzed the impact of cluster farming on farmers’ commercialization levels from two perspectives. First, we compared the commercialization levels of farmers participating in cluster farming with those not participating across all major crops they produced. Second, we specifically examined their commercialization levels for the three key cluster farming commodities: wheat, maize, and teff.
To use the commercialization level as an outcome variable, the commercialization level of each farmer was calculated. As mentioned in the introduction, this study measured commercialization by both the proportion of crops sold and the value of crops sold. While the proportion of crops sold indicates market orientation, the value of crops sold captures income-generating potential. Using both enables a more comprehensive assessment of commercialization behavior. The ratio of crops sold to crops produced is a useful metric for classifying households into different levels of commercialization, it has its limitations. For instance, consider two households: one produced 2 quintals of a crop and sold 1 quintal, while the other produced 5 quintals and sold 2 quintals. The commercialization ratio suggests that the first household is more commercialized (1/2 = 50%) compared to the second (2/5 = 40%), but in terms of the value of crops sold, the second household earned a higher income. Although the quantity of crop sold and the value of crop sold seem similar, the value of crop sales may not necessarily depend on quantity due to variations in sale timing and prices across different crop types. Therefore, considering the value of crop sales offers a more nuanced understanding of a household’s commercialization level than merely focusing on the quantity sold. The value of crops was computed as the sum of the quantity of each crop output sold multiplied by its market price (in the year 2023) (Equation 1), while the commercialization index was calculated as the sum of the proportion of crops sold expressed as a percentage (Equation 2). Mathematically, the former measurement approach is represented as:
Where k is a type of crop the household sold, Qk is a quantity (in quintal) of the crop sold and pk is the crop price at which the household sold.
The latter was calculated using the crop output market participation index (COMPI).
Where Sik is the quantity of crop output k sold by the household, pk stands for the average annual price of the commodities, and Qik is the total quantity of crop output produced by the household.
2.6 Analytical model specification: Endogenous Switching Regression
The data analyzed using a combination of descriptive and inferential statistics such as mean, percentage, t- and chi-square tests, and an econometric model. In this section, we provided a brief explanation of the model we chose for our data analysis and the reasons behind our selection.
In experimental studies, the treatment is randomly assigned to treated and controlled households, which assures that the effect of the treatment is observed in the controlled households and that the treatments are statistically representative of what would have happened without treatment (Asfaw et al., 2010). However, in the case of quasi-experimental and non-experimental research, the treatment is not randomly distributed to the two groups of households, but rather the households themselves decide (self-select) to engage or not to engage based on the observed socio-economic advantage they have and unobserved factors (Dureti et al., 2023; Endalew et al., 2024). Unless the self-selection bias resulting from observed and unobserved factors is not controlled for, the treatment effect cannot be estimated efficiently. The Endogenous Switching Regression (ESR) model is widely used in impact analysis literature to address the issue of selection bias (Goundan, 2020; Hailu, 2021; Kassie et al., 2018; Missiame et al., 2021; Muhammed et al., 2023; Zegeye et al., 2022). The ESR involves two steps. The first stage predicts the probability of an individual choosing to participate in the treatment or not, typically using binary response models like probit or logit. The second stage assesses the impact of the treatment on specific outcome variables. In this stage, the outcome regressions for the treated and control groups are analyzed simultaneously, provided that the first and second steps of the ESR model are interdependent (Missiame et al., 2021).
In the first stage, factors that potentially influence farmers’ adoption decision of cluster farming were identified. We considered a latent variable (w*) that can address the benefits gained from adopting cluster farming compared to not adopting it (Equation 3). Mathematically,
Where a binary variable taking a value of 1 if a household adopts cluster farming and 0 otherwise; represents regressors determining the adoption decision, α is a coefficient of each regressor and ε is the error term.
The outcome equation in the two regimes is estimated as follows (Equations 4, 5):
Where regime 1&2 stands for adopters and non-adopters of cluster farming respectively, & are the estimated commercialization level (outcome) of participants and non-participants respectively, & are the n*k matrices of regressors, & vectors of error terms which are normally distributed at zero mean and non-zero covariance:
The covariance of and is not defined because we cannot observe the two outcomes and at the same time. An individual cannot be both treated and untreated simultaneously; instead, they could be either in the treated or control group.
To address potential endogeneity issues, we utilized training on cluster farming and neighborhood participation in cluster farming as instrumental variables. These variables were selected based on existing literature and the hypothesis that they directly influence the likelihood of farmers’ participation in cluster farming but do not directly affect the outcome variable (commercialization), except through participation in cluster farming. While increased awareness (training) of cluster farming may encourage adoption, awareness alone does not directly impact the level of commercialization; rather, it does so through actual participation in cluster farming. We have also confirmed that these variables significantly influence only the participation decision and do not have a significant impact on the outcome variables, suggesting exogenous to the outcome variable. Awareness of cluster farming and neighborhood participation were also employed as instrumental variables by Dureti et al. (2023). In addition to theoretical justification, the validity of these instrumental variables was evaluated through a falsification test, including relevance and over-identification tests. The weak identification test (relevance test) for the instrumental variables was statistically significant at the 1% level (Appendix Table A4), leading to the rejection of the null hypothesis that the instruments are weak. Conversely, the over-identification test was not statistically significant (Appendix Table A5), indicating that the instruments are not over-identified; therefore, we fail to reject the null hypothesis. A similar approach was employed in the study by Dureti et al. (2023). The control variables included in the model were also selected based on empirical evidence (Degefu et al., 2024; Dureti et al., 2023; Endalew et al., 2024; Hussen and Geleta, 2021; Sultan, 2024).
3 Results
3.1 Descriptive statistics results
Table 2 presents a summary of household level and institutional service variables included in the ESR model of the selection equation. The result indicates that the farm size owned by participant and non-participant households is considerably different. On average, non-participant households hold about 0.68 hectares, which is 0.45 hectares less than their counterparts. There is also a difference in land fragmentation between the two groups. In this case, land fragmentation refers to the number of plots of land that a farm household owns in various places. Non-participant households experience higher land fragmentation, averaging about 2.8 plots.
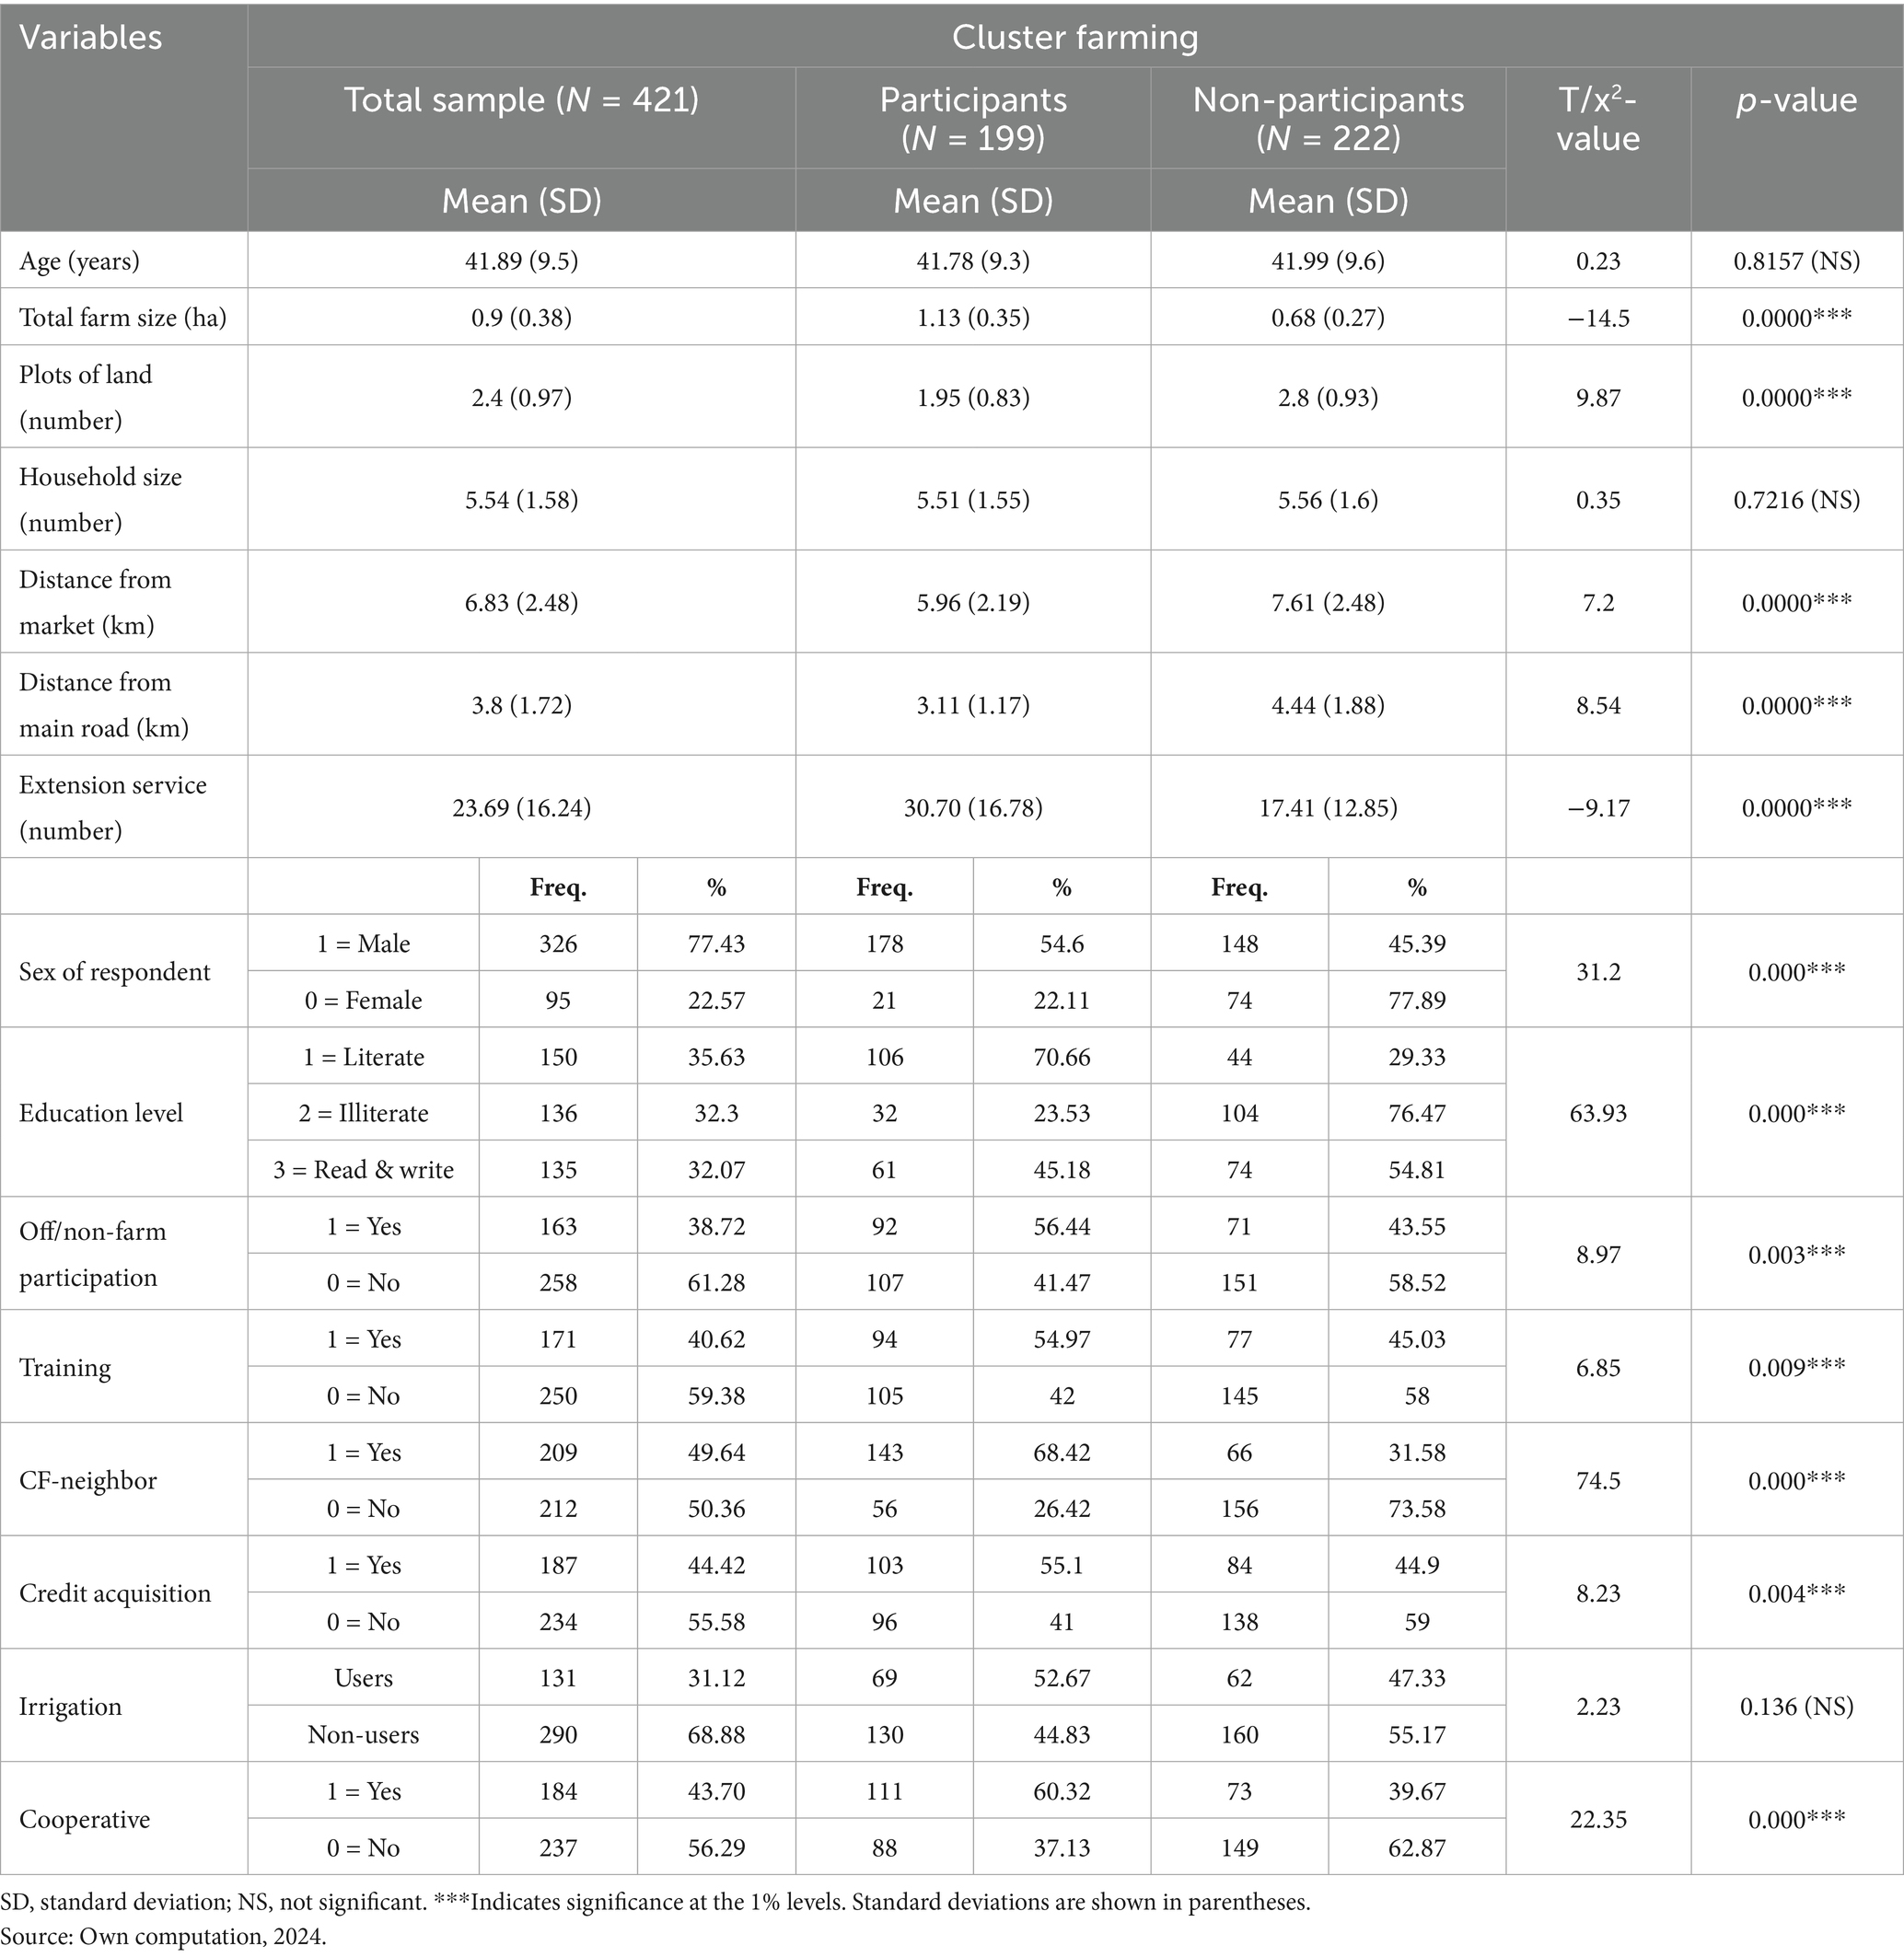
Table 2. Summary statistics of selected regressors used in the ESR of the selection model.
The average age of the sample household is 41.9. The mean age of non-participant households is slightly higher than that of participants, but statistical tests confirmed no significant age variation between the two groups. A similar result was found in the case of household size. In terms of the sex of the sample households, the majority of them (77%) are male-headed, with 56.6% of them involved in cluster farming. Among female-headed households, about 77.9% did not participate in cluster farming. The chi-square test result (p = 0.000) also showed there was a statistically significant percentage difference between male and female-headed households in terms of cluster farming participation. In terms of education status, nearly one-third of the sample households are illiterate, while another third has not received any formal education but can read and write, thanks to religious schooling during childhood. The remaining percentage have formal education. The majority of educated households belong to cluster farming (70.6%), while the majority of illiterate households do not participate in cluster farming.
Regarding farming activity, 61.3% of sample households derive their livelihood from on-farm activities, while the rest generate incomes from off-farm/non-farm activities in addition to on-farm income. Among off-farm-/non-farm participants, about 56% belong to cluster farming while only 41% of non-participants are involved in cluster farming. Off-farm participants are households engaged in income-generating activities outside of farming, such as crop cultivation or livestock rearing on their own farms. These activities include daily labor, petty trade, firewood sales, weaving, blacksmithing, etc. The chi-square test result (p = 0.003) indicated a statistically significant difference in the proportion of participation in off-farm/non-farm activities between cluster farming participants and non-participants. This infers how the off-farm/non-farm activities support the cluster farming participation by solving liquidity problems for farmers to purchase and or hire necessary inputs. The chi-square test results also indicated a statistically significant percentage difference between the two groups (cluster farming participants and non-participants) in terms of the remaining variables included in the selection model: distance from the market center, distance from the main road, training, neighboring farmers’ participation in cluster farming, credit, and multipurpose cooperative membership.
3.2 Land allocation for cluster farming by the participant households
This section presents the average land allocated to cluster farming by participating households. As shown in Table 2, less than half of the surveyed households—specifically 199 households, representing 47.3% of the total sample are reported participating in cluster farming. Among these participants, the average land area allocated to cluster farming is approximately 0.52 hectares per household. This average is significantly lower than the 1-hectare average reported by Tabe-Ojong and Dureti (2022) for households engaged in cluster farming. Several factors could explain this discrepancy. First, geographical differences between the study areas may account for variations in land availability and farming practices. Variations in landholding size between the two study populations likely play a role; households in the present study may generally own or operate smaller plots of land compared to those in the Tabe-Ojong & Dureti study. Second, farmers’ levels of awareness and understanding regarding the benefits and practices of cluster farming may vary, which could influence their willingness to allocate larger plots of land.
Disaggregated by crop clusters, the land allocation also varies. Households participating in the wheat cluster allocated an average of 0.43 hectares to cluster farming. Meanwhile, those involved in maize and teff clusters allocated 0.58 hectares and 0.56 hectares, respectively (see Figure 2). These differences suggest that crop type may influence the extent of land committed to cluster farming, possibly due to crop-specific profitability, land availability, or input demands.
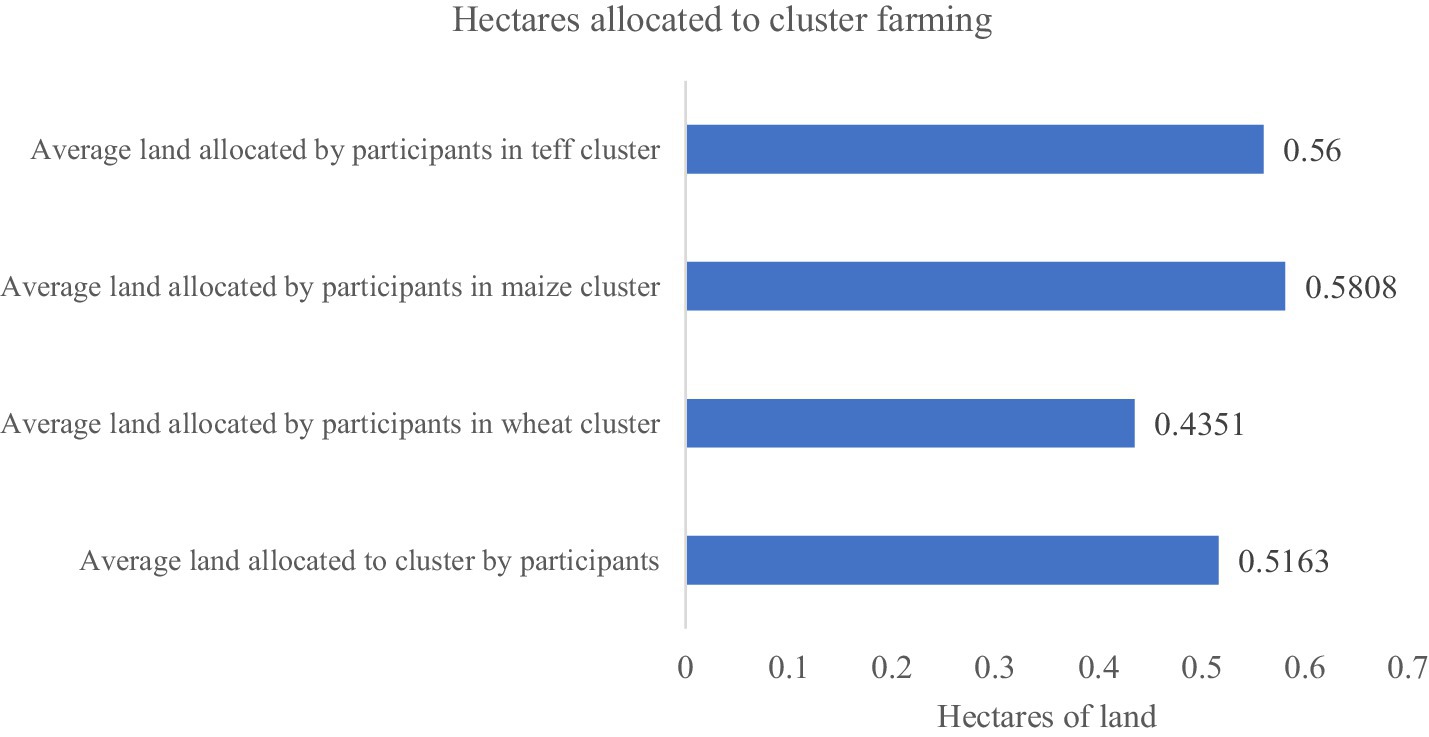
Figure 2. Average land allocated for cluster farming by the participant households.
3.3 Land allocation for major and clustering crops by participants and non-participants
Figure 3 illustrates the average land allocation for major crops and clustering crops among households participating in cluster farming compared to non-participating households. On average, cluster farming participants allocated approximately 1 hectare of land to their major crops, while non-participants allocated about 0.65 hectares. This difference is noteworthy and expected, as indicated in Table 2, which shows a statistically significant mean difference in total farm size, with participant households generally owning or operating larger landholdings than non-participants.
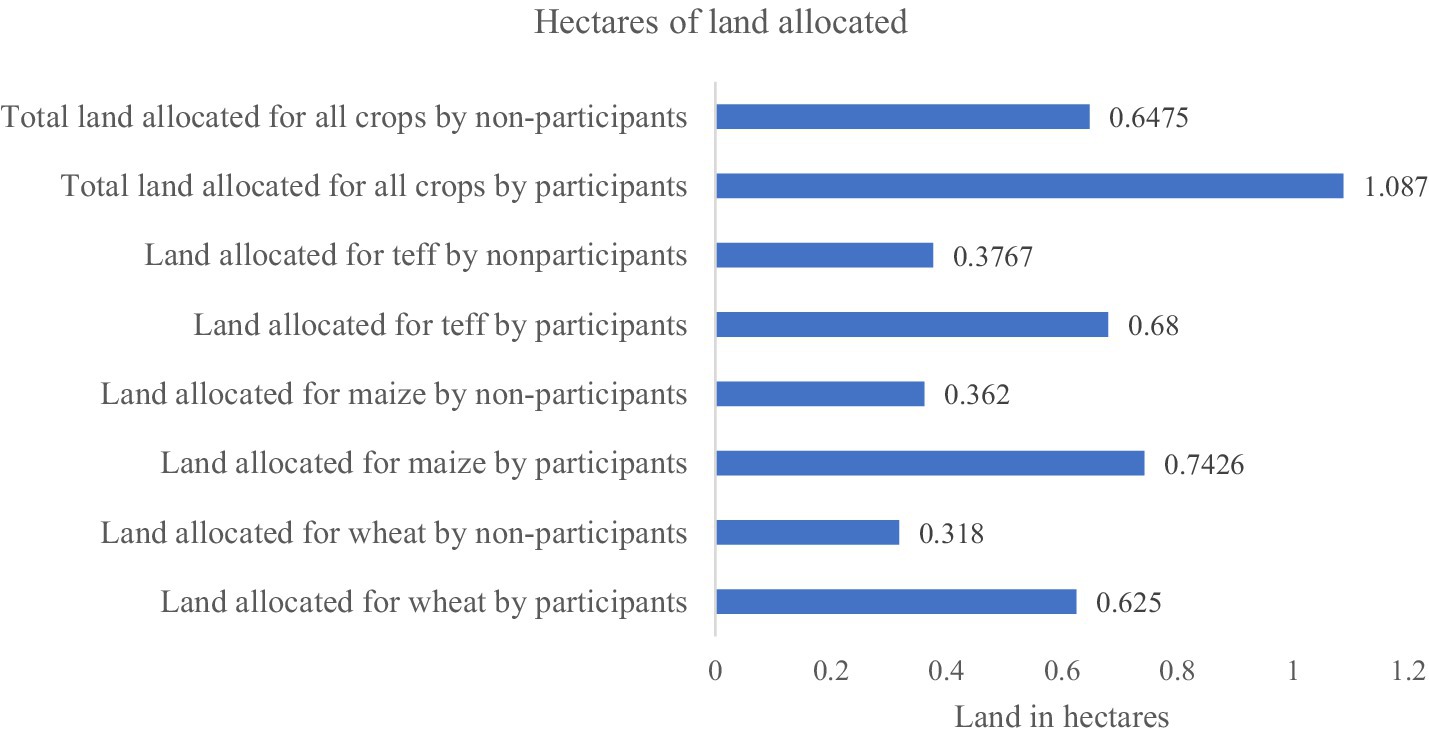
Figure 3. Land allocated for all major crops by cluster farming participants and non-participants.
Land allocation disparities become even more pronounced when disaggregated by crop type across the three major clustered crops—wheat, maize, and teff. For wheat, participant households allocated an average of 0.62 hectares, while non-participants allocated only 0.32 hectares. In the case of maize, participants allocated around 0.74 hectares, more than double the 0.36 hectares allocated by non-participating households. Similarly, for teff, participants allocated approximately 0.68 hectares, compared to 0.38 hectares among non-participants. These differences suggest that participation in cluster farming is associated with a higher allocation of land to key commercial crops, which may, in turn, influence the degree of commercialization. Larger land allocations likely enable participants to produce greater surpluses, access markets more efficiently, and benefit from commercialization.
However, it is important to note that landholding size and allocation patterns are not equal among the participants and non-participant households. To account for such heterogeneity, the Endogenous Switching Regression (ESR) model, as discussed in the methodology section, is employed. This model enables a more accurate estimation of the causal impact of cluster farming participation on commercialization outcomes by controlling for both observed and unobserved differences between participant and non-participant households.
As shown in Sections 3.2 and 3.3, the average total land allocated by participant households to wheat, maize, and teff is greater than the area they allocated to cluster farming of these crops. To recall, while participants allocated an average of 0.43 hectares to wheat within clusters, the total average land they allocated to wheat was approximately 0.62 hectares. This suggests that wheat cluster participants cultivate the crop both within and outside cluster farming. This finding supports our hypothesis that Ethiopian farmers allocate land not only to cluster farming but also to production outside of clusters. Therefore, including non-cluster commodities in the analysis is critical for obtaining a comprehensive understanding of household commercialization levels. This study addresses this by examining both cluster and non-cluster crop outputs.
3.4 Level of commercialization between cluster farming participants and non-participants
To compare the level of commercialization between cluster farming participants and non-participants, an independent two-sample t-test was conducted, and the results are presented in Table 3. Commercialization level was measured in two ways: the value of all crops sold and the proportion of all crops sold. For the former measurement, values were calculated in Ethiopian birr and then converted to US dollars using the average official exchange rate of $1 equivalent to 56.5 Ethiopian birr (average official exchange rate of 2023). The results showed that, in both cases, there was a statistically significant (p = 0.000) difference in commercialization between the two groups. The mean value of crops sold for all households was found to be approximately $908, with participant households earning around $1,106 and non-participant households earning $375 less. These findings align with those of Dureti et al. (2023), who reported that participants in cluster farming gained an income of $925 from crop sales, while the non-cluster farming participants earned $456 less. The proportion of crops sold by the total sample household was 0.4328, meaning, on average, households sold about 43.28% of their crops. Participant households sold about 50.38% of their crops, while non-participant households sold only about 36.92%.
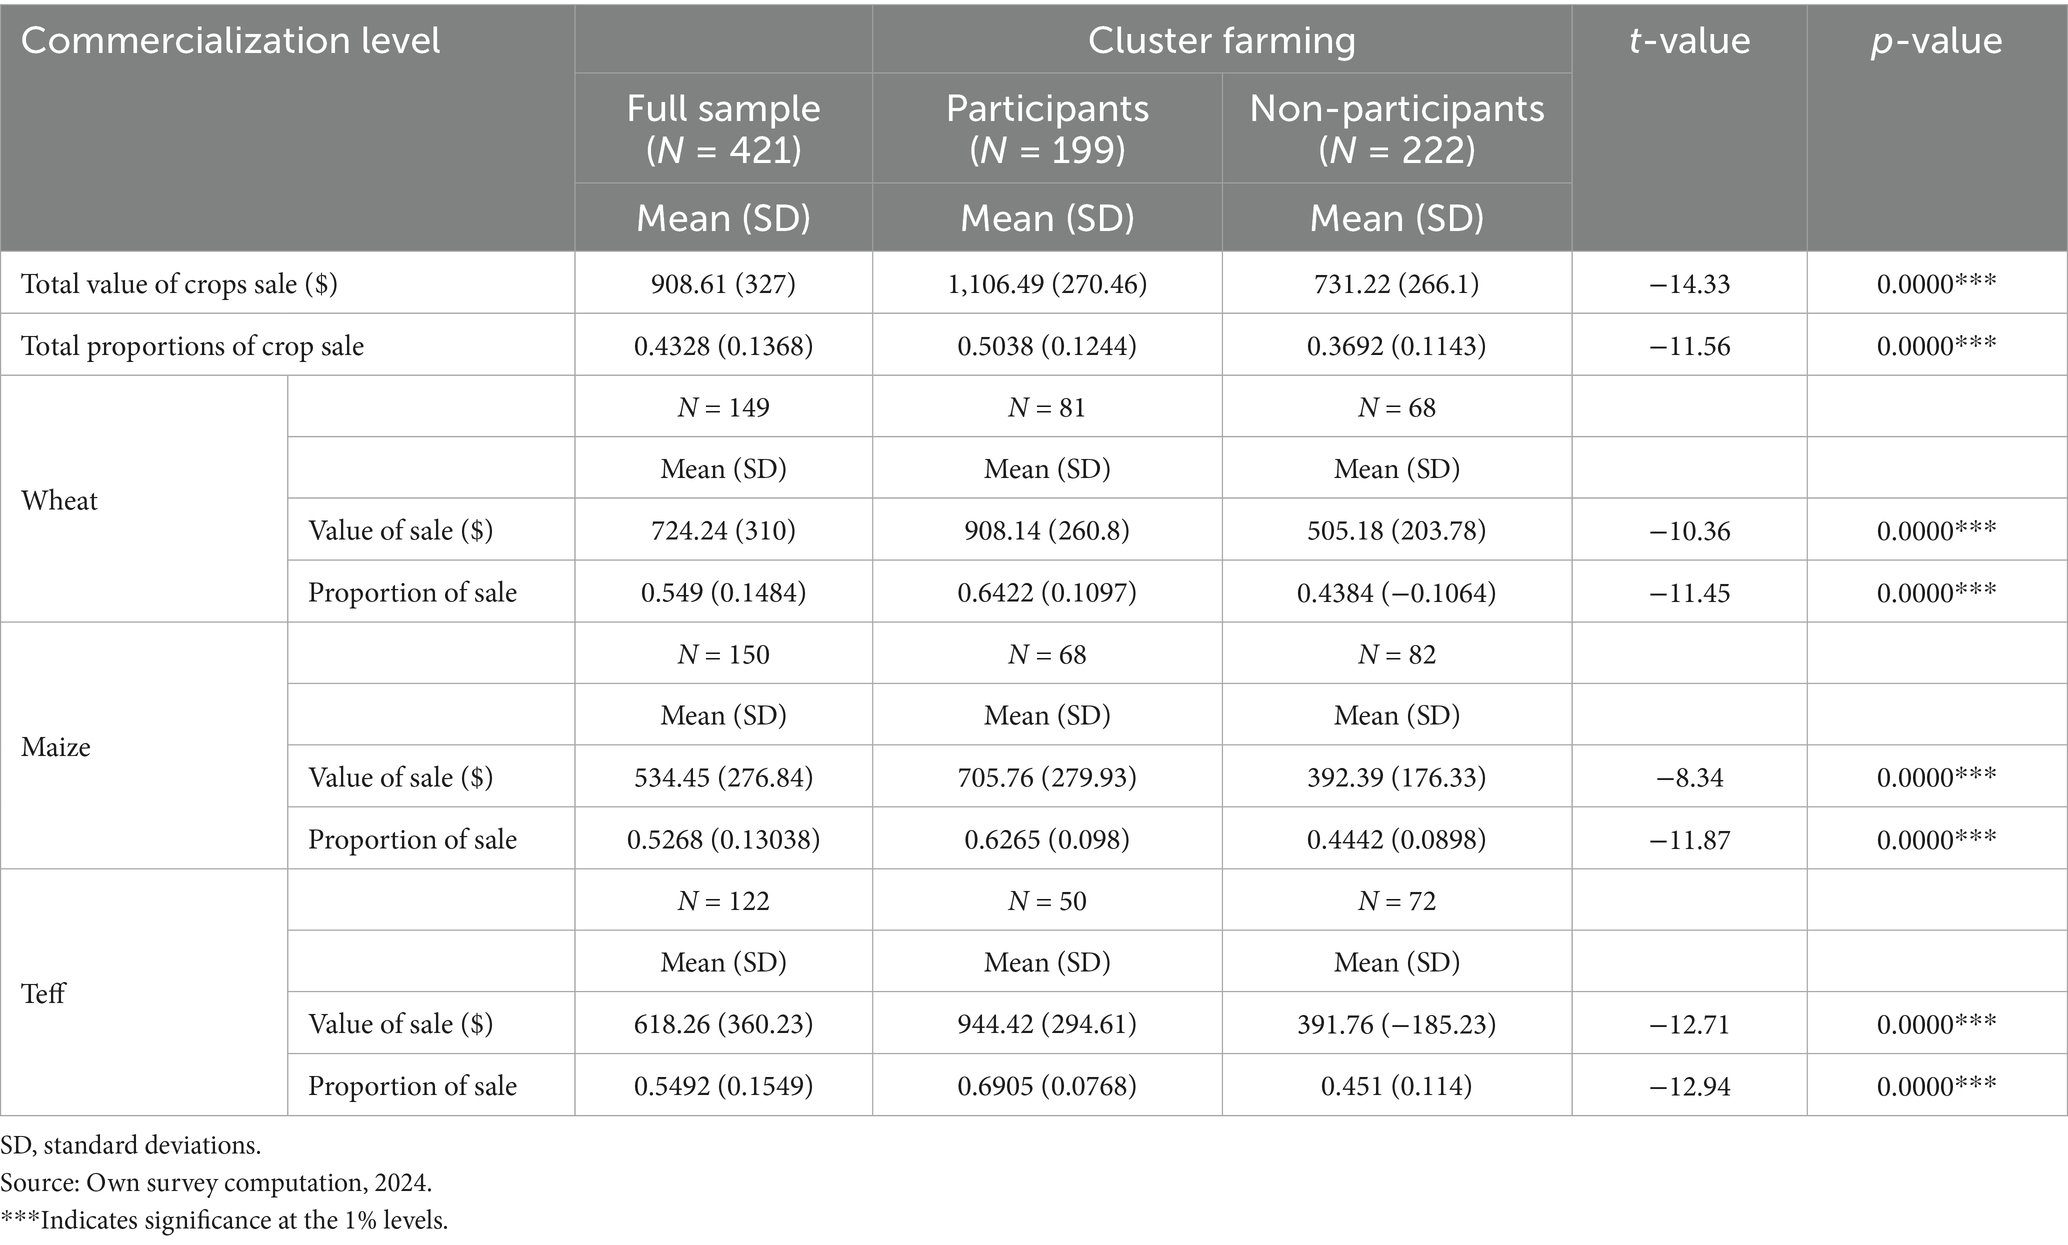
Table 3. Mean comparison test of the commercialization level between the two groups.
For the clustering commodities, wheat-growing farmers earned an average of $724 from wheat sales, with a statistically significant (p = 0.000) income difference between cluster farming participants and non-participants. Participants earned approximately $908 from wheat sales, while non-participants earned around $505. This trend is also seen in commercialization levels, measured by the proportion of crops sold: participants sold about 64% of their wheat yield, compared to 44% for non-participants. Cluster farming participants were similarly more commercialized in both sales value and proportion of crops sold for the other clustering crops, maize and teff (Table 3).
3.5 Impact of cluster farming on smallholder farmers’ commercialization
This section presented the results of the ESR. As shown in Appendix Table A1, the log-likelihood ratio of the independence test in the Endogenous Switching Regression model was insignificant. Therefore, we rejected the null hypothesis that the selection and outcome equations were independent. The selection equation identified factors that influenced farmers’ decisions to participate in cluster farming, while the outcome equation determined factors that affected the level of commercialization of participants and non-participants. However, our focus was not on the detailed determinants of cluster farming participation and outcomes. We primarily aimed to evaluate the impact of cluster farming on households’ commercialization. Hence, we only introduced these determinants and discussed some of the key determinants of cluster farming participation.
The results of the selection model show that factors such as the sex of the household head, education level, farm size, plots of land, distance from the market, distance from the main road, multipurpose cooperative membership, training on cluster farming, and neighboring participation influence the decision to participate in cluster farming. Among these, plots of land, distance from the market and the main road negatively impacted cluster farming participation (Appendix Table A1). The negative coefficient for education does not imply a negative influence on participation but rather indicates its positive contribution. This is because the education variable is categorical: literate, illiterate, and read and write. When we ran the probit model with “i.education level” as we could not do this in the ESR model, we found a negative coefficient for illiterate and read and write categories (Appendix Table A3). This suggests that illiterate and read-and-write individuals are less likely to participate in cluster farming compared to literate individuals. In the context of this study, we refer to literate individuals as those who have attended formal education, whereas individuals who can read and write acquired this ability through informal means, such as adult education or religious instruction. Adult education is primarily aimed at enabling individuals to develop basic reading and writing skills. Religious schools, while mainly intended to provide a basic understanding of religious teachings, also help learners acquire reading and writing skills in the process. In contrast, formal education goes beyond basic reading and writing, encompassing a broader range of academic knowledge and competencies. The outcome model of the ESR model also indicates that factors like age, plots of land, irrigation access, distance from the main road, and distance from the market affect the commercialization level of participating households, while age, distance from the main road, and credit acquisition influence the commercialization level of non-participants (Appendix Table A1).
The ESR regression results revealed that the average income of participants and non-participants in cluster farming was $1,106.93 and $731.22, respectively. This indicated that participants gained 51.4% more income from crop commercialization. In addition to correcting selection bias, the ESR model’s advantage is its ability to predict the counterfactual (i.e., what would have happened if the participant had not participated and vice versa). Accordingly, participants would have earned an average value of $803.55 if they had not participated, while non-participants would have gained an average value of $1,277.15 if they had participated (Table 4).
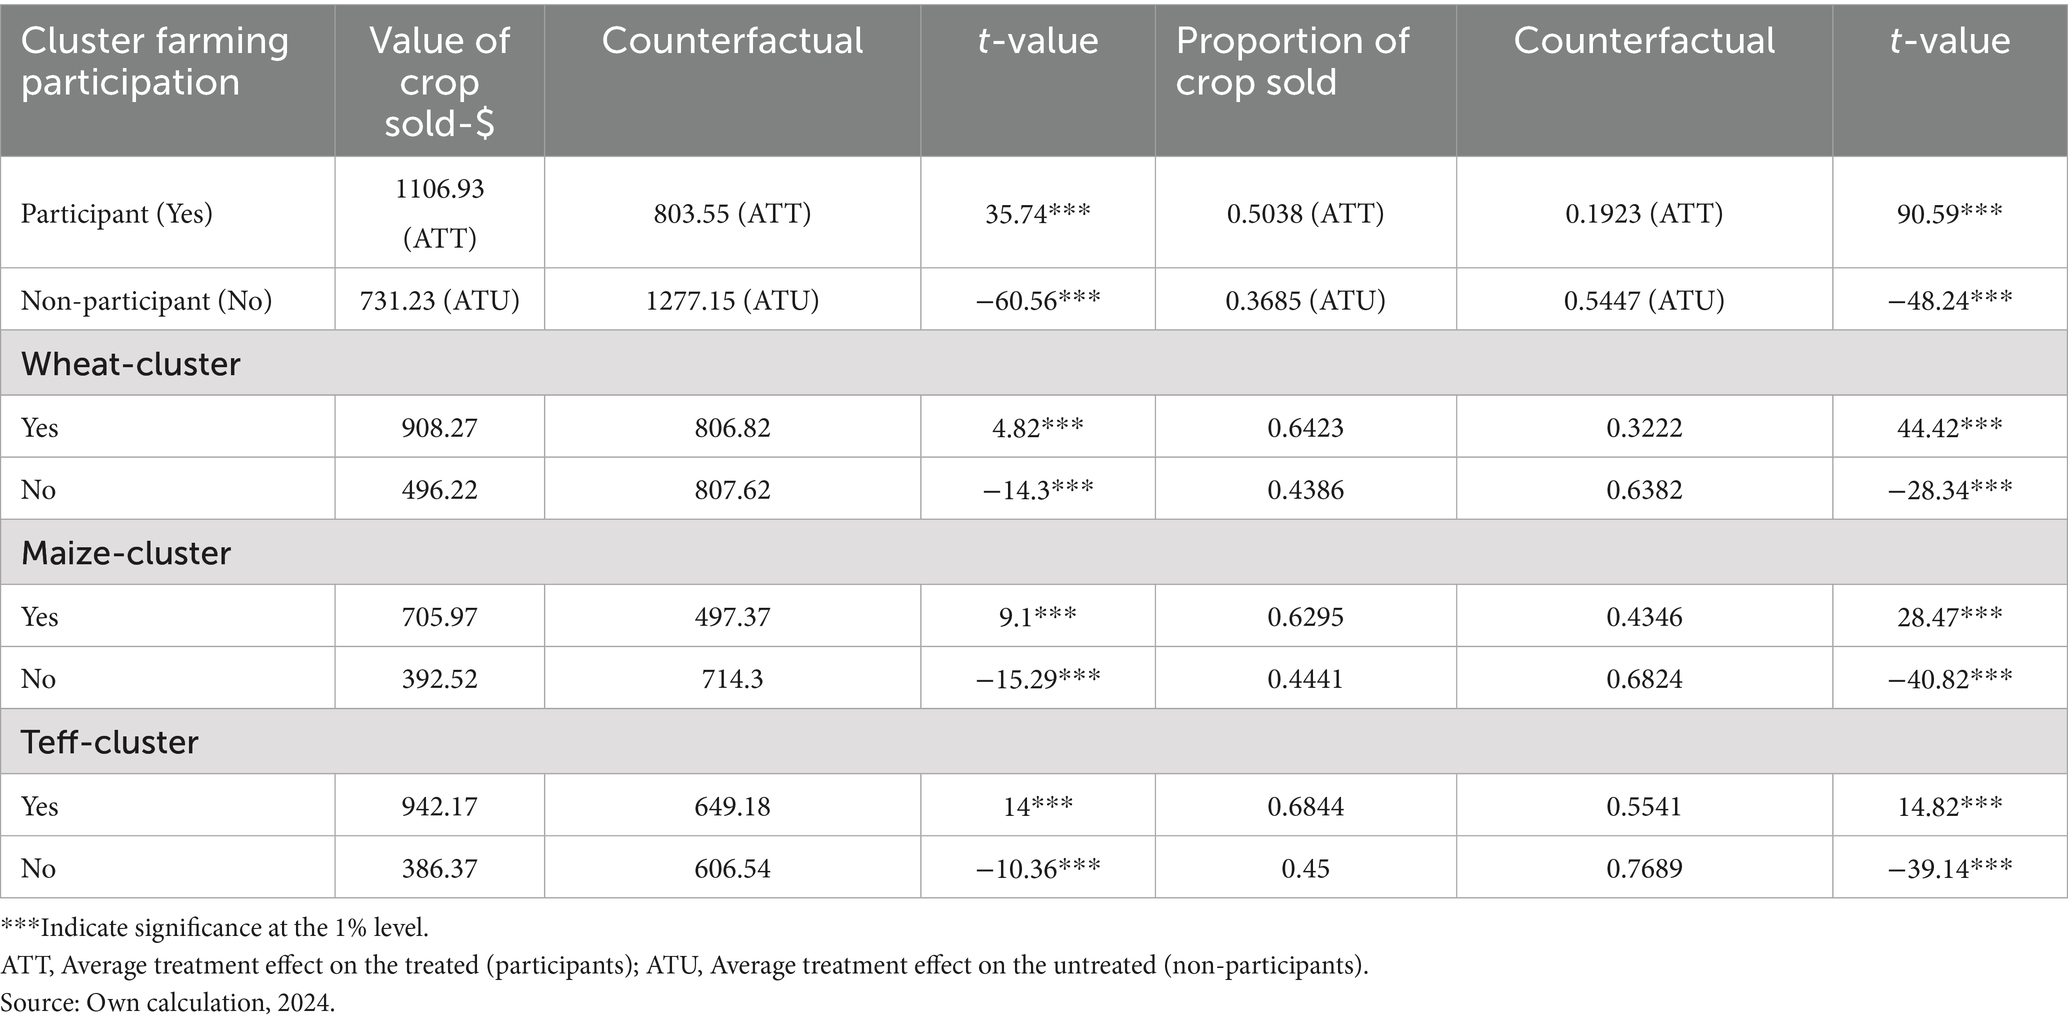
Table 4. ESR results on the impact of cluster farming on farmers’ commercialization level.
Similarly, the proportion of crop commercialization is higher among participant households compared to non-participant. Participants sold an average of 50.38% of all crops they produced, while non-participants sold 36.85%, which would have increased to 54.47% if they had participated.
The comparison of sales value and sales proportion between cluster farming participants and non-participants across the three clustering commodities (wheat, maize, and teff) of our study area reveals a clear advantage for participants in all three crops. For instance, wheat cluster farming participants gained significantly more sales value ($908) compared to non-participants, who earned about $496.
From the teff sales, the cluster farming participants obtained about $942, whereas the non-participants gained about $386. Also, in terms of the proportion of teff sales measurement, the participants sold a higher proportion of teff (68%) than the non-participants (45%).
Similarly, our finding highlights the significant positive impact of cluster farming on maize commercialization. Participants in cluster farming sold maize at a higher value ($706 compared to $392 for non-participants) and had a larger proportion of maize sales (63% versus 44%) (Table 4).
4 Discussion
This study analyzed the impact of cluster farming on the commercialization level of smallholder farmers, based on a sample of 421 randomly selected households. Commercialization was measured using two metrics: the value of crops sold and the proportion of crops sold.
The finding reveals that in both measures, cluster farming participant households have a higher commercialization level. In terms of the value of crops sold, the results showed that cluster farming participant households have gained 51.4% more annual income from crop commercialization. This finding is comparable with what has been investigated by Dureti et al. (2023), who reported a 74.51% market surplus advantage for cluster farming participants over non-participants. Similarly, the proportion of crop commercialization is higher among participant households compared to non-participant. This difference may arise not only from variations in surplus but also from differences in market linkage and bargaining power. Farmers participating in clusters can collectively supply their produce, thereby enhancing their bargaining power compared to those who produce individually. As a result, they may be able to supply more produce to the market due to better prices and lower transportation costs. Our result is consistent with previous studies. For instance, in a similar study, Dureti et al. (2023) found that, on average, cluster farming participants sold about 57.9% of their crops, while non-participants sold around 47.6%. The commercialization level of both participants and non-participants reported in their study is higher compared to the result we found. This discrepancy may be due to several factors, including geographical differences, sample size, and instability that could impact production and marketing. For example, although it may not be statistically quantified, it is reasonable to assert that the recent conflict in the Amhara regional state of Ethiopia, including our study area, could have significantly affected production and marketing, thereby reducing the level of commercialization.
The comparison of sales value and sales proportion between cluster farming participants and non-participants across the three cluster commodities—wheat, maize, and teff—revealed a clear advantage for participants in all cases. For instance, wheat cluster farming participants earned significantly higher sales value, averaging $908, compared to non-participants, who earned approximately $496. This trend aligns with the findings of Degefu et al. (2024), who reported that wheat cluster farming participants had a higher net benefit, approximately 37,868 Ethiopian birr (ETB), compared to 24,392 ETB for non-participants.
From the teff sales, the cluster farming participants obtained about $942, whereas the non-participants gained about $386. Also in terms of proportion teff sales measurement, the participants sold a higher proportion of teff (68%) than the non-participants (45%). Endalew et al. (2024) also reported that teff cluster farming participants supplied about 57% of their teff product to the market, while this value was reduced to 36% for the non-participants. We found a higher proportion of teff sales than what is reported by Endalew et al. (2024). This may be because of two reasons. First, the price of teff is increasing from time to time. In January 2017, the price of teff per quintal was about 64.1 dollars, which is twice more as the price of wheat (Gagabo, 2023). Since 2023, the price of teff has quickly escalated; on average, 100 kg of teff costs a minimum of 7,000–10,000 Ethiopian birr (55–79USD) (Caldero, 2024). To get a higher income, farmers may be encouraged to sell a greater proportion of their teff product over selling other commodities, which have relatively lower selling prices. Second, the proximity of Aneded District to the Zone town, Debre-Markos, may provide farmers with easy access to agricultural inputs and transportation for selling their products.
Similarly, our finding highlights the significant positive impact of cluster farming on maize commercialization. Participants in cluster farming sold maize at a higher value ($706 compared to $392 for non-participants) and had a larger proportion of maize sales (63% versus 44%). Our finding is consistent with the findings of Abate (2021), who reported that cluster farming participants in the Dera district of South Gondar Zone, Ethiopia, commercialized a larger share of their maize production (42%) than non-participants (28%).
In addition to assessing the actual impact of cluster farming on commercialization, this study also employed counterfactual analysis to estimate potential outcomes under alternative scenarios (what would have happened if the participants did not participate, and non-participants would have participated). In this regard, the finding indicates that if the cluster farming participants had not participated, their level of commercialization would have been lower. In contrast, the non-participants would have achieved a higher level of commercialization had they participated. This succinctly implies that there is a positive association between cluster farming and smallholders’ commercialization. This could be because cluster farming has the power to enhance the quality and quantity of the product and create a conducive environment for better market linkage, so that farmers could reap better income. Previous studies by Abate (2021), Endalew et al. (2024), and Cheffo et al. (2023) also stated that cluster farming could enhance the quantity and quality of the product, facilitate market linkage with better market prices, ease access to market information, extension service delivery and farmer-to-farmer resource and experience sharing.
Thus, given the positive impact of cluster farming on commercialization, it is essential to identify the factors that influence farmers’ decisions to participate in cluster farming. Our results indicate that factors such as farm size, gender of the household head, education level, access to extension services, neighborhood participation, and cooperative membership positively influence the decision to engage in cluster farming. In contrast, greater distances from markets and main roads, as well as land fragmentation, negatively affect participation. However, this study primarily focuses on evaluating the impact of cluster farming on commercialization rather than exploring its determinants in depth. Therefore, only some of these factors are discussed.
The positive and significant association between the household head’s sex and cluster farming participation indicates that male-headed farmers are more likely to adopt cluster farming than the female headed. Male farmers generally have greater access to resources such as land, capital, agricultural inputs, and information (Machavarapu, 2014), increasing their likelihood of adopting agrarian technologies, including cluster farming. This finding is consistent with Hussen and Geleta (2021), who reported that male-headed households in West Shewa Zone, Oromia region, Ethiopia, were 12.3% more likely to participate in cluster farming.
Our findings also revealed that farmers operating larger landholdings showed a higher tendency to engage in clusters. This is expected, as larger landowners have more flexibility to allocate a portion of their land to cluster farming. Tabe-Ojong and Dureti (2022) also found that cluster farming participants had significantly larger farm sizes than non-participants.
Receiving training on cluster farming also significantly (p = 0.000) increased the likelihood of farmers’ participation in cluster farming. Training could enhance farmers’ awareness and understanding of cluster farming, making them more likely to adopt the practice. Our findings are consistent with those of Mgendi et al. (2022) whose research demonstrated that training and demonstration interventions in Tanzania increased adoption intensity by nearly two-thirds (64%).
Geographic proximity to markets and infrastructure critically shapes cluster farming adoption. Our analysis revealed that greater distances from both market centers and primary roads significantly reduced (p = 0.000) cluster farming participation likelihood—reflecting the compounded challenges of elevated transport costs for inputs and outputs, coupled with constrained market information access. Our findings align with those of Degefu et al. (2024), who reported that an increase in travel time to the nearest market in the Arsi Zone of the Oromia region, Ethiopia, reduced the likelihood of cluster farming participation by 0.3%.
5 Conclusion
The cluster farming initiative was launched with the primary objective of improving crop income, market participation, and farmer integration into agricultural value chains. Evaluating whether this initiative achieved its intended goals is valuable for policymakers. This study quantified the impact of cluster farming on household commercialization, measured by the value and proportion of crops sold. The findings revealed that cluster farming participants earned more from crop sales compared to non-participants. Similarly, the participant households supplied on average a higher proportion of their crops to the market. This plainly indicates the positive contribution of cluster farming to farmers’ commercialization. Therefore, expanding this farming approach to larger communities is recommended but should be based on awareness creation and the interest of the farmers. Extension workers should develop strategies to enhance farmers’ engagement in cluster farming by conducting regular awareness programs (training) and addressing challenges that hinder farmers’ participation, such as limited land access. In this regard, the national government should collaborate to facilitate farmers’ access to farmland. Even though land expansion is not possible due to the scarcity of this resource, farmers’ access to farmland can be strengthened, perhaps, through devising suitable land policies such as leasing and selling rights. Cluster farming is more prevalent among male-headed households. Ensuring inclusivity is critical for its success and sustainability. Extension workers, in collaboration with other stakeholders, should develop strategies to encourage female-headed households to participate, possibly by improving their access to land, capital, agricultural inputs, and information. Improved infrastructure development, particularly road networks and transportation systems, could enhance farmer participation in cluster farming initiatives. We recommend that federal and regional governments prioritize these infrastructure investments to facilitate market access and strengthen agricultural value chains. Lastly, we would like to inform our readers about the limitations of our study. Constraints such as time, budget, and other factors led us to use cross-sectional data, even though longitudinal data could offer a deeper analysis of the long-term effects of cluster farming on commercialization. We encourage future studies to use longitudinal data to better evaluate the impact of cluster farming on commercialization over time.
Data availability statement
The raw data supporting the conclusions of this article will be made available by the authors without undue reservation.
Author contributions
GG: Formal analysis, Methodology, Validation, Writing – original draft, Writing – review & editing. BA: Data curation, Supervision, Validation, Visualization, Writing – original draft, Writing – review & editing. KK: Data curation, Investigation, Supervision, Validation, Visualization, Writing – original draft, Writing – review & editing.
Funding
The author(s) declare that no financial support was received for the research and/or publication of this article.
Acknowledgments
The researchers would like to thank the selected District Office of Agriculture for providing information. Our heartfelt thanks also go to all the data enumerators, supervisors, and respondents for their valuable time and data during the data collection process. Lastly, we extend our gratitude to the editor and reviewers for providing valuable insights that contributed to the improvement of this paper.
Conflict of interest
The authors declare that the research was conducted in the absence of any commercial or financial relationships that could be construed as a potential conflict of interest.
Generative AI statement
The authors declare that no Gen AI was used in the creation of this manuscript.
Publisher’s note
All claims expressed in this article are solely those of the authors and do not necessarily represent those of their affiliated organizations, or those of the publisher, the editors and the reviewers. Any product that may be evaluated in this article, or claim that may be made by its manufacturer, is not guaranteed or endorsed by the publisher.
Supplementary material
The Supplementary material for this article can be found online at: https://www.frontiersin.org/articles/10.3389/fsufs.2025.1548304/full#supplementary-material
References
Abate, S. (2021). Impact of cluster farming on farmers productivity and commercialization: the case of Dera woreda. Available online at: http://ir.bdu.edu.et/handle/123456789/12056
Alemu, D., and Berhanu, K. (2018). The political economy of agricultural commercialization in Ethiopia: discourses, actors and structural impediments : Agricultural Policy Research in Africa (APRA) Working Paper 14, Future Agricultures Consortium.
Asfaw, S., Shiferaw, B., and Simtowe, F. (2010). Does technology adoption promote commercialization? Evidence from chickpea technologies in Ethiopia. In CSAE 2010 conference on Economic Development in Africa, University of Oxford, UK.
Ashenafi, M., Zewdu, B., Selassie, Y. G., and Getachew, A. (2022). Socioeconomic determinants of maize production among northwestern Ethiopia’s small-scale farmers: evidence from three agroecology zones. Afr. J. Food Agric. Nutr. Dev. 22, 21863–21889. doi: 10.18697/ajfand.115.22420
Ayele, T. (2022). Cereal crops commercialization and welfare of households in Guji zone, Ethiopia. Heliyon 8:e10687. doi: 10.1016/j.heliyon.2022.e10687
Belay, G. H., Mengstu, K. A., Kahsay, M., Hosseininia, G., Işık, A., Viira, A., et al. (2021). Determinants of smallholder commercialization of livestock: a case study from Tigray, Ethiopia. Cogent Food Agric. 7:1921950. doi: 10.1080/23311932.2021.1921950
Berhanu, G., and Jaleta, M. (2010). Commercialization of smallholders: does market orientation translate into market participation? In Improving productivity and market success (IPMS) of Ethiopian farmers project working paper 22. Nairobi, Kenya: ILRI. Available online at: https://cgspace.cgiar.org/server/api/core/bitstreams/c57d1079-88bc-4703ad41-9a74d13418ff/content
Beyene, A. M., and Gashu, A. T. (2022). Smallholder crop commercialization and food and nutrition security: a review. J. Rice Res. 10, 01–8. doi: 10.4172/2375-4338.1000340
Boka, G. T. (2016). Commercialization of smallholder farmers in light of climate change and logistic challenges: evidence from Central Ethiopia. Glob. J. Econ. Bus. Adm. Commercialization 1, 1–13.
Boka, G. T. (2017). Climate change challenges, smallholders’ commercialization, and progress out of poverty in ethiopia, working paper series n° 253, african development bank, abidjan, côte d’ivoire.
Caldero, R. Ethiopia’s struggle with escalating Teff. (2024). Available online at: https://www.riotimesonline.com/ethiopias-struggle-with-escalating-teff-prices/
Cheber, D. (2018). Smallholder agricultural commercialization for income growth and poverty alleviation: a review from Ethiopian context. Dev Country Stud. 8, 1–15.
Cheffo, A., Ketema, M., Mehare, A., Shumeta, Z., and Habte, E. (2023). Impact of malt-barley commercialization clusters on productivity at household level: the case of selected districts of Oromia region, Ethiopia. Ethiop. J. Agric. Sci. 33, 35–48.
Degefu, S., Sileshi, M., and Ogeto, M. A. (2024). Impact of cluster farming on wheat productivity and net benefit among smallholder farmers in Lemu - Bilbilo and Hetosa districts of Arsi zone, Ethiopia. Discov. Food 4:59. doi: 10.1007/s44187-024-00128-1
Dube, A. K., Fawole, W. O., Bank, W., Govindasamy, R., and Ozkan, B. (2019). Agricultural development led industrialization in Ethiopia: structural break analysis. Int. J. Agric. For. Life Sci. 3, 193–201.
Dureti, G. G., Tabe-Ojong, M. P. J., and Owusu-Sekyere, E. (2023). The new normal? Cluster farming and smallholder commercialization in Ethiopia. Agric. Econ. 56, 1–22. doi: 10.1111/agec.12790
Endalew, B., Elias, A., and Yasunobu, K. (2024). Impact of cluster farming on smallholder farmers teff commercialization in Ethiopia. CABI Agric. Biosci. 5, 1–12. doi: 10.1186/s43170-024-00220-7
Ferede, S., Agegnehu, G., Kehaliew, A., Alemu, T., and Yirga, C. (2020). Farming systems characterization and analysis in east Gojjam zone: Implications for research and development (R&D) interventions. Ethiopian Institute of Agricultural Research.
Gagabo, S. Y. (2023). Modeling and forecasting the domestic retail price of Teff in Ethiopia. Int. J. Data Sci. Anal. 9, 34–42. doi: 10.11648/j.ijdsa.20230902.12
Gebiso, T., Ketema, M., Shumetie, A., and Leggesse, G. (2023). Drivers of crop commercialization in central and southern Oromia, Ethiopia. Discov. Food 3:15. doi: 10.1007/s44187-023-00055-7
Gebremedhin, B., and Jaleta, M. (2012). “Market orientation and market participation of smallholders in Ethiopia: implications for commercial transformation” in International Association of Agricultural Economists (IAAE) triennial conference, Foz do Lguacu, Brazil, 18–24 August, 1–25.
Getahun, A. (2021). Smallholder farmers agricultural commercialization in Ethiopia: a review. Agric. For. Fish. 9, 74–81. doi: 10.11648/j.aff.20200903.14
Gidelew, G. E., Tefera, T. L., and Aweke, C. S. (2022). From staple food to market-oriented crop: commercialization level of smallholder teff (Eragrostis teff) growers in Jamma District, Ethiopia. CABI Agric. Biosci. 3, 1–14. doi: 10.1186/s43170-022-00123-5
Girma, Y., and Kelil, A. (2021). Agricultural commercialization of smallholder farmers in Ethiopia: a review. J. Econ. Sustain. Dev. 12. doi: 10.7176/jesd/12-13-04
Gomez y Paloma, S., Riesgo, L., and Louhichi, K. (2020). The role of smallholder farms in food and nutrition security : Springer Nature Switzerland AG. 251.
Hailu, M. (2021). The impact of improved agricultural technologies on household food security of smallholders in Central Ethiopia: an endogenous switching estimation. World Food Policy 7, 111–127. doi: 10.1002/wfp2.12029
Hussen, C. H., and Geleta, F. T. (2021). Factors affecting smallholder farmers participations in cluster crop production: evidence from selected districts of west Shewa zone, Oromia National Regional State, Ethiopia. Sarhad J. Agric. 37, 818–829. doi: 10.17582/journal.sja/2021/37.3.818.829
Jaleta, M., Berhanu, G., and Hoekstra, D. A. (2009). Smallholder commercialization: processes, determinants and impact. Discussion paper no. 18. improving productivity and market success (IPMS) of Ethiopian farmers project, ILRI (International Livestock Research Institute), Nairobi, Kenya. 55.
Karki, L., Shange, R., Hill, W. A., Bonsi, C., English, H., Agbodjan, E., et al. (2021). Assessing the impact of cluster farming initiatives on small and socially disadvantaged farmers, ranchers, and forestland owners: a case of the southeastern region of the United States. Prof. Agric. Workers J. 7:30.
Kassie, K. E., Alemu, B. A., and Wedajoo, A. S. (2018). Impact of irrigation on household multidimensional poverty reduction in the Koga irrigation development project, northern Ethiopia. Asian Dev. Perspect. 9, 159–187. doi: 10.22681/adp.2018.9.2.159
Konja, D. T., and Mabe, F. N. (2023). Market participation of smallholder groundnut farmers in northern Ghana: generalised double-hurdle model approach. Cogent Econ. Finance 11:2202049. doi: 10.1080/23322039.2023.2202049
Kothari, C. R. (2004). Research methodology: Methods and techniques. 2nd Rev Edn: New Delhi: New Age International (P) Ltd.
Linderhof, V., Janssen, V., and Achterbosch, T. (2019). Does agricultural commercialization affect food security: the case of crop-producing households in the regions of post-reform Vietnam? Sustain. For. 11. doi: 10.3390/su11051263
Louhichi, K., Temursho, U., and Gomez, S. (2019). Upscaling the productivity performance of the agricultural commercialization cluster initiative in Ethiopia, EUR 29950 EN, Publications Office of the European Union, Luxembourg.
Machavarapu, M. P. (2014). A review on gender differences in access to and control over agricultural resources in farmer families. Sci. Park 1, 1–13. doi: 10.9780/23218045/1202013/49
Melesse, K. A. (2016). Commercial behaviour of smallholder potato producers: the case of Kombolchaworeda, eastern part of Ethiopia. Econ. Agric. 13, 159–173.
Mgendi, G., Mao, S., and Qiao, F. (2022). Does agricultural training and demonstration matter in technology adoption? The empirical evidence from small rice farmers in Tanzania. Technol. Soc. 70:102024. doi: 10.1016/j.techsoc.2022.102024
Missiame, A., Nyikal, R. A., and Irungu, P. (2021). What is the impact of rural bank credit access on the technical efficiency of smallholder cassava farmers in Ghana? An endogenous switching regression analysis. Heliyon 7:e07102. doi: 10.1016/j.heliyon.2021.e07102
Muhammed, N., Fetene, F., Adem, E., and Bojago, E. (2023). Evaluating the impact of productive safety net program on rural household food security achievement: endogenous switching regression modeling approach. J. Agric. Food Res. 14:100674. doi: 10.1016/j.jafr.2023.100674
Munea, A. M., Alene, G. D., Debelew, G. T., and Sibhat, K. A. (2022). Socio-cultural context of adolescent sexuality and youth friendly service intervention in west Gojjam zone, Northwest Ethiopia: a qualitative study. BMC Public Health 22, 1–11. doi: 10.1186/s12889-022-12699-8
Naing, L., Winn, T., and Rusli, B. N. (2006). Practical issues in calculating the sample size for prevalence studies. Arch. Orofac. Sci. 1, 9–14.
Pauw, S. (2017). “Agricultural commercialization in Ethiopia: a review of warehouse receipts in the maize, wheat, sorghum and tef value chains” in USAID/Ethiopia agriculture knowledge, learning, documentation and policy project.
Pender, J., and Alemu, D. (2007). Determinants of smallholder commercialization of food crops. Washington, USA: IInternational Food Policy Research Institute.
Sultan, O. (2024). Analysis of factors affecting participation of smallholder farmers in wheat cluster farming: the case of Gasera District, bale zone, Oromia region, Ethiopia. Plant 12, 88–103. doi: 10.11648/j.plant.20241204.12
Tabe-Ojong, M. P., and Dureti, G. G. (2022). Are agro-clusters pro-poor evidence from Ethiopia. J. Agric. Econ. 74, 1–16. doi: 10.1111/1477-9552.12497
Tabe-Ojong, M. P., and Geffersa, A. G. (2024). Complementary technology adoption and smallholder commercialization: panel data evidence from Ethiopia. Agric. Appl. Econ. Assoc. 46, 1151–1174. doi: 10.1002/aepp.13439
Tafesse, Y. (2022). The Ethiopian agricultural transformation institute (ATI). In Workshop on national policy on fostering productive capacities in Ethiopia for industrialization, export diversification & inclusive growth: the role of agriculture in kickstarting economic diversification & structural transformation in Ethiopia.
Temesgen, H., and Aweke, C. S. (2023). A scoping review on the impacts of smallholder agriculture production on food and nutrition security: evidence from Ethiopia context. Agric. Food Secur. 12, 1–8. doi: 10.1186/s40066-023-00449-x
Wardhana, D. (2018). Agro-clusters for rural development in the Indonesian Province of West Java (Doctoral dissertation, Wageningen University and Research).
Wardhana, D., Ihle, R., and Heijman, W. (2021). Effects of peer pressure in agro-clusters of West Java. Bull. Indones. Econ. Stud. 57, 233–256. doi: 10.1080/00074918.2020.1780197
Washim, M. R., Kamal, M., Yasmin, R., and Station, B. W. (2015). The impact of cluster farming approach in simplification of shrimp (Penaeus monodon) marketing channel of Paikgachha Upazila. Eur. J. Bus. Manag. 7, 97–104.
Wendimu, G. Y. (2021). The challenges and prospects of Ethiopian agriculture. Cogent Food Agric. 7:1923619. doi: 10.1080/23311932.2021.1923619
Woolfrey, S., Molina, P. B., and Ronceray, M. (2021). “Agrinvest-food systems project – political economy analysis of the Ethiopian food system. Key political economy factors and promising value chains to improve food system sustainability” in AgrInvest-food systems project – Political economy analysis of the Ethiopian food system (Rome: FAO).
Zandstra, T., Rashid, G. T. A. S., and Minot, N. (2024). The importance of the agricultural transformation agency in Ethiopia. Available online at: https://www.ifpri.org/blog/importance-agricultural-transformation-agency-ethiopia/
Keywords: commercialization, cluster farming, Endogenous Switching Regression, impact, Ethiopia
Citation: Gidelew GE, Alemu BA and Kassie KE (2025) The crop commercialization impact of cluster farming initiative in Northwestern Ethiopia. Front. Sustain. Food Syst. 9:1548304. doi: 10.3389/fsufs.2025.1548304
Edited by:
Abdullah Mohammad Ghazi Al Khatib, Damascus University, SyriaReviewed by:
Zelalem Getahun Dessie, University of KwaZulu-Natal, South AfricaAkinson Tumbure, Marondera University of Agricultural Sciences and Technology (MUAST), Zimbabwe
Copyright © 2025 Gidelew, Alemu and Kassie. This is an open-access article distributed under the terms of the Creative Commons Attribution License (CC BY). The use, distribution or reproduction in other forums is permitted, provided the original author(s) and the copyright owner(s) are credited and that the original publication in this journal is cited, in accordance with accepted academic practice. No use, distribution or reproduction is permitted which does not comply with these terms.
*Correspondence: Getachew Eshetu Gidelew, Z2V0YWNoZXdyZDIwMDZAZ21haWwuY29t