 Kunxiang Wei
 Chunjing Lou
 Zhaoxue Sun
- School of Management, Shenyang Normal University, Shenyang, China
Conducting research on food security with multi-dimensional resource orientation. is of great significance. It ensures a stable food supply, alleviates hunger and promotes social and economic stability worldwide. This study constructed a functional zoning of food production security from the perspective of “water-energy” constraints. It was based on the production, water consumption, carbon emission and resource endowment data of four staple foods in 17 cities of Henan Province in 2020. Five methods, such as location entropy, resource endowment coefficient and carbon emission equation, etc., were used. Based on the seventh national population census data and scenario simulations for the “15th Five-Year Plan” period (2026–2030), the queuing element method and the grey GM (1, 1) prediction model were adopted to estimate the population changes and food demand in Henan Province during the “15th Five-Year Plan” period. According to the zoning and demand estimation results, an optimization plan for the planting structure of food crops toward the “15th Five-Year Plan” period was proposed. The results are as follows: ① the food production advantage areas are distributed around the two core areas of “Anyang-Xinxiang” and “Zhumadian”; ② the total population of Henan Province shows a trend of first increasing and then decreasing, but the per capita food demand and total food demand continue to grow; ③ the optimized planting structure of food crops, except for rice, has obvious differences in yield increase in other major food crops; ④ after optimizing the planting structure, water and energy resources consumption is significantly reduced, with a 17.90% reduction in carbon emissions and a 23.32% reduction in water consumption. In this study, a more reasonable yield increase scheme was formed by optimizing the food planting structure. It can effectively reduce the potential hidden dangers of food security caused by the tightening of “water-energy” resources during the “15th Five-Year Plan” period.
1 Introduction
Global food security is threatened by population growth, climate change, resource constraints, economic disparities, and geopolitical instability. Food security serves as a fundamental cornerstone, crucial for the survival, wellbeing, social stability, development of billions of people worldwide, the international economic order, and ecological sustainability. At the national level, food security refers to the national food supply. National food access includes both domestic food production and international trade (Xie et al., 2017; Yu and Lu, 2006). Owing to the risks associated with food supply and its price volatility, almost all countries worldwide are on a consensus to achieve food security based on domestic food production (Beckford and Campbell, 2013). China, as a developing nation with a population of over 1.4 billion, supports more than 20% of the world’s population on <10% of the world’s cultivated land. The problem that arises for China’s food security will become a profound issue for the global food market which cannot be ignored (Chen and Nie, 2016). With the continuous ele-vation of China’s economic development level and the growth of its population, people’s demands for the quantity, quality, and supply stability of food are on the rise. In reality, however, it is difficult to increase food production, reverse the decline of arable land resources, and address shortages of other resources including water (Zhang and Xu, 2008). Firstly, food safety is inextricably linked to water resources. Water resources play a crucial role in human survival and socioeconomic development. The OECD predicts that with population growth and resource-intensive economic development, the global water demand will increase by 55% in 2050 (OECD, 2012). The increasing conflict in global water supply and demand will hinder sustainable development (Liang et al., 2024). China is a large agricultural country with severe water resource shortages, which has drawn considerable scholarly attention in the context of the food-water nexus (Feng et al., 2014; Liao et al., 2019). Specifically, issues related to China’s water resources include the following aspects: limited and unevenly distributed water resources, reduction of surface water resources, depletion of groundwater resources, deterioration of water quality, increasing water demand, and climate change. These water-related problems seriously affect the increase of China’s food production (Wang et al., 2017). In addition, the problem of carbon emissions from agricultural energy is also showing an increasingly serious trend. Agriculture is characterized by the petroleum agricultural production model with considerable energy consumption (Zou, 2022).
In 1974, the United Nations Food and Agriculture Organization first proposed the concept of “food security.” That ensures that anyone can get enough food for survival and health at any time. In 1990, Anderson proposed that food security should include two lower standards. That is, the possibility of access to healthy, safe, harmless food and people’s ability to obtain it. China’s food security is valued by the government and relevant academic institutions because of its unique strategic position. In 1992, the Chinese government put forward the concept of food security. In China, food security means that it can effectively provide all residents with sufficient quantity, reasonable structure, and quality standards, including food. Relevant scholars have also elaborated on the connotation of food security from different perspectives. Food security is the problem of whether the family has enough income to maintain enough life. Food security is not food self-sufficiency (Chen and Ron, 2008). Sheryl L. believes that food security consists of six interrelated and interdependent dimensions, namely, availability, accessibility, nutrition, resilience, agency, and sustainability (Hendriks and Babu, 2024). Harper M. believes that food security refers to the ability to cope with the impact of natural or man-made disasters on the food system (Harper et al., 2019). Malik A. Hussain believes that food security is related to many factors, such as population growth, poverty, economic stability and so on. Food safety should ensure that everyone has adequate, safe and nutritionally balanced food (Hussain et al., 2025). During the “14th Five-Year Plan” period (2021–2025), China’s population growth trend slowed down and the demand for rations decreased. However, due to the increasing demand for multiple food, and the growing demand of food to feed reform, the total demand for food still maintains a steady increase. At the same time, the potential risks of food security have begun to emerge. It is foreseeable that this trend will continue during the “15th Five-Year Plan” period. In the face of growing food demand, how to take what kind of food security program? What kind of food security means should be used needs further discussion.
At present, there are many methods to predict food demand. It mainly includes: the inference method, time series method, single equation econometric model, supply and demand simultaneous equation model, demand system simultaneous equation model, and nutrition demand method (Long and Zeng, 2008). The inference method is mainly based on the systematic analysis of historical experience, realistic trends, and international experience to judge the change of food demand. The time series method is mainly used to predict the food demand in the future by hierarchical prediction of historical data. This method is simple and convenient, but there is a big deviation in medium and long-term prediction. The single equation econometric model mainly predicts food demand by analyzing the quantitative relationship between food demand and influencing factors. However, it is difficult to reflect the influence of external factors. The simultaneous equation model makes up for the deficiency of the single equation econometric model in considering external factors to a certain extent, but there is a lack of context setting. The nutrient demand method is mainly through the establishment of food consumption and energy, and protein conversion formula to calculate the future demand for food consumption. However, it is less applied due to the lack of a more solid economic analysis framework.
In the long run, agricultural water is the main way to use water resources in most areas. Agricultural water is fresh water, and 70% of the world’s freshwater resources are used for agricultural irrigation (Simionesei et al., 2020). China is a large agricultural production country and the per capita water resources are less, which leads to the problem of water resources security in the main food-producing areas. At the same time, with the continuous development of China’s social economy, the consumption structure of residents has also been continuously adjusted. This leads to the pressure of regional water resources security brought by the adjustment of planting structure. Some studies have shown that the water demand of the same food crop planted in different regions is quite different. Adjusting regional crop planting structures can improve water use efficiency and reduce crop water requirements (Han et al., 2018). Optimizing the planting structure can provide a feasible, practical way to alleviate the pressure of regional water resources security. China is one of the largest agricultural countries in the world, and the problem of water shortage is serious. It is urgent to improve the utilization efficiency of water resources by optimizing the planting structure to alleviate the problem of water shortage (Zhang et al., 2016). Therefore, it is of great practical significance to explore the optimization scheme of the planting structure of food production and water resources. To further carry out detailed quantitative calculations, some scholars have tried to introduce the concept of virtual water. The water footprint analysis method was introduced into the study of food security. The matching scheme of regional food production and water resources security was explored, and the optimization of planting structure was carried out based on the water footprint and water resources in the process of crop production.
Globally, the energy consumption of the agricultural food system accounts for about 30% of the total energy consumption, and the two are closely related. From China’s perspective, over the years, the improvement of China’s agricultural production level has depended on the continuous promotion of agricultural modernization. During the “14th Five-Year Plan” period, the demand for secondary energy, such as chemical fertilizer, agricultural film, and agricultural diesel oil in China’s agricultural development far exceeded the growth rate of food output. Therefore, to promote the realization of the 2030 Sustainable Development Goals and comply with the Paris Climate Change Agreement, it is necessary to carry out research on the transformation of the joint energy and food systems (IRENA and FAO, 2021). With the deepening of research in related fields, how to consider the overall consumption of agricultural energy has become a key issue facing the academic community. The concept of agricultural carbon emissions offers a new way to reflect total agricultural energy consumption by considering the varying external energy demands at different stages of primary and secondary energy use in agriculture and during crop growth. Elahi et al. (2024) have proposed the SBM methodology, gravity model and network analysis to solve the problem of increasing carbon emissions caused by the excessive use of agricultural chemicals in the process of food production in the Yangtze River Basin (Dong and Mu, 2014). Liu et al. (2024) used the improved fire radiation power and community multi-scale air quality algorithm to estimate the two processes that directly affect farmland carbon emissions.
In summary, the current academic research on the resource conditions of food production is still centered on single resource elements such as water resources and energy. There is no clear explanation of the relationship between water and energy resources in the world, and there are few relevant comments on the relationship between the two. Few scholars have studied the resource conditions of food production based on the perspective of water energy (Endo et al., 2017). The study attempted to proceed from the perspective of food production. The complex relationship of “water-energy-food” was simplified as the restriction of water resources (water consumption in production) and energy (carbon emission in production) in the process of food production. The research objects were rice, wheat, maize, and beans, four kinds of food crops. Based on the advantages of yield, yield per unit area, water consumption, and carbon emission of regional food production, the regionalization of crop production security capacity was carried out from the perspective of water-energy constraints. According to the food demand in Henan Province during the “15th Five-Year Plan” period, an optimization plan for the planting structure of food crops in Henan Province based on the perspective of water-energy resources constraints was proposed. The marginal contribution of this study lies in the following aspects. From the perspective of resource constraints, the planting structure optimization strategy of grain production is comprehensively considered. At the same time, it can provide methodological reference and inspiration for food security research from the perspective of resources. It also provides a decision-making basis and data reference for policy-making related to food security.
2 Materials and methods
2.1 Study areas
Henan Province is located in the central-eastern part of China. The terrain is high in the west and low in the east. It is composed of plains and basins, mountains, hills, and water surfaces. It spans four major river basins: the Haihe River, the Yellow River, the Huaihe River, and the Yangtze River. It belongs to the continental monsoon climate transition from subtropical to warm temperate zone. It is an important food “transformation plus” province in China’s major food-producing areas. By 2022, the cultivated land area of Henan Province was 7534.9 thousand hectares, ranking third in China. The area sown with food was 10,778.4 thousand hectares, ranking second in China. The food output was 67.894 million tons, ranking second in China, accounting for 9.89% of the country. Wheat was the highest-yielding food crop in Henan province. The output of wheat was 38.127 million tons, ranking first in China, accounting for 27.68% of the country.
2.2 Data sources
The basic data point of the study was 2020. The data of China’s GDP, the total value of the primary industry, and the output value of agriculture, forestry, animal husbandry, and fishery were derived from the China Statistical Yearbook in 2021. The data of crop planting areas, crop yield, and agricultural material input in Henan Province and 17 cities were derived from the Henan Statistical Yearbook and Henan Survey Yearbook in 2021. All are statistical data sets compiled by China’s official statistical agencies.
2.3 Research methods
2.3.1 Extreme value method
The extreme value method is a standardized processing method based on the maximum and minimum values in the sequence. The study attempted to introduce the extreme value method to reduce the impact of data value differences caused by index units on measurement. The calculation formulas are as follows:
Yi represents the original data of the indicator. Xmax represents the maximum value in the index evaluation sample. Xmin represents the minimum value in the index evaluation sample.
2.3.2 Location entropy
Location entropy can reflect the industry’s regional dominance and spatial distribution intensity. In this study, location entropy was used to analyze the advantages of regional agricultural industry development to clarify which areas are more suitable for the development of the agricultural industry, that is, with industrial advantages. The calculation formula is as follows:
Rij is the location entropy of industry j in region i. Zij is the gross product of industry j in region i. Zj is the regional GDP of region j. Wj is the total output value of the j industry in the province. W is the province’s GDP. Location entropy is a positive index. That is, the greater the regional industrial location entropy, the more obvious the relative advantage of the industry.
2.3.3 Resource endowment coefficient
The resource endowment coefficient is often used to reflect the relative abundance of a country or region in a certain resource. In this study, the resource endowment coefficient was used to analyze the resource richness of regional food crop cultivation. Thus, it is clear which regions have more relative resource advantages in the process of food production, that is, resource advantages. The calculation formula is as follows:
EFij is the resource endowment coefficient of j crop production in the i region. Vij is the yield of j crops in the i region. V is the yield of j crops in the Henan province. Ti is the total output value of agriculture, forestry, animal husbandry, and fishery in region i. T is the total output value of agriculture, forestry, animal husbandry, and fishery in Henan province. The resource endowment coefficient is a positive indicator. The greater the resource endowment coefficient of regional crop production, the more obvious the relative advantage of resources.
2.3.4 Carbon emission equation
Referring to the carbon emission equation constructed by Shi Yaoling (Shi and Ma, 2025) and Tian Yun (Tian and Yin, 2022; Tian et al., 2014), the carbon emission equation of food production was studied and constructed. In this study, the carbon emission equation of food production was used to analyze the carbon emissions of the whole process of food production. Specifically, it includes soil carbon emissions caused by tillage and direct carbon emissions from the growth cycle of food crops. The calculation formula is as follows:
E is the total carbon emission of food production. Ei is the carbon emission of various carbon sources. Ci is the amount of each carbon emission source. Ni is the carbon emission coefficient of each carbon emission source.
According to the characteristics of carbon emission in food production, the specific carbon source factors and carbon emission coefficients were determined from three aspects (agricultural materials, soil, and paddy field). To facilitate the summary analysis, based on reference to the previous results, and according to the degree of influence on the greenhouse effect, the CH4 and N2O were replaced into the standard C. That is, 1 ton of CH4 is equivalent to 6.8182 tons of C, and 1 ton of N2O is equivalent to 181.2727 tons of C.
2.3.4.1 Carbon emissions from agricultural materials
Referring to the previous research results and combining them with the results of expert consultation, the study believed that the carbon emissions from agricultural materials mainly include two aspects: One is the emission of chemical fertilizer, pesticide, agricultural film, and agricultural diesel oil. The carbon emission coefficients are 0.8956, 4.9341, 5.18, and 0.5927 kgC/kg, respectively. The second is the carbon emission of agricultural irrigation power consumption, and its carbon emission coefficient is 266.48 kgC/hm2.
2.3.4.2 N2O emissions from soil
In the process of crop planting, the destruction of the soil surface will easily lead to a large amount of greenhouse gases into the atmosphere. Among them, N2O is the most prominent. Referring to the soil N2O emission coefficient of main crops in China in the previous research results, the N2O emissions per hectare of rice, spring wheat, winter wheat, soybean, and maize were 0.24, 0.4, 1.75, 2.29, 2.532, and 4,944 kg, respectively.
2.3.4.3 CH4 emissions from paddy fields
In the pre-study, Min calculated the CH4 emission coefficient of early rice, late rice, and mid-season rice in each province by referring to the relevant parameters of weather, soil, and hydrological characteristics (Min and Hu, 2012). Because the research samples are all from one province with small geographical differences. The rice planting in Henan is mostly middle-season rice, the CH4 emission coefficient of rice in the province is estimated to be 178.5 kg/hm2.
2.3.5 Crop water requirement calculation methods
The calculation method of crop water requirement is the calculation method of water requirement considering the natural transpiration and crop growth cycle. In this study, the crop water requirement method was used to measure the water consumption of food crops in different regions.
Penman-Monteith is a method for calculating reference crop evapotranspiration with small errors. The formula is as follows:
is the reference crop evapotranspiration. is the net radiation of the crop surface. G is the soil heat flux. T is the daily average temperature at 2 m above the ground. μ is the wind velocity at 2 m above the ground. is the saturated water pressure. is the actual water vapor pressure. δ is the slope of the saturated water vapor pressure curve. γ is the dry and wet table constant.
Crop water requirement is generally accumulated by crop evapotranspiration in each growth period. at different growth stages is obtained by referring to and the corresponding crop coefficient . The formula is as follows:
CWU is the water requirement per unit area of crops. α is a constant, and the water depth index is converted into a water volume factor of 10. d represents the number of days from planting. represents the number of days in different growth stages. The is the crop coefficient.
2.3.6 Coupling coordination degree model
The coupling coordination degree is often used to measure the dependence of information and parameters between multiple modules. In this study, the coupling coordination model was used to build a bridge between industrial advantages, resource advantages, mu yield advantages and yield advantages. The comprehensive advantages of food production in different regions under the influence of multiple advantages were considered. The calculation formulas are as follows:
F is the degree of coupling coordination between the two systems. The larger the positive index F is, the stronger the coupling coordination between the two systems is. D is the coupling degree of the two systems. T is the degree of influence of each subsystem on the overall system. is the calculation result of each subsystem, which corresponds to the yield advantage, yield advantage, industrial advantage, and resource endowment advantage in the process of food production. is the importance of each subsystem. The study showed that the importance of yield advantage, yield advantage, industrial advantage and resource endowment advantage in the process of food production is equal, so is 0.25.
2.3.7 Food production capacity index
The study suggested that it is necessary to fully measure the food production capacity from the perspective of water resources-energy constraints to carry out the food security function zoning from the perspective of water-energy resources constraints. It involves three key issues, including: food production advantages, carbon emission advantages and water consumption advantages. Based on this, it is necessary to establish a suitable index calculation method to take the three into account, and consider that the energy consumption and water consumption of crops per unit area play a negative role in the formation of regional energy consumption advantages and water consumption advantages. Therefore, in the operation, the calculation method of the negative index of the extreme value method according to Equation 1 was used to standardize the water demand and carbon emission of food production. The calculation method of the positive index of the extreme value method was used to standardize the coupling coordination degree of the food industry development. The food production capacity index from the perspective of water-energy resources constraints was constructed by multiplying the results, and the regionalization was carried out based on this.
is the food production capacity index from the perspective of water-energy constraints of i crops in region k. is the data standardization processing result of crop carbon emission per unit area in region k. is the data standardization processing result of water demand per unit area of i crops in region k. is the coupling coordination degree of food industry development in region k.
2.3.8 Grey prediction model
GM (1, 1) is a prediction model based on grey system theory. It is a model composed of a differential equation containing only a single variable. In this study, the grey prediction model was used to predict the change of per capita food demand, which formed the change of total food demand in the future. The modeling steps are as follows:Let the original data sequence be:
Using one accumulation, the generated column is:
Then the corresponding differential equation of GM (1, 1) model is:
a is called the development grey number, and μ is called the endogenous control grey number.
According to the principle of least square method, the parameters of grey GM (1, 1) model are listed as follows:
Among them:
By solving the differential equation, the prediction model can be obtained:
3 Analysis
3.1 Analysis of the advantages of food production in Henan province
3.1.1 Analysis of the coupling coordination degree of food industry development
According to the characteristics of food production, the study divided it into resource advantage, industrial advantage, mu yield advantage, and yield advantage. Based on this, the coupling coordination degree of food industry development in Henan Province was calculated. Figure 1A is the resource advantage of food production according to Equation 3. It can be seen from the figure that the advantages of food production resources in northern and central Henan are more obvious. Figure 1B shows the industrial advantages of food production according to Equation 2. The actual calculation was expressed by the location entropy of the primary industry. From the figure, it can be seen that the advantages of the food production industry in southern and eastern Henan are obvious. Figure 1C is the yield advantage of food production. From the figure, it can be seen that the pan-eastern region has obvious advantages in per mu yield. Figure 1D is the yield advantage of food production. It can be seen from the figure that the dominant area is distributed in a belt, concentrated in the “Nanyang-Shangqiu” area. According to the Figure 1E according to Equations 7–9, it can be seen that the spatial difference of the coupling coordination degree of food industry development in Henan Province is significant. The high-level areas are mostly concentrated in the eastern part of Henan Province. The northern and southern Henan (Nanyang, Xinyang) areas are mostly medium-high level areas with a good coupling coordination degree. The central Henan region is second, and the development of each advantage has certain coordination.
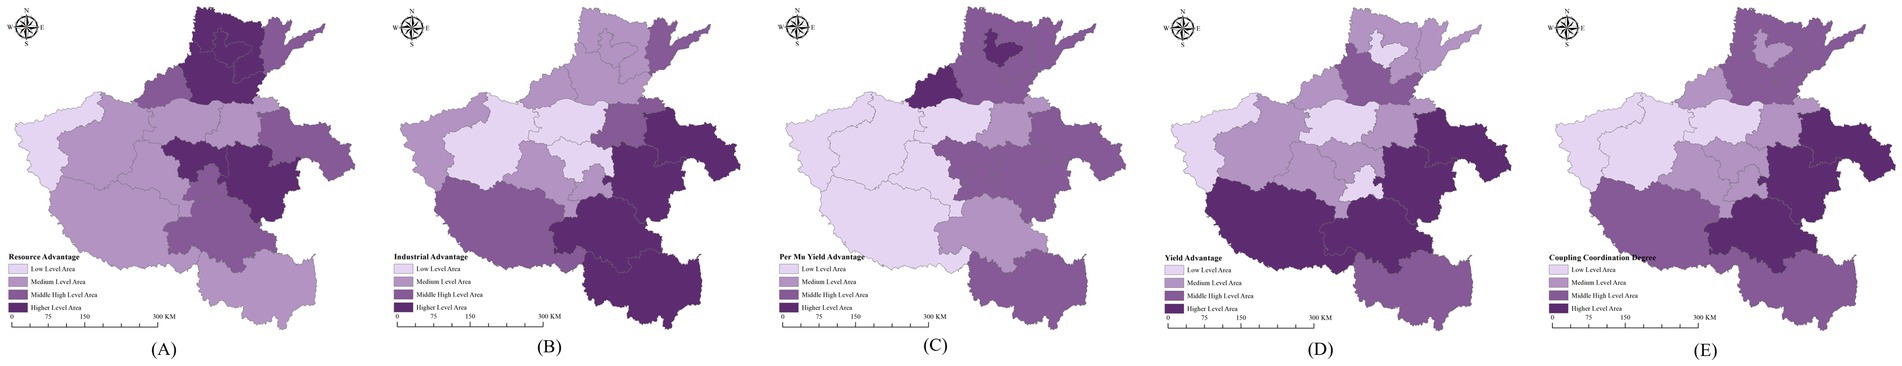
Figure 1. The resource advantage of food industry development in Henan province (A). The industrial advantage (B). The mu yield advantage (C). The yield advantage (D). The coupling coordination degree of advantage development (E).
3.1.2 Analysis of resource consumption in food crop production
This study is based on the perspective of water-energy constraints, therefore, the resourceconsumption of food crop production only considers energy and water resources. Energy is measured by agricultural carbon emissions. Water resources are measured by crop water demand.
The carbon emission equation according to Equation 4 of food production was used to study and calculate the carbon emissions of food production in 17 cities of Henan Province in 2020. The results showed that agricultural materials were the main carbon source of current food production (Table 1). This mainly included the use of chemical fertilizers, agricultural films, pesticides, and agricultural irrigation power consumption. The cumulative amount of carbon emissions was 13.076 million tons.
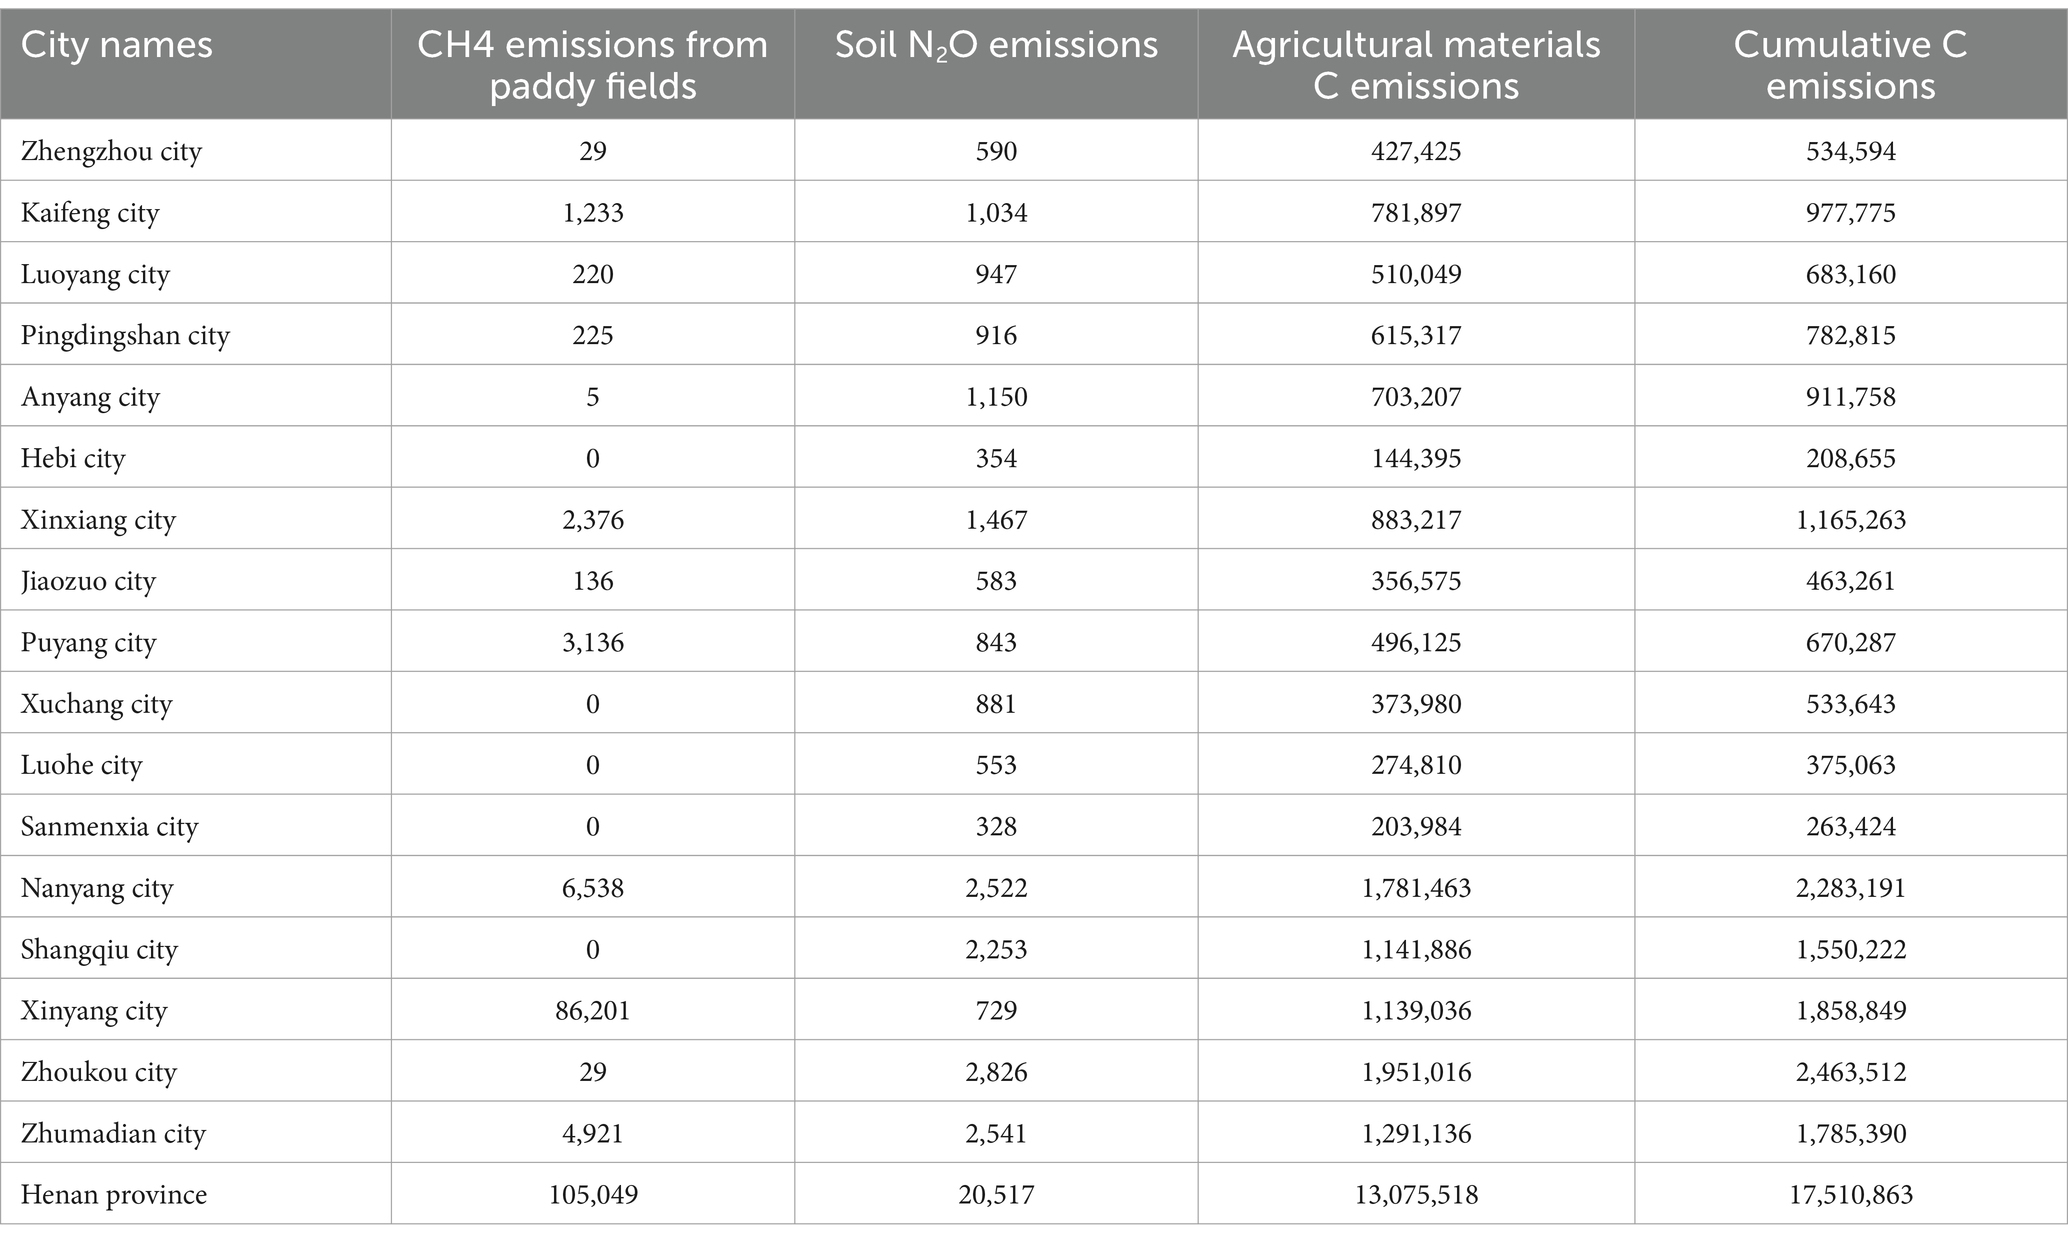
Table 1. Carbon emissions of food production in 17 cities of Henan province (tons).
It is difficult to estimate the classified data of chemical fertilizer, agricultural film, pesticide use, and agricultural irrigation power consumption. Therefore, the sown area of the four main food was summarized and processed. Based on this, the carbon emission per unit area of food crops was calculated. The data showed that there were significant differences in carbon emissions per unit area of food crops in 17 cities of Henan Province (Figure 2). Among them, especially in Xinyang City, the carbon emission per hectare of food crops was as high as 2,262 kg, more than the provincial average of 36.87%; The carbon emission per hectare of food crops in Zhengzhou was 1929 kg. The city was also much higher than the average level; The carbon emission per hectare of food crops in Hebi City and Xuchang City was <1,300 kg. Among the major food-producing cities, the carbon emissions per hectare of food crops in Zhumadian City, Zhoukou City, and Nanyang City were less than the average level of the whole province. These three cities have a good carbon emission advantage.
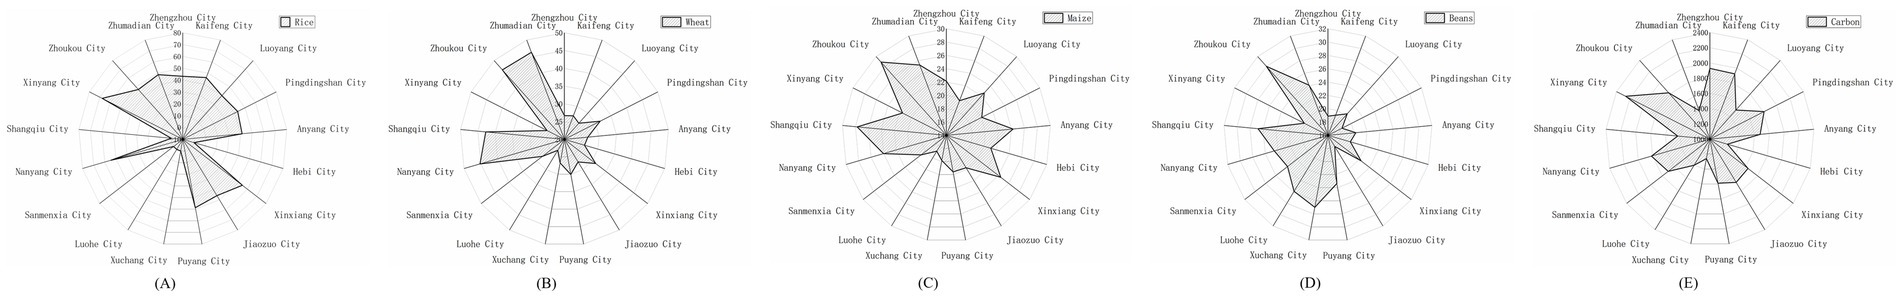
Figure 2. Analysis of water resources and energy constraints of food production.
In the pre-study, An Hui measured the crop planting water demand per unit area in each city of Henan Province (An et al., 2024) according to Equations 5, 6. Based on the results, the mean value of food planting water demand per unit area (rice, wheat, maize, beans) in each city from 2010 to 2020 was selected as the water consumption calculation standard of this study.
3.1.3 Functional zoning of food crop production
The results showed that the dominant areas of food production in Henan Province showed a spatial distribution trend around the two core areas of “Anyang-Xinxiang” and “Zhumadian” (Figure 3) according to Equation 10. Specifically, the rice production capacity of the higher-level areas included Zhumadian City. It was also consistent with the reality that the city accounts for more than 80% of the province’s rice production; The advantage area of wheat production capacity was concentrated in the north of Henan Province. The south of Henan Province was in the disadvantaged area as a whole. The dominant area of maize production capacity showed a scattered distribution trend. The dominant areas of bean production capacity were concentrated in northern Henan and Zhumadian.
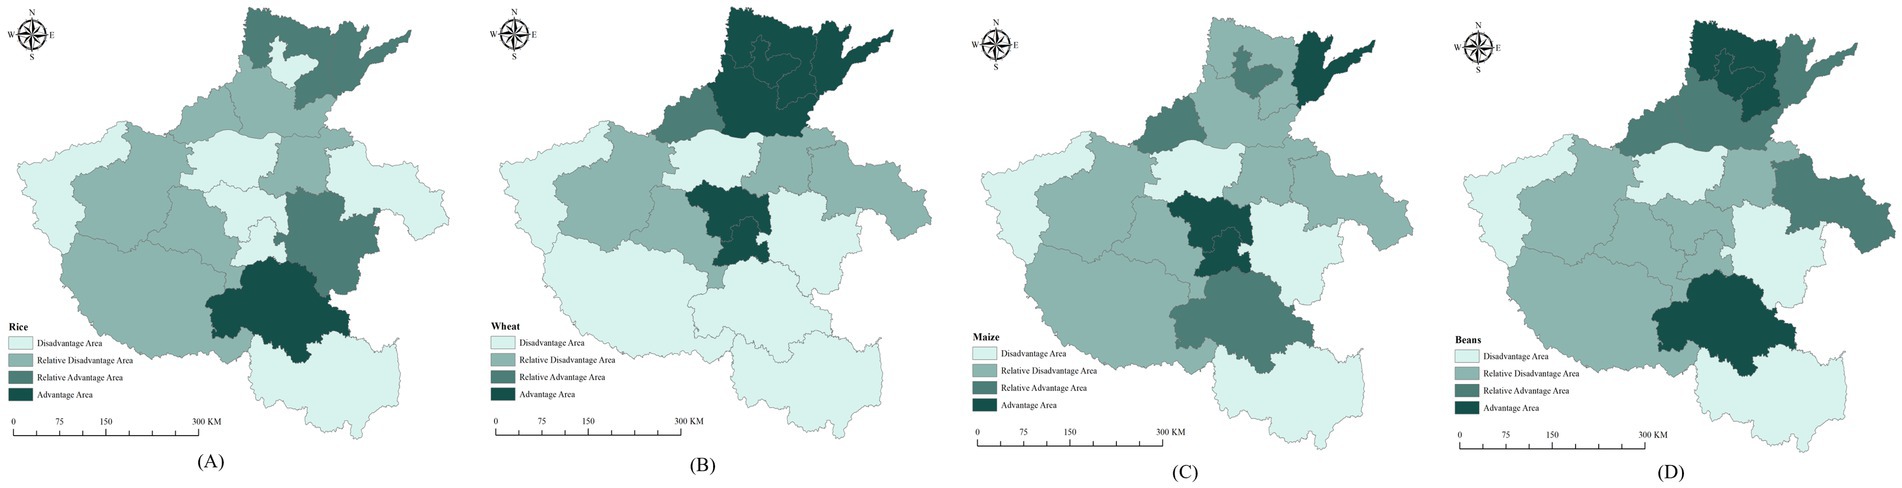
Figure 3. Regionalization of crop production support capacity of rice (A), wheat (B), maize (C), and beans (D) from the perspective of water resources-energy constraints.
3.2 Analysis of food demand in Henan province
Relevant studies pointed out that the change of population structure and the change of consumption structure caused by it will strongly impact China’s food demand. This influence is reflected in multiple dimensions. It is necessary to carry out deeper exploration. Therefore, it is of great practical significance to analyze the relationship between food supply and demand during the “15th Five-Year Plan” period from the perspective of demographic transformation.
3.2.1 Population forecast
The study attempted to use the cohort factor method to predict the population of Henan Province from 2021 to 2030. By setting the necessary parameters, it was assumed that the population of all ages was regarded as different birth cohorts every year. With the passage of time, the number of people in each birth cohort decreased due to death and changed due to migration. A new population cohort was generated through the birth of women of childbearing age, so as to realize the estimation of the future population size and structure. Specifically, it was assumed that the overall distribution of the Henan population in period t was in the age group of 0 to 100 years old (over 100 years old to 100 years old). The total population of Henan in period t + 1 was the sum of the predicted results of the mortality rate of the population aged 0–100 in period t combined with age and gender, and the predicted results of the total fertility rate and the sex ratio at birth of women of childbearing age (15–49 years old) in period t.
Using the cohort factor method to predict population requires the assumption of factor parameters. The parameters of the reference pre-study are as follows: the age structure of the base period, the population of all ages, the sex ratio of all ages, and the mortality rate of all ages using the seventh census data (It is the data from the survey organized and implemented by the Chinese government). Regarding the current total fertility rate of 1.3 in China and the continuous downward trend, the total fertility rate was taken as 1.2. It was assumed that the population of different ages in each age group was equal. The population of each city in Henan Province during the “15th Five-Year Plan” period was predicted from 2020 as the starting point of the study.
The calculation results showed that the total population of Henan Province will first increase and then decrease from 2020 to 2030 (Figure 4). The peak of the population in Henan Province is 2024. The prediction results were consistent with China’s population’s peak time. From the perspective of the city level, most cities also showed this trend. For example, the population of 11 cities such as Kaifeng City, Luoyang City, and Anyang City showed a peak to decline in different time lengths. Some cities did not show an upward trend, directly showing an accelerated downward trend, such as Pingdingshan City, Nanyang City, Zhoukou City, and five other cities. Only Zhengzhou City in the province maintained an upward trend, but it also showed a slowdown in the rise.
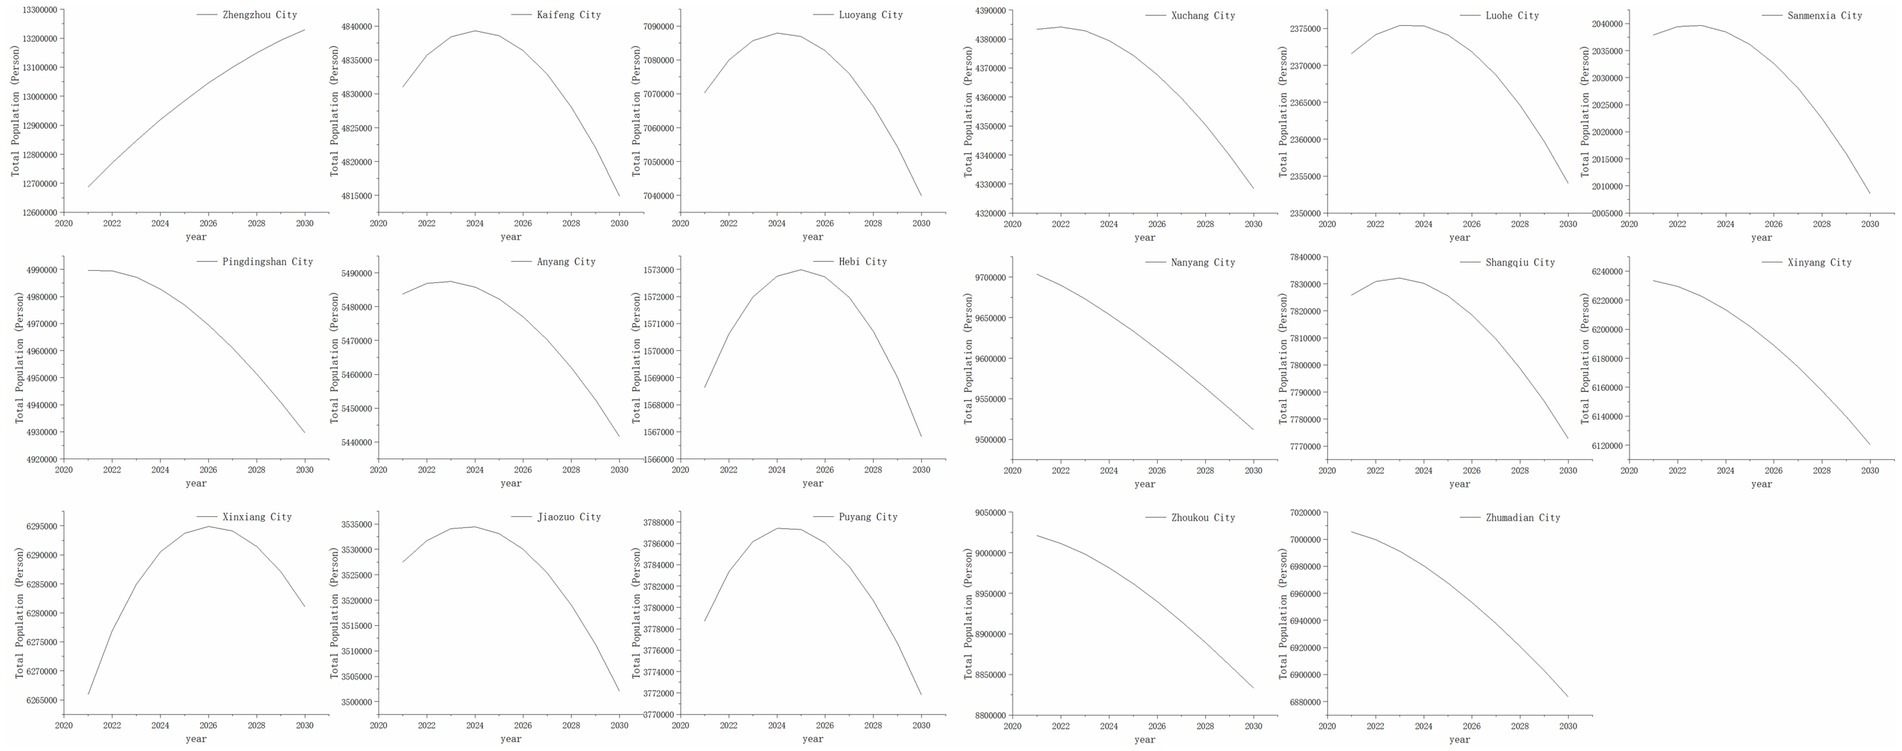
Figure 4. Prediction results of the population in Henan province.
3.2.2 Food demand estimation
Considering the availability of data and the planting structure of food crops with wheat as the core in Henan, this study only considered the demand for food rations in residents’ consumption. Based on the consumption data of per capita food (raw food), pork, beef, mutton, poultry, aquatic products and eggs of Chinese residents from 2014 to 2020 in the “China Statistical Yearbook” from 2015 to 2021 (Table 2). The per capita food (raw food) demand in Henan Province from 2021 to 2030 was predicted. The specific operation was to convert the consumption data of pork, beef, mutton, poultry, aquatic products and eggs into the consumption data of raw food through the conversion coefficient of raw food, and carried out the prediction model through grey GM (1, 1) according to Equations 11–17. Considering the two factors of Henan food culture and economic level, which have a direct impact on residents’ food consumption, it can be judged that the per capita food consumption level in Henan Province should be lower than the national average. Therefore, based on referring to the previous results and relevant data, the study assumed that the food demand in Henan Province is 80% of the per capita food consumption of Chinese residents. The total food demand was obtained by multiplying the per capita food consumption and the expected population.
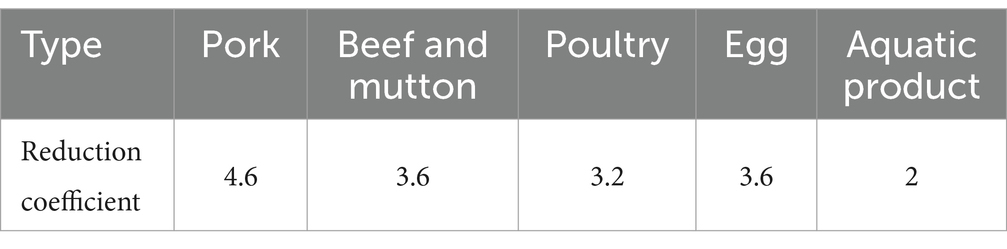
Table 2. Food purity coefficient.
The calculation results showed that the per capita food (pure) demand and total food demand in Henan Province are on the rise from 2021 to 2030 (Table 3). The rapid growth of per capita food demand caused by various factors has far exceeded the impact of population reduction on food demand. Because 2030 is the maximum value of food demand during the “15th Five-Year Plan” period, the study took the food demand in 2030 as the breakthrough point. The study explored the optimization scheme of food crop planting structure to ensure food security and reduce the consumption of “water-energy” resources during the “15th Five-Year Plan” period.
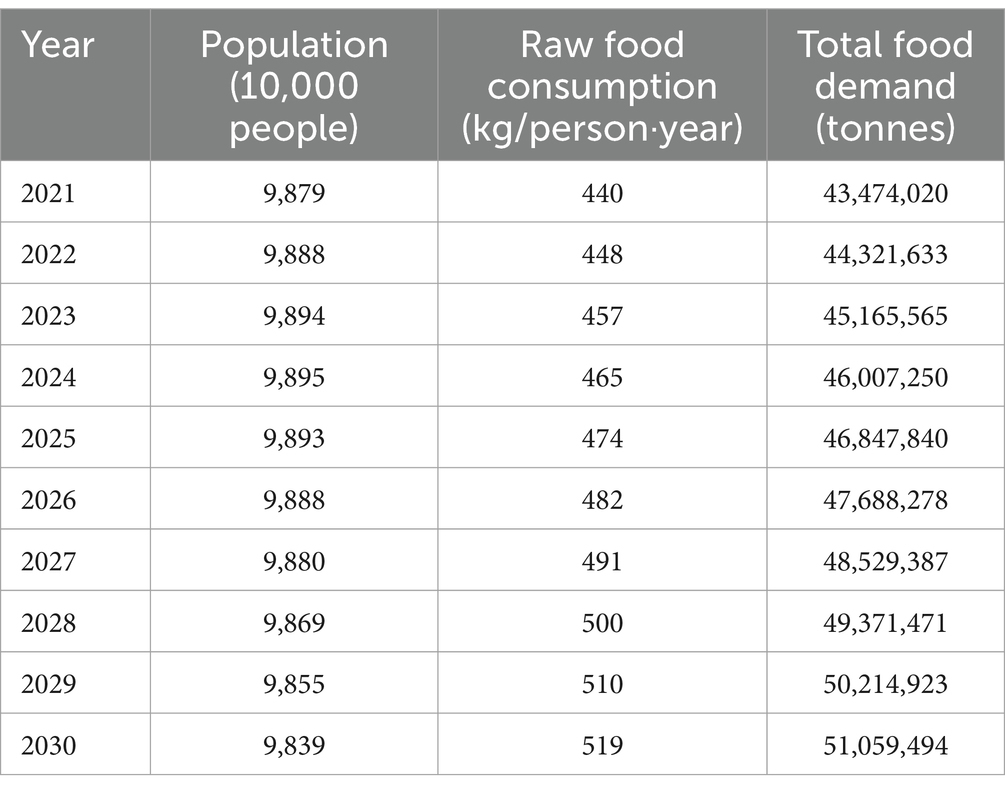
Table 3. Calculation results of future food demand in Henan province.
4 Optimization of food crop planting structure in Henan province
4.1 The optimization scheme of food planting structure
The conditional assumptions during the “15th Five-Year Plan” period are as follows: there is no significant change in regional natural resource endowments in 2020 and 2030; the per mu yield of food crops is consistent with that in 2020, the natural endowments of cities in the province remain stable. The carbon emissions and water requirements per unit area of the same crop are completely consistent. The only variable factor affecting food production is the area of cultivated land. In 2022, Henan’s food self-sufficiency rate was 164.6%. Based on this, it was estimated that Henan’s food self-sufficiency rate will be 150% in 2030, that is, it will need to reach 75 million tons in 2030. In 2022, Henan Province’s food output accounted for about 10% of the country’s total. Based on this, the national food output in 2030 was estimated to be about 750 million tons. This data was basically consistent with Zhang Chen’s calculation of China’s food output of about 730,000 tons in 2030 under various scenarios.
Based on the estimation results of food demand in Henan Province during the “15th Five-Year Plan” period, the conventional production increase scheme 1 was formed by increasing the production in proportion to the whole region. The scheme was only oriented to food demand, and did not take into account the differences in resource consumption of food production in different regions. The food crop planting areas in each region will increase by 13.08%. The optimal yield increase scheme 2 was formed based on the results of regional food production advantage zoning. The scheme comprehensively considered the consumption of food production resources from the perspective of water-energy resources constraints. The new demand during the “15th Five-Year” period will be divided into overall planning. According to the resource advantages of food crop production in different regions, targeted yield increase was carried out. The specific yield increase of scheme 2 is as follows: due to the obvious relative disadvantage of Xinyang City with the largest rice yield, there is no obvious yield increase area; the core areas of wheat yield increase are Xinxiang City, Anyang City, Xuchang City and six other 6 regions. The core areas of maize yield increase are Zhumadian City, Xuchang City, Puyang City and six other 6 regions. The core areas of increasing production of legumes are Shangqiu City, Puyang City, Zhumadian City and seven other 7 regions (Table 4).
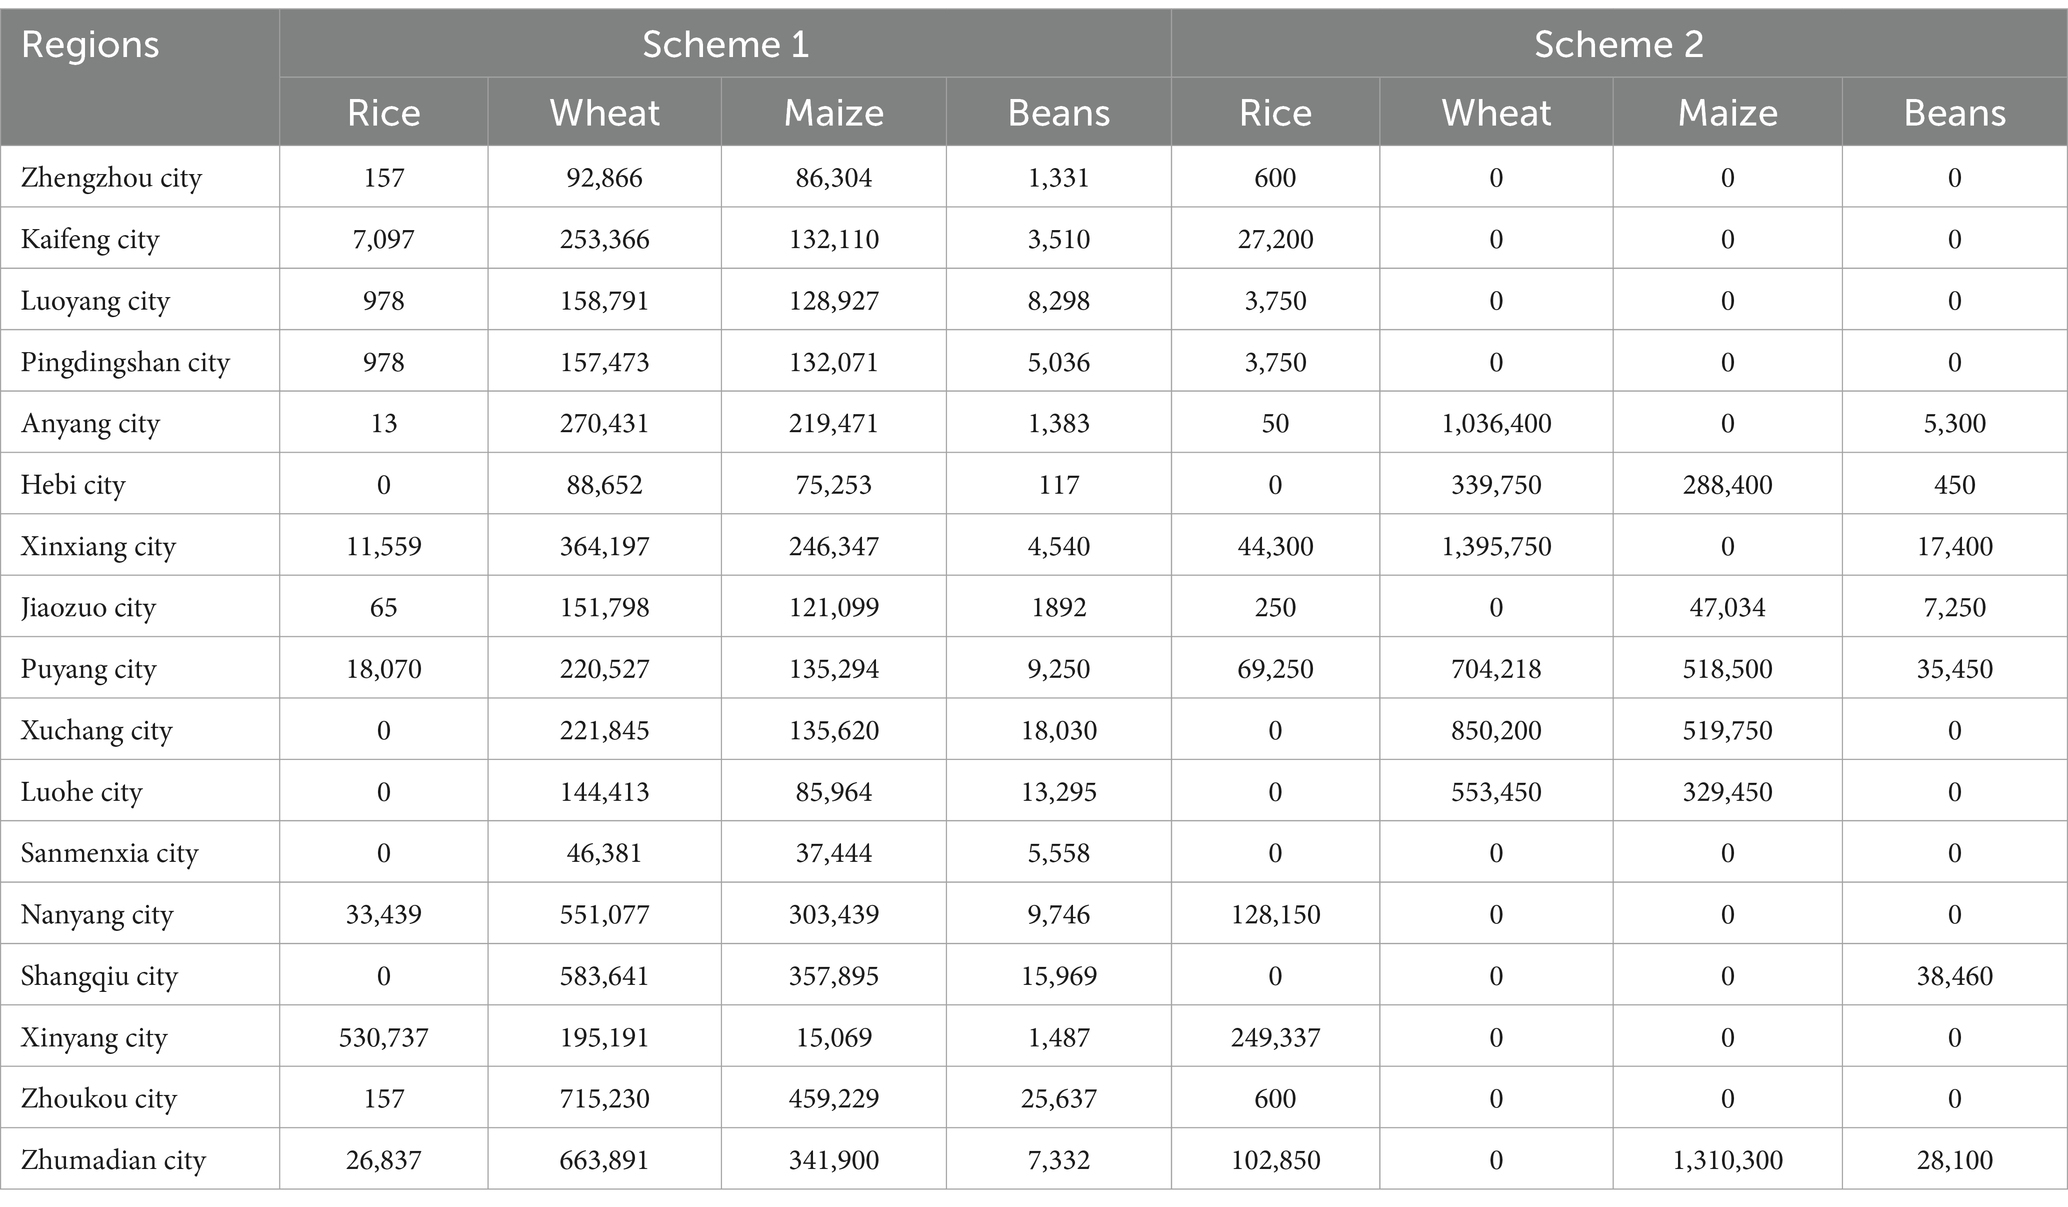
Table 4. Yield increase in different schemes (tons).
4.2 The “water-energy” resources matching scheme for food yield increase
According to the food yield increase of Scheme 1 and Scheme 2 in 4.1, the carbon emission calculation method (Equation 4) and crop water demand calculation method (Equations 5, 6) of food production were used to calculate the difference of “water-energy” resources consumption in Henan Province under different yield increase methods during the “15th Five-Year Plan” period. The results showed that compared with Scheme 1, the resource consumption of Scheme 2 was significantly reduced, and the carbon emission caused by the demand for food production was reduced by 17.90% (Table 5). The water consumption was reduced by 23.32%. From the municipal level, the carbon emissions and water consumption of 10 cities such as Zhengzhou City, Kaifeng City, and Luoyang City have decreased by more than 70%. The increase of carbon emission and water consumption in Anyang, Hebi, and Jiaozuo ranged from 100 to 300%. The increase of carbon emissions in Zhumadian was obvious, which was 46.49%, and the water consumption did not change significantly. By optimizing the food yield increase plan of various cities in Henan Province, based on ensuring the steady increase of food yield in the province, the potential hidden danger of food security caused by the “water-energy” resources crunch during the “15th Five-Year Plan” period was reduced. It has effectively reduced the carbon emissions and water consumption in Henan Province. It provided a reference and basis for the effective layout of regional food production and the sustainable management of the “water-energy” resources.
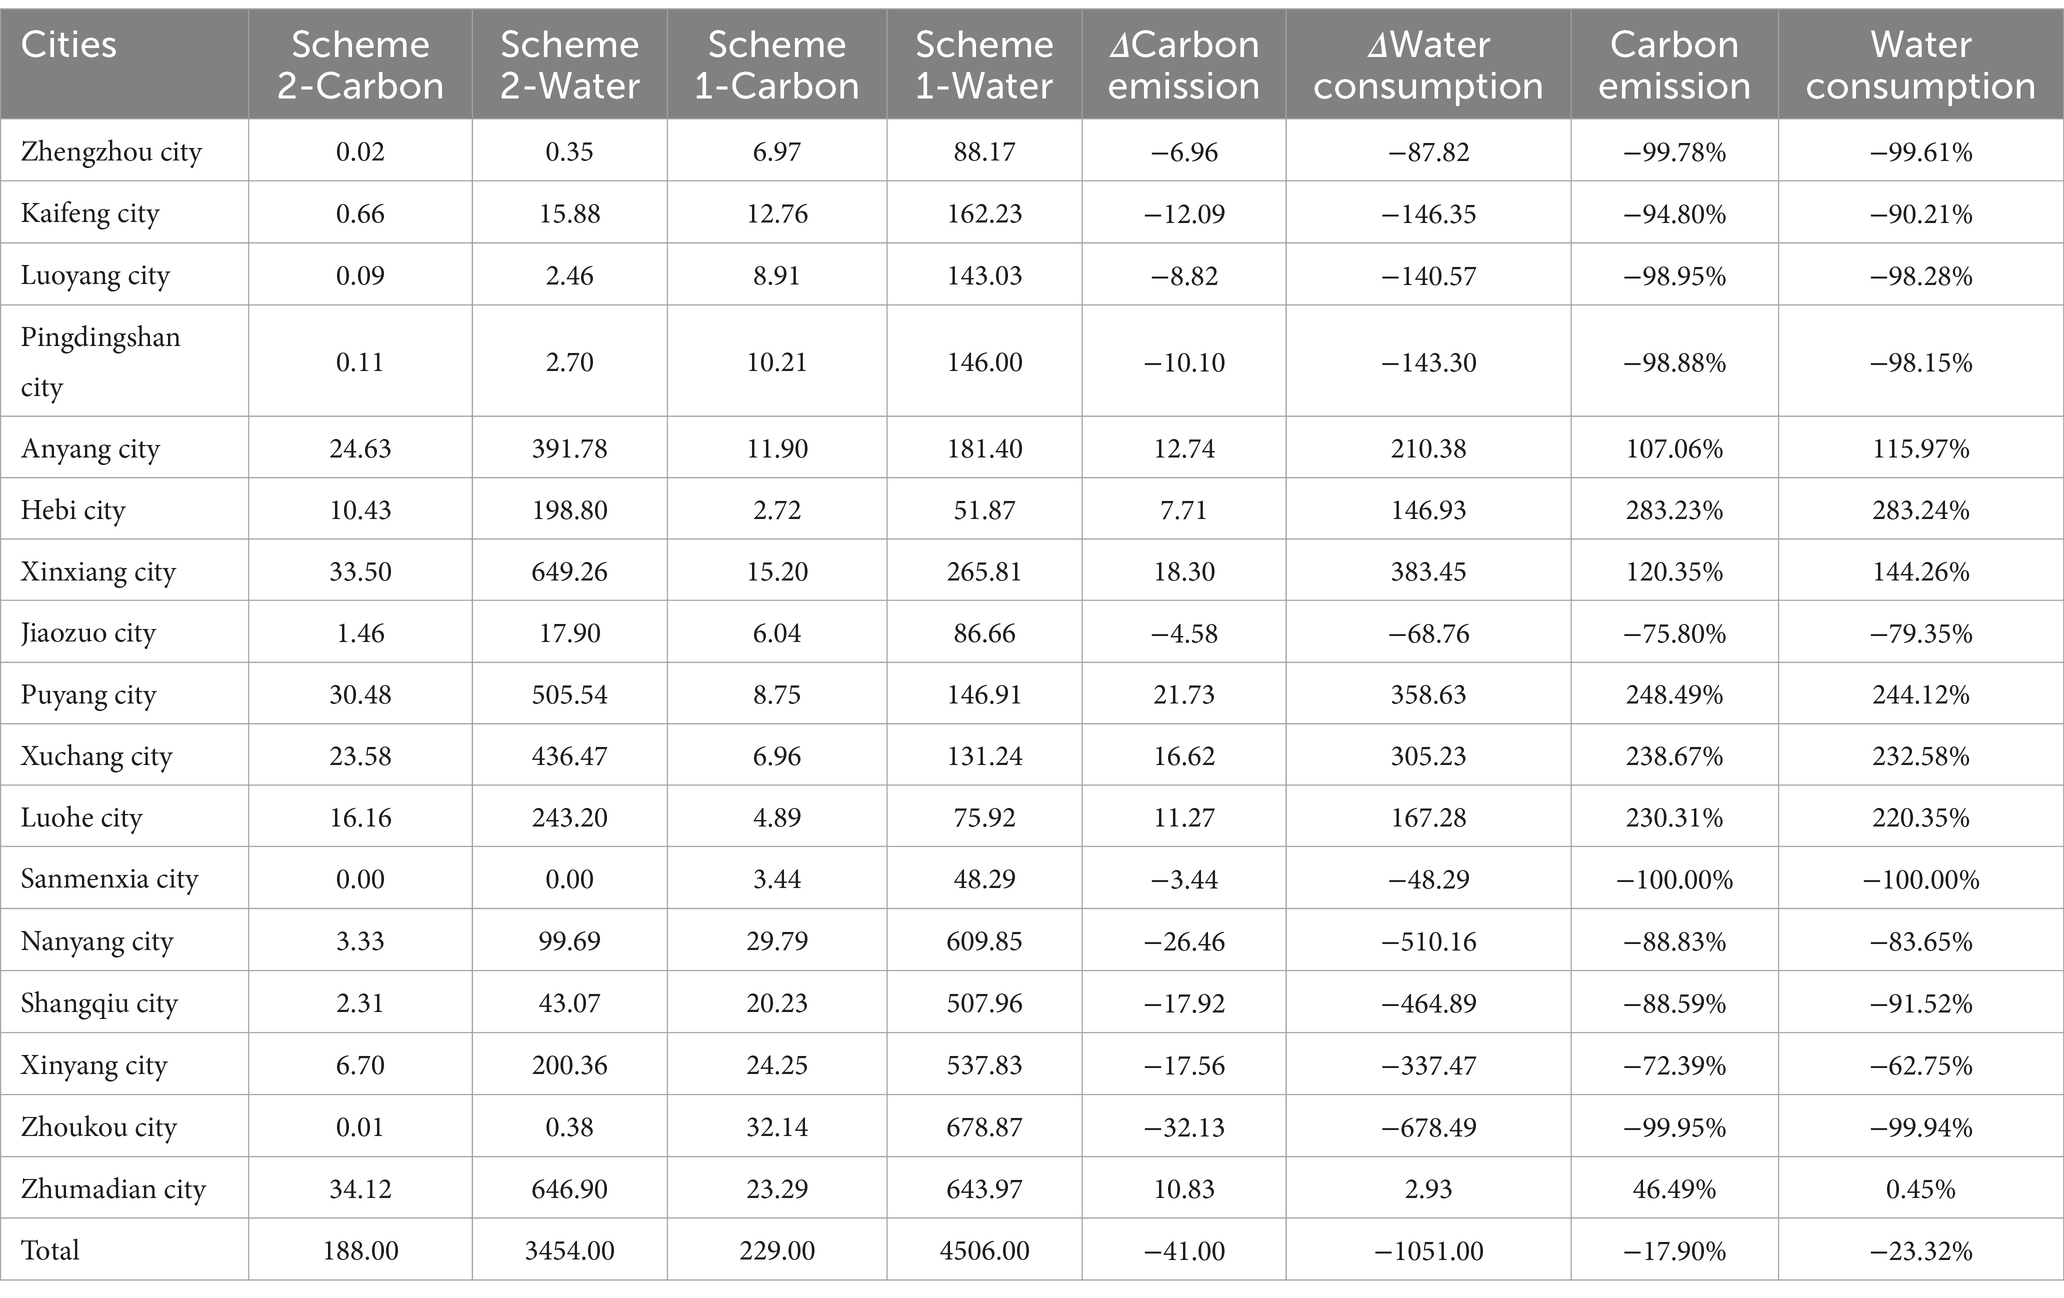
Table 5. Based on the perspective of “water-energy” resources constraints, the resource consumption difference table of food yield increase scheme (10,000 tons).
5 Discussion
This study designed a targeted quantitative method. From the perspective of resource constraints, the matching scheme of hydropower resources for increasing food yield in Henan Province during the “15th Five-Year Plan” period was studied. It has a certain reference value for the development of research and policy formulation in related fields. The marginal contribution and shortcomings of this study are further discussed here.
1. Based on the research theory, the author has analyzed the relationship of “water-energy-food” from the link relationship of “water-energy-food” in the early stage. The theory of China’s food security guarantee based on the “water-energy-food” correlation was put forward. On this basis, this study further analyzed the relationship between “water-energy-food.” The complex relationship between the three was further simplified as water (water consumption) and energy (carbon emission) constraints in the process of food production. It simplified the difficulty of quantitative model construction. It was in line with the real situation of the potential risk of food security in China. It was also helpful to further enrich the research paradigm of the “water-energy-food” link system and provided new methods and ideas for food security research from the perspective of resources.
2. In the design of the study model, the study tried to construct a highly targeted research model. It reduced the amount of redundant calculations while strengthening the correspondence between the problems and the model. In the population estimation, the study selected the cohort factor method to carry out the population measurement of Henan Province during the “15th Five-Year Plan” period. The model has the advantages of universality and operability, but there are still some differences with the reality. For example, only natural population changes were considered, and the population siphon effect of the central city on the surrounding cities was not included in the calculation. In the estimation of food demand, the average consumption level of the current national residents was used as the benchmark data. Factors such as regional dietary differences, different age groups, different age structures, and differences in food demand for different gender ratios have not been included in the accounting of food demand.
3. In the construction of the yield increase scheme, to reduce the difficulty of calculation, the change of cultivated land area was only used as the only influencing factor of yield change. But in reality, it is clear that there are more worthy of in-depth exploration and a combination of yield increase programs. Relevant studies have pointed out that high-standard farmland construction (Yan, 2023), agricultural fixed investment (Oditi, 2023), and agricultural modernization (He and Chen, 2021) can all increase food production.
4. Whether it is reasonable to maintain a 50% increase in regional food output within 10 years in the “15th Five-Year” condition hypothesis of the yield increase scheme. For this core attribute setting, the study made a simple estimate, only 4.14% annual growth can be achieved. Referring to relevant research, it was pointed out that a variety of ways to increase food production, including high-standard farmland construction, can directly increase food production by 8.3%. For every 1% increase in the level of agricultural mechanization, the yield of main food increased by 1.219%. It is not difficult to achieve the growth target in the advantageous areas of food production, so the goal of increasing regional food production by 50% from 2020 to 2030 has a certain rationality and reality.
5. This study is a research with strong practical value. The obtained scheme 2 is actually the optimization proposal for the future food planting structure in Henan Province under the condition of water-energy resources constraints. However, from a practical point of view, this optimization scheme is still too ideal, and there are still some practical defects. One of the most important is how to make the production area accept the occupation of local land for food production. This kind of behavior has certain obstacles to local economic development. The study believes that the compulsory promotion of administrative means can achieve the goal of increasing production, but it will hit the enthusiasm of the production-increasing areas. The interest compensation mechanism of food production is an ideal and practical method to respond to the problem. The construction of the interest compensation mechanism needs to be considered from many aspects, including the main body of policy coordination, compensation methods, compensation standards, compensation objects and supervision methods. It is a research to be further explored. Considering the complexity of the research, this study only mentioned that no more detailed policy recommendations were made in the discussion. It is also hoped that this study can provide thinking and inspiration for scholars in related fields in the exploration of interest compensation mechanism.
6 Conclusion
1. At present, the advantageous areas of food production in Henan Province are distributed around the two cores of “Anyang-Xinxiang” and “Zhumadian.” Specifically, the high-level area of rice production capacity is only in Zhumadian City. The dominant areas of wheat production capacity are concentrated in northern Henan. The dominant areas of corn production capacity show a scattered distribution trend. The dominant areas of bean production capacity are concentrated in Zhumadian City in northern Henan and central Henan. Secondly, the main carbon source of food production in Henan Province was agricultural materials. The carbon emission per unit area of food crops in the region is significantly different. Specifically, the cumulative carbon emission of agricultural materials was 13,076,000 tons, accounting for 74.67% of the total carbon emission. The carbon emission of Xinyang City was the first in the whole province, with 2,262 kg of carbon emission per hectare of food crops, exceeding 36.87% of the average level of the entire province. Zhengzhou was the second, the carbon emission of food crops per hectare was 1929 kg, which was also much higher than the average level. The carbon emission per hectare of food crops in Hebi City and Xuchang City was <1,300 kg.
2. The total population of Henan Province shows a trend of rising first and then falling. The peak of population appears between 2024 and 2025. The per capita demand for rations is increasing, and the total demand for food is increasing. By 2030, the total demand for food in Henan Province is expected to reach 51,059,494 tons.
3. In scheme 1, the yield of the areas with crop planting increased by 13.08%. The planting structure was stable. In scheme 2, there was no obvious yield-increasing area for rice. The core areas of wheat yield increase were Xinxiang City, Anyang City, Xuchang City, and other 6 regions. The core areas of maize yield increase were Zhumadian City, Xuchang City, Puyang City, and the other 6 regions. The core areas of increasing production of legumes were Shangqiu City, Puyang City, Zhumadian City, and the other 7 regions. The planting structure of each city was optimized.
4. Compared with Scheme 1, the resource consumption of Scheme 2 was significantly reduced. The carbon emission of yield increase was reduced by 17.90%. The water consumption of yield increase was reduced by 23.32%. From the perspective of prefecture-level cities, the carbon emissions and water consumption of 10 cities such as Zhengzhou, Kaifeng, and Luoyang decreased by more than 70%. The increase of carbon emission and water consumption in Anyang, Hebi, and Jiaozuo ranged from 100 to 300%. The increase of carbon emission in Zhumadian was obvious, which was 46.49%, and the water consumption did not change significantly.
Data availability statement
The raw data supporting the conclusions of this article will be made available by the authors, without undue reservation.
Author contributions
KW: Conceptualization, Data curation, Formal analysis, Funding acquisition, Investigation, Methodology, Project administration, Resources, Supervision, Visualization, Writing – original draft, Writing – review & editing. CL: Conceptualization, Data curation, Formal analysis, Funding acquisition, Investigation, Methodology, Project administration, Resources, Supervision, Visualization, Writing – original draft, Writing – review & editing. ZS: Conceptualization, Data curation, Formal analysis, Funding acquisition, Investigation, Methodology, Project administration, Resources, Supervision, Visualization, Writing – original draft, Writing – review & editing. XG: Conceptualization, Data curation, Formal analysis, Funding acquisition, Investigation, Methodology, Project administration, Resources, Supervision, Visualization, Writing – original draft, Writing – review & editing.
Funding
The author(s) declare that financial support was received for the research and/or publication of this article. This research was funded by Social Science Planning Fund of Liaoning Province, China, grant number L21CJY017, and the project name is “Study on the Path of Food Security Guarantee in Liaoning Province in the 14th Five-Year Plan under the Perspective of Water-Energy-Food Linkage”; Youth Program of Liaoning Provincial Department of Education, grant number LJKQR20222500, and the project name is “New Thinking on the Development of County Agricultural Leading Industry in Liaoning Province from the Perspective of Rural Comprehensive Revitalization”; Shenyang Normal University Project, grant number SYNUXJ2024022, and the project name is “Shenyang Land Financial Dependence Measurement and Influencing Factors Analysis—Based on the Double Difference Method of Empirical Research.”
Conflict of interest
The authors declare that the research was conducted in the absence of any commercial or financial relationships that could be construed as a potential conflict of interest.
Generative AI statement
The authors declare that no Gen AI was used in the creation of this manuscript.
Publisher’s note
All claims expressed in this article are solely those of the authors and do not necessarily represent those of their affiliated organizations, or those of the publisher, the editors and the reviewers. Any product that may be evaluated in this article, or claim that may be made by its manufacturer, is not guaranteed or endorsed by the publisher.
References
An, H., Cheng, C., An, M., Tang, F., and Dong, X. H. (2024). Study on agricultural water footprint and its economic value in Henan Province. China's Agricultural Res.Regionalization 11, 1–12. doi: 10.7621/cjarrp.1005-9121.20241101
Beckford, C. L., and Campbell, D. R. (2013). “Food imports, domestic production, and food security in the Caribbean” in Domestic food production and food security in the Caribbean. eds. C. Beckford and D. Campbell (New York, NY: Palgrave Macmillan), 183–195.
Chen, Y., and Nie, F. (2016). “Analysis of China’s food supply and demand balance and food security” in Food security and industrial clustering in Northeast Asia. eds. L. Kiminami and T. Nakamura (Tokyo: Springer), 47–59.
Chen, C. L., and Ron, D. C. (2008). Agriculture and food security in China: What effect WTO accession and regional trade arrangements? Canberra, ACT: ANU Press.
Dong, Y., and Mu, Y. Y. (2014). The change of food production efficiency and its influencing factors in China-sAnalysis from the perspective of energy. J. Northwest A&F Univ. 14, 103–111. doi: 10.13968/j.cnki.1009-9107.2014.06.043
Elahi, E., Zhu, M., Khalid, Z., and Wei, K. Z. (2024). An empirical analysis of carbon emission efficiency in food production across the Yangtze River basin: Towards sustainable agricultural development and carbon neutrality. J. Agricultural Systems. 218:103994. doi: 10.1016/j.agsy.2024.103994
Endo, A., Tsurita, I., Kimberly, B., and Pedcris, M. O. (2017). A review of the current state of research on the water, energy, and food nexus. J. Hydrol. Reg. Stu. 11, 20–30. doi: 10.1016/j.ejrh.2015.11.010
Feng, K. S., Hubacek, K., Pfister, S., Yu, Y., and Sun, L. (2014). Virtual scarce water in China. Environ. Sci. Technol. 48, 7704–7713. doi: 10.1021/es500502q
Han, X., Wei, Z., Zhang, B. Z., Han, C. Y., and Song, J. Z. (2018). Effects of crop planting structure adjustment on water use efficiency in the irrigation area of Hei River basin. Water 10:1305. doi: 10.3390/w10101305
Harper, M., Shepon, A., Ohad, N., and Berry, E. M. (2019). The challenges of sustainable food systems where food security meets sustainability - what are countries doing? CABI 12, 22–31. doi: 10.1079/9781786392848.0022
He, Y., and Chen, W. K. (2021). “Study on the relationship between food security and agricultural modernization based on BP neural network,” in 2021 IEEE International Conference on Advances in Electrical Engineering and Computer applications (AEECA), Dalian, China, 834–840.
Hendriks, S. L., and Babu, S. C. (2024). “Chapter 3: what is food security?” in Handbook on public policy and food security. eds. S. L. Hendriks and S. C. Babu (Cheltenham, UK: Edward Elgar Publishing), 24–30.
Hussain, M. A., Li, L., Kalu, A., Wu, X., and Naumovski, N. (2025). Sustainable food security and nutritional challenges. Sustain. For. 17:874. doi: 10.3390/su17030874
IRENA and FAO (2021). Renewable energy for Agri-food systems – towards the sustainable development goals and the Paris agreement. IRENA and FAO: Abu Dhabi and Rome.
Liang, Y., Li, H., Liang, S., Yeboah, F. K., and Yang, Z. (2024). Food demand-driven scarce water use amplified by pollution in China. Earth's. Future 12:e2023EF004052. doi: 10.1029/2023EF004052
Liao, X., Chai, L., Jiang, Y., Ji, J., and Zhao, X. (2019). Inter-provincial electricity transmissions’ co-benefit of national water savings in China. J. Clean. Prod. 229, 350–357. doi: 10.1016/j.jclepro.2019.05.001
Liu, Y., Zhao, H., Zhao, G., Zhang, X., and Xiu, A. (2024). Carbon emission characteristics of cropland in Northeast China and monitoring means. Agriculture 14:379. doi: 10.3390/agriculture14030379
Long, F., and Zeng, F. S. (2008). Strategic objectives and mode selection of food security in China. Agricultural Econ. Issues 11, 32–38.
Min, J. S., and Hu, H. (2012). Estimation of greenhouse gas emissions from agricultural production in China. China's Population Resources Environ. 22, 21–27. doi: 10.3969/j.issn.1002-2104.2012.07.004
Oditi, J. (2023). Agricultural investment and food security. J. Poverty Invest. Dev. 8:2088. doi: 10.47604/jpid.2088
OECD (2012). OECD environmental outlook to 2050: The consequences of inaction. Paris: OECD Publishing.
Shi, Y. L., and Ma, J. S. (2025). Carbon emission accounting and LMDI factor analysis of fossil energy in Henan Province. Front. Bus. Econ. Manage. 18, 162–169. doi: 10.54097/df58c541
Simionesei, L., Ramos, T. B., Palma, J., Oliveira, A. R., and Neves, R. (2020). Irrigasys: a web-based irrigation decision support system based on open source data and technology. Comput. Electron. Agric. 178:105822. doi: 10.1016/j.compag.2020.105822
Tian, Y., and Yin, M. H. (2022). Recalculation of China's agricultural carbon emissions: basic status, dynamic evolution, and spatial spillover effects. China's Rural Econ. 3, 104–127.
Tian, Y., Zhang, J. B., Yin, C. J., and Wu, X. R. (2014). The distribution dynamics and trend evolution of agricultural carbon emissions in China—based on the panel data analysis of 31 provinces (municipalities and autonomous regions) from 2002 to 2011. China's Population Res. Environ. 13, 206–214. doi: 10.1080/10042857.2015.1057439
Wang, J. X., Li, Y. R., Li, J. K., Yan, T. T., and Sun, T. H. (2017). Growing water scarcity, food security and government responses in China. Global Food Secur. 14, 9–17. doi: 10.1016/j.gfs.2017.01.003
Xie, G. D., Cheng, S. K., Xiao, Y., Lu, C. X., Liu, X. J., and Xu, J. (2017). The balance between food supply and demand and the reconstruction of China’s food security strategy in the new period. J. Nat. Resour. 32, 895–903. doi: 10.11849/zrzyxb.20170110
Yan, X. (2023). The impact of high standard farmland construction projects on the improvement of farmland quality and food production capacity. Front. Sust. Dev. 3, 1–6. doi: 10.54691/fsd.v3i6.5122
Yu, B., and Lu, C. (2006). Change of cultivated land and its implications on food security in China. Chin. Geogr. Sci. 16, 299–305. doi: 10.1007/s11769-006-0299-4
Zhang, Z. B., and Xu, P. (2008). Water and food security in China. Chin. J. Eco-Agric. 16, 1305–1310. doi: 10.3724/SP.J.1011.2008.01305
Zhang, L. J., Yin, X. A., Xu, Z. H., Zhi, Y., and Yang, Z. F. (2016). Crop planting structure optimization for water scarcity alleviation in China. J. Ind. Ecol. 20, 435–445. doi: 10.1111/jiec.12447
Keywords: food security, the “15th Five-Year Plan” period, resource matching, water-energy resources constraints, Henan province
Citation: Wei K, Lou C, Sun Z and Guan X (2025) Research on optimizing the planting structure of food crops from the perspective of water-energy resources constraints—evidence from Henan province toward the “15th Five-Year Plan” period. Front. Sustain. Food Syst. 9:1575631. doi: 10.3389/fsufs.2025.1575631
Edited by:
Niaz Ali, Hazara University, PakistanReviewed by:
Waqas Shafqat Chattha, University of Agriculture, Faisalabad, PakistanJiang Wenlai, Chinese Academy of Agricultural Sciences (CAAS), China
Copyright © 2025 Wei, Lou, Sun and Guan. This is an open-access article distributed under the terms of the Creative Commons Attribution License (CC BY). The use, distribution or reproduction in other forums is permitted, provided the original author(s) and the copyright owner(s) are credited and that the original publication in this journal is cited, in accordance with accepted academic practice. No use, distribution or reproduction is permitted which does not comply with these terms.
*Correspondence: Xin Guan, Nzg1NTk3MzA3QHFxLmNvbQ==