 Yunus Musa1Rusnadi Padjung1Nasaruddin Nasaruddin1
 Muh Farid1Andang Suryana Soma2
 Achmad Kautsar Baharuddin3Muh. Fikri Al Qautzar3Resky Maulidina Fakhri3
 Madonna Casimero4Amin Nur5,6
 Mahmoud F. Seleiman7
 Majed Alotaibi7
 Nawab Ali8
 Muhammad Fuad Anshori1*
- 1Department of Agronomy, Hasanuddin University, Makassar, Indonesia
- 2Forestry Study Program, Department of Forestry, Faculty of Forestry, Hasanuddin University, Makassar, Indonesia
- 3Agrotechnology Study Program, Hasanuddin University, Makassar, Indonesia
- 4International Rice Research Institute, University of the Philippines Los Baños, Los Baños, Philippines
- 5Indonesian Cereal Testing Instrument Standard Institute, Maros, South Sulawesi, Indonesia
- 6Food Crops, Horticulture, Plantation and Food Security Office of Soppeng, Soppeng, Indonesia
- 7Department of Plant Production, College of Food and Agriculture Sciences, King Saud University, Riyadh, Saudi Arabia
- 8Department of Biosystems and Agricultural Engineering (BAE), College of Agriculture and Natural Resources, Michigan State University, East Lansing, MI, United States
Early maturing rice varieties are crucial for climate-resilient agriculture, yet nitrogen optimization in these varieties remains under-explored. Most existing studies focus on conventional varieties and lack an integrated approach combining agronomic traits, remote sensing, and statistical modeling. The objective of this study was to determine evaluation criteria and develop a model to predict the productivity of short-season rice varieties. Experiments were conducted in different seasons at two locations in Sidenreng Rappang and Maros, South Sulawesi, using a nested split-plot design with three replicates. The main plots consisted of five nitrogen levels, while the subplots included five early maturing rice varieties and two moderate age as control. Key findings of this study is that the stepwise regression model combining NDVI and yield per clump showed strong performance, with R2 = 0.65/0.73, RMSE = 0.65/0.61, and MAPE = 9.72%/10.81% for training/testing, respectively. This regression model effectively evaluates how rice growth responds to varying nitrogen fertilizer doses, particularly in early-maturing varieties. Therefore, it can be reliably used to predict the future yield of these varieties.
1 Introduction
Rice is a crucial cereal crop, alongside wheat and maize, and serves as a primary food source for more than 50% of the global population, particularly in Asia, where it is a dietary staple (Ashraf et al., 2024). The importance of rice is further emphasized by the fact that the five leading rice-producing countries are all located in Asia, including the three most populous nations (Schneider and Asch, 2020). This underscores the vital role that rice plays in ensuring global food security (Jamal et al., 2023). However, rice production is facing substantial challenges due to population growth and climate change (Hashim et al., 2024), which have contributed to a decline in optimal agricultural land (Nazir et al., 2024). These factors threaten food availability worldwide. Consequently, countries—especially in Asia—actively pursue initiatives to enhance food security and sovereignty through intensified rice production efforts. The development of rice intensification in response to climate change can be achieved by selecting appropriate varieties and fertilization technologies. Variety selection plays a crucial role in optimizing genetic potential during the cultivation process (Zhang J. et al., 2024). Generally, the choice of varieties and quality seeds can determine production potential by as much as 45–60%, making variety selection one of the key aspects of rice cultivation (Musa et al., 2023). This is particularly important when crops are intended to adapt to dynamic climate changes (Li et al., 2024).
Climate change can negatively impact rice growth and production, so selecting well-suited varieties is essential (Bacelar et al., 2024). One approach to variety development in response to climate change, especially concerning rainfall patterns, is to create early maturing rice varieties (Musa et al., 2023; Anshori et al., 2024b). Early maturing varieties have a shorter lifespan, which helps plants avoid significant stress due to unpredictable rain patterns (Rezvi et al., 2023). This concept has been supported by several studies, which have focused mainly on rice plants (Musa et al., 2023; Anshori et al., 2024a,b). In Indonesia, several early maturing rice varieties have been developed, including Cakrabuana (Noviana et al., 2021; Musa et al., 2023; Anshori et al., 2024a,b), Inpari 19 (Mu’min et al., 2024), Padjajaran (Musa et al., 2023; Anshori et al., 2024a,b), Inpari 13 (Anshori et al., 2024a,b), and M70D (Sutrisna et al., 2024). Early maturing rice varieties have distinct growth patterns and shorter developmental phases, which can alter nutrient uptake dynamics compared to longer-duration varieties. As a result, standard nitrogen recommendations may not be suitable, and specific optimization strategies are needed to match their accelerated life cycle (Musa et al., 2023; Anshori et al., 2024a,b). This is especially true when comparing moderate aged rice of different types to early maturing varieties. Some moderately aged rice varieties focus on increasing the number of seeds per panicle, resulting in distinct characteristics (Dwiningsih, 2023; Hang et al., 2024). Owing to these differences in growth patterns and fertilization needs, there is a pressing need to develop fertilization technologies to optimize the production of early maturing rice varieties.
The optimization of fertilization technology for early maturing rice can be achieved through several approaches, one of which involves adjusting nitrogen fertilization dosages. Nitrogen is an essential macronutrient for plant growth (Musa et al., 2023). It plays a crucial role in processes such as protein and enzyme formation, cell division, chloroplast development, and various metabolic activities (Jiang et al., 2024). These functions make nitrogen a vital component in supporting rice growth (Shrestha et al., 2020). However, there is an optimal threshold for nitrogen application. If the nitrogen content of a plant is below this threshold, its growth will slow, leading to a decline in productivity (Zhang X. et al., 2024). Conversely, excessive nitrogen can increase the susceptibility of rice plants to disease (Zhang et al., 2022) and increase the risk of cracking (Zhang et al., 2020). This can negatively impact productivity, as excess nitrogen may divert potential assimilates away from productive growth.
Different crops, growth types, and varieties present varying thresholds for nitrogen tolerance (Ding et al., 2021). Thus, understanding the appropriate nitrogen fertilization pattern for early maturing rice is crucial for effective cultivation. Comprehensive studies on the genetic interactions related to nitrogen fertilization are necessary. This research must be conducted systematically and thoroughly. Additionally, the evaluation process should be straightforward to facilitate accurate assessments, making precision patterns essential for analysis. One approach that can be used is the modeling of rice plants. Modeling can be used to predict the characteristics of a complex main character on the basis of a set of secondary characters (Ashraf et al., 2024). This approach is also applicable to crops, where productivity is influenced by various supporting components or independent characteristics (Anshori et al., 2021; Wijayanti et al., 2024). The concept of modeling has been extensively applied in crop evaluation processes, including fertilizer technology (Gao et al., 2023). A key factor in the effectiveness of modeling is the selection of secondary criteria and the development of the model itself (Chakrabarty et al., 2024).
Agronomic criteria are among the most commonly used criteria in crop modeling. Productivity results from an accumulation of various agronomic criteria, making it familiar to use these metrics in modeling (Tang et al., 2024). However, relying solely on agronomic characteristics is often considered inadequate. The incorporation of alternative criteria, such as the vegetation index, can increase the precision and accuracy of models. The vegetation index is a parameter that helps identify the potential performance of plants through color image processing and is applied to both individual plants and populations (Ortiz-Torres et al., 2024). This effectiveness has also been demonstrated in rice (Indriasari et al., 2024). However, these studies focused on conventional rice and were lacking integration with predictive models. In contrast, this study focused on early maturing rice varieties and combined vegetation index obtained from UAVs with agronomic traits and BLUE estimates to develop a reliable yield prediction model across the nitrogen gradient.
The role of the vegetation index in evaluating early maturing rice varieties has not been thoroughly investigated, particularly regarding its interaction with nitrogen fertilization. Additionally, integrating the vegetation index with agronomic criteria has yet to be explored in depth. Therefore, combining agronomic criteria and the vegetation index presents a promising opportunity for modeling the interaction of early maturing rice varieties with nitrogen fertilization doses. The assessment of model effectiveness is closely linked to the process of model development (Fikri et al., 2023a). This involves several statistical techniques, including the best linear unbiased estimator (BLUE) and multivariate analysis. BLUE is a method that optimizes the fixed potential of a factor while minimizing the random influences resulting from variations in a dataset (Croci et al., 2023). This approach is essential for reducing the chances of underestimating or overestimating predictions made by the model (Chan et al., 2022). The application of the BLUE concept in crop evaluation has been documented (Kleinknecht et al., 2013; Alvarado et al., 2020). On the other hand, multivariate analysis serves to partition, reduce, or simplify the variances within large dimensions of data (Abduh et al., 2021). This technique allows for easier identification of key characters that significantly contribute to data diversity concerning a primary character (Fikri et al., 2023b). The use of multivariate analysis has been reported frequently, particularly in rice studies (Farid et al., 2021; Anshori et al., 2024a,b; Nasaruddin et al., 2024). While both BLUE and multivariate analyses hold promise for establishing evaluation criteria, the combined use of these methods has not been extensively reported, especially regarding early maturing rice varieties. Integrating BLUE analysis with multivariate analysis is anticipated to enhance the development of a model that effectively evaluates the responses of early maturing rice varieties to varying nitrogen fertilization doses.
Therefore, this study has two main objectives: (1) to establish evaluation criteria and develop a predictive model for short-season rice productivity using agronomic traits and vegetation indices through BLUE analysis and multivariate analysis, and (2) to compare the effectiveness of these models in capturing the interaction patterns between rice varieties and nitrogen fertilization doses.
2 Materials and methods
2.1 Site description
The research was conducted at two locations during different seasons in Sidenreng Rappang and Maros Regency, South Sulawesi Province, Indonesia (Figure 1). The first environment was in Uluale, Wattang Pulu District, Sidenreng Rappang Regency, 10 m above sea level, with coordinates 03°90,507″S 119°74,614″E. This research was conducted from June to September 2023, with an average rainfall value of 92 mm/day, classified as low. In contrast, the second study was conducted from May to August 2024 at the Experimental Farm of the Agency for Standardization of Agricultural Instruments (BSIP), Allepolea Village, Lau District, Maros Regency, at an altitude of 3 m above sea level, with coordinates of 4°58′55.8″S 119°34′27.9″E. Sidenreng Rappang and Maros Regency were selected to represent contrasting lowland rice agroecosystems in South Sulawesi. Sidenreng Rappang has alluvial soils, moderate fertility, and low rainfall during the dry season (Alfath, 2023; Hidayah et al., 2021). Farmers typically followed conventional practices with locally timed nitrogen application. In contrast, Maros lies near the coast, with higher humidity, silty clay loam soils, and greater rainfall (Safitri et al., 2021; Saleng et al., 2025). Cultivation was more technology-driven, with certified seeds and synchronized planting schedules. These contrasting conditions provided a diverse environmental basis for evaluating varietal responses and model robustness (Li et al., 2016).
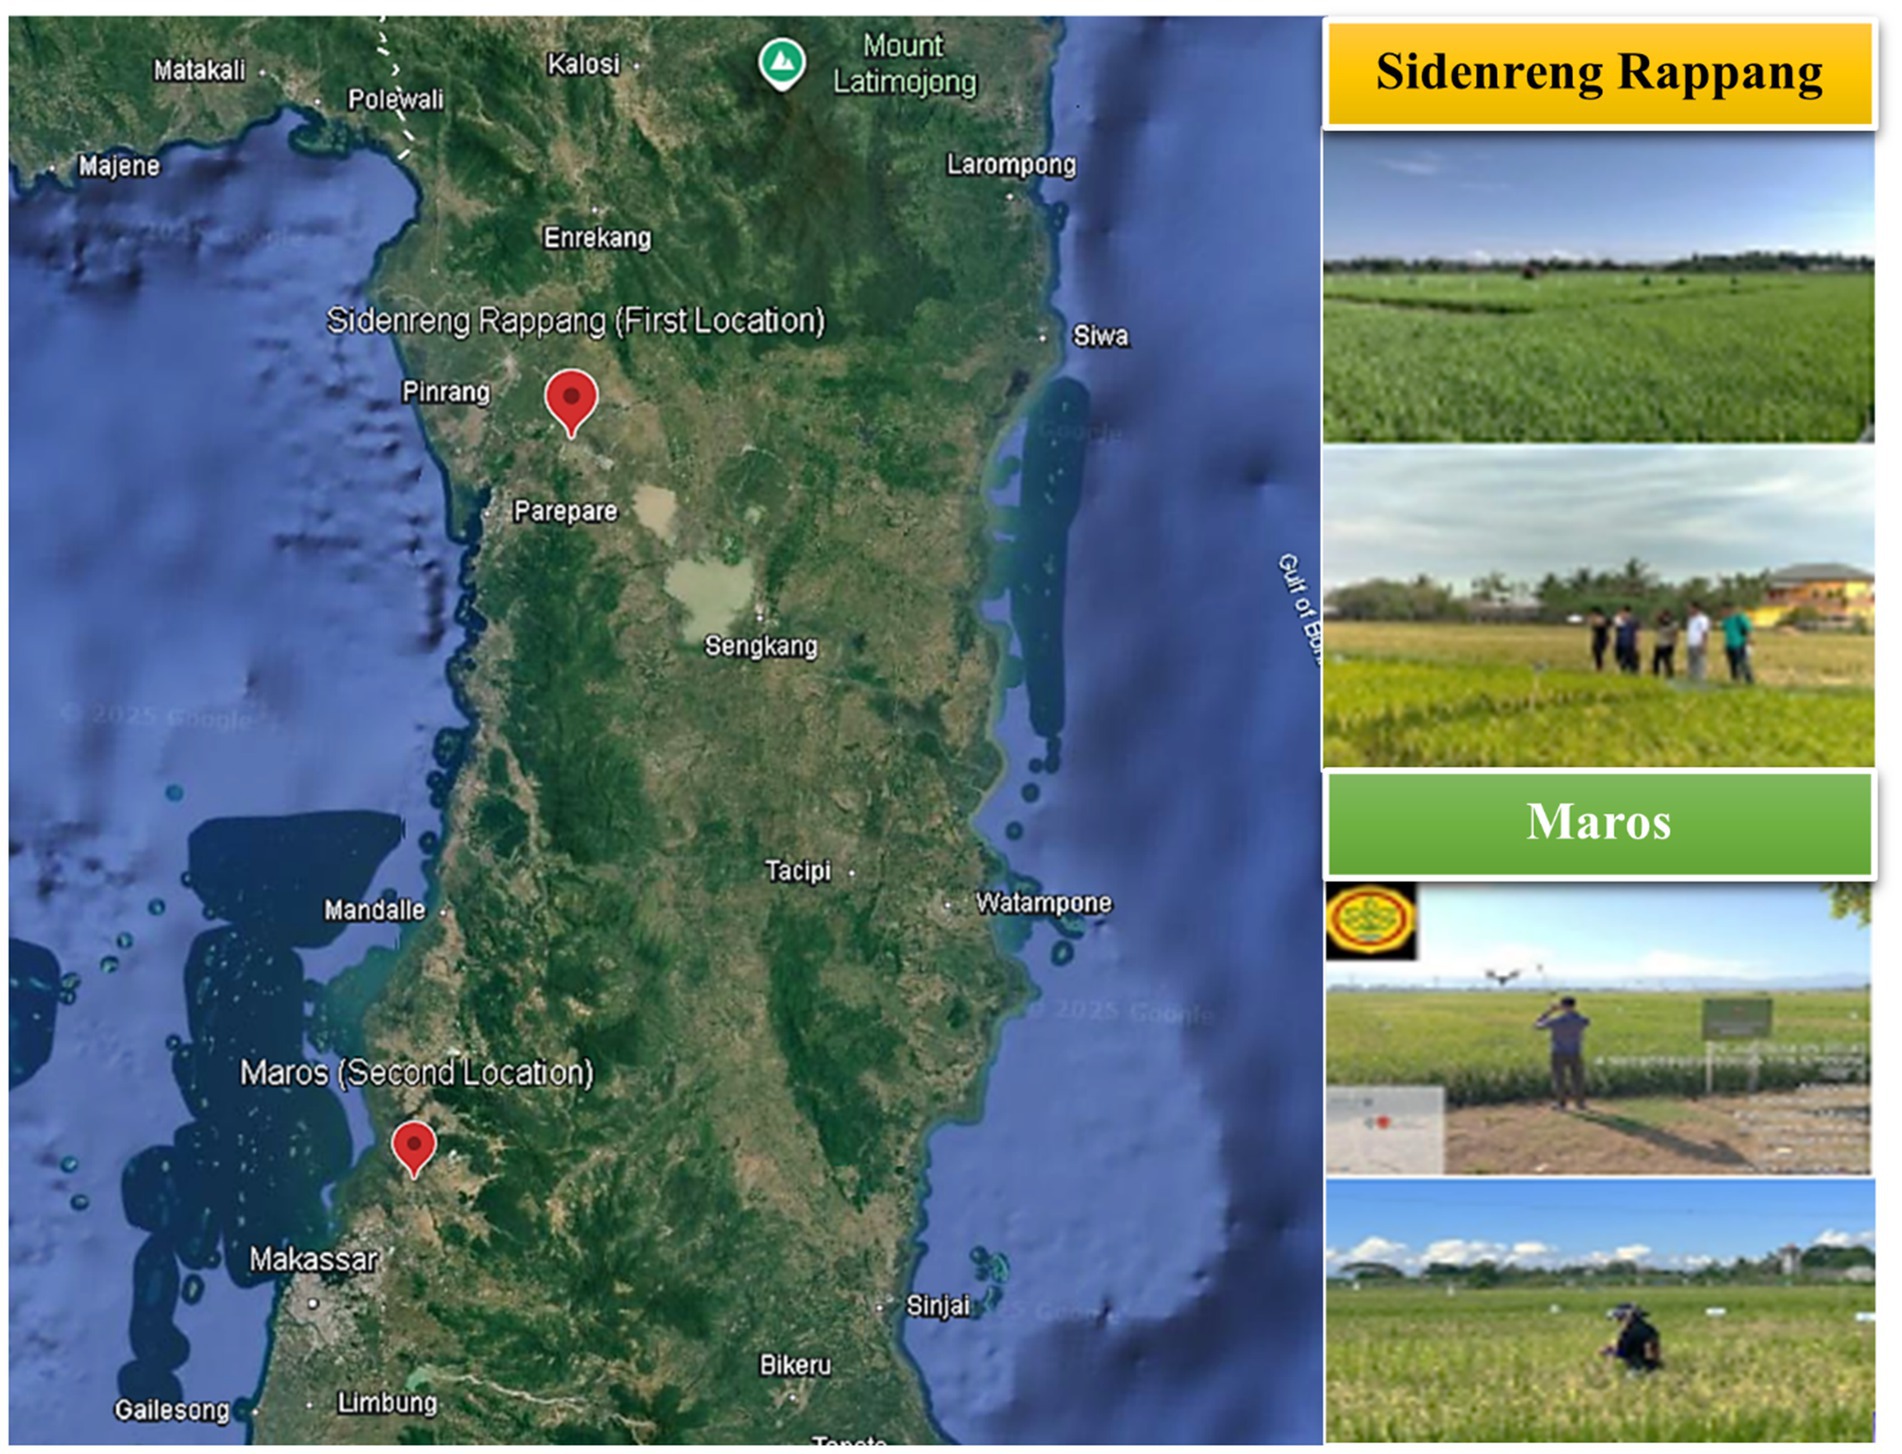
Figure 1. Studies location and condition in South Sulawesi.
2.2 Experimental design
This study was designed with a nested split-plot design, where the replicates were nested in the environment. The main plot at each location consisted of five levels of nitrogen (0, 50, 100, 150, and 200 kg·ha−1). The subplots included seven varieties consisting of five early maturing rice varieties (Cakrabuana, Inpari 13, Inpari 19, Padjajaran Agritan, and M70D) and two as controls (Ciherang and Inpari 32) for moderately maturing rice. Each combination from each location was repeated three times, resulting in 210 experimental units. Each experimental unit had a plot size of 12 m2.
2.3 Plant materials characteristic
2.3.1 Early maturing rice varieties
Cakrabuana is a mutant-derived rice cultivar developed through gamma irradiation of the Inpari 13 variety, utilizing induced mutagenesis to enhance targeted phenotypic traits. Cakrabuana is an early maturing rice variety characterized by a relatively short growth duration of approximately 104 days from planting to harvest, though it may reach maturity in under 100 days under optimal tropical conditions. The plants exhibit an upright growth habit, with an average stature of around 105 cm. Agronomically, Cakrabuana demonstrates high yield potential, producing an average of 7.5 tons·ha−1. Inpari 13, from which Cakrabuana was originally derived, is a high-yielding variety developed through a cross between OM606 and IR18348-36-3-3. It also displays a short growth cycle of about 103 days, and similar to Cakrabuana, may mature earlier under high-temperature tropical conditions. The variety is characterized by a sturdy, slightly rough and upright leaves. Inpari 13 can produce an average yield of 6.59 tons ha−1, with maximum yield potential reaching up to 8 tons ha−1 (Balitbangtan, 2021; Baharuddin et al., 2025).
Inpari 19 and Padjadjaran Agritan are two early maturing rice varieties that have shown promising performance under lowland conditions. Inpari 19, derived from a cross between BP342B-MR-1-3 and BP226E-MR-76, completes its growth cycle in about 104 days. It grows upright with good resistance to lodging and delivers an average yield of 6.7 tons ha−1, with potential production reaching up to 9.5 tons ha−1 in optimal conditions. Meanwhile, Padjadjaran Agritan, which was developed through a hybridization of Inpari 5 and IR66, matures around 105 days after planting and features a moderately erect plant stature. It typically grows to 97 cm and has good standability in the field. Yield potential is slightly higher than Inpari 19, averaging 7.8 tons ha−1 under standard conditions and reaching up to 11 tons ha−1 with improved management (DPKP DIY, 2023).
M70D is a lowland rice variety resulting from the cross between Genjah Rawe Malang and Cempo Banyuwangi. It has an upright growth form and a remarkably short growth cycle, reaching maturity in just 70 days after planting. The variety delivers a strong yield performance, averaging 7.6 tons ha−1, and can achieve up to 9.4 tons ha−1 under favorable conditions. M70D is tolerant to lodging and offers good resistance against brown planthopper and rice tungro virus, making it ideal for intensive, quick-rotation cropping systems. It is best adapted to lowland environments, particularly at elevations ranging from 0 to 300 m above sea level (DPKP DIY, 2023).
2.3.2 Moderately maturing rice varieties
Ciherang is a rice variety developed through a complex cross involving IR18349-53-1-3-1-3/3IR19661-131-3-1-3//4IR64. It has a growth duration ranging from 116 to 125 days after transplanting. The plants exhibit an erect growth habit and are well adapted to both wet and dry seasons, particularly in lowland areas situated below 500 m above sea level. Under optimal conditions, Ciherang typically yields between 5 and 7 tons ha−1 (DPKP DIY, 2023). Inpari 32 is a high-yielding variety derived from a cross between Ciherang and IRBB64. It matures approximately 120 days after direct seeding and produces upright plants with strong structural traits. The average yield of Inpari 32 is around 6.30 tons ha−1, with a maximum potential yield reaching up to 8.42 tons ha−1. This variety is highly suitable for cultivation in lowland paddy fields (DPKP DIY, 2023).
2.4 Crop cultivation and field management procedures
This experiment followed the standard rice cultivation protocol established by the Rice Plant Standardization and Instrumentation Agency. Land preparation included two plowings and flooding. Seeds were soaked for 24 h, then germinated for an additional 24 h, and then planted in seedbeds according to variety. A mixture of ZA and Furadan fertilizers was applied at a rate of 10 g/m2 to the seedbed. Seedlings were transplanted to prepared soil on the 20th day after planting, with a planting distance of 20 × 20 cm, totaling 300 plants per plot. Routine crop management included replanting (within two weeks), mechanical and chemical weed control (glyphosate application at weeks 3 and 6), and irrigation according to growth stage. The vegetative phase followed the alternate wetting and drying (AWD) method, while the generative phase was irrigated weekly until 80% panicle maturity (IRRI, 2016). Fertilization is carried out in three separate applications: 7, 28, and 35 days after planting. Phosphate (P2O5) and potassium were each applied at 100 kg·ha−1, while nitrogen doses vary according to treatment (Table 1). Pest and disease control included molluscicide spraying for snails, plastic barriers for rats, and insecticide and fungicide applications tailored to each plot. Harvesting began when two-thirds of the panicles reached physiological maturity. Manual harvesting, threshing, and packaging were carried out, and agronomic data were collected before and after harvest based on predetermined parameters.
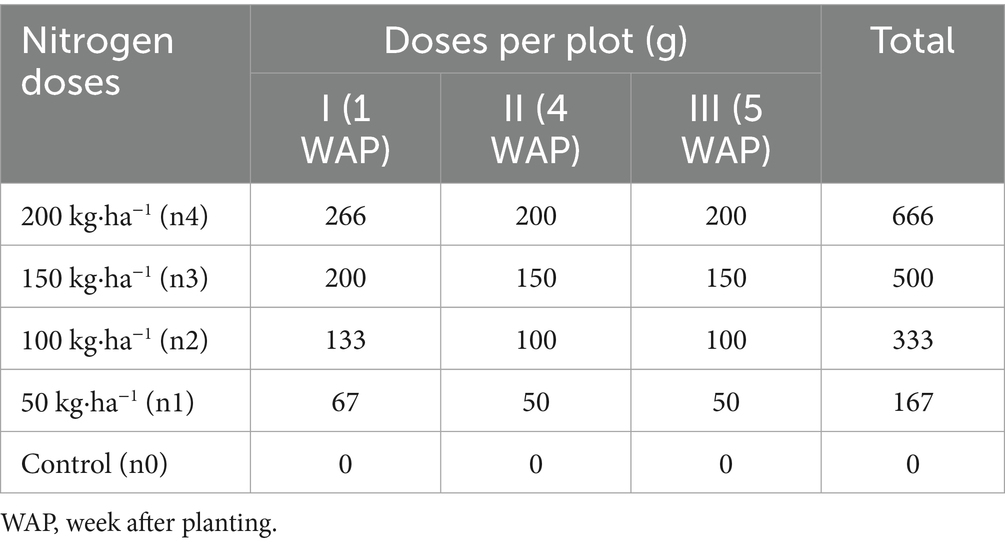
Table 1. Nitrogen application dosage.
2.5 Observation parameters and data analysis
The observed data included agronomic criteria and vegetation indices. The agronomic characteristics measured were plant height (cm), number of tillers (stems), number of productive tillers (stems), flag leaf length (cm), flag leaf width (cm), days to flowering (day after planting (DAP)), days to harvest [day after planting (DAP)], panicle length (cm), number of grains per panicle (grains), percentage of filled grains per panicle (%), panicle density (grains/cm), weight of 100 grains (g), yield per clump (g), and yield per hectare (tons·ha−1). All parameters were observed using 10 plants per plot, except yield per hectare. The vegetation indices observed included the normalized difference vegetation index (NDVI), normalized green and red difference index (NGRDI), and visible atmospherically resistant index (VARI). Technical aspects of vegetation index observations were suited by Fikri et al. (2023a), which were modified.
2.6 Vegetation index measurement
The drone used in this experiment was the DJI P4 Multispectral, equipped with The Phantom 4 Multispectral (P4M) is equipped with a six-camera imaging system, consisting of one RGB camera and a multispectral array of five cameras. Each camera features a 1/2.9-inch CMOS sensor, capturing specific spectral bands including blue (450 ± 16 nm), green (560 ± 16 nm), red (650 ± 16 nm), red edge (730 ± 16 nm), and near-infrared (840 ± 26 nm). Images were captured at a flight altitude of 50 meters above the ground surface. The raw imagery was processed into high-resolution orthomosaics using Agisoft Metashape, which included photogrammetric reconstruction and atmospheric correction. The resulting outputs were georeferenced and exported in GeoTIFF (.tif) format for further analysis. It was then analyzed using ArcGIS Pro software. The ortho-mosaic image was segmented according to the experimental plot plan. To evaluate vegetation characteristics from drone-acquired imagery, three vegetation indices were computed using reflectance data from specific spectral bands. These bands were extracted from the multispectral or RGB images after pre-processing. After that, the segmentation results were analyzed according to the expected vegetation index (Table 2). A general view of the vegetation index analysis is shown in Figure 2.
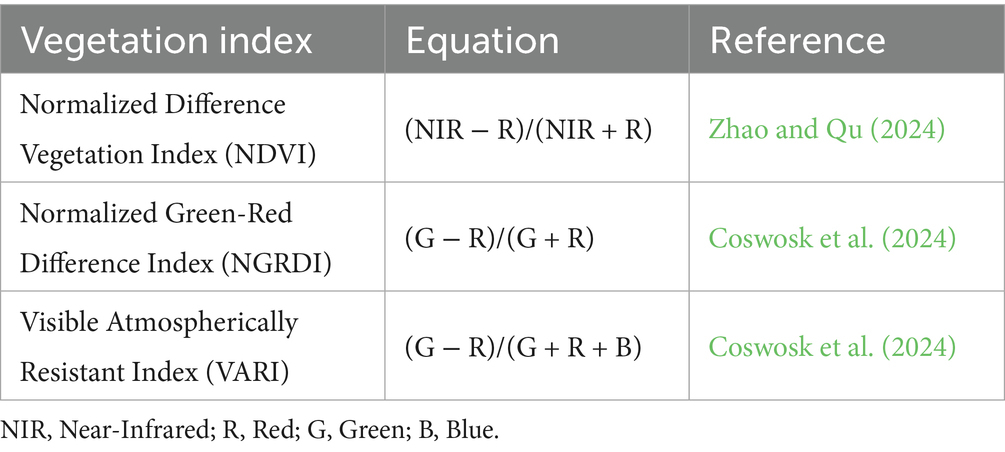
Table 2. Vegetation indices applied in multispectral image analysis.
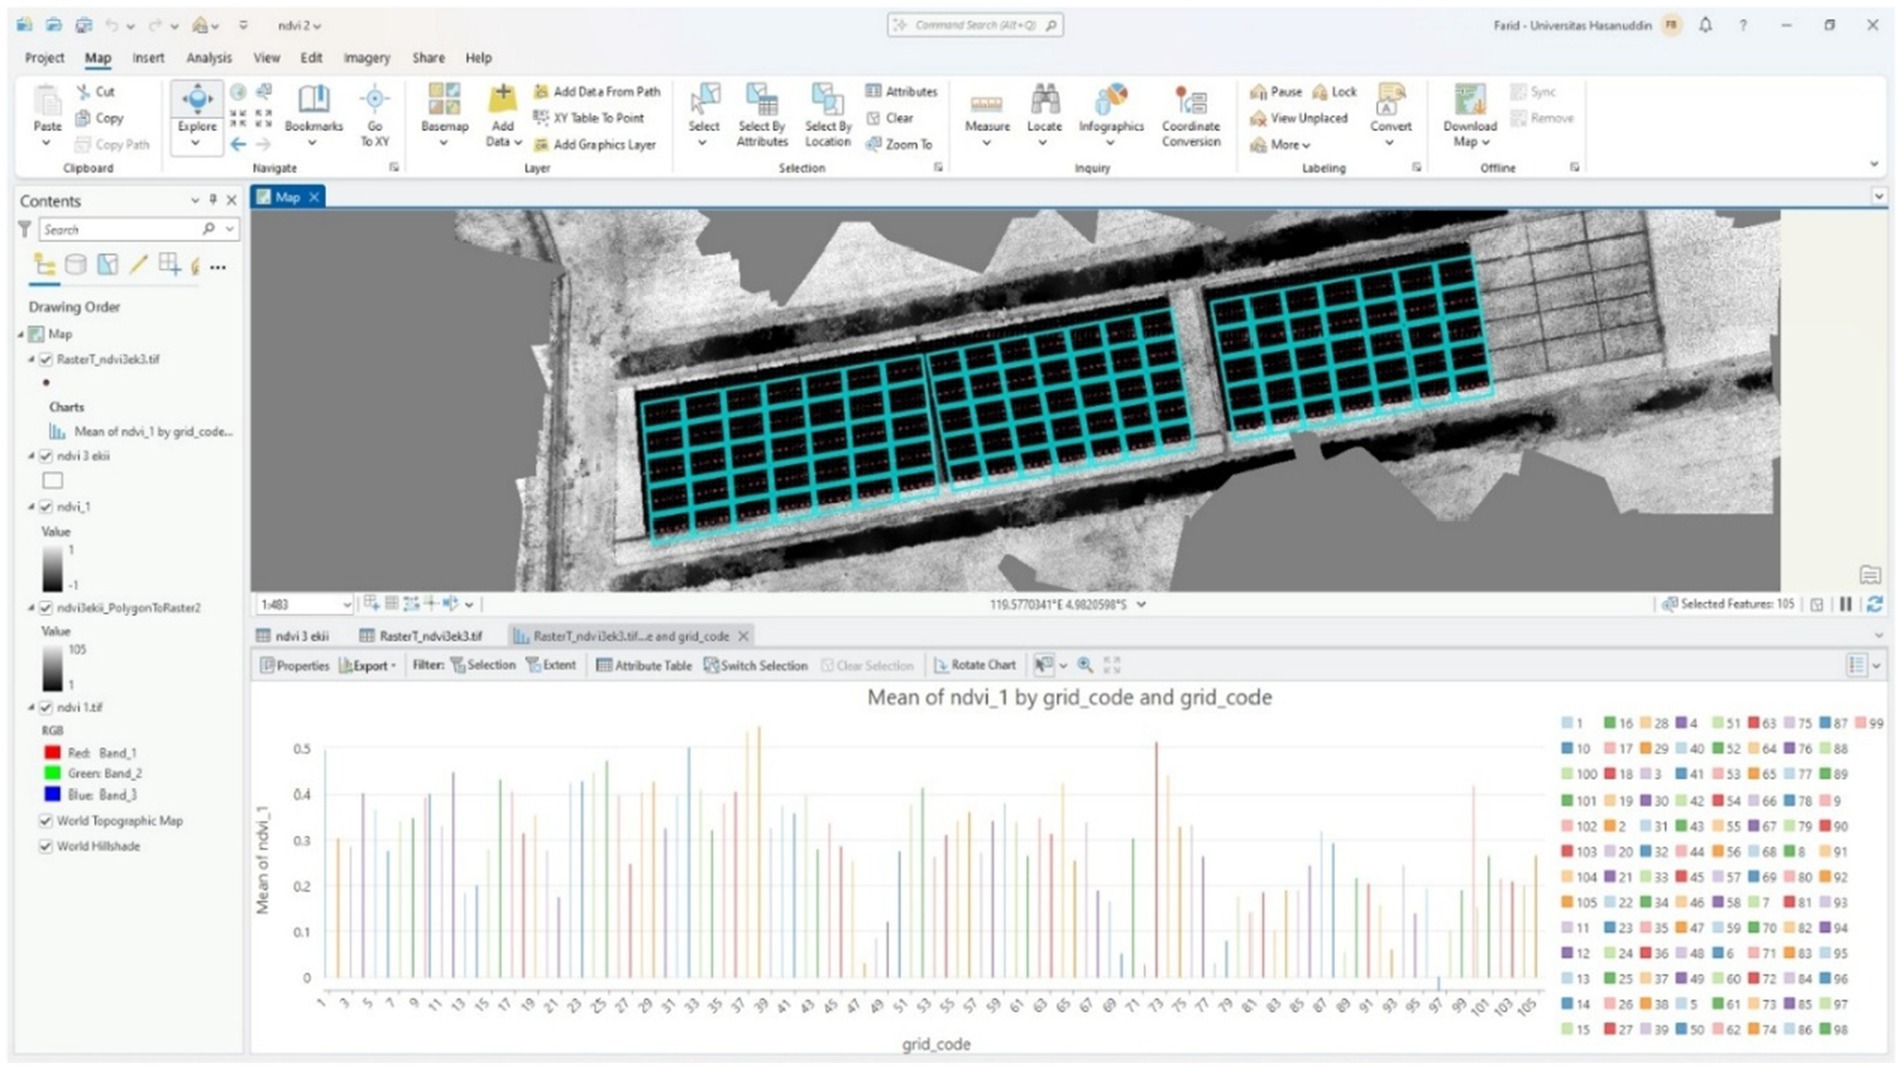
Figure 2. Interface and general appearance of vegetation index analysis using ArcGis Pro.
2.7 Statistical and predictive modeling approach
Statistical analysis was performed using R version 4.3.1. The observed data were first analyzed using analysis of variance (ANOVA) to identify traits that were significantly influenced by environmental variation and genotype. To minimize environmental effects and replication, the Best Linear Unbiased Estimator (BLUE) values were calculated using the Rstudio with agricolae package, with a focus on fixed genotype effects. Traits showing a strong relationship with yield were identified through correlation analysis and further evaluated using multivariate techniques such as factor analysis and path analysis to determine key predictors of productivity.
For predictive modeling, three regression approaches, stepwise, ridge, and LASSO, were applied using the glmnet and caret packages. Model selection was based on prediction accuracy, simplicity, and multicollinearity diagnostics. Stepwise regression was prioritized due to its optimal balance between readability and performance. Regression analysis began with agronomic traits, followed by the addition of vegetation indices to enhance predictive power. All models were trained using data from two replicates (65%) and tested on one replicate (35%), based on pooled data across multiple rice varieties. Assumptions such as residual normality and multicollinearity were evaluated, and model performance was assessed using R2, RMSE, and MAPE to validate the robustness of the final model.
Once the productivity prediction model was constructed, the prediction criteria were analyzed for their interaction with actual productivity through 3D plot analysis. This analysis aimed to explore the response patterns of each variety with respect to the three evaluation criteria. Data from both locations were combined into a single dataset. From each experimental unit, two out of three replications were used to form the training set, while the remaining replication was allocated for testing. This method allowed for a representative training process while maintaining independent data for model validation. After evaluating the model for both performance and interaction, it was compared with actual productivity to understand the interaction response between varieties and different nitrogen fertilization dosages. Linear regression analysis was also employed to investigate these interaction patterns. Overall, this comprehensive approach was crucial for assessing the effectiveness of the model developed to predict the interaction patterns of early maturing rice varieties in response to nitrogen fertilization.
3 Results
3.1 Estimation of agronomic character-based evaluation criteria for the interaction of nitrogen dose and genetics of early maturing rice varieties
The analysis of variance revealed a varied pattern of significant effects of sources of diversity on rice growth parameters (Table 3). The single effect of the environment significantly affected the number of total tillers, number of productive tillers, flowering age, harvesting age, flag leaf width, panicle density length, 100-grain weight, yield per clump, and productivity. A single source of variation in nitrogen fertilizer dose significantly affected all growth characteristics, except flowering age, harvest age, and panicle density. The interaction effect of environment and nitrogen dose significantly affected the total tiller number, productive tiller number, flag leaf width, panicle length, 100-grain weight, and productivity. The single source of diverse varieties and their interaction with the environment significantly affected all the rice growth characteristics. The source of diversity of the interaction of nitrogen dose and variety had a significant effect on almost all the characteristics, except flowering age, harvest age, flag leaf length, and panicle length. Moreover, the source of diversity of the interaction between the three variables (ExNxV) also had a significant effect on almost all growth characteristics, except plant height, harvest age, and panicle length.
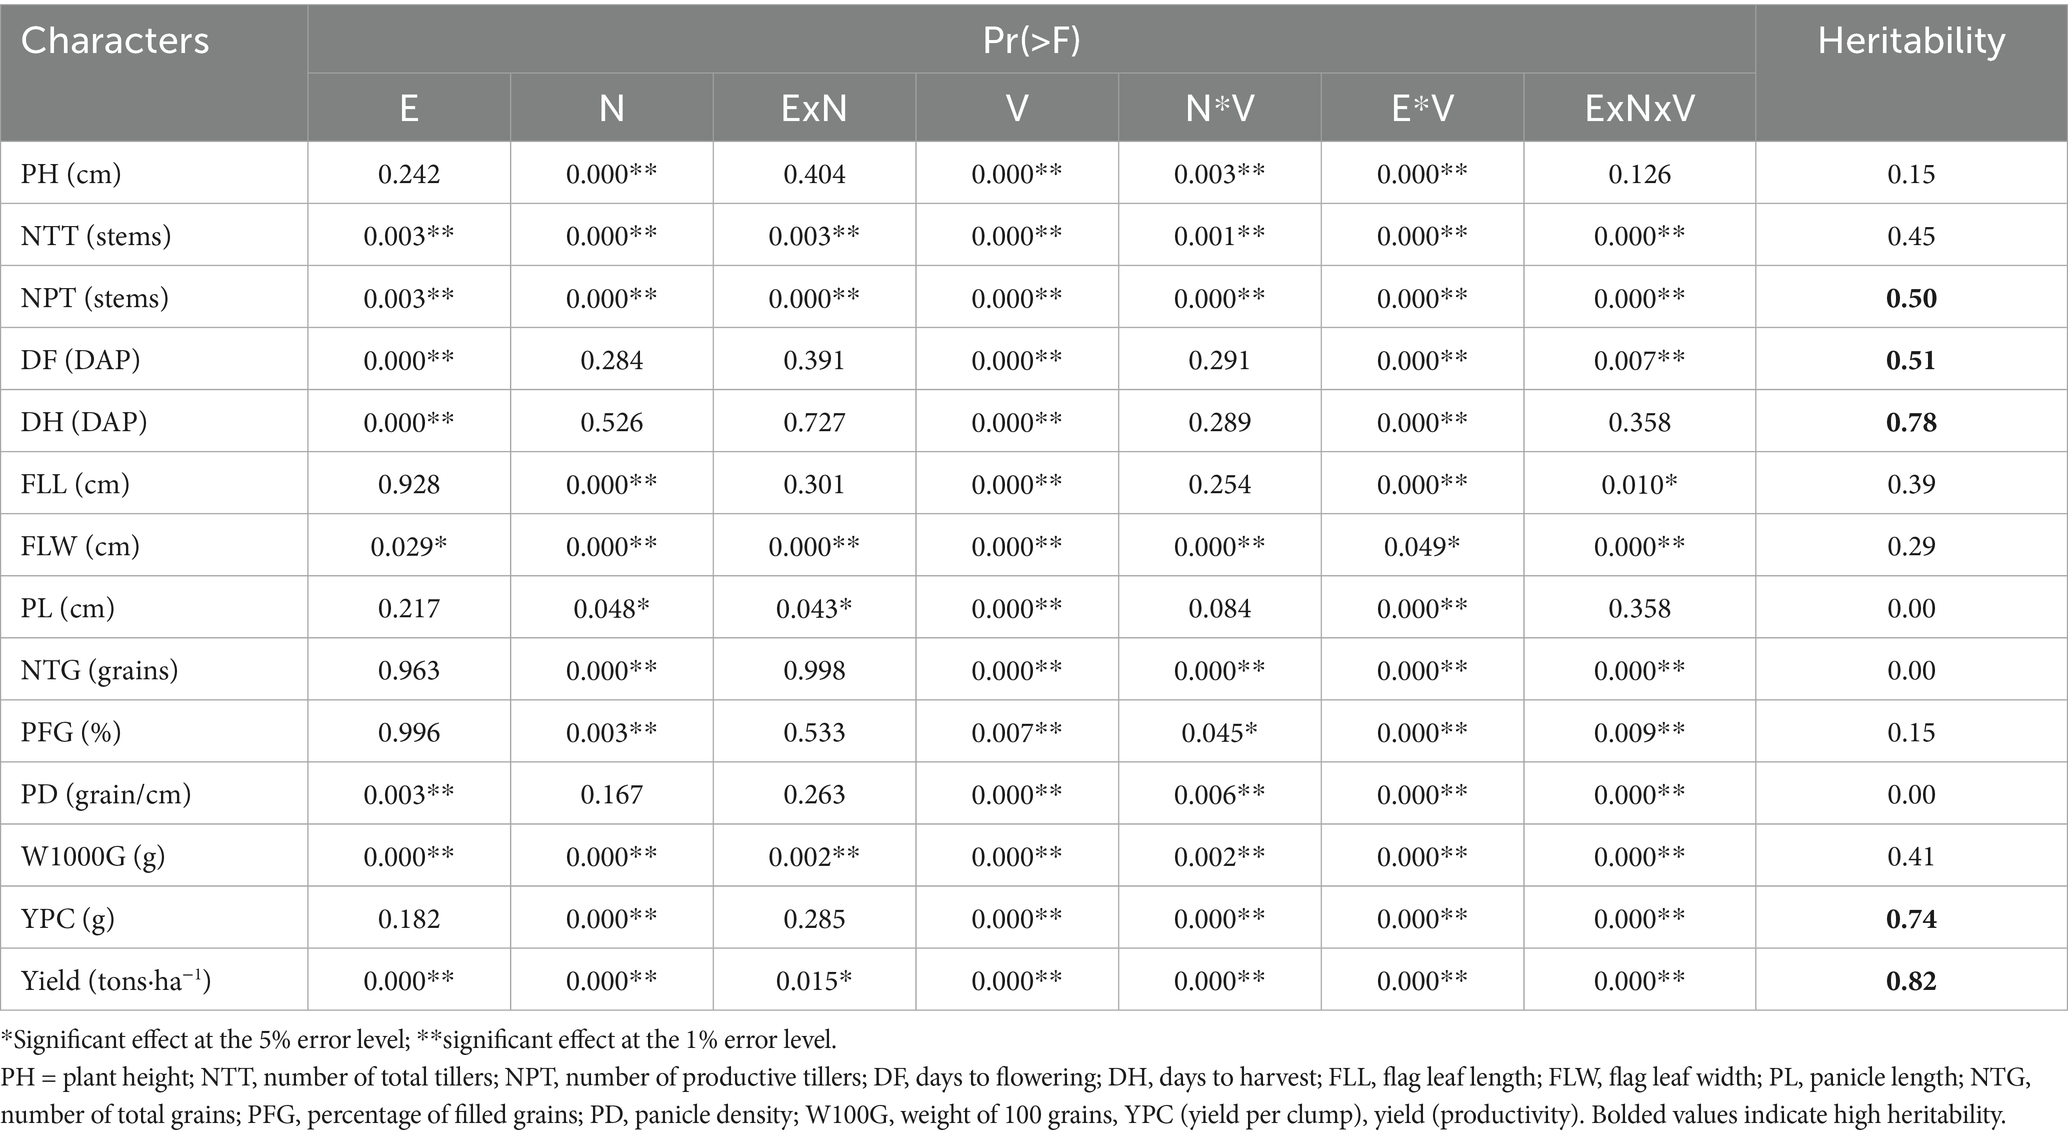
Table 3. Analysis of variance was used to analyze the effects of growth on rice characteristics, nitrogen fertilizer dosage, and crop variety.
The heritability data supported the analysis of variance data to determine the genetic potential (Table 3). Based on this potential, the number of productive tillers, flowering age, harvesting age, yield per clump, and productivity were categorized as high. The characteristics of total tiller number, flag leaf length, flag leaf width, and 1,000-grain weight were classified as moderate. In contrast, these characteristics were categorized as low.
The results of the BLUE-based correlation analysis were shown in Table 4. This correlation analysis focused on productivity as the primary dependent characteristic in this study. Based on the correlations shown in Table 4, the yield per hectare was positively and significantly correlated (<0.001) with plant height (0.66), total number of tillers (0.75), number of productive tillers (0.67), flag leaf length (0.56), flag leaf width (0.65), panicle length (0.44), percentage of filled grains (0.53), 1,000-grain weight (0.70) and yield per clump (0.78). The panicle density (0.37) was only significantly correlated with yield per hectare. Moreover, the characteristics of total tiller number, 1,000-grain weight, and yield per clump also presented relatively similar correlation patterns as those of yield with other growth characteristics.
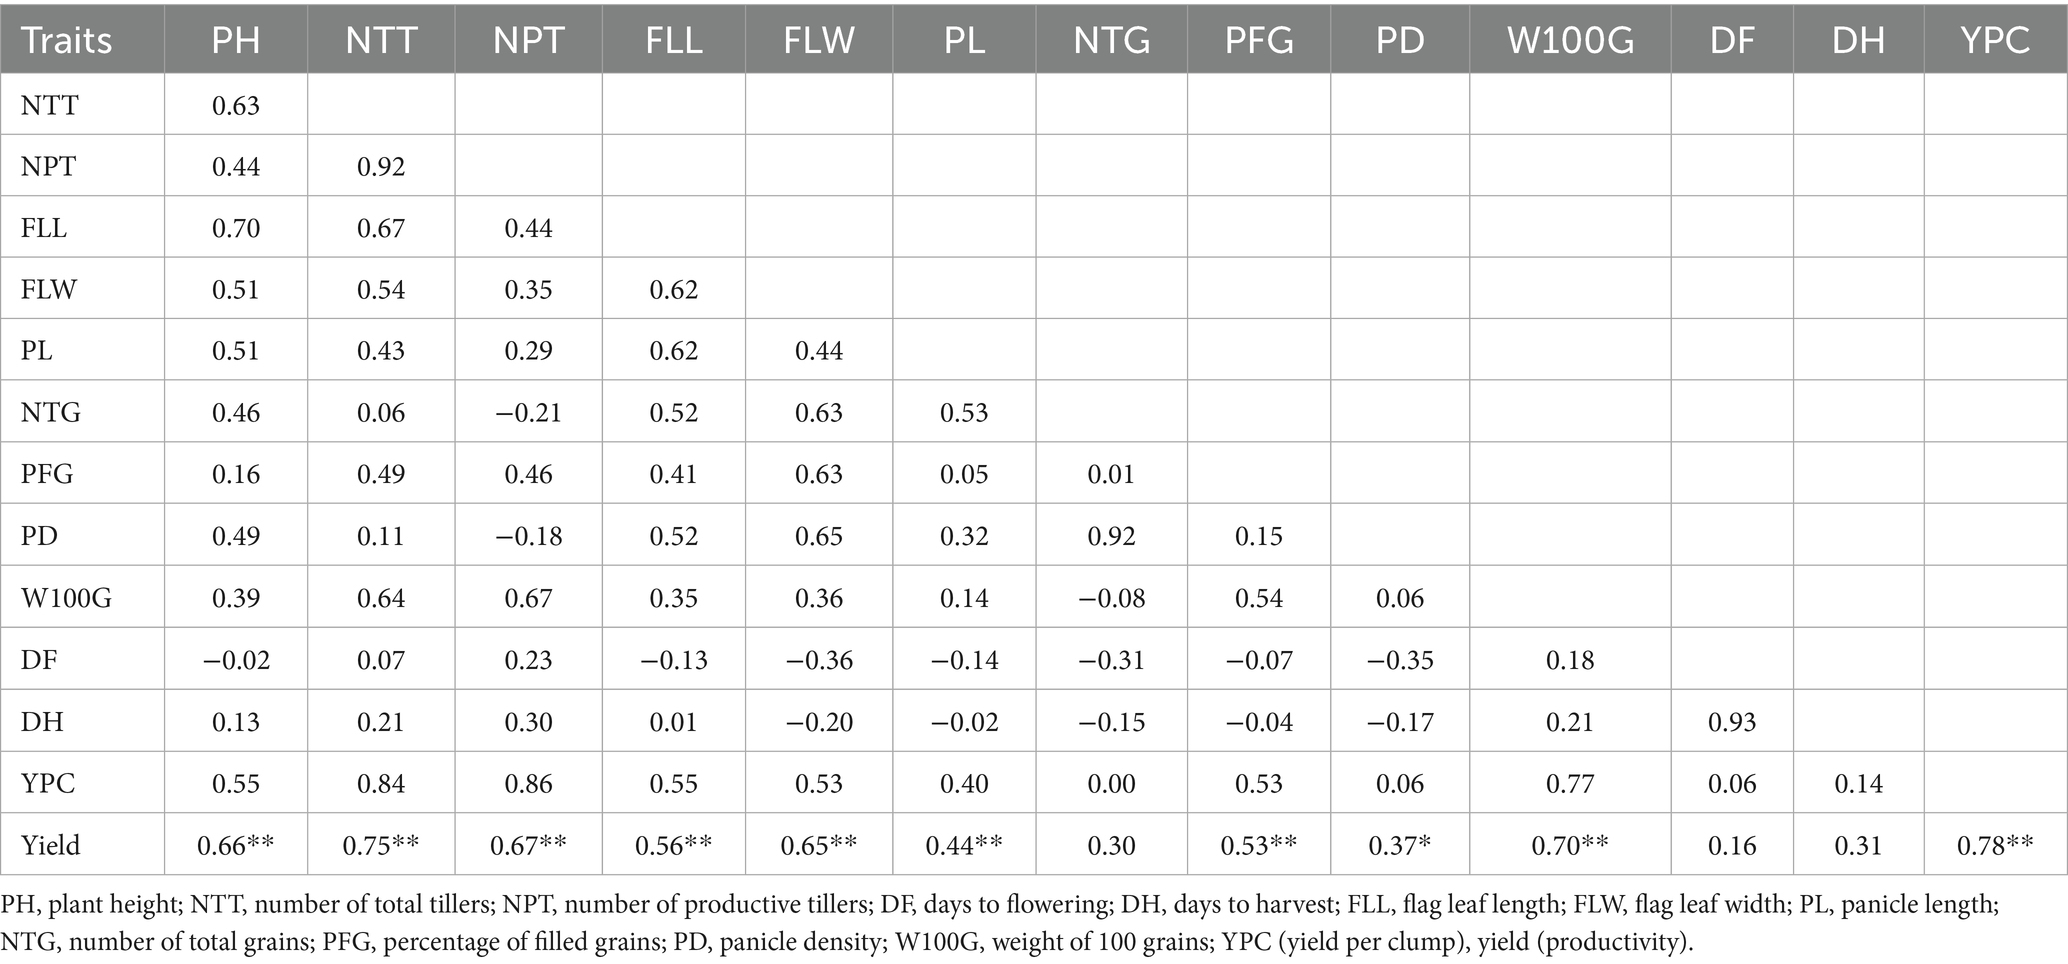
Table 4. Correlation analysis of growth characteristics in rice with respect to nitrogen fertilizer dosage and variety treatments.
The factor analysis results showed that three-factor dimensions can represent the diversity of the growth data in this study (Table 5). Based on this analysis, factor 1 had the most significant factor loading value compared with the other factor dimensions. In addition, for this factor, the factor loading value of the yield (0.66) was the highest compared with the other factor dimensions. The characteristics with large loading values (>0.5) and in the same direction as productivity were the total number of tillers (0.81), the number of productive tillers (0.92), the 1,000-grain weight (0.80), and yield per clump (0.84).
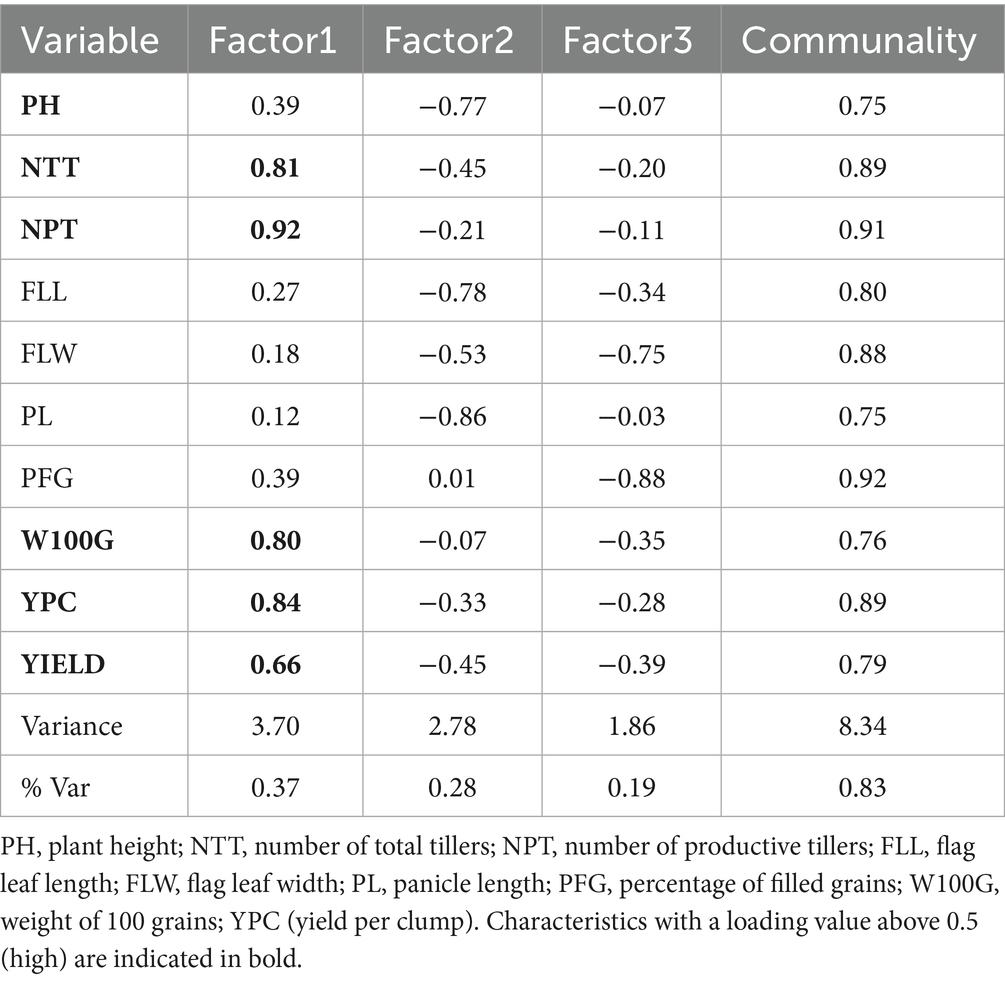
Table 5. Factor analysis of rice growth characteristics correlated with yield per hectare.
The path analysis was shown in Table 6 and focuses on productivity characteristics. Based on the table, the total number of tillers (0.56) was the characteristic with the most significant direct effect, with a value of 0.56. The characteristics of plant height (0.30) and yield per clump (0.29) also had good direct effects on productivity. Moreover, the characters of flag leaf width, panicle length, percentage of filled grains, and 1,000-grain weight had positive direct effects but were not too large compared with the previous three characters. In contrast, the number of productive tillers (−0.39) and flag leaf length (−0.33) negatively affected productivity.
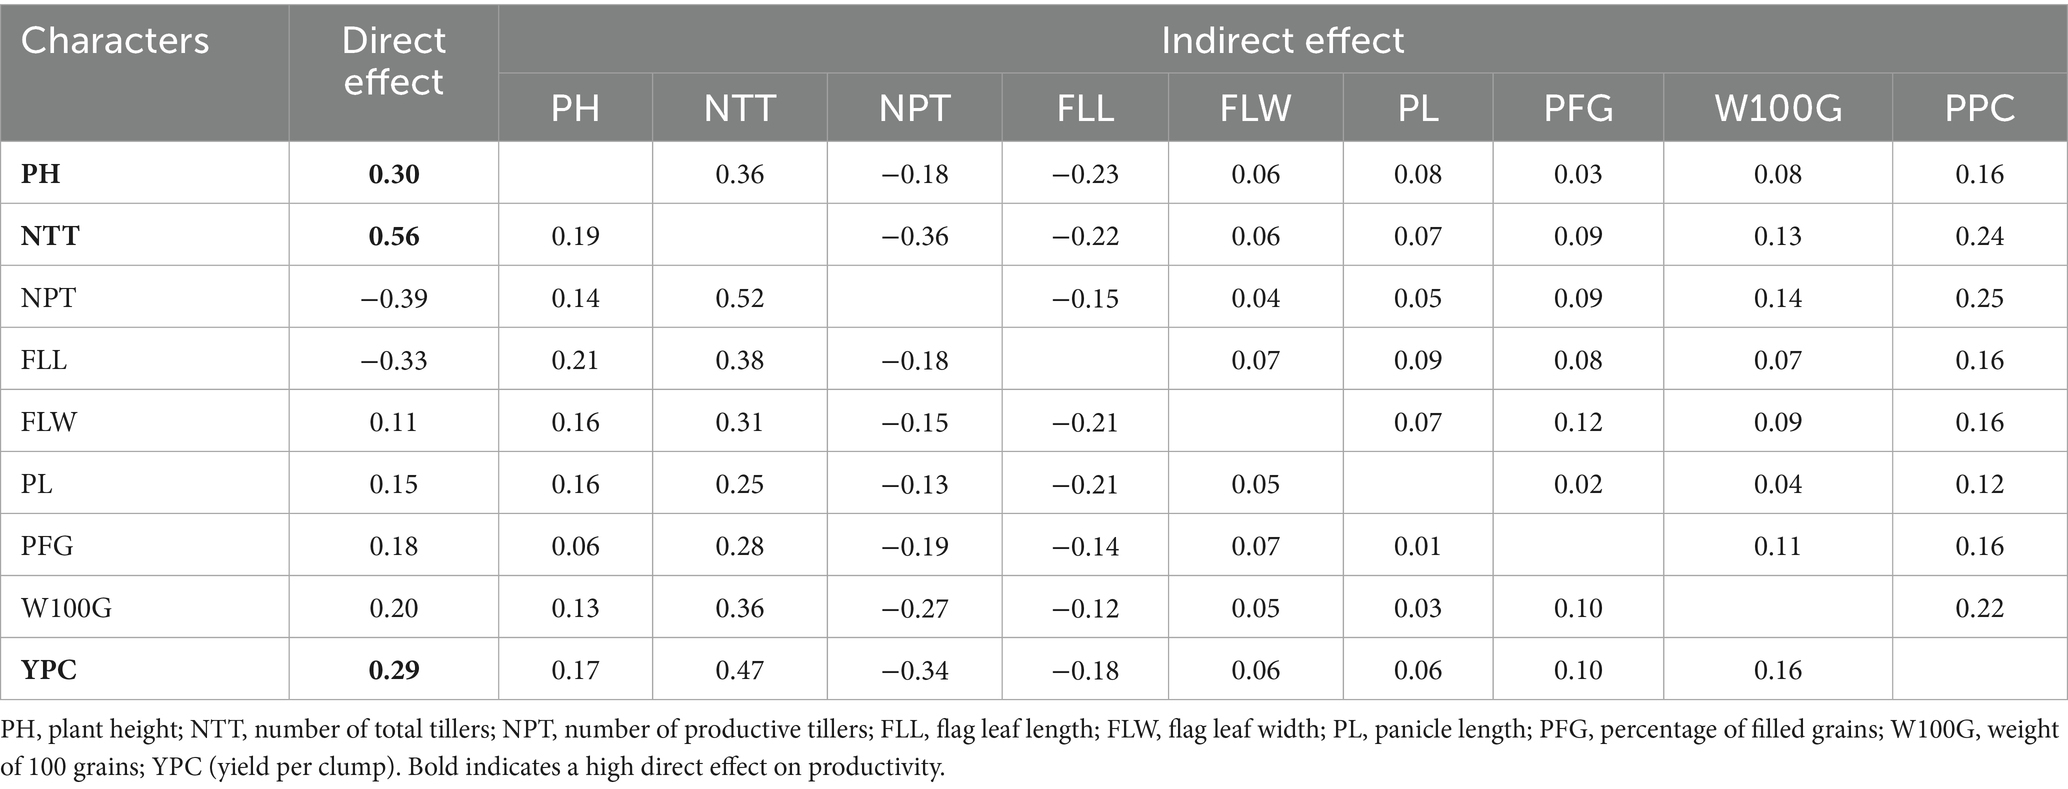
Table 6. Path analysis of selected growth characteristics in rice based on factor analysis.
3.2 Model comparison and performance of potential evaluation criteria in yield prediction
Modeling was performed in phases, utilizing agronomic evaluation criteria and vegetation indices. The modeling process employed both simple linear and multiple regression techniques. Table 7 presented a summary of the performance of the four models that incorporated agronomic components (NTT and YPC). Among the single regression models, YPC (Yield = 0.577 + 0.186 YPC) exhibited superior regression potential compared to NTT across all metrics, particularly for the test dataset (R2 = 0.806, RMSE = 0.518, MAPE = 9.77%). When combining NTT and YPC, LASSO regression demonstrated the most favorable overall performance, achieving the lowest RMSE (0.489), MAPE (8.96%), and R2 (0.828) on the test dataset. The performance of this combination was not significantly different from that of YPC alone.
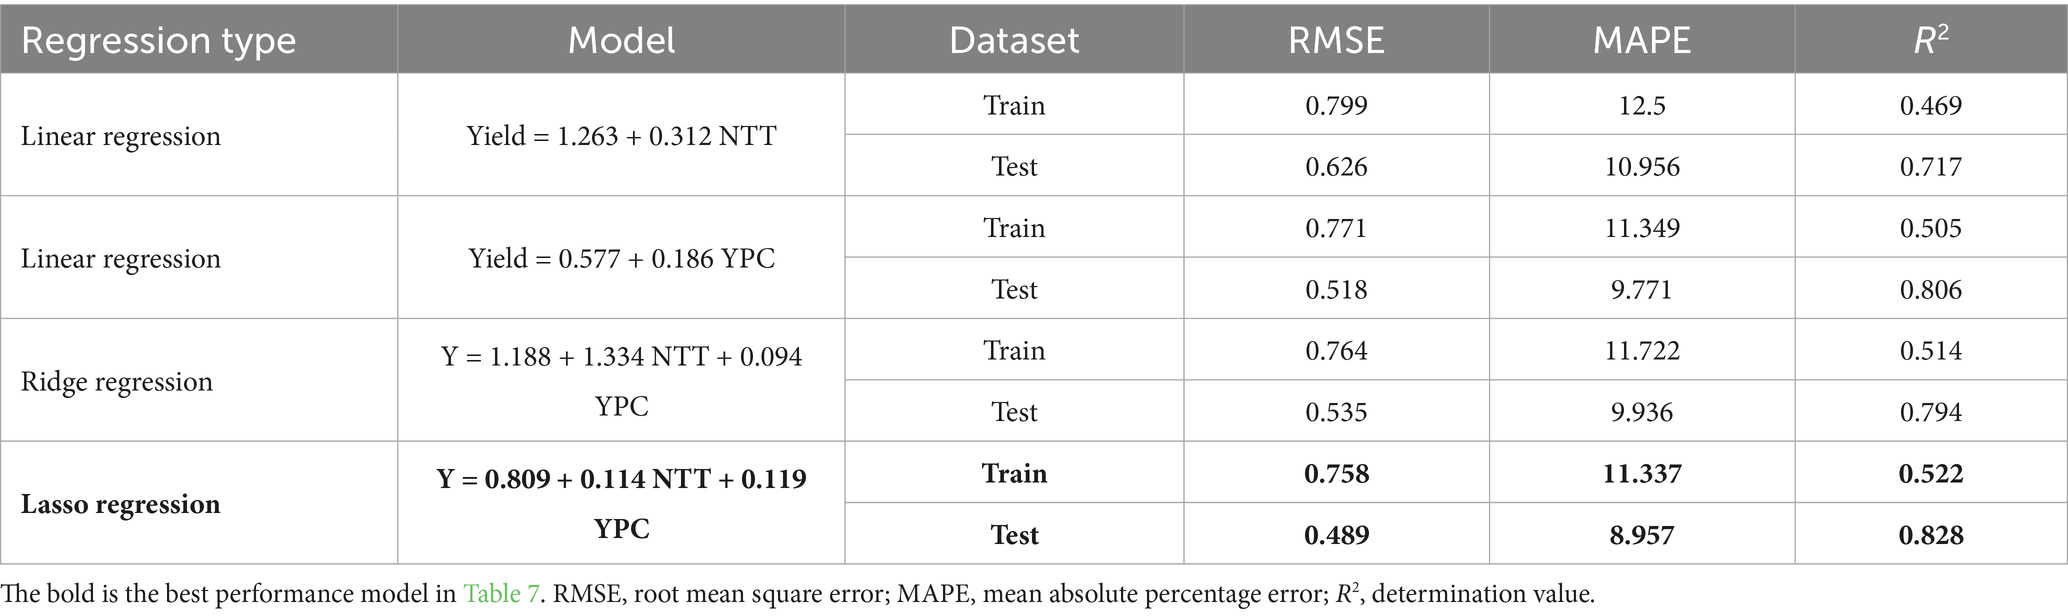
Table 7. Performance metrics of regression models for rice yield production using agronomic components.
Modeling based on vegetation indices (NDVI, NGRDI, and VARI) was detailed in Table 8. The analysis concept also used simple linear regression and multiple regression. Among these models, NDVI exhibited the highest performance among the single-vegetation-index models (R2 = 0.49). However, stepwise multiple regression that integrated YPC and NDVI yielded the most reliable performance (R2 = 0.73, RMSE = 0.61, and MAPE = 10.81%) (Figure 3). Ridge and LASSO variants showed comparable but slightly inferior performance relative to the stepwise approach. To facilitate visual interaction, Figure 4 illustrated a 3D plot of the yield response based on the combination of traits. The consistent diagonal trend indicated a strong interaction effect, particularly for the Inpari 32 variety, which displayed the greatest variation in yield prediction across all three dimensions. On the other side, Inpari 19 was the lowest variation across all three dimensions.
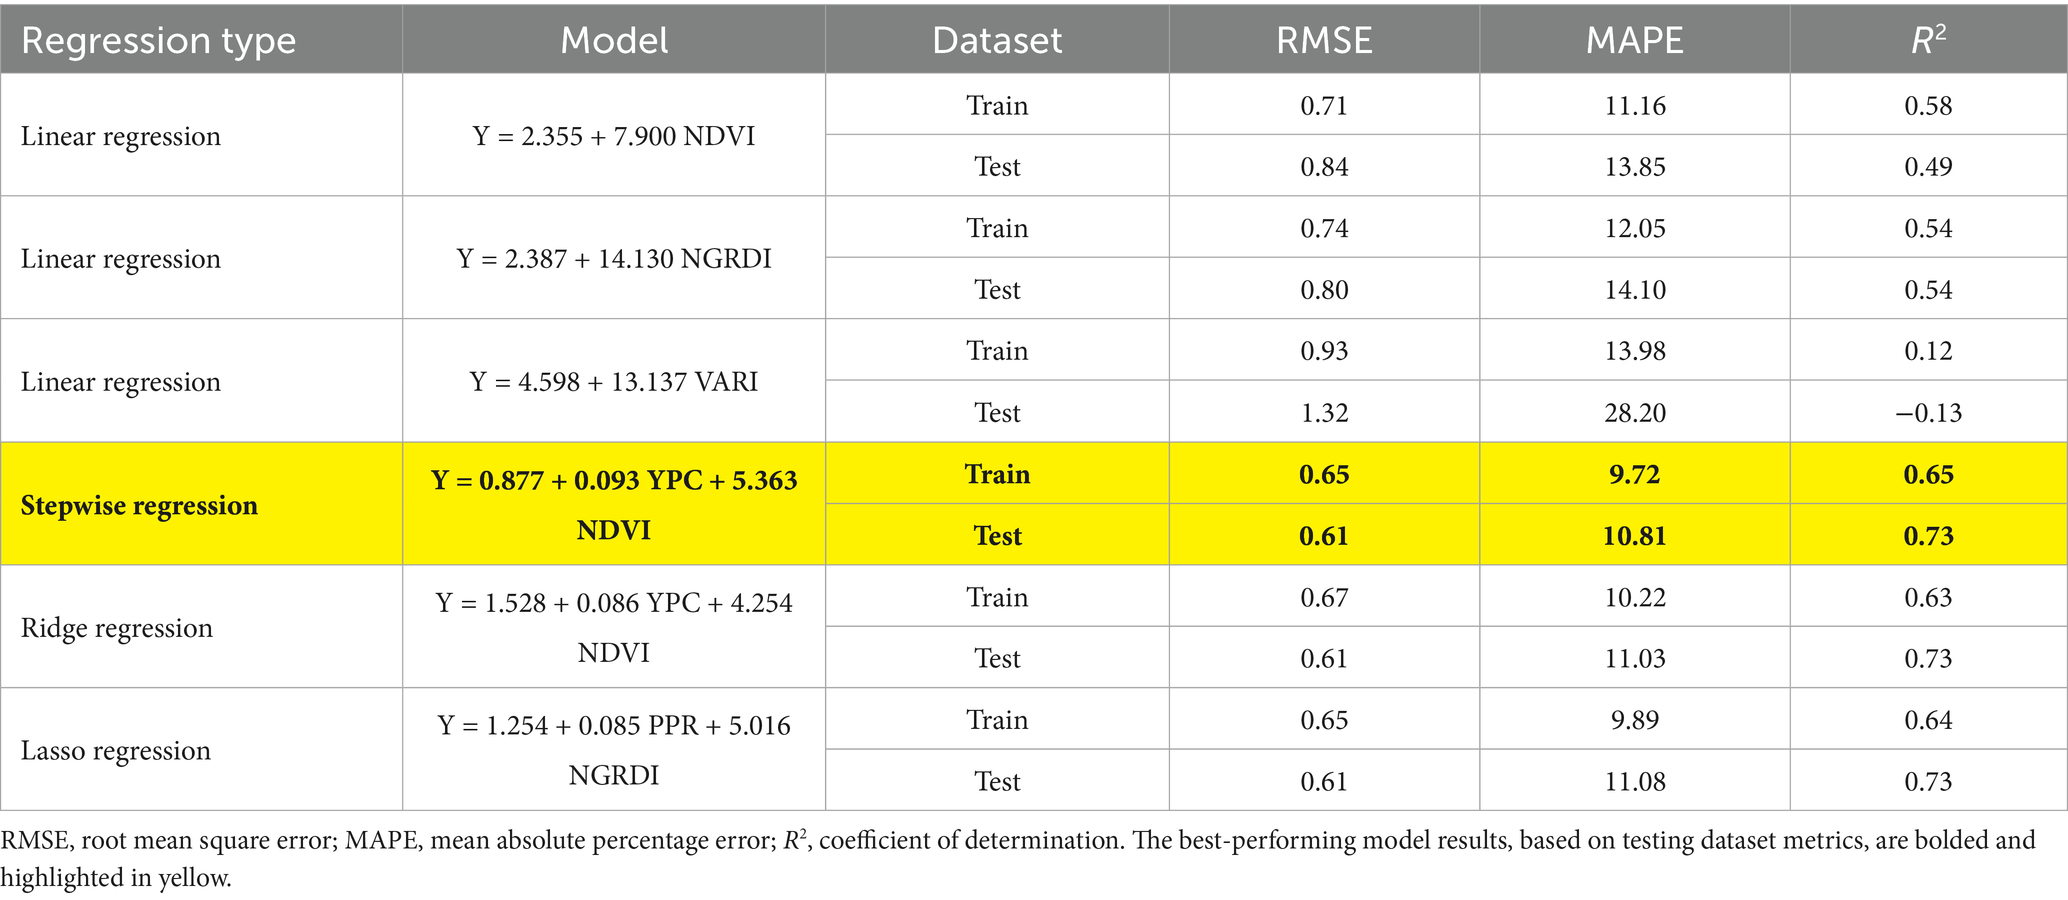
Table 8. Performance metrics of regression models for rice yield prediction using production component and vegetation indices.
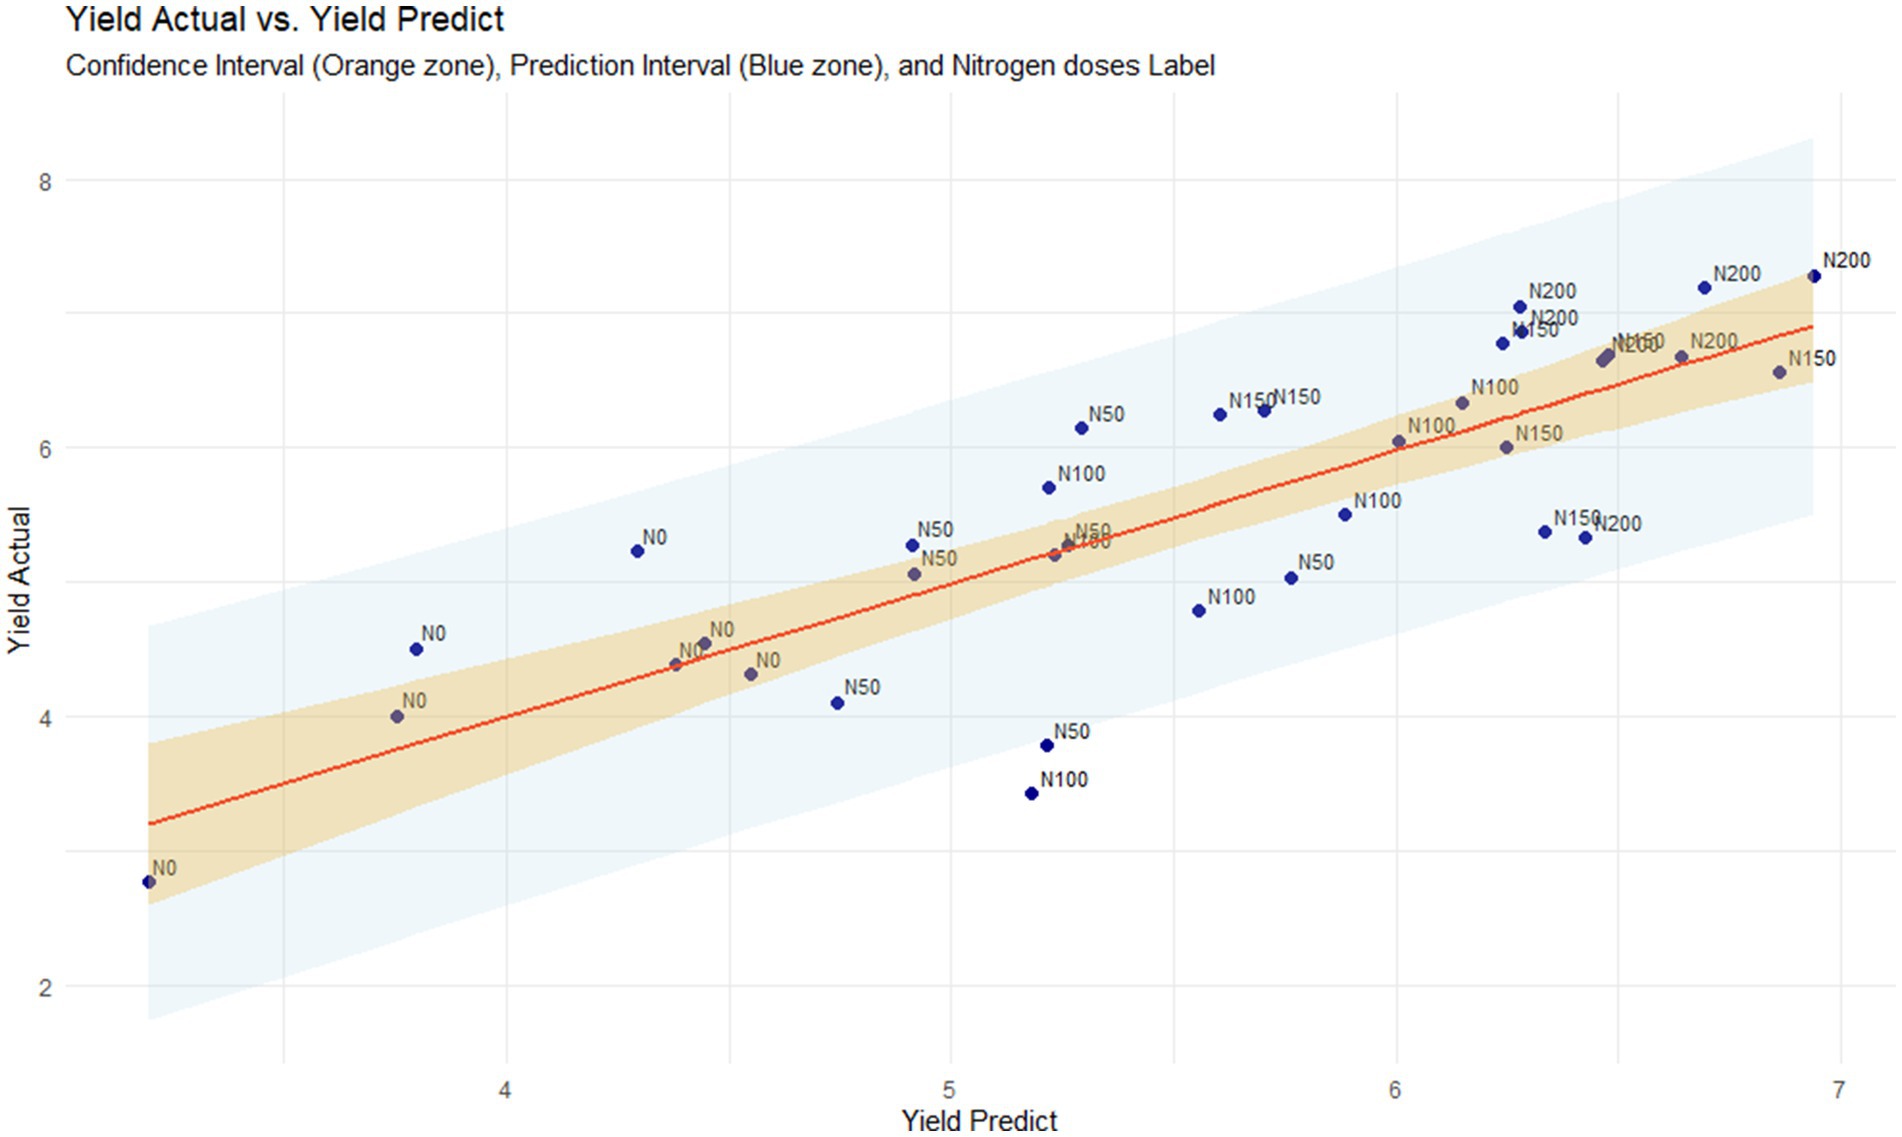
Figure 3. Yield actual vs. yield prediction based on stepwise regression of YPC and NDVI.
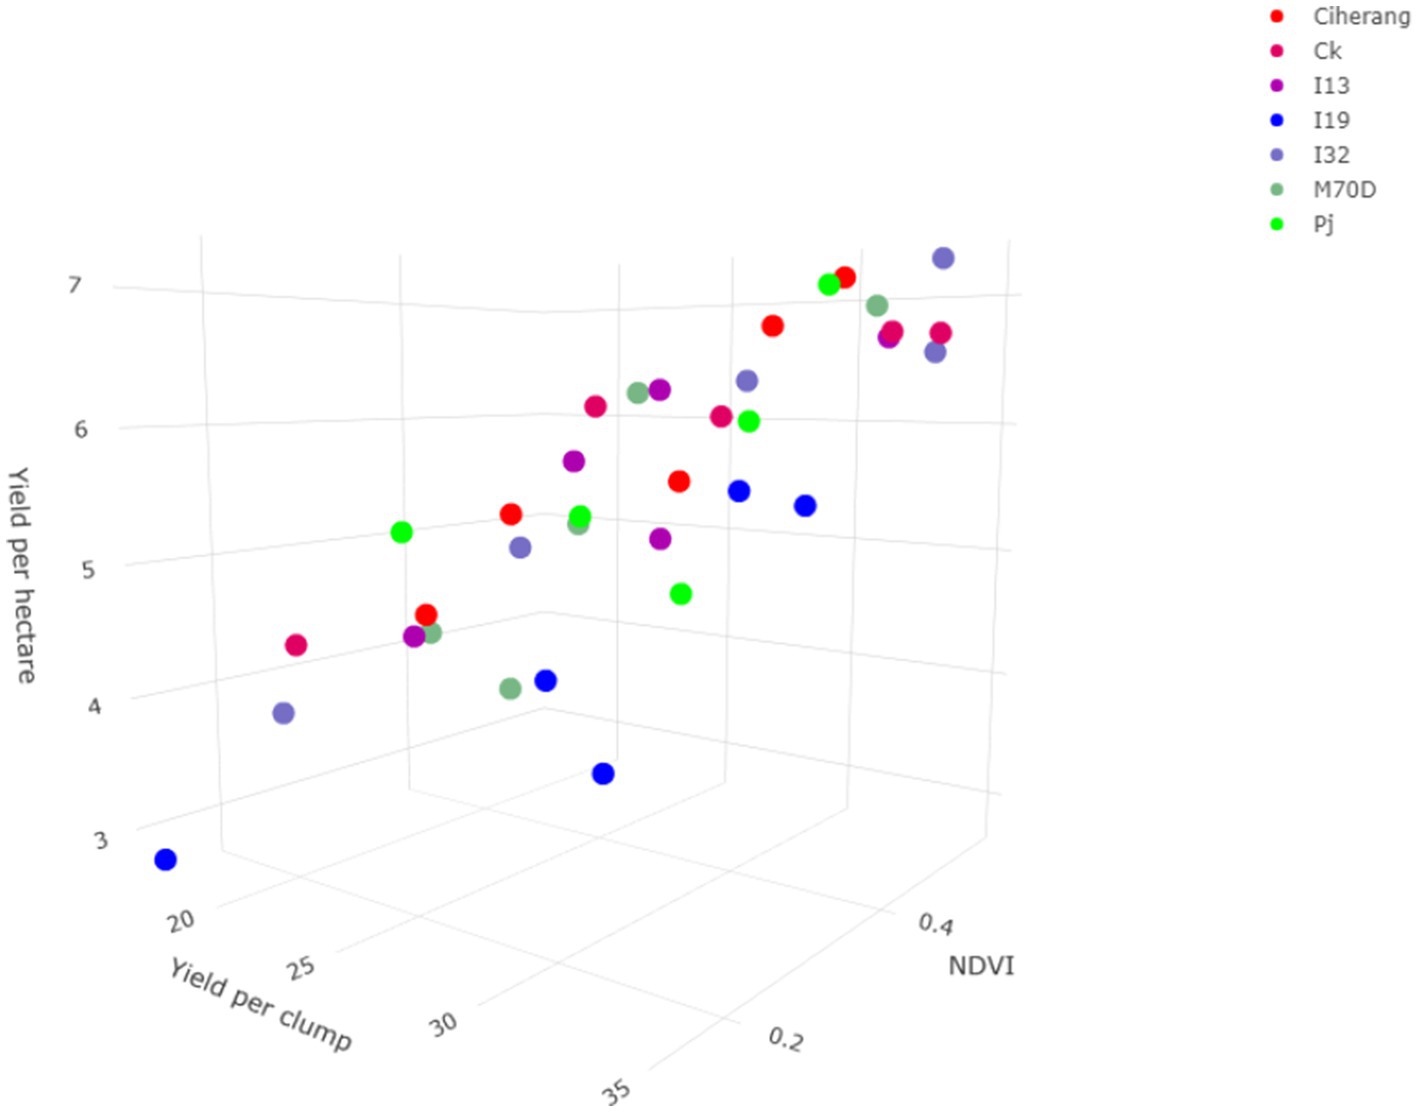
Figure 4. Interaction relationships between the evaluation criteria and yield.
3.3 Validation of predicted vs. actual yield across nitrogen and variety interactions
The results of the interaction analysis regarding varietal effects of different doses of nitrogen fertilization on productivity were presented in two forms: the modeling version (Figure 5) and the actual yield (Figure 6). According to the modeling version, all varieties demonstrated a strong interaction pattern with a determination value above 0.8, except for Inpari 13, which has a value of 0.719. Furthermore, the most significant interaction occurred between 50 and 100 kg ha−1 nitrogen at all nitrogen doses. From a variety-specific standpoint in the modeling version, Inpari 32 had the highest gradient value of 0.0167, supported by a determination value of 0.92. Additionally, among the early maturing varieties, Cakrabuana had the highest gradient value of 0.139, with a determination value of 0.89. In contrast, Inpari 13 presented the lowest regression gradient value at 0.0082.
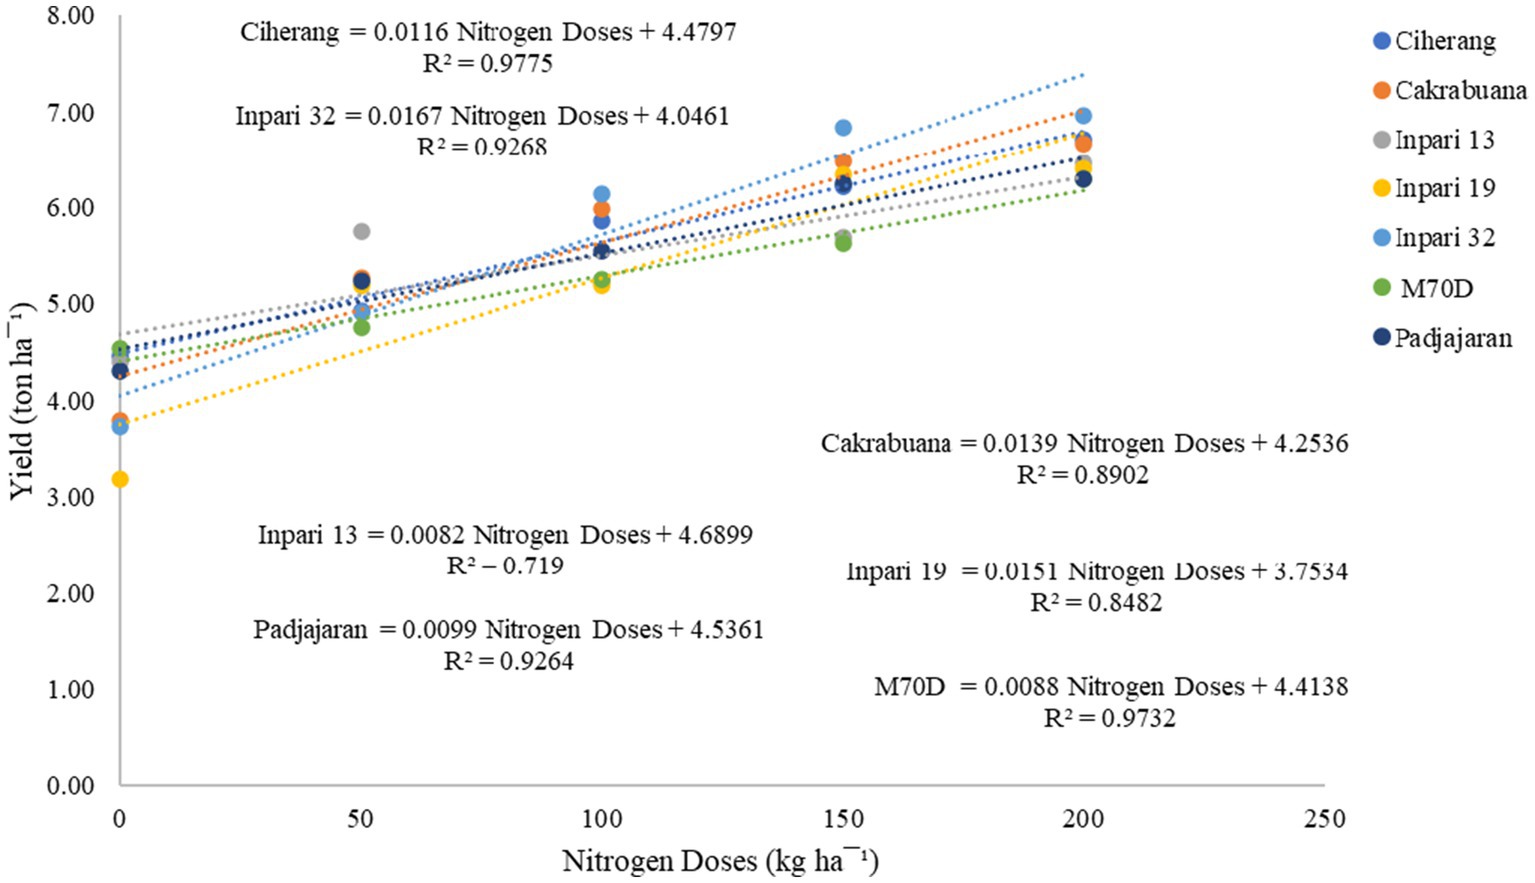
Figure 5. Fertilizer response to variety based on modeling.
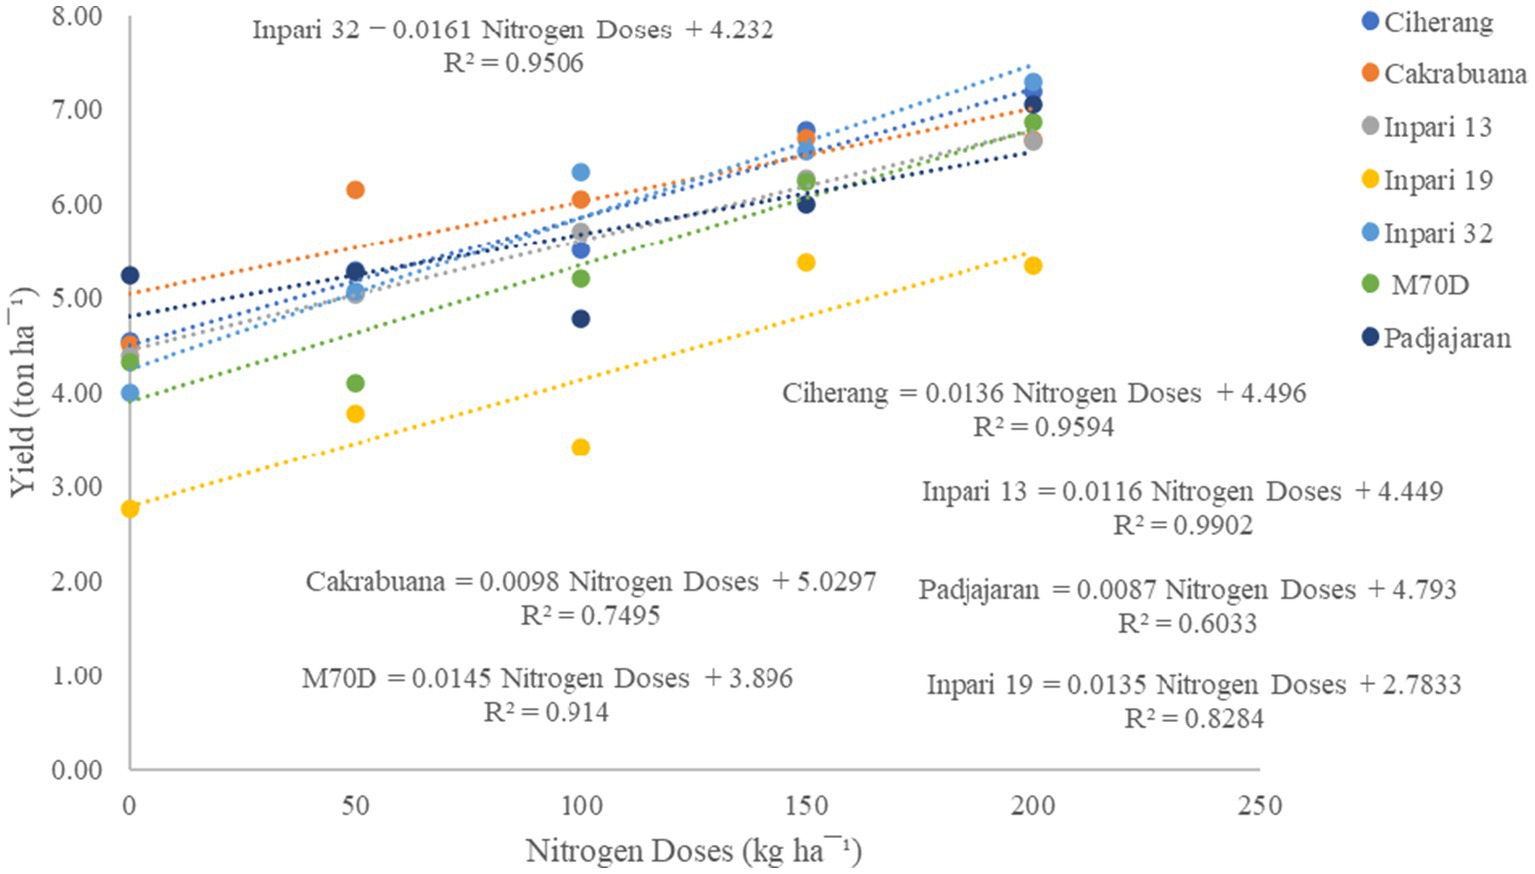
Figure 6. Fertilization response to varieties based on actual yield.
All the tested varieties presented high yield values, except for Cakrabuana (0.75) and Padjajaran (0.603). In addition, the highest interaction point of the two factors was also the same as that in the modeling, where the point was between 50 and 100 kg ha−1 nitrogen. Based on the variety-specific potential in the actual version, Inpari 32 had a higher gradient response than the other varieties, with a value of 0.0162 and a determination of 0.95. Moreover, concerning early maturing rice, the M70D variety was the early maturing rice variety with the highest gradient value, which is 0.0145, with a determination value of 0.914. In contrast, the variety with the lowest gradient value was the Padjajaran variety, which is 0.0087, with a determination value of 0.603.
4 Discussion
The analysis of variance (ANOVA) revealed a single source of diversity in the environment, and nitrogen fertilization dose and variety had a significant effect on almost all agronomic characteristics. The effect of variety is the single most dominant effect related to rice growth characteristics. This is also inseparable from selecting the comparison varieties Inpari 32 and Ciherang (moderate-aged varieties) for evaluating the growth of this early maturing rice variety. According to Musa et al. (2023) and Anshori et al. (2024a), early maturing rice varieties differ in age from moderate to long-maturing rice and present very different growth patterns. This causes the significance pattern of the analysis of variance always to be significantly affected when the two types of rice are combined in the test. The growth pattern becomes more complex, including different fertilizer doses and planting locations (Musa et al., 2023). The combination of the two factors produces a specific growing environment for the growth of a variety, so the combination of the three factors creates specific interactions in the growth characteristics of the rice being evaluated (Garbanzo et al., 2024). The interaction pattern complicates the assessment of the evaluation process, so the reduction in the interaction potential and environment (location) needs to be minimized when evaluating the potential of varieties to nitrogen fertilization doses. The concept can be applied with the best linear unbiased estimator (BLUE) approach. The BLUE approach can minimize random influences from interactions and the environment (Seck et al., 2023). This causes the potential of the fix (variety) to be optimized in the evaluation process so that the evaluation process becomes more precise (Grinberg et al., 2020). This includes modeling the productivity of each variety against nitrogen fertilization doses based on secondary criteria. Therefore, all growth data were analyzed with BLUE (Supplementary material 1) to determine the prediction criteria used in this evaluation.
Determining evaluation criteria is conducted systematically through several multivariate analyses, specifically correlation analysis, path analysis, and factor analysis. These analyses have been reported to identify evaluation criteria in different studies effectively. For example, Anshori et al. (2018), Anshori et al. (2021), and Anshori et al. (2022) demonstrated the effectiveness of correlation analysis in determining secondary characteristics in rice. Similarly, Semeskandi et al. (2024) demonstrated the effectiveness of path analysis in establishing selection criteria for rice. Additionally, Farid et al. (2020) highlighted the successful application of factor analysis for the same purpose. These three analyses aim to increase the precision of determining evaluation criteria. Generally, correlation analysis is widely employed to identify the potential of a character as an evaluation or selection criterion (Prakash et al., 2024). This method helps filter out characters whose diversity patterns do not align with the primary criterion, which is productivity (Abdulla and Mustafa, 2024). The results from this reduction can then be further refined through path analysis and factor analysis, which can be performed concurrently (Anshori et al., 2022). Path analysis aims to partition correlation analysis into direct influences that affect the diversity of the main criteria (Singh Yadav et al., 2024). On the other hand, factor analysis is employed to examine the dimension-based distribution of variance, reducing low internal covariance within each dimension. This helps identify criteria with a high variance contribution in each dimension (Rocha et al., 2018; Anshori et al., 2022; Anshori et al., 2024a). The integration of path analysis and factor analysis enhances the assessment of evaluation criteria that determine the potential diversity of key criteria. This combined approach has also been documented by Anshori et al. (2022) and Kumar et al. (2024). Therefore, utilizing all three analyses can provide effective recommendations for evaluation and selection criteria in the modeling of this study.
This study identified the total number of tillers and yield per clump as potential agronomic traits for evaluation criteria. The effectiveness of these criteria has been supported by Limbongan et al. (2023) and Sary et al. (2022). Generally, early maturing rice varieties depend on the potential of productive tillers as a key component in increasing rice yield (Anshori et al., 2024a). However, the potential for productive tillers also relies on the total number of tillers in the early maturing variety (Takai, 2024). This relationship is evident in the indirect effect of the total number of productive tillers; thus, more total tillers lead to a greater likelihood of productive tillers. Additionally, the yield potential per clump indicates the economic value that each individual plant can provide (Sudaryono et al., 2023). A more significant potential in this trait enhances the overall population weight of the variety, making it an integral part of the yield components (Beding et al., 2023). This is further validated by research conducted by Anshori et al. (2024a,b). Therefore, this study recommends the total number of tillers and yield per clump as evaluation criteria.
Based on the analysis of drone-based vegetation indices, the normalized difference vegetation index (NDVI) demonstrated stronger performance than other approaches in modeling. This index generally utilizes the near-infrared approach as a corrector of the green band. This concept enhances the sensitivity of the index in recognizing leaf greenness and biophysical and physiological changes of plants (Lai and Lin, 2021; Wang et al., 2025). This makes NDVI often reported as an effective vegetation index in predicting crop yield potential, including in rice (Lai and Lin, 2021; Islam et al., 2023; Quille-Mamani et al., 2025). However, this study’s model evaluation results on NDVI linearly did not reach R2 0.7. This is different from the research of Lai and Lin (2021) and Wang et al. (2025) which showed R2 values above 0.7 in modeling. This difference is based on the agroclimatic conditions of the research and the type of varieties used. The research climate was conducted in the tropics with dynamic rainfall patterns in the two planting sequences. In addition, the modeling of rice in this study uses early maturing rice, which has a different phenology from general rice. Hence, optimization of the cultivation of other fertilizers needs to be done first. Both of these make the accuracy of the model unable to reach 0.7. Nevertheless, the R2 value above 0.5 is an indication that the model has worked well in predicting yield indirectly (Quille-Mamani et al., 2025). Therefore, utilizing NDVI can be a good indication in modeling early maturing rice in response to nitrogen dosage. This concept still needs to be improved in terms of efficiency, that can be done by utilizing a stepwise multiple regression analysis on other selection criteria. The current model was developed using pooled data across multiple varieties to capture generalizable yield prediction patterns under diverse conditions. However, the performance of the model was not assessed separately for each variety. Future studies may explore developing individual or cluster-based models to improve prediction accuracy for specific genetic backgrounds, particularly for varieties with unique phenotypic or physiological traits.
This index showed significant values in a stepwise multiple regression analysis with yield per clump. The performance metrics from the stepwise regression were also superior to those obtained from the ridge and LASSO regression. However, an R2 value below 0.7 in the training data set likely reflects limited variation in the characteristics of early maturing rice varieties due to its short growth duration. This narrower range may limit the model’s ability to capture broader productivity trends. In addition, this model relies on a small number of predictors that may not fully account for the complexity of yield formation. To improve the robustness of the model, future studies should consider the use of additional predictors, data collection at various growth stages, and expansion of the study to more diverse environments.
Although the R2 value of the model did not reach 0.7 in the training data, the root mean square error (RMSE) and mean absolute percentage error (MAPE) were within acceptable standards for assessing the model’s effectiveness. Specifically, an RMSE below 1% (Ko et al., 2024) and a MAPE below 10% (Paul et al., 2024; Baharuddin et al., 2025). They are considered indicators of an effective model. Additionally, the difference in performance metrics between the training and testing data was minimal, indicating that this model is reliable. The interaction observed in the 3D plot analysis further illustrates the distribution of dimensional diagonal lines for each variety, enhancing the understanding of how the two evaluation criteria contribute to productivity. According to Wang et al. (2024), a 3D plot can effectively validate the interaction between three tested characteristics; this finding was also supported by Farid et al. (2021). Consequently, a stepwise model based on yield per clump and the NDVI is recommended for estimating potential productivity interactions via a model-based approach.
Based on the modeling analysis and its comparison with actual productivity, the model demonstrated a better determination value in response to nitrogen fertilization doses than actual productivity. Both approaches produced relatively similar interaction points at 50–100 kg ha−1 nitrogen doses. These findings indicate that, compared with actual productivity, the modeling concept can more reliably assess the fertilizer response, especially for early maturing rice varieties. This advantage will facilitate the prediction of productivity across large planting units. Additionally, the results of this modeling align with those reported by Anshori et al. (2024a,b), which confirmed the stability of the Cakrabuana and Padjajaran varieties. In contrast, these varieties are considered less adaptive to environmental changes based on their actual yield. The correlation between this modeling and (Anshori et al., 2024a) further supports the potential of the developed model to evaluate the stability and response to nitrogen fertilization. However, this research concept should be tested with a larger number of varieties to apply machine learning techniques to the model fully. Machine learning approaches that utilize big data can enhance prediction models (Zhang J. et al., 2024).
Conducting research across different years and locations was a strategic effort to capture a broader spectrum of agro-ecological conditions. The resulting environmental variation reflects the real-world scenarios faced by farmers across seasons and sites, particularly in tropical regions such as Indonesia. This diversity enhances the strength and robustness of the model, contributing to greater accuracy and applicability under varying field conditions. However, the limitation of this model is still focused on Indonesia, which is one of the characteristics of a tropical climate, so the application of this concept and model needs to be done in several countries with varying climates. This will make the model more robust in predicting potential productivity, especially for early maturing rice. Nevertheless, the findings from this research represent an essential initial step in improving the modeling of rice productivity prediction, particularly for early maturing rice varieties. Therefore, the modeling concept developed in this study is recommended for predicting productivity and assessing nitrogen fertilization responses in these rice varieties.
5 Conclusion
The findings of this study underscore the potential of combining agronomic traits with vegetation indices data to model nitrogen response in early-maturing rice. Yield per clump, identified as a key trait, and NDVI were successfully integrated into a regression model. This regression model effectively captures the growth response of early maturing rice to varying nitrogen fertilization doses. The formulated model is represented as follows: Yield per hectare = 0.877 + 0.093 (yield per clump) + 5.363 (NDVI). This model offers practical relevance for precision agriculture by providing early, non-destructive, data-driven crop yield estimates at the farm scale. By combining measurable field characteristics with remotely sensed vegetation indices, the model supports nitrogen management adjusted to the physiological characteristics of early maturing rice varieties. It facilitates more efficient fertilizer use, reduces the risk of over- or under-application, and improves input use efficiency—key objectives in sustainable rice intensification. At the farm level, it can aid in informed fertilization decisions during critical growth stages, thereby increasing yield potential while minimizing environmental impacts. To strengthen its application, future research should validate this model across a broader range of genotypes and agroclimatic zones. Integrating time-series spectral data and applying machine learning approaches could also enhance the model’s adaptability and predictive capability under varying field conditions.
Data availability statement
The datasets presented in this study can be found in online repositories. The names of the repository/repositories and accession number(s) can be found in the article/Supplementary material.
Author contributions
YM: Funding acquisition, Methodology, Conceptualization, Writing – original draft. RP: Visualization, Data curation, Writing – review & editing, Conceptualization. NN: Formal analysis, Data curation, Writing – review & editing, Conceptualization. MF: Funding acquisition, Investigation, Supervision, Conceptualization, Writing – review & editing, Data curation, Methodology. AS: Visualization, Software, Writing – review & editing. AB: Writing – review & editing, Investigation. MQ: Investigation, Writing – review & editing. RF: Writing – review & editing, Investigation. MC: Writing – review & editing, Validation, Supervision. AN: Validation, Writing – review & editing, Supervision. MS: Funding acquisition, Writing – review & editing, Validation, Supervision. MaA: Funding acquisition, Validation, Writing – review & editing. NA: Validation, Writing – review & editing, Funding acquisition. MuA: Conceptualization, Data curation, Formal analysis, Writing – review & editing, Writing – original draft, Methodology, Visualization, Software.
Funding
The author(s) declare that financial support was received for the research and/or publication of this article. Ongoing Research Funding Program, (ORFFT-2025-041-3), King Saud University, Riyadh, Saudi Arabia, are acknowledged. We are grateful for the Collaboration Fundamental Research (PFK) grant to YM (number: 00309/UN4.22/PT.01.03/2024).
Conflict of interest
The authors declare that the research was conducted in the absence of any commercial or financial relationships that could be construed as a potential conflict of interest.
Generative AI statement
The authors declare that no Gen AI was used in the creation of this manuscript.
Any alternative text (alt text) provided alongside figures in this article has been generated by Frontiers with the support of artificial intelligence and reasonable efforts have been made to ensure accuracy, including review by the authors wherever possible. If you identify any issues, please contact us.
Publisher’s note
All claims expressed in this article are solely those of the authors and do not necessarily represent those of their affiliated organizations, or those of the publisher, the editors and the reviewers. Any product that may be evaluated in this article, or claim that may be made by its manufacturer, is not guaranteed or endorsed by the publisher.
Supplementary material
The Supplementary material for this article can be found online at: https://www.frontiersin.org/articles/10.3389/fsufs.2025.1615799/full#supplementary-material
References
Abduh, A. D. M., Padjung, R., Farid, M., Bahrun, A. H., Anshori, M. F., Nasaruddin,, et al. (2021). Interaction of genetic and cultivation technology in maize prolific and productivity increase. Pak. J. Biol. Sci. 24, 716–723. doi: 10.3923/pjbs.2021.716.723
Abdulla, A. A., and Mustafa, K. M. (2024). Performance and stability for grain yield and yield components of six-row barley cultivars under various environments in Kurdistan region-Iraq. Iraqi J. Agric. Sci. 55, 1698–1710. doi: 10.36103/gm1qqx75
Alfath, N. (2023). Adaptation strategies to climate change impacts in the area of Sidenreng Lake, Sidenreng Rappang regency. PENA Tek. J. Ilm. Ilmu-Ilmu Tek. 8:43. doi: 10.51557/pt_jiit.v8i1.1245
Alvarado, G., Rodríguez, F. M., Pacheco, A., Burgueño, J., Crossa, J., Vargas, M., et al. (2020). META-R: a software to analyze data from multi-environment plant breeding trials. Crop J. 8, 745–756. doi: 10.1016/j.cj.2020.03.010
Anshori, M. F., Musa, Y., Farid, M., Jayadi, M., Bahrun, A. H., Yassi, A., et al. (2024a). A new concept in assessing adaptability index for superior potential cropping intensity in early maturing rice. Front. Sustain. Food Syst. 8, 1–12. doi: 10.3389/fsufs.2024.1407880
Anshori, M. F., Musa, Y., Farid, M., Jayadi, M., Padjung, R., Kaimuddin, K., et al. (2024b). A comprehensive multivariate approach for GxE interaction analysis in early maturing rice varieties. Front. Plant Sci. 15, 1–12. doi: 10.3389/fpls.2024.1462981
Anshori, M. F., Purwoko, B. S., Dewi, I. S., Ardie, S. W., and Suwarno, W. B. (2021). A new approach to select doubled haploid rice lines under salinity stress using indirect selection index. Rice Sci. 28, 368–378. doi: 10.1016/j.rsci.2021.05.007
Anshori, M. F., Purwoko, B. S., Dewi, I. S., Ardie, S. W., Suwarno, W. B., and Safitri, H. (2018). Determination of selection criteria for screening of rice genotypes for salinity tolerance. SABRAO J. Breed. Genet. 50, 279–294.
Anshori, M. F., Purwoko, B. S., Dewi, I. S., Suwarno, W. B., and Ardie, S. W. (2022). Salinity tolerance selection of doubled-haploid rice lines based on selection index and factor analysis. AIMS Agric. Food. 7, 520–535. doi: 10.3934/agrfood.2022032
Ashraf, H., Ghouri, F., Baloch, F. S., Nadeem, M. A., Fu, X., and Shahid, M. Q. (2024). Hybrid rice production: a worldwide review of floral traits and breeding technology, with special emphasis on China. Plants 13, 1–25. doi: 10.3390/plants13050578
Bacelar, E., Pinto, T., Anjos, R., Morais, M. C., Oliveira, I., Vilela, A., et al. (2024). Impacts of climate change and mitigation strategies for some abiotic and biotic constraints influencing fruit growth and quality. Plants 13:1942. doi: 10.3390/plants13141942
Baharuddin, A. K., Padjung, R., Kaimuddin, K., Musa, Y., Bahrun, A. H., Yassi, A., et al. (2025). Validation assessment of nitrogen and irrigation effects on early maturing rice varieties Cakrabuana and Inpari 13 through ORYZA (v3) modeling. Front. Sustain. Food Syst. 9, 1–15. doi: 10.3389/fsufs.2025.1541691
Balitbangtan. (2021). Laporan Tahunan 2021. Badan Penelitian dan Pengembangan Pertanian, Jakarta. Available online at: https://bbpadi-litbangppid.pertanian.go.id (Accessed July 28, 2025).
Beding, P. A., Palobo, F., Tiro, B. M. W., Lewaherilla, N. E., and Soplanit, A. (2023). Rice growth response and yield to different planting systems in Merauke regency, South Papua. IOP Conf. Ser. Earth Environ. Sci. 1287, 1–8. doi: 10.1088/1755-1315/1287/1/012011
Chakrabarty, A., Ahmed, S. T., Islam, M. F. U., Aziz, S. M., and Maidin, S. S. (2024). An interpretable fusion model integrating lightweight CNN and transformer architectures for rice leaf disease identification. Ecol. Inform. 82:102718. doi: 10.1016/j.ecoinf.2024.102718
Chan, J. Y. L., Leow, S. M. H., Bea, K. T., Cheng, W. K., Phoong, S. W., Hong, Z. W., et al. (2022). Mitigating the multicollinearity problem and its machine learning approach: a review. Mathematics 10:1283. doi: 10.3390/math10081283
Coswosk, G. G., Gonçalves, V. M. L., de Lima, V. J., Souza, G. A. R., Teixeira do Amaral Junior, A., Pereira, M. G., et al. (2024). Utilizing visible band vegetation indices from unmanned aerial vehicle images for maize phenotyping. Remote Sens 16:3015. doi: 10.3390/rs16163015
Croci, M., Willcox, K. E., and Wright, S. J. (2023). Multi-output multilevel best linear unbiased estimators via semidefinite programming. Comput. Methods Appl. Mech. Eng. 413, 116130–116125. doi: 10.1016/j.cma.2023.116130
Ding, W., Xu, X., Zhang, J., Huang, S., He, P., and Zhou, W. (2021). Nitrogen balance acts an indicator for estimating thresholds of nitrogen input in rice paddies of China. Environ. Pollut. 290:118091. doi: 10.1016/j.envpol.2021.118091
DPKP DIY. (2023). Gebyar Perbenihan Tanaman Pangan 2023. Dinas Pertanian dan Ketahanan Pangan, Daerah Istimewa Yogyakarta. Available online at: https://dpkp.jogjaprov.go.id/detail-benih/Padi+Varietas+Padjadjaran+Agritan/180523/e28cd3767c95d8f636a0060e443f8244f7328f5359a3ce0b67596d1be7074abf647 (Accessed July 28, 2025).
Dwiningsih, Y. (2023). Utilizing the genetic potentials of traditional rice varieties and conserving rice biodiversity with system of rice intensification management. Agronomy 13:3015. doi: 10.3390/agronomy13123015
Farid, M., Anshori, M. F., Musa, Y., Iswoyo, H., and Sakinah, A. I. (2021). Interaction of rice salinity screening in germination and seedling phase through selection index based on principal components. Chil. J. Agric. Res. 81, 368–377. doi: 10.4067/S0718-58392021000300368
Farid, M., Nasaruddin, N., Musa, Y., Anshori, M. F., Ridwan, I., Hendra, J., et al. (2020). Genetic parameters and multivariate analysis to determine secondary traits in selecting wheat mutant adaptive on tropical lowlands. Plant Breed. Biotechnol. 8, 368–377. doi: 10.9787/PBB.2020.8.4.368
Fikri, M., Farid, M., Musa, Y., Anshori, M. F., and Nur, A. (2023a). Selected agronomic traits and drone application in corn yield prediction. SABRAO J. Breed. Genet. 55, 508–515. doi: 10.54910/sabrao2023.55.2.22
Fikri, M., Farid, M., Musa, Y., Anshori, M. F., Padjung, R., and Nur, A. (2023b). Multivariate analysis in the development of technology packages for corn cultivation by adding fertilizer to compost. Chil. J. Agric. Res. 83, 471–483. doi: 10.4067/S0718-58392023000400471
Gao, J., Zeng, W., Ren, Z., Ao, C., Lei, G., Gaiser, T., et al. (2023). A fertilization decision model for maize, rice, and soybean based on machine learning and swarm intelligent search algorithms. Agronomy 13:1400. doi: 10.3390/agronomy13051400
Garbanzo, G., Cameira, M. d. R., and Paredes, P. (2024). The mangrove swamp rice production system of Guinea Bissau: identification of the main constraints associated with soil salinity and rainfall variability. Agronomy 14:468. doi: 10.3390/agronomy14030468
Grinberg, N. F., Orhobor, O. I., and King, R. D. (2020). An evaluation of machine-learning for predicting phenotype: studies in yeast, rice, and wheat. Mach. Learn. 109, 251–277. doi: 10.1007/s10994-019-05848-5
Hang, S., Wang, Q., Wang, Y., and Xiang, H. (2024). Evolution of rice cultivar performance across China: a multi-dimensional study on yield and agronomic characteristics over three decades. Agronomy 14:2780. doi: 10.3390/agronomy14122780
Hashim, N., Ali, M. M., Mahadi, M. R., Abdullah, A. F., Wayayok, A., Mohd Kassim, M. S., et al. (2024). Smart farming for sustainable rice production: an insight into application, challenge, and future prospect. Rice Sci. 31, 47–61. doi: 10.1016/j.rsci.2023.08.004
Hidayah, B., Jaya, A., Puspita, A. I. D., and M, B. R. (2021). Design of groundwater sustain irrigation network system in Panca Lautang area, Sidrap regency, South Sulawesi. IOP Conf. Ser. Earth Environ. Sci. 921:012084. doi: 10.1088/1755-1315/921/1/012084
Indriasari, N., Roswintiarti, O., Kustiyo,, Rasyidy, F. H., Dewanti, R., Indradjad, A., et al. (2024). Spatial-temporal dynamics of paddy productivity on the north coast of Java Island, Indonesia based on the principal component analysis of MODIS NDVI anomaly data. IOP Conf. Ser. Earth Environ. Sci. 1291, 1–15. doi: 10.1088/1755-1315/1291/1/012016
IRRI. (2016). Overview of AWD. http://books.irri.org/AWD_brochure.pdf (Accessed March 27, 2025).
Islam, M. D., Di, L., Qamer, F. M., Shrestha, S., Guo, L., Lin, L., et al. (2023). Rapid rice yield estimation using integrated remote sensing and meteorological data and machine learning. Remote Sens 15:2374. doi: 10.3390/rs15092374
Jamal, M. R., Kristiansen, P., Kabir, M. J., and Lobry de Bruyn, L. (2023). Challenges and adaptations for resilient rice production under changing environments in Bangladesh. Land 12, 1–21. doi: 10.3390/land12061217
Jiang, Z., Chen, Q., Liu, D., Tao, W., Gao, S., Li, J., et al. (2024). Application of slow-controlled release fertilizer coordinates the carbon flow in carbon-nitrogen metabolism to effect rice quality. BMC Plant Biol. 24, 621–615. doi: 10.1186/s12870-024-05309-9
Kleinknecht, K., Möhring, J., Singh, K. P., Zaidi, P. H., Atlin, G. N., and Piepho, H. P. (2013). Comparison of the performance of best linear unbiased estimation and best linear unbiased prediction of genotype effects from zoned Indian maize data. Crop Sci. 53, 1384–1391. doi: 10.2135/cropsci2013.02.0073
Ko, J., Shin, T., Kang, J., Baek, J., and Sang, W. G. (2024). Combining machine learning and remote sensing-integrated crop modeling for rice and soybean crop simulation. Front. Plant Sci. 15, 1–12. doi: 10.3389/fpls.2024.1320969
Kumar, S., Vimal, S. C., Singh, J., Gupta, R., Yaduvanshi, N., and Singh, Y. P. (2024). Path coefficient analysis of rice (Oryza sativa L.) genotype under laboratory conditions. Int. J. Plant Soil Sci. 36, 155–162. doi: 10.9734/ijpss/2024/v36i14344
Lai, J.-K., and Lin, W.-S. (2021). Assessment of the rice panicle initiation by using NDVI-based vegetation indexes. Appl. Sci. 11:10076. doi: 10.3390/app112110076
Li, T., Ali, J., Marcaida, M., Angeles, O., Franje, N. J., Revilleza, J. E., et al. (2016). Combining limited multiple environment trials data with crop modeling to identify widely adaptable rice varieties. PLoS One 11:e0164456. doi: 10.1371/journal.pone.0164456
Li, S., Wu, F., Zhou, Q., and Zhang, Y. (2024). Adopting agronomic strategies to enhance the adaptation of global rice production to future climate change: a meta-analysis. Agron. Sustain. Dev. 44:23. doi: 10.1007/s13593-024-00963-7
Limbongan, Y. L., Driyunitha,, Parari, T. Y., and Sjahril, R. (2023). Performance of agronomic characteristics and path analysis of the highland new plant types of rice. IOP Conf. Ser. Earth Environ. Sci. 1230, 1–9. doi: 10.1088/1755-1315/1230/1/012122
Mu’min, M., Riadi, M., and Jayadi, M. (2024). Correlation and path analysis of early maturing rice (Oryza sativa L). treated with zinc at various growth phases. SABRAO J. Breed. Genet. 56, 547–556. doi: 10.54910/sabrao2024.56.2.8
Musa, Y., Farid, M., Nasaruddin, N., Anshori, M. F., Adzima, A. F., Maricar, M. F., et al. (2023). Sustainability approach in cropping intensity (CI) 400 through optimizing the dosage of compost and chemical fertilizers to early maturing rice varieties based on multivariate analysis. J. Agric. Food Res. 14:100907. doi: 10.1016/j.jafr.2023.100907
Nasaruddin, N., Farid, M., Iswoyo, H., and Anshori, M. F. (2024). Utilizing stress tolerance index and principal component analysis for rice selection in hydroponic drought screening based on physiological traits. Int. J. Agric. Biosci. 13, 736–743. doi: 10.47278/journal.ijab/2024.176
Nazir, M. J., Li, G., Nazir, M. M., Zulfiqar, F., Siddique, K. H. M., Iqbal, B., et al. (2024). Harnessing soil carbon sequestration to address climate change challenges in agriculture. Soil Tillage Res. 237:105959. doi: 10.1016/j.still.2023.105959
Noviana, I., Haryati, Y., Sari, R., and Sunandar, N. (2021). Adaptation to climate change by using drought tolerant and early maturing rice varieties in Majalengka regency. IOP Conf. Ser. Earth Environ. Sci. 648, 1–7. doi: 10.1088/1755-1315/648/1/012118
Ortiz-Torres, G., Zurita-Gil, M. A., Rumbo-Morales, J. Y., Sorcia-Vázquez, F. D. J., Gascon Avalos, J. J., Pérez-Vidal, A. F., et al. (2024). Integrating actuator fault-tolerant control and deep-learning-based NDVI estimation for precision agriculture with a hexacopter UAV. Agri 6, 2768–2794. doi: 10.3390/agriengineering6030161
Paul, S., Das, P., Kashem, A., and Islam, N. (2024). Sustainable of rice husk ash concrete compressive strength prediction utilizing artificial intelligence techniques. Asian J. Civ. Eng. 25, 1349–1364. doi: 10.1007/s42107-023-00847-3
Prakash, S., Reddy, S. S., Chaudhary, S., Vimal, S. C., and Kumar, A. (2024). Multivariate analysis in rice (Oryza sativa L.) germplasms for yield attributing traits. Plant Sci. Today 11, 64–75. doi: 10.14719/pst.2231
Quille-Mamani, J., Ramos-Fernández, L., Huanuqueño-Murillo, J., Quispe-Tito, D., Cruz-Villacorta, L., Pino-Vargas, E., et al. (2025). Rice yield prediction using spectral and textural indices derived from UAV imagery and machine learning models in Lambayeque, Peru. Remote Sens 17:632. doi: 10.3390/rs17040632
Rezvi, H. U. A., Tahjib-Ul-Arif, M., Azim, M. A., Tumpa, T. A., Tipu, M. M. H., Najnine, F., et al. (2023). Rice and food security: climate change implications and the future prospects for nutritional security. Food Energy Secur. 12, 1–17. doi: 10.1002/fes3.430
Rocha, J. R. d. A. S. d. C., Machado, J. C., and Carneiro, P. C. S. (2018). Multitrait index based on factor analysis and ideotype-design: proposal and application on elephant grass breeding for bioenergy. GCB Bioenergy 10, 52–60. doi: 10.1111/gcbb.12443
Safitri, D. E., Ahmad, A., and Nathan, M. (2021). Study of soil management in rice fields in Bantimurung District Maros regency. IOP Conf. Ser. Earth Environ. Sci. 807:042008. doi: 10.1088/1755-1315/807/4/042008
Saleng, M. A., Hasriyanti,, Yusuf, M., Amal,, and Syarif, E. (2025). Rainfall pattern in Maros district South Sulawesi using the isohyet method. J. Multidis. Madani 5, 401–409. doi: 10.55927/mudima.v5i5.255
Sary, D. N., Badriyah, L., Sihombing, R. D., Syauqy, T. A., Mustikarini, E. D., Prayoga, G. I., et al. (2022). Estimation of heritability and association analysis of agronomic traits contributing to yield on upland rice (Oryza sativa L.). Plant Breed. Biotechnol. 10, 232–243. doi: 10.9787/PBB.2022.10.4.232
Schneider, P., and Asch, F. (2020). Rice production and food security in Asian mega deltas—a review on characteristics, vulnerabilities and agricultural adaptation options to cope with climate change. J. Agron. Crop Sci. 206, 491–503. doi: 10.1111/jac.12415
Seck, F., Covarrubias-Pazaran, G., Gueye, T., and Bartholomé, J. (2023). Realized genetic gain in rice: achievements from breeding programs. Rice 16:61. doi: 10.1186/s12284-023-00677-6
Semeskandi, M. N., Mazloom, P., Arabzadeh, B., Moghadam, M. N., and Ahmadi, T. (2024). Application of correlation coefficients and principal components analysis in stability of quantitative and qualitative traits on rice improvement cultivation. Braz. J. Biol. 84, 1–14. doi: 10.1590/1519-6984.268981
Shrestha, J., Kandel, M., Subedi, S., and Shah, K. K. (2020). Role of nutrients in rice (Oryza sativa L.): a review. Agrica 9:53. doi: 10.5958/2394-448x.2020.00008.5
Singh Yadav, S. P., Bhandari, S., Ghimire, N. P., Mehata, D. K., Majhi, S. K., Bhattarai, S., et al. (2024). Genetic Variability, Character Association, Path Coefficient, and Diversity Analysis of Rice (Oryza sativa L.) Genotypes Based on Agro-Morphological Traits. Int. J. Agron 2024. doi: 10.1155/2024/9946332
Sudaryono, T., Prahardini, P. E. R., Purnama, S., and Fidiyawati, E. (2023). Performance of five superior varieties of rice in specific agroecology of rice land in Jombang regency. IOP Conf. Ser. Earth Environ. Sci. 1172:012013. doi: 10.1088/1755-1315/1172/1/012013
Sutrisna, N., Surdianto, Y., Susanto, B., Susanto, H., Wiratno,, Haryati, Y., et al. (2024). Assessment of increasing rice plant index 400 with the application of environmentally friendly rice cultivation technology in irrigation land, Banjar City, West Java. IOP Conf. Ser. Earth Environ. Sci. 1364, 1–9. doi: 10.1088/1755-1315/1364/1/012054
Takai, T. (2024). Potential of rice tillering for sustainable food production. J. Exp. Bot. 75, 708–720. doi: 10.1093/jxb/erad422
Tang, P., Ren, A., Jiang, Z., Wang, R., Cui, K., Wu, X., et al. (2024). Evaluation of quinoa varieties for adaptability and yield potential in low altitudes and correlation with agronomic traits. Agronomy 14:852. doi: 10.3390/agronomy14040852
Wang, J., Chen, C., Wang, J., Yao, Z., Wang, Y., Zhao, Y., et al. (2025). Ndvi estimation throughout the whole growth period of multi-crops using RGB images and deep learning. Agronomy 15:63. doi: 10.3390/agronomy15010063
Wang, K., Pu, X., and Li, B. (2024). Automated phenotypic trait extraction for rice plant using terrestrial laser scanning data. Sensors 24:4322. doi: 10.3390/s24134322
Wijayanti, E. B., Setiadi, D. R. I. M., and Setyoko, B. H. (2024). Dataset analysis and feature characteristics to predict rice production based on eXtreme gradient boosting. J. Comput. Theor. Appl. 1, 299–310. doi: 10.62411/jcta.10057
Zhang, J., Lin, X., Jiang, C., Hu, X., Liu, B., Liu, L., et al. (2024). Predicting rice phenology across China by integrating crop phenology model and machine learning. Sci. Total Environ. 951:175585. doi: 10.1016/j.scitotenv.2024.175585
Zhang, X., Sabo, R., Rosa, L., Niazi, H., Kyle, P., Byun, J. S., et al. (2024). Nitrogen management during decarbonization. Nat. Rev. Earth Environ. 5, 717–731. doi: 10.1038/s43017-024-00586-2
Zhang, J., Tong, T., Potcho, P. M., Huang, S., Ma, L., and Tang, X. (2020). Nitrogen effects on yield, quality and physiological characteristics of giant rice. Agronomy 10:111816. doi: 10.3390/agronomy10111816
Zhang, Y., Ye, C., Su, Y., Peng, W., Lu, R., Liu, Y., et al. (2022). Soil acidification caused by excessive application of nitrogen fertilizer aggravates soil-borne diseases: evidence from literature review and field trials. Agric. Ecosyst. Environ. 340:108176. doi: 10.1016/j.agee.2022.108176
Keywords: model development, NDVI, Oryza sativa, rice yield, stepwise regression
Citation: Musa Y, Padjung R, Nasaruddin N, Farid M, Soma AS, Baharuddin AK, Al Qautzar MF, Fakhri RM, Casimero M, Nur A, Seleiman MF, Alotaibi M, Ali N and Anshori MF (2025) Comprehensive evaluation of nitrogen fertilization impact on early maturing rice varieties using multivariate analysis and vegetation indices. Front. Sustain. Food Syst. 9:1615799. doi: 10.3389/fsufs.2025.1615799
Edited by:
Mohamed Ait-El-Mokhtar, University of Hassan II Casablanca, MoroccoReviewed by:
Manojit Chowdhury, Indian Agricultural Research Institute (ICAR), IndiaShijie Shi, Yangtze University, China
Copyright © 2025 Musa, Padjung, Nasaruddin, Farid, Soma, Baharuddin, Al Qautzar, Fakhri, Casimero, Nur, Seleiman, Alotaibi, Ali and Anshori. This is an open-access article distributed under the terms of the Creative Commons Attribution License (CC BY). The use, distribution or reproduction in other forums is permitted, provided the original author(s) and the copyright owner(s) are credited and that the original publication in this journal is cited, in accordance with accepted academic practice. No use, distribution or reproduction is permitted which does not comply with these terms.
*Correspondence: Muhammad Fuad Anshori, ZnVhZC5hbnNob3JpQHVuaGFzLmFjLmlk