 Boowook Kim1,2
 Jae Hoo Shin2Hoi Pin Kim3Mi Seong Jo3Hee Sang Kim3Jong Sung Lee2Hong Ku Lee3Hyuk Cheol Kwon4Sung Gu Han4Noeul Kang5
 Mary Gulumian6,7Dhimiter Bello8
 Il Je Yu3,9*
- 1Institute of Health and Environment, Seoul National University, Seoul, Korea
- 2Institute of Occupation and Environment, Korea Workers’ Compensation and Welfare Service, Incheon, Korea
- 3Aerosol Toxicology Research Center, HCTm, Incheon, Korea
- 4Toxicology Laboratory, Sanghuh College of Life Science, Konkuk University, Seoul, Korea
- 5Department of Respiratory Medicine, Samsung Hospital, Seoul, Korea
- 6Haematology and Molecular Medicine, University of the Witwatersrand, Johannesburg, South Africa
- 7Water Research Group, Unit for Environmental Sciences and Management, North West University, Potchefstroom, South Africa
- 8Department of Biomedical and Nutritional Sciences, University of Massachusetts, Lowell, MA, United States
- 9HCT, Co., Incheon, Korea
This study monitored particulates, and volatile organic compounds (VOCs) emitted from 3-D printers using acrylonitrile-butadiene-styrene copolymer (ABS) filaments at a workplace to assess exposure before and after introducing exposure mitigation measures. Air samples were collected in the printing room and adjacent corridor, and real-time measurements of ultrafine and fine particle were also conducted. Extensive physicochemical characterizations of 3-D printer emissions were performed, including real-time (size distribution, number concentration) nanoparticle characterization, size-fractionated mass distribution and concentration, as well as chemical composition for metals by ICP-MS and VOCs by GC-FID, real-time VOC monitors, and proton-transfer-reaction time-of-flight mass spectrometer (PTR-TOF-MS). Air sampling showed low levels of total suspended particulates (TSP, 9–12.5/m3), minimal levels (1.93–4 ppm) of total volatile organic chemicals (TVOC), and formaldehyde (2.5–21.7 ppb). Various harmful gases, such as formaldehyde, acrolein, acetone, hexane, styrene, toluene, and trimethylamine, were detected at concentrations in the 1–100 ppb by PTR-TOF-MS when air sample was collected into the Tedlar bag from the front of the 3-D printer. Ultrafine particles having an average particle size (30 nm count median diameter and 71 nm mass median diameter) increased during the 3-D printing operation. They decreased to the background level after the 3-D printing operation, while fine particles continually increased after the termination of 3-D printing to the next day morning. The exposure to 3-D printer emissions was greatly reduced after isolating 3-D printers in the enclosed space. Particle number concentration measured by real-time particle counters (DMAS and OPC) were greatly reduced after isolating 3-D printers to the isolated place.
Introduction
The newly developed technology of 3-D printing, a collective term for additive manufacturing or fused deposition modeling (FFD), is penetrating the marketplace fast and can be found in many teaching laboratories in universities and 1–12 grade schools, as well as in research laboratories and industrial settings. During 3-D printing, objects are manufactured from a computer-assisted design model by successively adding material layer by layer. The composition of the filament used in 3-D printing is modified to meet final product specifications, and increasingly, more filament options are available. Acrylonitrile-butadiene-styrene copolymer (ABS) or Polylactic acid (PLA) filaments are used for fused filament fabrication (FFF) or FFD printing machines. ABS filaments require a higher extruder nozzle to form thermoplastic resins in the solid-state than PLA which melts at a lower temperature (Kim et al., 2015; Azimi et al., 2016; Floyd et al., 2017). ABS printing has been known to emit micro- or nano-sized particles and volatile organic chemicals (VOCs) when ABS is processed and converted to the molten stage. Several publications on particle emission from the 3-D printing reported emissions of ultrafine (or nanoscale) particles (defined as 1–100 nm) (Kim et al., 2015; Azimi et al., 2016; Yi et al., 2016; Floyd et al., 2017; Zhang et al., 2019). Nanoparticle emissions present a health concern for operators of 3-D printers, as well as bystanders/occupants who share the same place. Recently, 3-D printing has been regarded as an advanced material consisting of various substances for new types of manufacturing and processing. Risk assessment and management have been discussed at the OECD and EU levels.
The health effects caused by 3-D printing exposure drew attention in Korea recently, after two teachers who used 3-D printers frequently for teaching science courses in their high schools were diagnosed with sarcoma. Moreover, four more teachers in three different high schools were confirmed to have developed cancer, three with sarcomas and one with another type of cancer. 3-D printers were widely distributed and used in more than 50% of these elementary, middle, and high schools (Ohmy News, 2020). Although there is a need for surveillance on schools using 3-D printers, such studies were not possible at this time due to schools closure caused by the new coronavirus pandemic. In response to these health concerns, the current workplace under investigation (a factory manufacturing headphone hangers) took a precautionary. In this study, we attempted to characterize particles and VOC emissions from ABS 3-D printers during the operation and after the introduction of mitigation measures.
Materials and Methods
Sampling Sites
The current study measured the 3-D printer emission particles and VOC concentrations at a workplace equipped with two 3-D printers (Sindoh - 3-DWOX 7X and AFINIA 3-D - H800+) and Universal Robots (UR). In addition, VOC sampling was conducted outside the corridor of the workplace. Figure 1A shows a description of the workplace layout, sampling sites, and other contextual information. Four male workers were located in front of Tables 1–4. The workers were computer programmers involved in developing the facility management system and UR robot operation. The UR robots were not operated on the day of the tests. The dimension of the room was 6.75 m × 11.25 m × 2.72 m (206.55 m3). The workplace had only one entrance door and no window and was equipped with three fresh air inlets and three returns located on the ceiling. One ceiling-mounted air conditioner unit was operated during the workday. The manufacturing computer-aided design (CAD) objects consumed 46 and 102 g of ABS filament (containing 95–100% ABS; 0–5% stabilizer; melting point 180–200°C; Plasil, 3Dink Inc, Yangju, Korea) for printers 1 and 2, respectively, to manufacture headphone hangers (Supplementary Figure S1). The sequence of events for a 3-D printing workplace was described in Supplementary Table S1.
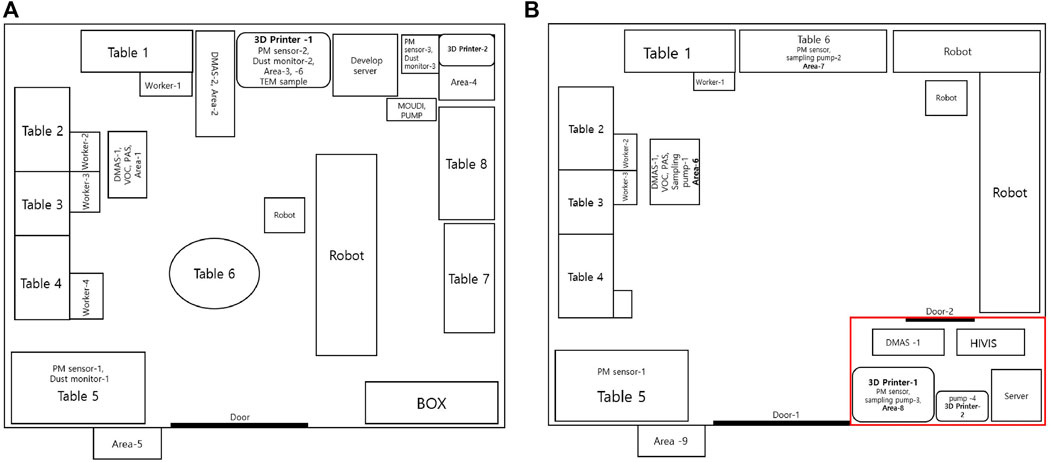
FIGURE 1. (A) Workplace layout after mitigation measure. Mitigation measure dimension (red line): 2.48 m × 1.67 m × 2.72 m. DMAS, Differential mobility analyze system; PAS, photoelectric aerosol sensor; PM sensor, particulate matter sensor. (B) Workplace layout, 3-D printer location, and sampling locations. Dimension: 6.75 m × 11.25 m × 2.72 m. DMAS, Differential mobility analyze system; PAS, photoelectric aerosol sensor; PM sensor, particulate matter sensor.
Air Sampling
Figure 1A shows the workplace setup and layout, air sampling sites for area sampling, and real-time monitoring sites. The area air samples were taken by drawing air through polyvinyl chloride (PVC) filters in sampling cassettes (0.45 µm nominal pore size, 37 mm diameter, 2-inch conductive cowl) obtained from Pall Corp (P/N 64,678; Michigan United States). The filter samples for particles were collected from the location described in Figure 1A, and sampling pumps (MSA, Escort Elf pump) were operated at a flow rate of 1.5–2.0 L/min. The sampling was performed during the normal work period from 08:30 to 17:30.
Real-Time Aerosol Monitoring
Two differential mobility analyzing systems (DMAS) combining differential mobility analyzer (DMA-20, 4220, range 6–225 nm, HCT Co., Ltd. Korea; TSI, United States) and condensation particle counters (CPC, 3775, size range 4 nm- 1, TSI INC., Shoreview, MN 0–108 particles/cm3 detection range) were used to monitor the particle size distribution with an electrical mobility diameter ranging from 15 to 710.5 nm. Meanwhile, three types of dust monitors (Model 1.109, range 0.25–32, Grimm, Douglasville, GA; Model PS-1601PM, range 0.25–10, HCTm, Co. Incheon, Korea; PS-1601PMe, range 0.25–10 μm, HCTm, Co. Incheon, Korea) were used to monitor the particle size distribution with a diameter ranging from 0.25 to 32 µm. The workplace air was sampled at a flow rate of 0.3 and 1.2 L/min for the DMAS and dust monitor, respectively. The DMAS scanned the particle sizes at a time resolution of 2.5 min (120 s for up-scan and 30 s for retrace), while the average time for the dust monitor was 1 min. The real-time aerosol monitoring lasted 3 days at the 3-D printing workplace. All the sequences of events that might affect particle monitoring were recorded (Supplementary Table S1).
Air Sampling for Volatile Organic Chemicals (VOCs) and Monitoring Polycyclic Aromatic Hydrocarbons (PAHs)
Benzene, styrene, and formaldehyde were measured at six locations by area sampling using Coconut Charcoal sorbent tubes (SKC Cat. 226-01) (NIOSH (National Institute of Occupational Safety and Health), 2003). Three grab samples were collected from 8:30–11:50 (200 min), 13:30–16:00 (150 min), and 16:20–17:40 (80 min) to monitor changes in concentration over time and to prevent possible analyte breakthrough from the sorbent tube. For measurement and analysis, benzene and styrene were sampled with a low flow (50 ml/min) air sampling pump (Model LFS-113; Gilian Instrument Corp., West Cladwell, NJ, United States) in SKC Coconut Charcoal sorbent tubes (SKC Cat. 226-01) (Stoehr et al., 2015). The samples were analyzed with a gas chromatography-flame ionization detector (GC-FID). Formaldehyde was analyzed by high-performance liquid chromatography - ultraviolet light detector (HPLC-UV) after flow-through with 2,4-dinitrophenylhydrazine coated silica gel tube (SKC Cat. No. 226-119). The actual sampling flow rate of the pump was calculated as an average value after measuring the flow rate before and after the measurement using a DryCal® primary calibration standard (BIOS, Butler, NJ, United States). The analysis was conducted by the Institute of Occupation and Environment, Korea Workers’ Compensation and Welfare Service, which participates in the American Industrial Hygiene Association (AIHA) Proficiency Analytical Testing (PAT) program. Analysis limit of detection (LOD) was 0.0055 mg/sample for benzene, 0.0088 mg/sample for styrene, and 0.0018 μg/sample for formaldehyde. The real-time TVOC concentration was measured using the EVM-7 Multiparameter Environmental Monitor (Quest Technologies, Inc., United States). The real-time concentration of particle-bound PAH was measured with a real-time photoelectric aerosol sensor PAH 2000 (EcoChem Analytics, League City, TX, United States).
Proton-Transfer-Reaction Time-Of-Flight Mass Spectrometer (PTR-TOF-MS) Analysis
Since most of the VOCs, evaluated by the NIOSH NMAM 1301 (GC FID) (NIOSH (National Institute of Occupational Safety and Health), 1994a), were not detected, further analysis was performed using a high resolution and high sensitivity PTR-TOF-MS (IONICON Analytik, AUT). When the 3-D printer was running, 10 L of air was collected in the Tedlar bag using a grab air sampling pump (SKC Cat. No. 222–2301) from the front of the printer. The air collected in the Tedlar bag was directly injected into the PTR-TOF-MS to analyze the VOCs.
Mass Size Distribution Measurement (Mass Median Aerodynamic Diameter, MMAD)
The MMAD of particles generated from the 3-D printer was measured using a foil filter for each stage (diameter, 47 mm; pore size, 5 mm; SKC, Inc., Eighty-Four, PA, United States) with a Nano MOUDI impactor (MOUDI 125 NR, MSP Co., MN, United States) composed of 13 stages (0.01, 0.018, 0.032, 0.056, 0.10, 0.18, 0.32, 0.56, 1.0, 1.8, 3.2, 5.6, and 10 mm). The geometric standard deviation (GSD) for the MMAD was derived from the cumulative mass distribution of the micro-orifice uniform deposition impactor (MOUDI).
Transmission Electron Microscopy (TEM)
An electrostatic precipitator ESPnano (Model 100; ESPnano, Spokane, WA, United States), operating at the standard sampling flow rate of 0.1 L/min, was used to collect aerosol particles on electron microscopy grids. The TEM nickel grid (Formvar/Carbon 200 mesh, TEDpella, CA, United States) or holey TEM grid (Quantifoil 656-200-Cu; Tedpella, Inc., Redding, CA, United States) were further examined under a transmission electron microscope (TEM, H - 7650; Hitachi, Tokyo, Japan) equipped with an EDX (energy dispersive X-ray analyzer, TM200; Oxford Instruments PLC, Oxfordshire, United Kingdom) at an acceleration voltage of 100 kV (NIOSH (National Institute of Occupational Safety and Health), 1994b).
Exposure Assessment After Mitigation Measure
After noticing the 3-D printer emission exposure status, the company took an exposure mitigation measure, as shown in Figure 1B. Two 3-D printers were isolated to the enclosed space (which has ventilation on the ceiling). Real-time aerosol monitoring and formaldehyde sampling were conducted inside and outside of the enclosed space.
Results
Indoor Air Quality in the Workplace
The workplace average temperature was 26.9°C and ranged 22.7°C at 8:33 to 28.8°C at 16:47. Relative humidity ranged from 37.3% at 8:41 to 31.1% at 13:44. Carbon dioxide concentrations were 550 ppm at 8:44–9:08 and 1515 ppm at 16:52 (Supplementary Table S1).
Total Suspended Particle (TSP) Concentration
TSP concentrations determined from gravimetric analysis during the 9-h of work shift at various locations ranged 0.008–0.011 mg/m3. Sampling inside of the housing of the printer resulted in a non-detectable mass change on the filter concentration (limit of detection µg/m3) (Table 1).
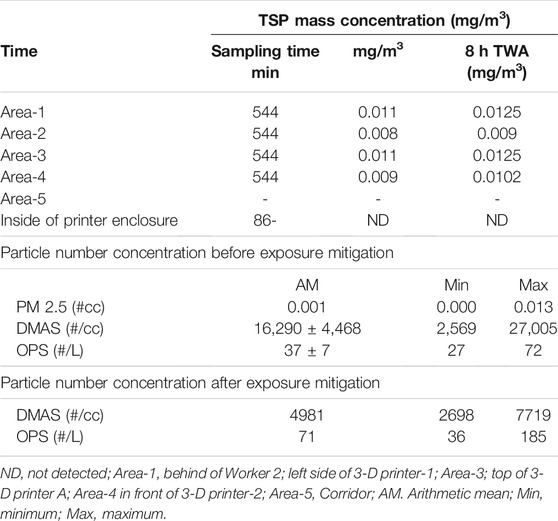
TABLE 1. Concentrations of total suspended particulate (TSP) at various sites and particle concentration measured by DMAS, PM sensor, and OPS.
Benzene, Styrene, Total VOC (TVOC), Formaldehyde, and PAH Concentrations
Benzene and styrene measured at various time points were not detected. The TVOC concentrations ranged from 0.2 to 4 ppm with an average of 1.93 ppm. Formaldehyde at various locations was detected at 2.5–21.7 ppb, whereas the inside of the printer was 19.7 ppb, much less than ACGIH TLV-TWA (100 ppb) (2017). Total PAH levels from PAS 2000 were less than 1 ng/m3 throughout the measurement time (Table 2).
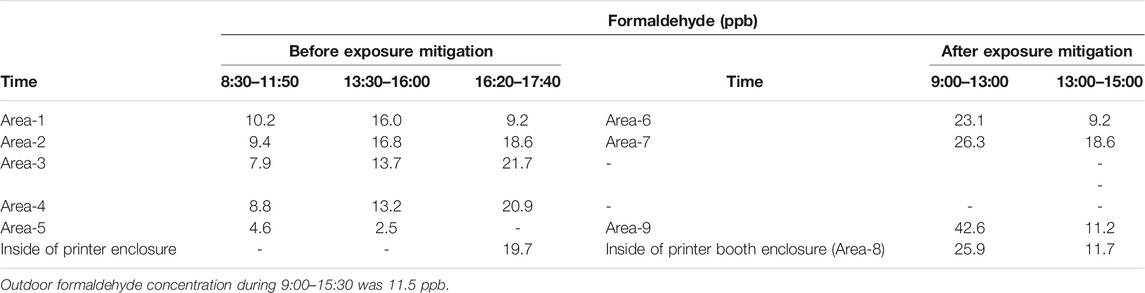
TABLE 2. Concentrations of formaldehyde before and after via installation of a ventilated enclosure.
Concentrations of VOCs by PTR-TOF-MS
A wide variety of harmful gases were detected at low concentrations down to the ppb level (Table 3). However, acetone was at a high ppm concentration because the surface of ABS products was intermittently wiped with acetone. Even though no wiping of ABS surfaces was conducted on the day of this measurement, it is believed that some acetone was residue leftover from previous work. The sum of individual VOCs was 2.085 ppb, which was similar to the average 1.93 ppb result by the TVOC sensor.

TABLE 3. Concentrations of VOCs by PTR-TOF-MS.
Real-Time Monitoring of Particle Measurement and Formaldehyde Concentration Before and After Enclosure
UFPs measured by DMAS ranged between 2,569–27,005 particle/cm3 with an average of 16,290 ± 4,468 particle/cm3 during the operation of 3-D printers (Table 1). After switching on the printers, particle number concentration began to increase. When the printers were turned off at 6 PM, the numbers decreased to less than 2000 (Figure 2A). On the other hand, fine particle numbers measured from 16:00 on the day before 3-D printer operation to 8:00 on the day after printer operation showed a different pattern from DMAS measurement. Before starting 3-D printers, fine particle concentration showed 2000–3000 particle numbers/liter and reached approximately 18,000 particle/liter at the start of 3-D printers and continuously increased to 40,000–50,000 particles/liter until the next day morning (Figure 2B). Particle number measurement conducted inside the 3-D printer enclosure resulted in no data. It could be caused by a high-temperature process affecting DMAS measurement or not measurable size by DMAS due to the vapor state of the emission. Our result indicates that the UFPs (∼30 nm) emitted from 3-D printers slowly transformed into fine particles larger than 200 nm (Supplementary Figure S1).
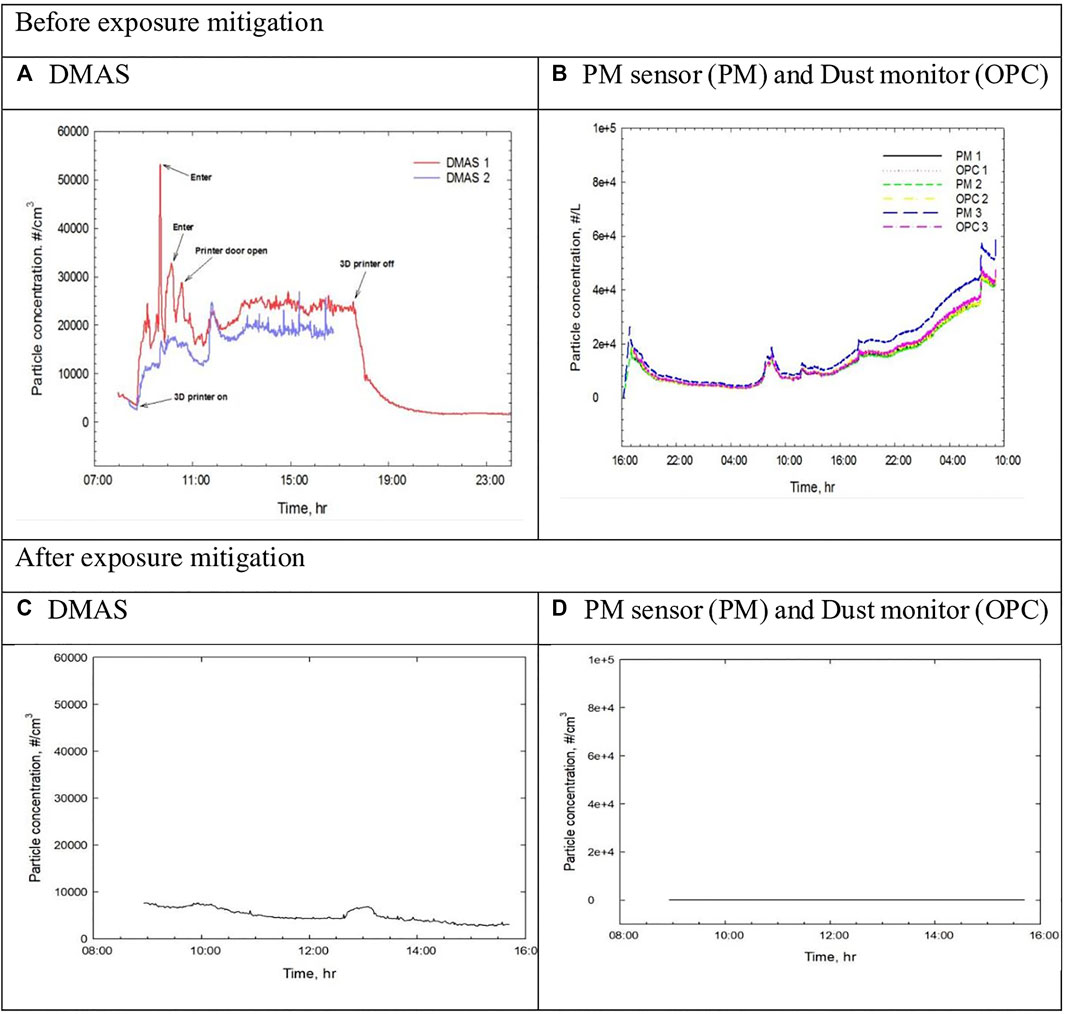
FIGURE 2. Real-time particle measurement in 3-D printing workplace. (A), DMAS; (B), PM sensor (PM) and Dust monitor (OPC).
After the initial exposure assessment, the management of the workplace noticed the status of exposure to the 3-D printer emission and initiated exposure mitigation. They isolated the two 3-D printers in the enclosed space, which has ventilation on the ceiling (Figure 1B). The nanoscale particles originating from the 3-D printers were greatly reduced after mitigation measure (Figure 2C), while particles detected by OPC increased little (Figure 2D). After the mitigation measure, formaldehyde at various locations described in Figure 1B ranged 23.1–42.6 ppb at 9:00–13:00 and 9.2–18.6 ppb at 13:00–15:00. The higher concentrations of formaldehyde in the morning time could be caused by floor cleaning and waxing, which may use formaldehyde-containing agents, while the concentrations were low in the afternoon (Table 2).
The Size Distribution and MMAD of Ultrafine Particles
Count median diameter (CMD) measured by DMAS was 30 nm (Figure 3A), and MMAD and GSD measured by nano-MOUDI were 71 nm and 2.731, respectively (Figure 3B). Size distribution measured by dust monitors showed the formation of slightly smaller particles compared to the background (Supplementary Figure S2).
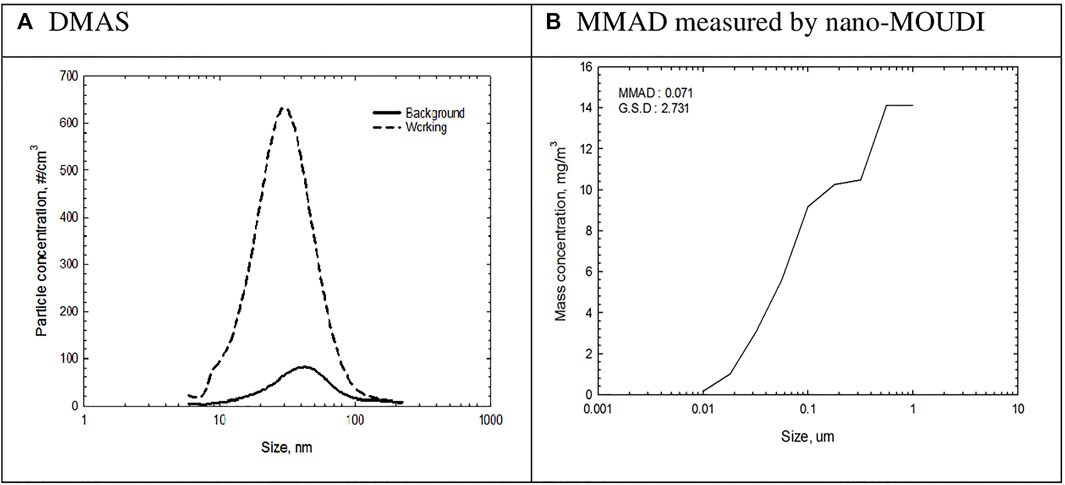
FIGURE 3. Size distribution of 3-D printer emissions measured by DMAS and Nano-MOUDI. (A) Result of DMAS, (B) Result of median mass aerodynamic diameter (MMAD) by nano-MOUDI.
TEM Analysis
Well dispersed ABS particles were observed with TEM, where some particles were aggregated (Figures 4A,B). EDX analysis indicated that most particles consisted of carbon when subtracting Cu and Ni as grid and Al as holder compositions (Figure 4D). Unexpectedly, copper metal nanoparticles were also observed, which are believed to be impurities added (pigments, etc.) to ABS materials. The ABS filament was further analyzed by ICP-MS, and the results showed that ABS filament contained some impurity metals (Al 62 ppm; Cr 2.6 ppm; Fe 13 ppm; Cu 1.1 ppm). However, metal nanoparticles were observed only in some areas of the grid, whereas carbon ABS nanoparticles were evenly distributed in a wide area of the grid.

FIGURE 4. TEM micrograph of ABS particles and EDX-analysis.
Discussion
This study has conducted a comprehensive characterization of exposures, including VOCs, particle number and mass concentration, size distribution, and elemental composition/morphology. Exposure assessment documented low levels of total suspended particulates (9–12.5 µg/m3), minimal levels (1.93–4 ppm) of TVOC as measured by real-time monitor, and formaldehyde (2.5–21.7 ppb), with no detectable levels of benzene and styrene by GC-FID. However, PTR-TOF-MS analysis of grab samples detected various chemicals at low concentrations, the majority of which were in the low ppb. The reason is that PTR-TOF-MS has much better analysis sensitivity than GC/FID. UFPs emitted from 3-D printers had an average particle size of 30 nm CMD and 71 nm MMAD, and their size continued to increase after the termination of 3-D printing through the night until the next day morning. The particle number concentration reduced greatly after installation of an ventilated enclosure for the 3-D printers.
Our particle size measurement of 3-D printing emission from the inside of the 3-D printer-1 enclosure indicated that 3-D printer-1 emissions generated as vapors of semi-volatile organics could not be measured with DMAS, and as they cooled off, the vapors condensed to form the nucleation stage, where their size is measurable by DMAS, to further coagulation stage where their size is measurable by OPC or dust monitor. In contrast, emissions taken from 3-D printer-2 showed 1.73-2.50 × 10⁶ particle/cc depending on the 3-D printing process. Our UFP concentration of 16,000 particle/cc during printer operations was similar to the range reported by other studies (Stephens et al., 2013; Afshar-Mohajer et al., 2015; Deng et al., 2016; Steinle, 2016; Mendes et al., 2017; Vance et al., 2017). Total VOC (TVOCs) concentrations from 3-D printing emission were also similar to concentrations of 102–103 μg/m3 reported previously (Azimi et al., 2016; Steinle, 2016; Floyd et al., 2017; Mendes et al., 2017).
Potential health effects of the particulates and VOC compounds emitted by 3D printers were studied by various authors using either acellular or in vitro cellular toxicity testing systems. These early results indicated that ABS, polycarbonate (PC), and polyacrylic filament emissions induced significant dose-dependent cytotoxicity, oxidative stress, apoptosis, necrosis, and inflammation, documented by the production of several key pro-inflammatory cytokines (Farcas et al., 2019; Zhang et al., 2019)]. In an experimental 1-h exposure study of healthy human volunteers to ABS- and PLS- based 3-D printer emissions, no significant effects were seen on 8-iso PGF2α and nasal biomarkers such as IL-1, IL-6, TNF-α, and IFN-γ. However, there was a statistically significant difference (p < 0.05) in the time course of exhaled nitric oxide, with higher, exhaled nitric oxide levels (19.1 ppb) measured following ABS exposure (1 × 10⁶/cc). Moreover, the authors of the study suggested that the slight relative increase in exhaled nitric oxide after ABS exposure compared to PLA might be due to eosinophilic inflammation from inhaled UFPs (Gümperlein et al., 2018). Further studies are needed to better assess potential health effects of 3-D printer emissions.
There are several exposure mitigation strategies in the workplace; 1) elimination of the hazard or substitution of hazard materials, 2) engineering control including enclosure or encapsulation which isolates emission source, or installing local ventilation or general ventilation to reduce exposure to emission, 3) administrative control reducing the duration of exposure by limiting working hour, and 4) use of personal protective equipment (PPE) such as mask or respirator. Among them, the engineering control, including enclosure or encapsulation, which isolates emission source, is the second-best exposure mitigation. Our exposure assessment result after mitigation measure clearly indicated the reduction of 3-D emission. The concentration of formaldehyde monomer suspected to be released during 3-D printing from ABS polymer ranged 26.8–33.4 ppb with an average of 29.8 ppb. After mitigation of exposure, formaldehyde concentration 23.1–26.3 ppb with an average of 24.7 ppb in the morning, presumably concentration was affected by cleaning and waxing of floor in the morning, and 9.2–18.6 ppb with an average of 13.9 ppb in the afternoon, indicating a reduction of VOC after mitigation.
Conclusion
A comprehensive characterization of exposures to 3-D printer emission including VOCs, particle number concentration, mass concentration, size distribution, and elemental composition/morphology resulted in low levels of total suspended particulates (9–12.5 µg/m3), minimal levels (1.93–4 ppm) of TVOC, and formaldehyde (2.5–21.7 ppb), with no detectable levels of benzene and styrene by GC-FID. PTR-TOF-MS analysis of grab samples detected various chemicals at low concentrations, most of which were in the low ppb. UFPs emitted from 3-D printers had an average particle size of 30 nm CMD and 71 nm MMAD, and their size continued to increase after the termination of 3-D printing through the night until the next morning. After recognizing emissions from 3-D printers, the workplace initiated 3-D printer emission exposure mitigation by encapsulating the 3-D printers. After mitigation, the exposure assessment showed a reduction of 3-D printer emissions and some indication of VOC reduction, as indicated by VOC reduction indicated by formaldehyde concentration.
Data Availability Statement
The original contributions presented in the study are included in the article/Supplementary Material, further inquiries can be directed to the corresponding authors.
Author Contributions
BK experimental and manuscript preparation; JS, experimental preparation; HoK, experimental preparation, MJ, experimental preparation; HeK, aerosol measurement; JL, advice and manuscript review; HL, aerosol measurement; SH, advice and manuscript review; NK, advice and manuscript review; MG, advice and manuscript review; DB, advice and manuscript review; and IY, experimental planning, manuscript preparation and review. All authors read and approved the final manuscript.
Conflict of Interest
Authors HoK, MJ, HeK, HL, and IY were employed by HCTm and IY is employed by HCT, Co.
The remaining authors declare that the research was conducted in the absence of any commercial or financial relationships that could be construed as a potential conflict of interest.
Publisher’s Note
All claims expressed in this article are solely those of the authors and do not necessarily represent those of their affiliated organizations, or those of the publisher, the editors and the reviewers. Any product that may be evaluated in this article, or claim that may be made by its manufacturer, is not guaranteed or endorsed by the publisher.
Acknowledgments
Authors are recognizing a service from APM Engineering Co, Ltd (Korea) for supporting PTR-TOF-MS analysis. Also, authors are appreciating Dasom Jung for helping with the analysis of GC and HPLC.
Supplementary Material
The Supplementary Material for this article can be found online at: https://www.frontiersin.org/articles/10.3389/ftox.2021.817454/full#supplementary-material
References
Afshar-Mohajer, N., Wu, C.-Y., Ladun, T., Rajon, D. A., and Huang, Y. (2015). Characterization of Particulate Matters and Total VOC Emissions from a Binder Jetting 3D Printer. Building Environ. 93, 293–301. doi:10.1016/j.buildenv.2015.07.013
Azimi, P., Zhao, D., Pouzet, C., Crain, N. E., and Stephens, B. (2016). Emissions of Ultrafine Particles and Volatile Organic Compounds from Commercially Available Desktop Three-Dimensional Printers with Multiple Filaments. Environ. Sci. Technol. 50, 1260–1268. doi:10.1021/acs.est.5b04983
Deng, Y., Cao, S.-J., Chen, A., and Guo, Y. (2016). The Impact of Manufacturing Parameters on Submicron Particle Emissions from a Desktop 3D Printer in the Perspective of Emission Reduction. Building Environ. 104, 311–319. doi:10.1016/j.buildenv.2016.05.021
Farcas, M. T., Stefaniak, A. B., Knepp, A. K., Bowers, L., Mandler, W. K., Kashon, M., et al. (2019). Acrylonitrile Butadiene Styrene (ABS) and Polycarbonate (PC) Filaments Three-Dimensional (3-D) Printer Emissions-Induced Cell Toxicity. Toxicol. Lett. 317, 1–12. doi:10.1016/j.toxlet.2019.09.013
Floyd, E. L., Wang, J., and Regens, J. L. (2017). Fume Emissions from a Low-Cost 3-D Printer with Various Filaments. J. Occup. Environ. Hyg. 14, 523–533. doi:10.1080/15459624.2017.1302587
Gümperlein, I., Fischer, E., Dietrich-Gümperlein, G., Karrasch, S., Nowak, D., Jörres, R. A., et al. (2018). Acute Health Effects of Desktop 3D Printing (Fused Deposition Modeling) Using Acrylonitrile Butadiene Styrene and Polylactic Acid Materials: An Experimental Exposure Study in Human Volunteers. Indoor Air 28 (4), 611–623. doi:10.1111/ina.12458
Kim, Y., Yoon, C., Ham, S., Park, J., Kim, S., Kwon, O., et al. (2015). Emissions of Nanoparticles and Gaseous Material from 3D Printer Operation. Environ. Sci. Technol. 49, 12044–12053. doi:10.1021/acs.est.5b02805
Mendes, L., Kangas, A., Kukko, K., Mølgaard, B., Säämänen, A., Kanerva, T., et al. (2017). Characterization of Emissions from a Desktop 3D Printer. J. Ind. Ecol. 21, S94–S106. doi:10.1111/jiec.12569
NIOSH (National Institute of Occupational Safety and Health) (1994a). Manual of Analytical Methods (NMAM) Method 1301: Ketones II. Cincinnati, OH: NIOSH.
NIOSH (National Institute of Occupational Safety and Health) (2003). Manual of Analytical Methods (NMAM) Method 1501: Hydrocarbons, Aromatic. Cincinnati, OH: NIOSH.
NIOSH National Institute of Occupational Safety and Health (1994b). Manual of Analytical Methods (NMAM) Method 7402: Asbestos by TEM. Cincinnati, OH: NIOSH.
Ohmy News (2020). Science High School Teachers Continue Rare Cancer Sarcoma: 3D Printer Fear Spreads. Available at: http://www.ohmynews.com/NWS_Web/View/at_pg.aspx?CNTN_CD=A0002663757 (Accessed January 4, 2022).
Steinle, P. (2016). Characterization of Emissions from a Desktop 3D Printer and Indoor Air Measurements in Office Settings. J. Occup. Environ. Hyg. 13, 121–132. doi:10.1080/15459624.2015.1091957
Stephens, B., Azimi, P., El Orch, Z., and Ramos, T. (2013). Ultrafine Particle Emissions from Desktop 3D Printers. Atmos. Environ. 79, 334–339. doi:10.1016/j.atmosenv.2013.06.050
Stoehr, L. C., Madl, P., Boyles, M. S. P., Zauner, R., Wimmer, M., Wiegand, H., et al. (2015). Enhanced Deposition by Electrostatic Field-Assistance Aggravating Diesel Exhaust Aerosol Toxicity for Human Lung Cells. Environ. Sci. Technol. 49 (14), 8721–8730. doi:10.1021/acs.est.5b02503
Vance, M. E., Pegues, V., Van Montfrans, S., Leng, W., and Marr, L. C. (2017). Aerosol Emissions from Fuse-Deposition Modeling 3D Printers in a Chamber and in Real Indoor Environments. Environ. Sci. Technol. 51, 9516–9523. doi:10.1021/acs.est.7b01546
Yi, J., LeBouf, R. F., Duling, M. G., Nurkiewicz, T., Chen, B. T., Schwegler-Berry, D., et al. (2016). Emission of Particulate Matter from a Desktop Three-Dimensional (3D) Printer. J. Toxicol. Environ. Health A 79 (11), 453–465. doi:10.1080/15287394.2016.1166467
Keywords: 3-D printer, emission, exposure assessment, mitigation, particles, volatile organic chemicals (VOCs)
Citation: Kim B, Shin JH, Kim HP, Jo MS, Kim HS, Lee JS, Lee HK, Kwon HC, Han SG, Kang N, Gulumian M, Bello D and Yu IJ (2022) Assessment and Mitigation of Exposure of 3-D Printer Emissions. Front. Toxicology. 3:817454. doi: 10.3389/ftox.2021.817454
Received: 18 November 2021; Accepted: 24 December 2021;
Published: 18 February 2022.
Edited by:
Sijie Lin, Tongji University, ChinaReviewed by:
Tian Xia, UCLA David Geffen School of Medicine, United StatesNan Sang, Shanxi University, China
Copyright © 2022 Kim, Shin, Kim, Jo, Kim, Lee, Lee, Kwon, Han, Kang, Gulumian, Bello and Yu. This is an open-access article distributed under the terms of the Creative Commons Attribution License (CC BY). The use, distribution or reproduction in other forums is permitted, provided the original author(s) and the copyright owner(s) are credited and that the original publication in this journal is cited, in accordance with accepted academic practice. No use, distribution or reproduction is permitted which does not comply with these terms.
*Correspondence: Il Je Yu, dTE2NzA5MTZAY2hvbGxpYW4ubmV0