 Philip M. Benson
 Sergio Vinciguerra2,3
- 1Rock Mechanics Laboratory, School of Earth and Environment, University of Portsmouth, Portsmouth, UK
- 2Department of Geology, University of Leicester, Leicester, UK
- 3British Geological Survey, Keyworth, UK
- 4Department of Civil Engineering, Lassonde Institute, University of Toronto, Toronto, ON, Canada
Understanding different seismic signals recorded in active volcanic regions allows geoscientists to derive insight into the processes that generate them. A key type is known as Low Frequency or Long Period (LP) event, generally understood to be generated by different fluid types resonating in cracks and faults. The physical mechanisms of these signals have been linked to either resonance/turbulence within fluids, or as a result of fluids “sloshing” due to a mixture of gas and fluid being present in the system. Less well understood, however, is the effect of the fluid type (phase) on the measured signal. To explore this, we designed an experiment in which we generated a precisely controlled liquid to gas transition in a closed system by inducing rapid decompression of fluid-filled fault zones in a sample of basalt from Mt. Etna Volcano, Italy. We find that fluid phase transition is accompanied by a marked frequency shift in the accompanying microseismic dataset that can be compared to volcano seismic data. Moreover, our induced seismic activity occurs at pressure conditions equivalent to hydrostatic depths of 200–750 m. This is consistent with recently measured dominant frequencies of LP events and with numerous models.
Introduction
The wealth of unrest signals recorded in active volcanic regions—chief among them seismicity—has been studied intensively for volcano monitoring purposes for many decades (e.g., Neuberg, 2000). The primary types of seismic activity applicable to volcanic areas, Volcano-Tectonic (VT) and Long Period (LP), are widely thought to be associated with fluid movement. Although all types of seismic signal above are routinely measured on active volcanoes (Figure 1A), the use of any particular type to better forecast eruption has thus shown to be unfounded. In particular it was thought, at one time, that the use of Low Frequency (LF) event activity (being linked to shallow fluid movement in the edifice) may lead to more accurate forecasts (Neuberg, 2000). However, whilst the general hypothesis of fluid/gas movement being implicated in their generation is not in doubt (e.g., Neuberg, 2000; Saccorotti et al., 2007; Benson et al., 2010), the cause of frequency dependence, be it resonances in the fluid, fluid-rock interaction or dual phase fluid/gas mixtures (e.g., Kumagai and Chouet, 2001) remains not fully understood. In addition, new evidence has recently suggested that LP type events may, in certain circumstances, be triggered even without fluid present (Bean et al., 2013) further complicating our understanding of this complex, coupled, process.
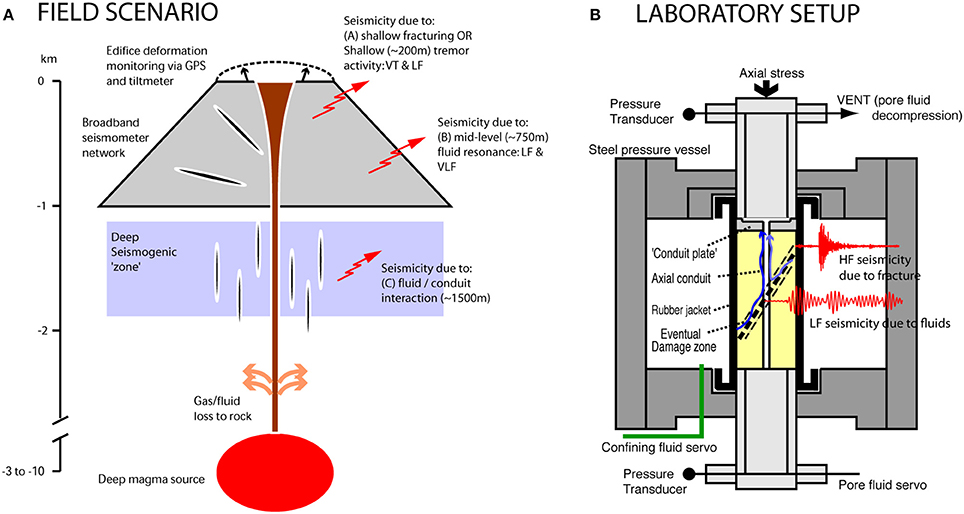
Figure 1. (A) Schematic (cartoon) view of a volcanic system illustrating the likely sources of the various signals commonly detected on the edifice. A shallow zone (zone A) where fracturing dominates is postulated to exist in the uppermost part of the edifice (generating Volcano-Tectonic or VT-type activity). This gives way to seismicity due to fluid resonances, known as Low Frequency (LF) and Very-Low Frequency (VLF) activity, deeper in the edifice (zone B) as well as so-called hybrid activity which represents a combination of these two types. Deeper seismicity (zone C) due to resonances within the conduit and fluid itself may be generated still deeper in the volcanic plumbing system. (B) Show a schematic of the laboratory apparatus (Instrumented Hoek cell by Ergotech Ltd). High Frequency (HF) activity is generated via fracturing, analogous to VT activity in the field, and Low Frequency (LF) activity is generated by fluid movement (blue arrows) through the damage zone, analogous to LF events.
Because of these causal links, an improved quantitative knowledge relating the pore fluid pressure and temperatures required for fluid to gas transitions at simulated in-situ burial depths may shed new light on the potential for different families of seismic signal. It is currently well known that fracturing of dry and fluid saturated volcanic rocks produces a diverse suite of VT earthquakes that are generally referred to as VT type activity, and these processes have been extensively studied in a well-controlled laboratory environment (e.g., Smith et al., 2009). In addition, the presence of fluids have been shown to facilitate the production of so-called hybrid activity that features the impulsive onset of VT events with a lower frequency coda that is more generally observed in pure LP type events (e.g., Benson et al., 2010; Harrington and Benson, 2011). Whereas when fluids alone produce the induced seismic activity, this impulsive onset is usually absent. However, despite this new data, the effect of different fluids (e.g., water, CO2) upon the seismic character and the transition between these different families has yet to be fully explored despite the implications that different fluid phases might contribute to the different signal character observed (e.g., Fluids compared to gaseous phases). This is crucial as it is widely appreciated that pressure is likely the primary control on the explosivity of rising magmas due to its key control upon the amount of dissolved gas (e.g., Lavallée et al., 2008). Therefore, the ability to establish (via remote means) the likely existence of different fluid phases (gas vs. liquid) may yield additional information on whether a pending eruption is likely to effusive or explosive in nature. To investigate this hypothesis, we designed an experiment whereby seismicity was induced through rapid decompression of fluid-saturated (water, steam, Nitrogen gas or combination thereof) fault zones in a sample of basalt from Etna volcano (Italy) at elevated temperatures.
Equipment and Method
To achieve the control of pressure and temperature needed, our experiments use a triaxial testing apparatus fitted with an internal furnace capable of 200°C installed at the University of Toronto (Figure 1B). A rubber jacket separates the rock sample from the confining pressure medium (silicone oil) which is fitted with an array of 12 piezoelectric sensors (of 1 MHz peak frequency) and in the upper and lower steel platens (2 each) so as to detect Acoustic Emission (AE) signals, the laboratory proxy of tectonic earthquakes. This is now a well-established method in rock physics, however, it should be note that any comparison between the recorded AE signal (a voltage) and a seismogram from a field seismometer is qualitative in nature. This is a result of the fact that AE sensors cannot currently be calibrated for an output in terms of velocity or acceleration. However, key comparisons between field and laboratory datasets can be made qualitatively via the analysis of the frequency changes with respect to the scale of investigation via the method of Benson et al. (2010).
AE signals (voltages) were amplified by using buffered 60 dB preamplifiers and recorded at a sampling rate of 10 MHz across the array of 16 sensors. In addition to AE data pore fluid pressure was measured continuously at a high sampling rate (100 Hz) to explore the links between measured AE character and the fluid pressure/phase through time.
The experiments were conducted in two stages. In the first stage, a standard rock deformation experiment was performed on intact samples (50 mm diameter × 125 mm length) by increasing the axial stress whilst maintaining constant confining pressure to create a shear failure plane/damage zone as per the procedure of Benson et al. (2010). In the second stage, the differential stress was lowered back to a hydrostat to “lock” the fault. The pore pressure was then vented rapidly (via an electrically operated solenoid value) through a central conduit specifically drilled for the purpose in order to stimulate LF events, generated as fluid moves rapidly through the damage zone previously established (and imaged). This is termed the “decompression” or “venting” stage.
Two types of experiment are performed using this protocol, but using different pore fluids for the decompression. Firstly, a “saturated” experiment using distilled deionised water at a pressure (Pp) of 20 MPa with confining pressure (Pc) of 60 MPa, and secondly, an “unsaturated” experiment in which dry nitrogen gas was used at 10 MPa, with a confining pressure of 50 MPa. This yields the same effective pressure (Peff = Pc − Pp) as the first experiment (40 MPa); conditions broadly representative of those at approximately 1.5 km depth within the Etna volcanic edifice (Benson et al., 2007). In both experiments the experiments were conducted at a temperature of 175°C to simulate shallow volcanic conditions. The use of elevated pressure/temperature conditions with a full 3D AE array is key to the experiments as under these conditions, water will remain in the liquid phase even at temperatures beyond its boiling point. Theory shows that water will boil at a pressure of approximately 2 MPa (Choukrouna and Grasset, 2007). This allows a single experiment to explore the effects of both a liquid (water) and a gas (steam) upon the measured AE, and with reference to the pore fluid pressure through time. The comparison with the same experiment with solely gas present (Nitrogen) then acts as a calibration to these data.
Results
Waveform data from the decompression of water saturated samples at 175°C are shown in Figure 2A, together with a time-frequency-power plot. As pressure decays over approximately 0.75 s (for clarity, only the latter 0.4 s of pore pressure data are shown), a “swarm” of AE events is detected. Initial AE activity is first detected with a pore fluid pressure of approximately 7 MPa, with the largest events seen when the pressure decays through approximately 2.5 MPa some 0.1 s later. The clipping of these data, due to the high magnitude of the events, is neglected for the purposes of frequency analysis. During this sequence, two power peaks in the time-frequency spectra are seen, at 80–90 kHz and at approximately 20 KHz (at approximately 0.15–0.22 s, before the clipped data segment obscures the analysis). However, after approximately 0.26 s the peak at 80–90 KHz is subdued, and the power seen in the 20 KHz band increases noticeably, occurring as the pressure continues to decrease through approximately 2 MPa, the pressure through which liquid water notionally starts to boil under these temperature conditions.
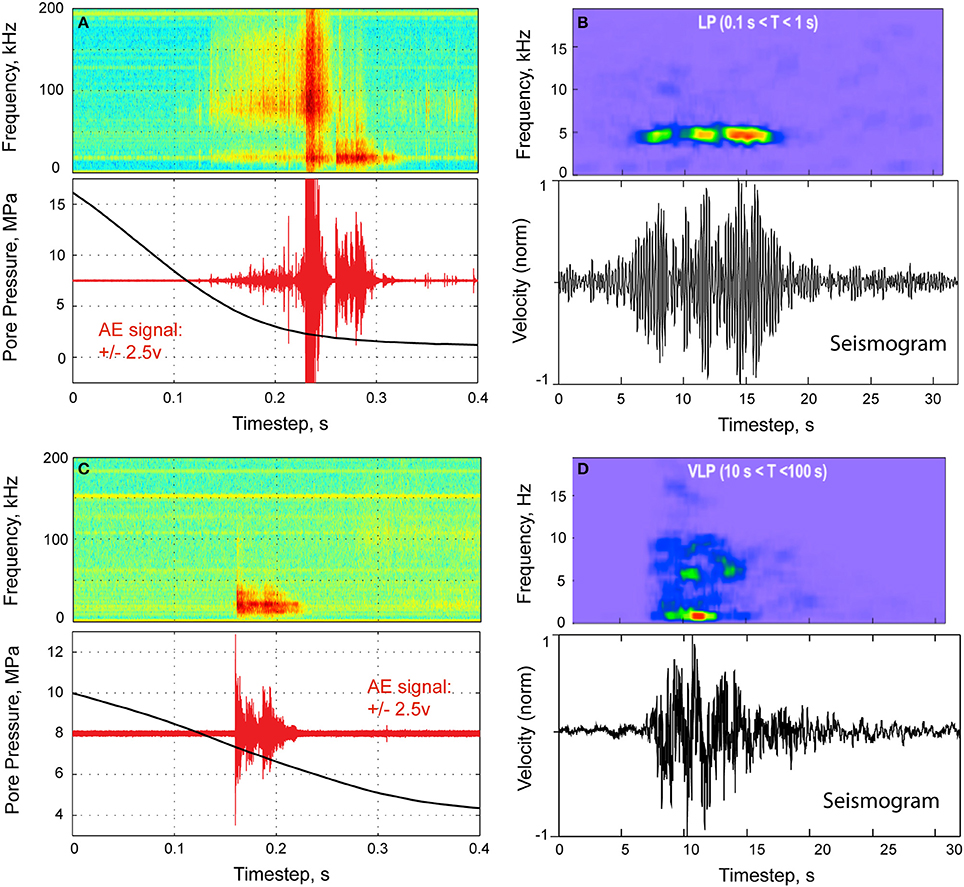
Figure 2. (A) During our experiment with high temperature (175°C) pore fluid (water), we observe that as pore pressure (black line) decreases through 2 MPa, the Low Frequency (LF) Acoustic Emission (AE) swarm undergoes a transition to Very Low Frequency (VLF) activity, seen as a switch from ~90 to ~20 KHz. (B) Laboratory data from (A) may be qualitatively compared to LF data from Nisyros volcano (Caliro et al., 2005). (C) Shows the experiment with dry Nitrogen gas, also at 175°C. Here, we observe that as Pore pressure (black) decreases, only a single AE swarm is triggered, this time at ~20 KHz and interpreted as VLF type signal. (D) Again, laboratory data from (C) may also be qualitatively compared to VLF data, also from Nisyros volcano (Caliro et al., 2005). Note that the seismogram data has been normalized to maximum velocity in (B,D).
To interpret these data, this experiment is compared to the second conducted at similar conditions of confining pressure and temperature but with Nitrogen gas as the pore fluid medium (Figure 2C). This time only a single swarm of AE activity is seen, which occurs at a higher pressure (~7.5 MPa) compared to the water saturated sample. It is of particular note that the frequency of the maximum power occurs at approximately 20 KHz as in the earlier experiment. These results allow direct comparisons to be made between low-frequency seismicity, liquid (water) flow, gas movement, and their associated signal frequencies in these fracture and damage zones (Benson et al., 2010). The fundamental similarity of the physical processes involved in generating low-frequency seismic signals in volcanoes (where pressures and stress conditions cannot be measured directly) and in laboratory experiments (where we can easily measure pressure and temperature) is established by comparing the waveforms and spectral contents to field seismic data (Figures 2B,D). The first order control when comparing the peaks in Figures 2A,B, a change in frequency from 90 kHz to 5 Hz or a factor of 18,000, is matched by a change in scale of the fracture network from ~2 cm scale to ~400 m scale, a factor of approximately 20,000 which is in close agreement in terms of scaling. Similarly when comparing the data in Figures 2C,D, peak frequencies of 10 kHz and 0.5 Hz can be observed, which compared well to the same change in length scale (~2 cm to ~400 m), as before. For the purpose of our study, our interest lies in the known physical changes in state due to water pressure release or “venting” when comparing the high temperature system in 2A, where the phase transition present from water to gas (evidenced from a measured pore pressure) lies coincident to the change in frequency from ~90 to ~10 kHz, to the scenario shown in 2C with no water present showing only the 10 kHz component.
A simple and robust method to understand these AE swarms, and by proxy to the similar swarms of seismic events observed in the field, is to analyse the spectrogram data together with knowledge of the pore fluid phase and pressure. In the water saturated example, the switch in peak frequency occurs at a fluid pressure in the range 2–2.5 MPa, which is the pressure at which the liquid water changes phase to steam at this pressure. This is a notable result as there have been claims that viscosity plays a role in the tremor recorded on active volcanoes (Kumagai and Chouet, 2001). This hypothesis is then verified though comparison to data from a guaranteed gas phase which shows an identical spectrogram, although triggered at a different pressure of 7.5 MPa. The initial triggering pressure in both cases is similar (7.5 vs. 7 MPa), suggesting that this threshold pressure, or pressure change rate, has an influence on the AE onset as fluid (whether liquid or gas) is forced to move rapidly though the fracture damage zone created by the fist part of the experiment. However, it should also be noted that the physics of the AE signal between source and receiver involves a complex relationship that involves not only the source process itself (the fluid flow/sloshing) but also the impedance contrast between the fluid and the surrounding rock.
Discussion
To interpret the results in terms of burial depth it is trivial to use a standard hydrostatic pressure depth model (P = Dρ g, where D is depth, ρ is fluid density and g is the acceleration due to gravity). It is possible to equate the pressure drop from the experiments (Pswarm) to a depth via the density of the liquid of interest. For water, the initial onset of AE is detected at a pressure of between 6 and 7 MPa, giving a depth of between 600 and 700 m (Pswarm of 6.5 MPa). For the second swarm, the pressure that resonance is created occurs at just under 2 MPa, generated by the assumed liquid to steam transition and equivalent to fairly shallow depths of ~200 m. Or, alternatively, a delta pressure of ~1 MPa would yield concomitant hydrostatic depths changes of a few 100 m around the average hydrostatic pressure depth of 600–700 m. We use a hydrostatic depth profile as it is likely that pore fluid may move freely in order to generate the observed signals implying a permeable matrix.
These depths are consistent with recent field observations of LP data in different volcanological settings (Saccorotti et al., 2007; Johnson et al., 2008). In particular, data from Mt. Etna Volcano shows significant clustering of LP signals in a narrow volume located beneath the summit craters. Hypocentral locations indicate a maximum depth of approximately 800 m beneath the surface, including LP and Very LP datasets from the summit station depicting pulses with rectilinear motion at depths ranging between 800 and 1100 m, similar, for example, to seismic data recorded at Nisyros volcano as shown in Figures 2B,D (Saccorotti et al., 2007). These LP events observed at Etna are interpreted as the result of a mass-transport process involving the movement and associated decompression of gas slugs as they approach the terminal part of the magmatic column (Figure 1). From this perspective, the injection of these fluids into an overlying cavity filled by either magmatic or hydrothermal fluids at poor gas volume fraction would drive the periodic pressurization steps of such a shallow reservoir, thus triggering its resonant, LP oscillations (Saccorotti et al., 2007).
Finally, we note that the inherent issue of scaling laboratory data to field scale processes is relatively straightforward by adopting a straightforward size-frequency relationship (e.g., Benson et al., 2010) to the datasets that consider the likely size of the feature producing the event (fracture length) and the frequency of the seismic or AE event that results. Using this method we are able to scale our AE events of 20–90 KHz on the cm (laboratory) scale to field scale LP frequencies ranging from 0.1 to 10 Hz (Figure 1) by considering resonators in the 20–2000 m range. This is consistent with scales used in models and generally accepted in the field.
Perspective
With these simple experiments, and a straightforward approach to an analysis, we have shown that the evolving frequency content of AE signals in triaxial deformation experiment can be used to gain an understanding of the physics of the underlying process (which cannot be directly observed). The use of these type of “analog” methods is well established in physical volcanology, such as the use of long tubes to replicate a magma column, using bubblers to simulate the nucleation and bursting of gas slugs (e.g., Lane et al., 2001). Furthermore, there is also new evidence that LP events may also be triggered without any fluid, in the poorly consolidated topmost layers of a volcanic edifice (Bean et al., 2013). In this paper and perspective we go further by adding confining pressure and high temperature fluid/gas in an attempt to better simulate subsurface conditions.
The laboratory data presented here shows that changes in fluid phase in fractured rock samples can be detected via laboratory AE instrumentation, and that these events may be compared to the changes in frequency and of volcano induced seismicity. This is achieved by simulating the pressure conditions of the shallow volcanic edifices, and selecting an elevated temperature whereby the fluid of choice will exhibit a phase change during pressure release, equating the trigger pressure thresholds to depths conditions in the shallow Earth. The frequencies of the resonance is consistent with our early work at room temperature (Benson et al., 2008, 2010), but adds an important link in that the switch in frequency occurs are almost exactly where the phase transition from water to steam occurs, and this behavior (i.e., gas inducing resonance of lower frequency) is subsequently verified by using Nitrogen gas directly. It is likely that no laboratory setup will ever be able to fully reproduce the actual pressure and temperature found at depth in a volcanoes, and allow full 3D seismic record to be measured due to the sheer technical challenges faced. In addition we acknowledge that the comparison of laboratory sourced waveform data to real field seismograms will always contain a subjective element, especially when data are “clipped” (neglected for the analysis presented here). However, laboratory rock physics experiments (whereby parameters may be directly controlled and measured) represent an unique approach to monitor changes with pressure and over time of relevance for volcanic edifices, and how they are manifested in the many geophysical signals detected on the surface of volcanoes may be achieved. A specific challenge remains in better calibrating the plethora of models (e.g., Kumagai and Chouet, 2001) that introduce two phase fluids such as “dusty gasses,” or “gassy liquids” that are almost certainly present in real volcanoes but, at present, can only be investigated via numerical models and have not yet been tested in the laboratory.
We conclude that: (a), in general the sources of LP events are not open to the surface but are likely to be triggered by fluid movement driven by pressure changes associated with degassing and/or magmatic fluid movement. This idea may be further clarified in terms of the detected AE energy (radiation pattern) that results from the fluid/rock interaction, which triggers the resonance. This is, in turn, a product of the velocity (pressure gradient) of the fluid, which in this experiment we were able to measure. (b), both fluid-induced and gas-generated events occur at depths (~750 m and less) commonly inferred for hypocentre depths on active volcanoes (Saccorotti et al., 2007), and finally (c) lower frequency activity is more likely to be produced by an apparently lower density fluid, be it free gas at very shallow levels or gas solution/dissolution (driving sloshing fluid) at deeper levels.
Conflict of Interest Statement
The authors declare that the research was conducted in the absence of any commercial or financial relationships that could be construed as a potential conflict of interest.
Acknowledgments
This work was partially supported by a Marie-Curie International Fellowship within the 6th European Community Framework program (contract MOIF-CT-2005-020167 to Philip M. Benson) and a CFI (Canadian Foundation for Innovation) award to R. Paul Young. The authors gratefully thank Laszlo Lombos and Dylan Roberts at Ergotech Ltd. for assistance with instrument development and technical support, Will Pettit at Applied Seismology Consultants Ltd. for software development and advice, and Gilberto Saccorotti for supplying examples of field seismic data, as well as many fruitful discussions.
References
Bean, C., De Barros, L., Lokmer, I., Metaxian, J. P., O'Brien, G., and Murphy, S. (2013). Long-period seismicity in the shallow volcanic edifice formed from slow-rupture earthquakes. Nat. Geo. 7, 71–75. doi: 10.1038/ngeo2027
Benson, P. M., Thompson, B. D., Meredith, P. G., Vinciguerra, S., and Young, R. P. (2007). Imaging slow failure in triaxially deformed Etna basalt using 3D acoustic-emission location and X-ray computed tomography. Geophys. Res. Lett. 34, L03303. doi: 10.1029/2006GL028721
Benson, P. M., Vinciguerra, S. Meredith, P. G., and Young, R. P. (2008). Laboratory simulation of volcano seismicity. Science 322, 249–252. doi: 10.1126/science.1161927
Pubmed Abstract | Pubmed Full Text | CrossRef Full Text | Google Scholar
Benson, P. M., Vinciguerra, S., Meredith, P. G., and Young, R. P. (2010). Spatio-temporal evolution of coupled hydro-mechanical seismicity: a laboratory study. Earth Planet Sci. Lett. 297, 315–323. doi: 10.1016/j.epsl.2010.06.033
Caliro, S., Chiodini, G., Galluzzo, D., Granieri, D., La Rocca, M., Saccorotti, G., et al. (2005). Recent activity of Nisyros volcano (Greece) inferred from structural, geochemical and seismological data. Bull Volc. 67, 358–369. doi: 10.1007/s00445-004-0381-7
Choukrouna, M., and Grasset, O. (2007). Thermodynamic model for water and high-pressure ices up to 2.2 GPa and down to the metastable domain. J. Chem. Phys. 127, 124506. doi: 10.1063/1.2768957
Pubmed Abstract | Pubmed Full Text | CrossRef Full Text | Google Scholar
Harrington, R. M., and Benson, P. M. (2011). Analysis of laboratory simulations of volcanic hybrid earthquakes using empirical Green's functions. J. Geophys. Res. 116, B11303. doi: 10.1029/2011JB008373
Johnson, J. B., Aster, R., Jones, K. R., Kyle, P., and McIntosh, B. (2008). Acoustic source characterization of impulsive Strombolian eruptions from the Mount Erebus lava lake. J. Volcanol. Geotherm. Res. 177, 673–686. doi: 10.1016/j.jvolgeores.2008.06.028
Kumagai, H. K., and Chouet, B. A. (2001). The dependence of acoustic properties of a crack on the resonance mode and geometry. Geophys. Res. Lett. 17, 3325–3328. doi: 10.1029/2001GL013025
Lane, S. J., Chouet, B. A., Phillips, J. C., Dawson, P., Ryan, G. A., and Hurst, E. (2001). Experimental observations of pressure oscillations and flow regimes in an analogue volcanic system. J. Geophys. Res. 106, 6461–6476. doi: 10.1029/2000JB900376
Lavallée, Y., Meredith, P. G., Dingwell, D. B., Hess, K.-U., Wassermann, J., Cordonnier, B., et al. (2008). Seismogenic lavas and explosive eruption forecasting. Nature 453, 507–510. doi: 10.1038/nature06980
Pubmed Abstract | Pubmed Full Text | CrossRef Full Text | Google Scholar
Neuberg, J. W. (2000). Characteristics and causes of shallow seismicity in andesite volcanoes. Philos. Trans. R. Soc. London Ser. A 358, 1533–1546. doi: 10.1098/rsta.2000.0602
Saccorotti, G., Lokmer, I., Bean, C. J., Di Grazia, G., and Patanè, D. (2007). Analysis of sustained long-period activity at Etna Volcano, Italy. J. Volc. Geotherm. Res. 160, 340–354. doi: 10.1016/j.jvolgeores.2006.10.008
Keywords: volcano seismicity, low frequency events, rock physics, seismology, physical volcanology
Citation: Benson PM, Vinciguerra S, Nasseri MHB and Young RP (2014) Laboratory simulations of fluid/gas induced micro-earthquakes: application to volcano seismology. Front. Earth Sci. 2:32. doi: 10.3389/feart.2014.00032
Received: 12 August 2014; Accepted: 22 October 2014;
Published online: 07 November 2014.
Edited by:
David M. Pyle, University of Oxford, UKReviewed by:
Marco Neri, Istituto Nazionale di Geofisica e Vulcanologia, ItalyNicolas Fournier, GNS Science, New Zealand
Copyright © 2014 Benson, Vinciguerra, Nasseri and Young. This is an open-access article distributed under the terms of the Creative Commons Attribution License (CC BY). The use, distribution or reproduction in other forums is permitted, provided the original author(s) or licensor are credited and that the original publication in this journal is cited, in accordance with accepted academic practice. No use, distribution or reproduction is permitted which does not comply with these terms.
*Correspondence: Philip M. Benson, Rock Mechanics Laboratory, School of Earth and Environment, University of Portsmouth, Portsmouth PO1 3QL, UK e-mail:cGhpbGlwLmJlbnNvbkBwb3J0LmFjLnVr