 Rémy Roca1*
 Hélène Brogniez2
 Philippe Chambon3
 Olivier Chomette4
 Sophie Cloché5
 Marielle E. Gosset6
 Jean-Francois Mahfouf3Patrick Raberanto4Nicolas Viltard2
- 1Laboratoire d'Etudes en Géophysique et Océanographie Spatiales (UPS/IRD/CNES/CNRS), Toulouse, France
- 2Laboratoire Atmosphères, Milieux, Observations Spatiales (IPSL/UVSQ/UPMC/CNRS), France
- 3Centre National de la Recherche Météorologique/GAME, Météo France and CNRS, Toulouse, France
- 4Laboratoire de Météorologie Dynamique, Palaiseau, France
- 5Institut Pierre Simon Laplace, Palaiseau, France
- 6Géoscience Environnement Toulouse, Toulouse, France
The Megha-Tropiques mission is operating a suite of payloads dedicated to the documentation of the water and energy cycles in the intertropical region in a low inclination orbit. The satellite was launched in October, 2011 and we here review the scientific activity after the first 3 years of the mission. The microwave sounder (SAPHIR) and the broad band radiometer (SCARAB) are functioning nominally and exhibit instrumental performances well within the original specifications. The microwave imager, MADRAS, stopped acquisition of scientific data on January 26th, 2013 due to a mechanical failure. During its 16 months of operation, this radiometer experienced electrical issues making its usage difficult and delayed its validation. A suite of geophysical products has been retrieved from the Megha-Tropiques payloads, ranging from TOA radiative flux to water vapor profiles and instantaneous rain rates. Some of these geophysical products have been merged with geostationary data to provide, for instance, daily accumulation of rainfall all over the intertropical region. These products compare favorably with references from ground based or space-borne observation systems. The contribution of the mission unique orbit to its scientific objectives is investigated. Preliminary studies indicate a positive impact on both, humidity Numerical Weather Prediction forecasts thanks to the assimilation of SAPHIR Level 1 data, and on the rainfall estimation derived from the Global Precipitation Mission constellation. After a long commissioning phase, most of the data and the geophysical products suite are validated and readily available for further scientific investigation by the international community.
Introduction
Two hundred years after the foundation of moist thermodynamics and of the Clausius-Clapeyron law, our understanding of the radiative and hydrological consequences of a moister atmosphere associated with a warmer climate is still fraught with uncertainty (Sherwood et al., 2010). Radiative cooling to space is straightforwardly linked to the global rainfall amount within the radiative-convective equilibrium framework that operates at the global scale (Stephens and Ellis, 2008). In the tropics, where the radiative-convective-dynamical equilibrium prevails, the coupling of the water and energy cycles is less direct. The regions dominated by moist convective processes are connected to the radiatively active dry troposphere of the subtropics via the large scale circulation (Pierrehumbert, 1995). The detailed understanding of this tropical equilibrium and of its moist and dry regions is required to better assess the expected evolution of the water and energy cycles under the anthropogenic pressure.
The satellite perspective provides a unique way to monitor and quantify the water and energy exchanges over the Tropics (Kandel and Viollier, 2010; Roca et al., 2010a). Significant progress has been reached insofar in our ability to close the water and energy budgets from space (Brown and Kummerow, 2014; Robertson et al., 2014). At a process level, the satellite perspective also contributes significantly to our understanding of the tropical climate. In the past, for instance, satellites have uncovered the mechanisms at play within the monsoons (Srinivasan and Joshi, 2007). The numerous achievements of the Tropical Rainfall Measuring Mission (TRMM) (Kummerow et al., 1998) over the last 17 years also strongly add to the usefulness of satellites for tropical meteorology and atmospheric physics studies. For instance, the documentation of extreme storms in the tropics has witnessed significant improvements thanks to these space based observations (Zipser et al., 2006). The importance of the Mesoscale Convective Systems (MCS) to the water and energy budgets of the tropics is also being recognized (Tao and Moncrieff, 2009; Tobin et al., 2012) as well as its detailed quantification using satellite based products (Roca et al., 2014). The rapid variability and high intermittency in both space and time, of the water and energy cycle elements (rainfall, clouds, and water vapor) nevertheless necessitate a reinforced observing system to document their full distributions.
The Megha1 -Tropiques satellite is an Indo-French mission built by the Indian Space Reasearch Organization (ISRO) and the Centre National d'Etudes Spatiales (CNES). Its low inclination orbit and high altitude of flight greatly enhance the sampling of the tropical regions by the on-board instruments compared to typical low earth observing platforms. Megha-Tropiques (MT) flies a unique suite of payloads related to the elements of both the water and energy cycles in support of four main scientific objectives. The first one concerns the evaluation and monitoring of the water and energy budgets over the intertropical region. The second objective is processes-oriented and focuses on the understanding of the life cycle of the tropical storms. The third one aims at supporting continental hydrological sciences and the flooding risk estimation. The MT mission also serves operational objectives through real time delivery of the SAPHIR radiometer data via EUMETSAT to the numerical weather prediction centers. The MT mission complements and reinforces the existing fleet of research and meteorological satellites with a close connection to various agencies operating other radiation budget instruments (Loeb et al., 2009) as well as the participants to the Global Precipitation Measurement constellation (Hou et al., 2014) of which MT is an official member.
This paper aims at reviewing the Megha-Tropiques mission and its status after 3 years in orbit with emphasis on the French scientific activities. It is organized as follows. Section The Mission and Its Performance introduces the satellite and details the payloads and the orbit as well as the geophysical products derived from Megha-Tropiques, alone, and in combination with other satellite measurements. The proof of concept of the mission is then discussed in Section Toward the Proof of Concept of the MT Mission in the context of the observing system status in the early 2010s. A short conclusion ends the paper.
The Mission and its Performance
Prior to launch, a series of papers described the mission (Desbois et al., 2003, 2007; Roca et al., 2010a and reference therein) and here only the salient features are recalled and the emphasis is set on the in-flight performance of the instruments.
The Low Inclination Orbit
The orbit of Megha-Tropiques is circular, and is characterized by a 20° inclination at the Equator and an altitude of 866 km. This configuration yields a 7 day phasing of the orbit and a 51.3 days precession cycle. The satellite orbits the Earth within 100 min yielding around 14 orbits per day. The orbit and its consequences on the sampling of the Earth by the MT payloads are discussed at length in Capderou (2009).
The latitudinal sampling statistics further indicate that up to 5 (3) observations per day are provided at the same location in the best (worst) case over the Tropics (Figure 1). The inclination and the height of the orbit yield the 2 peaks patterns seen in Figure 1. Poleward of the maximum, the number of samples decreases with latitude. Note that the most poleward measurement for MADRAS is at 27°. The same kind of statistics holds for the across track scanning instruments SCARAB although due to the enlarged swath (~2200 km) more observations are harvested on each day with up to 6 overpasses per day and a minimum of 4 per day over the 22°S-22°N band. The most poleward measurement for SCARAB is 30°. The SAPHIR statistics are similar although with a narrower swath (~1700 km).
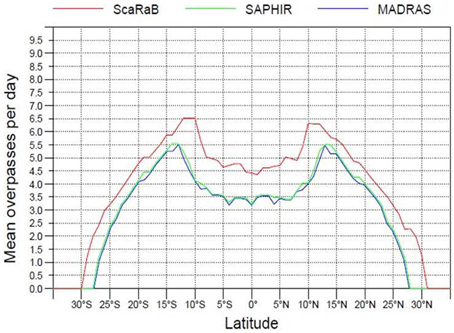
Figure 1. Zonal statistics of observations by the Megha-Tropiques mission payloads. From Capderou (2009). For the ScaRaB instrument in red, the SAPHIR instrument in green and the MADRAS instrument in blue.
A further original aspect of the MT orbit is the distribution of the overpasses in time as revealed in Figure 2 for the MADRAS case (the same results apply to the other scanning instruments). The precession cycle is clearly seen from these figures where the local time of observations shifts backwards as the satellite progresses throughout the month. The precession cycle is responsible for the complex aliasing between the MT orbit and the diurnal cycle. Figure 2 shows that during the first 10 days of the month, at 13°N, no observations will be performed during nighttime. At 0°N, the orbits come in small packets 12 h apart yielding a more even sampling of the diurnal cycle. At 13°N, the various orbits come in one single packet following each other ~100 min apart. On the edges of the region of interest (25°N), the sampling goes down to 2–3 consecutive overpasses a day separated by roughly 20–24 h.
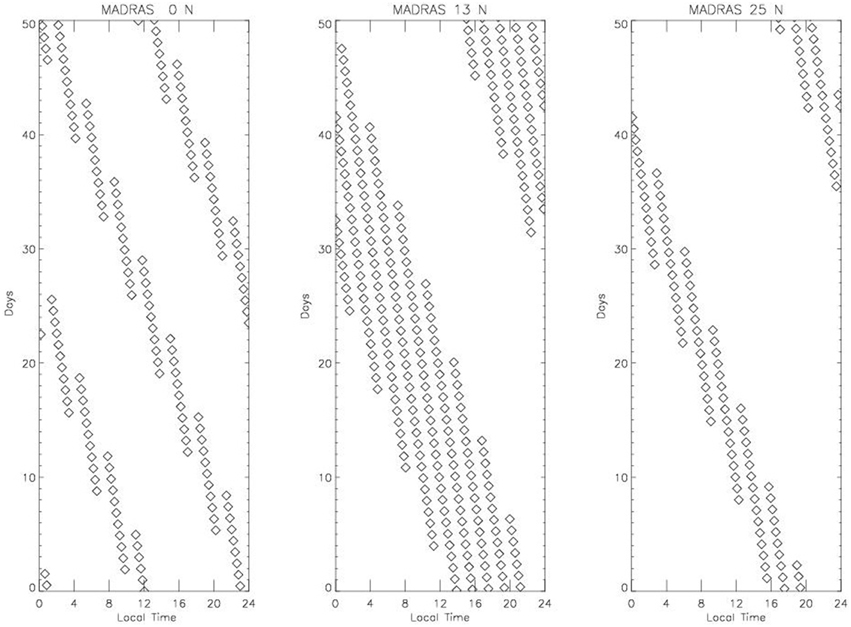
Figure 2. 51 days of local time sampling for the MADRAS instrument on-board MT for the Equator (left), a 13°N position (center) and 25°N position (right). Diamonds correspond to overpasses.
The Payloads
The MADRAS Radiometer
The MADRAS (Microwave Analysis and Detection of Rain and Atmospheric Structures) is a conical-scanning passive microwave imager primarily designed for cloud properties characterization and precipitation retrieval. Its channels are distributed optimally (18.7, 23.8, 36.5, 89.0, 157.0 GHz) to perform such retrievals over both land and ocean surfaces. Similar in concept to the previous generation of such instruments (SSMI, TMI), MADRAS has a number of specificities that arise from the MT objectives. First, the 18.7, 23.8 and 36.5 GHz channels share a common (same feed-horn) spatial resolution in order to offer the best radiometric sensitivity possible (Table 1). Second, the 89 GHz channel pixels are overlapping by 10% in the along-track direction in order to offer a continuous coverage. With a 65 cm reflector and an altitude of 866 km, the projected along-track pixel size at 89 GHz is close to 17 km, leading to an antenna rotation speed of 24.14 rpm. Across-track the distance between two adjacent 89 GHz pixels is 10 km (Figure 3). This means there is a gap between two 157 GHz samples in both directions and a substantial overlap at the lower frequencies. Third, the structure supporting the reflector is made of solid walls due to mechanical constraints at launch. All frequencies are measured in both Horizontal (H) and Vertical (V) polarization except for the 23.8 GHz which is only measured in the V polarization. This channel is mainly designed for total column water vapor retrieval and is close to the 22.23 GHz water vapor line. In the tropics, as the total water vapor column is rather high a slight shift from the center of the line was deemed necessary to avoid saturation. MADRAS has been constructed jointly by ISRO and CNES with the support of ASTRIUM for the radio frequency part. The onboard pointing angle is 43° which leads to a nearly constant incident angle of 53.5° at Earth surface. The data acquisition is performed within 65° on each side of the satellite translation vector and can be either forward or backward depending on the platform orientation resulting in a 1700 km wide swath.
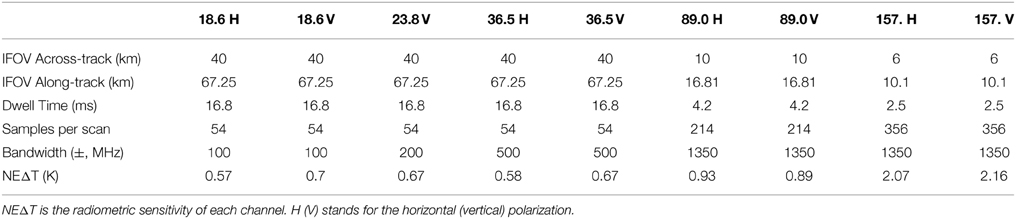
Table 1. Characteristics of MADRAS.
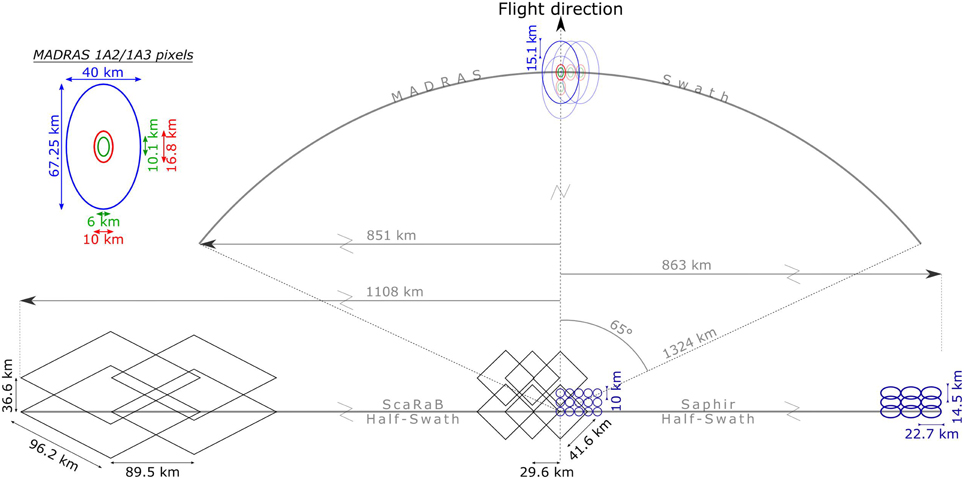
Figure 3. Scaled representation of the payloads footprints. The L1A2 products correspond to brightness temperature of pixels for MADRAS and SAPHIR radiometers based on original L1 samples from the instruments. Note that the L1A2 product for Scarab is identical to L1A. L1A3 format correspond to SAPHIR, SCARAB pixels and all MADRAS pixels projected onto the conical scan 89 GHz MADRAS grid. Data are interpolated from L1A for SCARAB and L1A2 for SAPHIR inside a fixed grid related to the current orbit and defined by the location of MADRAS 89 GHz pixels centers. Note that the level 1A2 and 1A3 products are identical for MADRAS.
MADRAS suffered from interference in its electronic backend that delayed the distribution of the data to the scientific community. It was declared unoperational by ISRO and CNES after 26 January 2013. In total more than a year of data are available for which the radiometric performances of the instrument are well within the specifications summarized in Table 1 (Karouche et al., 2012; Goldstein and Karouche, 2013; Defer et al., 2014).
The SAPHIR Radiometer
The Sounder for Atmospheric Profiling of Humidity in the Intertropics by Radiometry (SAPHIR) radiometer is operating in six narrow channels located in the water vapor absorption band at 183.31 GHz (Eymard et al., 2002). The average sensitivity functions, from the relative humidity Jacobians (∂BT/∂RH, in K/%) of these channels are represented on Figure 4, and indicate that the radiometer provides observations throughout the free troposphere, from above the boundary layer (channel 6 at 183.31 ± 11 GHz) up to the tropopause (channel 1 at 183.31 ± 0.2 GHz). Although overlapping, the combination of the measurements from these six channels can be used to estimate water vapor content on six layers as discussed in the next section (Brogniez et al., 2013; Gohil et al., 2013). SAPHIR is a cross-track scanning radiometer observing the Earth's atmosphere with a scan angle of ±42.96° around nadir (corresponding to a viewing zenith angle of ±50.7°) and each scan line of about 1700 km is composed of 130 non-overlapping footprints. The size of the footprint at nadir is 10 km and the deformation along the scan yield a pixel size of 14.5 × 22.7 km2 on the edges of the swath (Figure 3). The addition of three channels located closer to the absorption line and on its edge compared to operational 183 GHz radiometers like AMSU-B and MHS, improves the estimation of the relative humidity of the upper part of the troposphere and in its lowest layers (Brogniez et al., 2013). The combination of SAPHIR and MADRAS observations, mainly through the 23.8 GHz and the 157 GHz channels brings additional information on the total water vapor content of the column and on the water vapor continuum that also improves the documentation of the humidity profile (Aires et al., 2013; Bernardo et al., 2013; Brogniez et al., 2013; Sivira et al., 2015).
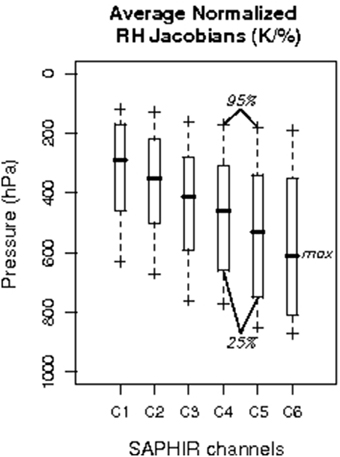
Figure 4. Relative humidity jacobians ∂TB/∂RH, in K/% of the 6 channels of SAPHIR for a tropical relative humidity profile observed at nadir by the RTTOV model. The whiskers indicate the lower and upper limits of the distribution.
SAPHIR is operating nominally since the launch. The radiometric performances are well within the specifications (Karouche et al., 2012) as summarized in Table 2. In addition, Clain et al. (2014) investigated the on-board calibration using in-situ measurements from radiosoundings associated to radiative transfer computations. Thanks to a detailed error budget linked to the different steps of the comparisons (radiometric accuracy of SAPHIR, uncertainties in the radiative transfer computations, uncertainties in the in-situ data and collocation errors), Clain et al. showed a warm bias (SAPHIR being colder and thus moister than the radiosoundings) that increases with channel, from 0.19 ± 2.48 K for channel 1 up to 2.31 ± 1.38 K at channel 6. Such biases may be induced by a bias in the radiosoundings themselves (a 15–20% relative moistening), by undetected clouds affecting SAPHIR measurements or by spectroscopic issues (see Clain et al for the discussion). Intercomparisons of SAPHIR with other similar microwave sounders such as MHS or ATMS (Wilheit et al., 2013; Moradi, 2014) confirm the behavior of SAPHIR. Channel 6 is marginally warmer than expected when compared to the radiosoundings and further work is needed to fully understand this small departure.

Table 2. Characteristics of SAPHIR.
The ScaRaB Radiometer
ScaRaB (Scanner for Radiation Budget) is a four channel cross-track scanning radiometer. It is designed to determine the longwave (LW) and shortwave (SW) TOA instantaneous outgoing fluxes with an accuracy of 1% in the LW and 2% in the SW. Channels 2 and 3 are the broadband (BB) channels. Channel 2 (SW) directly provides the solar energy reflected by the earth-atmosphere. Channel 3 (T) measures the total energy (solar and thermal between 0.2 and 100 μm). The LW radiation is obtained from the subtraction between the T channel and the SW channel
where A′ depends on the spectral response of the T and the SW channels. ScaRaB has also two auxiliary channels, a visible (VIS) channel and an infrared window channel for scene identifications. The general concept of the instrument remains unchanged and is based on the two previous ScaRaB models (see Kandel et al., 1994, 1998; Duvel et al., 2001; Chomette et al., 2012) flown on Meteor and Resurs satellites in 1994 and 1998, but most of the components (detectors, optics, mechanisms and electronics) have been updated. The on-board calibration procedures have been modified for this third ScaRaB instrument (Viollier and Raberanto, 2010). The solar filter can be switched from the SW to the T channel, which allows checking the calibration and balance of the shortwave responses of both channels and also calibration of channel 2 by viewing a blackbody. ScaRaB has been built by CNES with support from the Laboratoire de Météorologie Dynamique technical team.
ScaRaB is operating nominally since the launch and is performing as specified (Karouche et al., 2012). The instantaneous upwelling radiances (Wm−2sr−1) have been compared to the Clouds and the Earth's Radiant Energy System (CERES) instrument on board the Terra satellite thanks to a dedicated sampling campaign where the CERES Flight Model 1 is operated in the Programmable Azimuth Plane Scan mode (Smith et al., 2012). The two instruments are compared at the instantaneous scale using precise collocations (Capderou et al., 2013). Both in the shortwave and the longwave domains, ScaRaB compares favorably with the CERES instrument (Figure 5) confirming that the two independent technologies are producing a consistent estimate of the upwelling TOA radiances (Chomette et al., 2015). In the LW domain, for instance, out of 36,888 collocated pixels, the comparison between ScaRaB and CERES yield a bias of −0.83 Wm−2sr−1 and a standard deviation of 2.22 Wm−2sr−1, or −0.98 ± 1.36%, well within the uncertainty of both instruments.
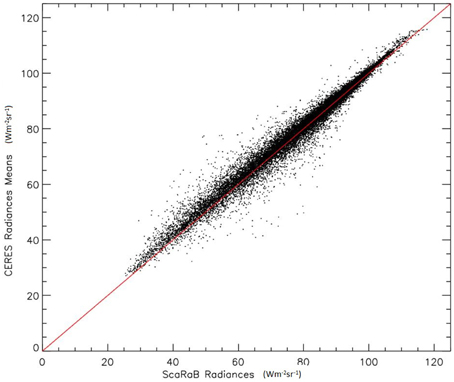
Figure 5. Scatterdiagram of LW radiances in Wm−2sr−1 from ScaRaB vs. CERES FM1 data during the coincidence campaign in 2012. From Chomette et al. (2015).
Geophysical Products
The suite of geophysical products is summarized in Table 3. We present below short summaries and emphasize their performances when compared to various references. The products mentioned below are or will be in a near future readily available from the Megha-Tropiques French ground segment (http://www.icare.univ-lille1.fr/mt).
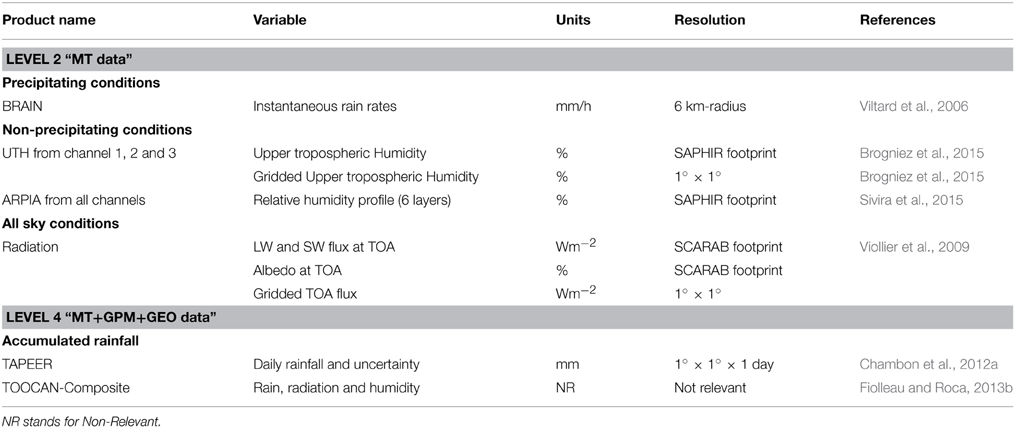
Table 3. Summary of the main products derived from the Megha-Tropiques mission.
Level-2 Products
Instantaneous rainfall
The Bayesian Retrieval Algorithm Including Neural Networks (BRAIN) retrieval (Viltard et al., 2006; Kirstetter et al., 2013) is a Bayesian approach that extracts from the multi spectral microwave observations a representative rain profile obtained from a database. The microwave brightness temperature profiles database is constructed primarily from observations of the Precipitation Radar on board the Tropical Rainfall Measuring Mission and radiative transfer simulations. The microphysical assumptions of the radiative transfer computations have been recently revisited using dedicated airborne and radar campaigns (Fontaine et al., 2014; Martini et al., in press). In the framework of the MT mission, the BRAIN retrieval is applied on all the platforms participating in the Global Precipitation Mission (Hou et al., 2014) constellation. The BRAIN instantaneous surface rain rate retrievals are evaluated by comparison against various references within the tropical band as part of the Megha-Tropiques Ground Validation (MTGV) program. MTGV benefited from 2 types of radars: 8 operational radars from Météo-France located in the Tropics and one dedicated X-band radar (Koffi et al., 2014) which was installed in the West African super-site in Burkina Faso and provided high resolution rain maps in 2012 and 2013. Figure 6 shows the evaluation of BRAIN vs. the Météo-France radar from The Martinique Island in the Caribbean, based on statistical (rather than pixel-to-pixel) comparisons. The frequency distributions of the rain rates are in good agreement for this site; a slight underestimation of the amount of rainfall from the BRAIN retrievals, compared to the radar is also noticeable and spread over all rain rate classes.
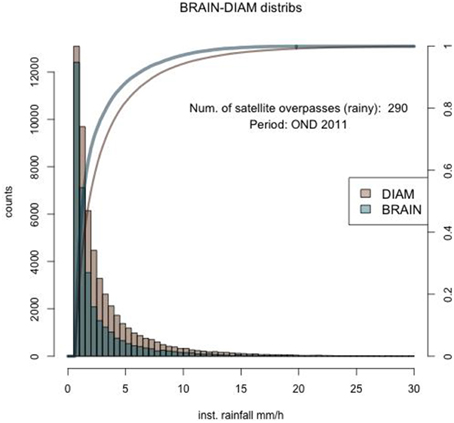
Figure 6. Histogram and cumulative distribution function of the rain rate distribution over the Meteo-France radar site of 'La Martinique' Island for the OND 2011 period as detected by the BRAIN retrieval (blue) and the radar (pink).
Relative humidity in the troposphere
There is a straightforward relationship between the upwelling radiances in the water vapor absorbing bands and the mean relative humidity of a large layer of the atmosphere weighted by the Jacobian of the brightness temperature to the relative humidity (Brogniez et al., 2009). This relationship has been adjusted to account for the spectral characteristics of the 3 first channels of the SAPHIR radiometer at ±0.2, ±1.1, and ±2.8 GHz around the 183.31 GHz water vapor absorption line. As a result, Upper Tropospheric relative Humidity (UTH) is retrieved for non-precipitating scenes as discussed in Brogniez et al. (2015) for 3 layers. The three UTHs depict the relative humidity averaged within the atmospheric layer covered by the RH Jacobians. Following Figure 4, the UTH1 (from channel 1) is mainly representative of the 100–500 hPa, the UTH2 (from channel 2) is slightly lower and covers 200–600 hPa, while UTH3 (from channel 3) covers the 300–750 hPa layer. Note that these are average positions of the RH jacobians, and their actual peak and width depend on the vertical distribution of RH: from a dry to a moist atmosphere, the function will shift from the mid-troposphere toward the upper troposphere. A dedicated error model has been put forth that permits an estimation of the uncertainty on the layer mean relative humidity. The retrieval outputs compare very well with the radiosondes based measurements with a small absolute bias (<2%) and a RMS of 0.75%, 4.4, and 4.4% for the three (1–3) channels, respectively.
Furthermore, an algorithm has been designed to retrieve the relative humidity (RH) profile over 6 unevenly spaced layers in the atmosphere. Relative humidity profiles are estimated from SAPHIR measurements using a purely statistical approach based on the optimization of a Generalized Additive Model (GAM) (Wood, 2006). The design and optimization of GAM is performed for each layer of the profile, and relies on penalized regression cubic splines for the modeling of the non-linearity of the inverse problem (Sivira et al., 2015). The comparison of the RH profiles to radiosounding measurements presented in Figure 7 reveals a very good agreement between the observed and the estimated RH profiles, with a RMS of nearly 10% in the mid-troposphere, similar to existing approaches based on 183.31 GHz data (e.g., Kuo et al., 1994; Liu and Weng, 2005).
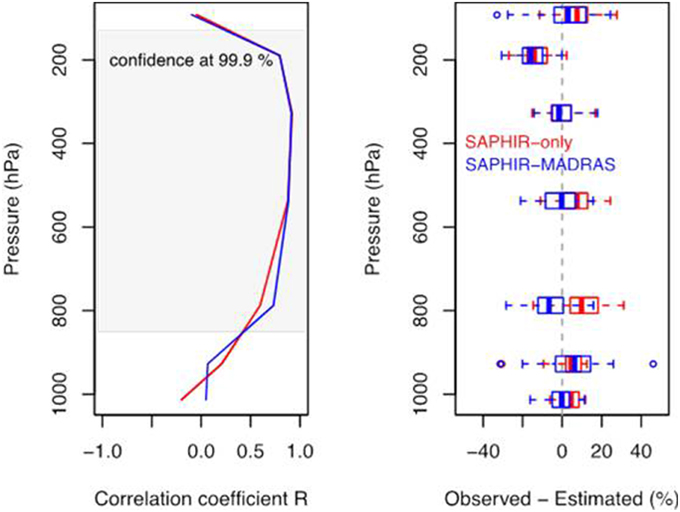
Figure 7. Vertical profile of correlation (left) and differences (right) in %RH for the SAPHIR-only (red) and the SAPHIR-MADRAS(blue) retrievals, computed over a subset of 50 radiosoundings from the CINDY/DYNAMO/AMIE campaign. For the profiles of the differences between the observed and estimated RH, the box and whiskers diagram indicates for each layer, the median (central vertical line) and the lower and upper quartiles (left and right edges of the box). The whiskers indicate the lower and upper limits of the distribution within 1.5 times the interquartile range from the lower and upper quartiles, respectively. From Sivira et al. (2015).
Top of the atmosphere radiation flux
While precipitation and humidity can be compared to in-situ or to ground-based data for evaluation purposes, it is not the case for the TOA radiative fluxes. Similarly to the radiance validation procedure (Section The Mission and Its Performance), the instantaneous fluxes in both the shortwave and the longwave domains have been compared using the collocated CERES and ScaRaB data sets. The overall performances of the SCARAB derived flux is scene dependent with slightly better comparison scores over land and desert than over ocean (Raberanto et al., 2015). An example is provided in Table 4 that indicates that the instantaneous fluxes are characterized by an average Root Mean Square error (RMS) of 10.5 Wm−2 for SW and 3 Wm−2 for LW within the initial specifications (RMS ~10 Wm−2).
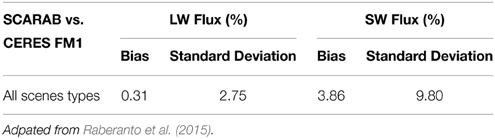
Table 4. Statistics of comparison between SCARAB and CERES TOA SW flux.
Level-4 Products
The level-4 products derived from the GPM and Megha-Tropiques payloads rely on the use of geostationary data from the fleet of operational meteorological satellites. A significant effort has been dedicated to control the quality of the GEO observations (Szantai et al., 2011) to insure the best usage of the meteorological satellites. Similarly, an in-depth evaluation of a cloud classification technique that provides contextual information of the interpretation of MT data, using the A-TRAIN observations has been finalized (Sèze et al., 2015).
Daily accumulated rainfall at 1° × 1°
The Tropical Amount of Precipitation with an Estimation of ERror (TAPEER) product is based on the merging of the infrared geostationary imagery with the multiplatform surface instantaneous rain rates obtained from the Level 2 products (Chambon et al., 2012a). The algorithm is based on an adjusted GOES-Precipitation Index technique (Xu et al., 1999). The uncertainty emerging from the discrete sampling of the rainfall fields by the satellite observations is estimated using the model of Roca et al. (2010b). For summer 2012, the algorithm makes use of the BRAIN retrievals applied onto the suite of radiometers TMI/TRMM, AMSR2/GCOM-W, SSMI/F15, SSMIS/F16, SSMIS/F17, SSMIS/F18, and MADRAS/MT. These instantaneous estimates are merged with the geostationary observations from GOES-15, GOES-13, GOES-14, MSG-2, MET-7, and MTSAT-2. The current implementation works with a 5° × 5 day training dataset which has been identified as a good compromise for stability and accuracy for such a constellation (Chambon et al., 2012b). A 30 min resolution for the IR imagery is used to construct the daily rainfall accumulation.
The evaluation of TAPEER daily estimates is based on comparisons with various rainfall products that include ground rain gauges, and/or satellite information as well as a systematic use of the operational and research rain gauges networks. The uncertainty information is also used in the satellite product validation step (Chambon et al., 2012a). Figure 8 presents a map of the number of rainy days (defined as above 1 mm per day) detected by TAPEER and by the GPCP v2.2 estimate (Huffman et al., 2001) during the boreal summer 2012 period. The two products agree very well with each other especially over the African continental region where both the number of days and the geographical patterns match well; less so over the tropical ocean. An evaluation of the TAPEER products against gauge networks of various densities in different tropical locations has been performed: in Africa over the dense AMMA-CATCH networks (Gosset et al., 2013) and in South America and India. These comparisons confirmed the skill of TAPEER in terms of detection of the daily rainfall with good correlations between the ground based and the TAPEER time series despite the product not making any use of rain gauge data.
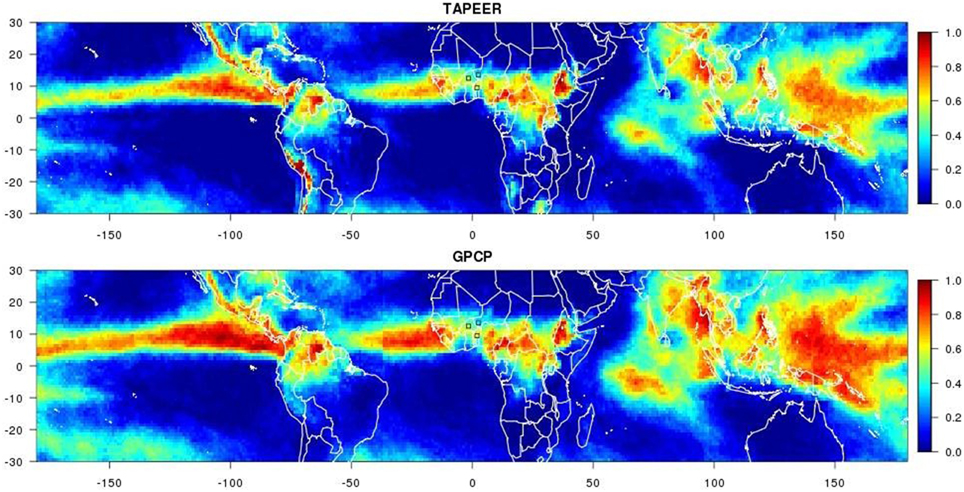
Figure 8. Fraction of the time with rainy days above 1 mm/day in the JJAS 2012 period, as seen by TAPEER (top) and GPCP (bottom).
Composite life cycle of mesoscale convective systems
The final suite of products derived from the MT mission payloads in combination with the geostationary IR imagery addresses the life cycle of the Mesoscale Convective Systems (MCS). It corresponds to the realization of a composite of the MT instruments overpasses at each steps of the individual storms life cycle (Fiolleau and Roca, 2013b). The detection and characterization of the MCS life cycle is performed using a newly developed tracking algorithm (Fiolleau and Roca, 2013a). Despites the limited swath size of the instruments, significant composites can be readily obtained thanks to the MT sampling as discussed in details in Fiolleau and Roca (2013b).
Note that while the present review emphasizes the French contribution to the Megha-Tropiques mission, results from researchers from India have been summarized by Gohil et al. (2013). The SAPHIR (e.g., Mathur et al., 2013), MADRAS (Raju et al., 2013) and SCARAB (e.g., Sathiyamoorthy et al., 2013) based investigations complement the present status of the scientific perspective on the MT mission in its early period.
Toward the Proof of Concept of the MT Mission
The MT mission was selected in France in 1993 (Desbois et al., 2007) when satellite measurements dedicated to water and energy observations were in their infancy. More than 20 years later, when a full blown fleet of satellites is now operating and at the moment we are entering the GPM era, we revisit the proof of concept of the MT mission.
Monitoring the Time Evolution of Convective Events: Example of Hurricane Sandy
Figure 9 shows all the snapshots at 89 GHz (Horizontal) of Hurricane Sandy on 23th and 24th of October 2012 while the system is transitioning from Tropical Storm to Category-2 Hurricane. The white scan lines are lost data due to the backend electronic interference affecting the instrument as mentioned in Section The Mission and Its Performance. Overall, the figures depict qualitatively how good is the sampling from such a low-inclination orbit for long lasting systems like hurricanes. As a mean of comparison, while MADRAS caught the system 9 times in 2 days, TRMM/TMI observed the region 3 times and each of the DMSP satellites about twice per day. Sandy was last observed by MADRAS on October 25th when about to cross over the West Indies (Figure 10).
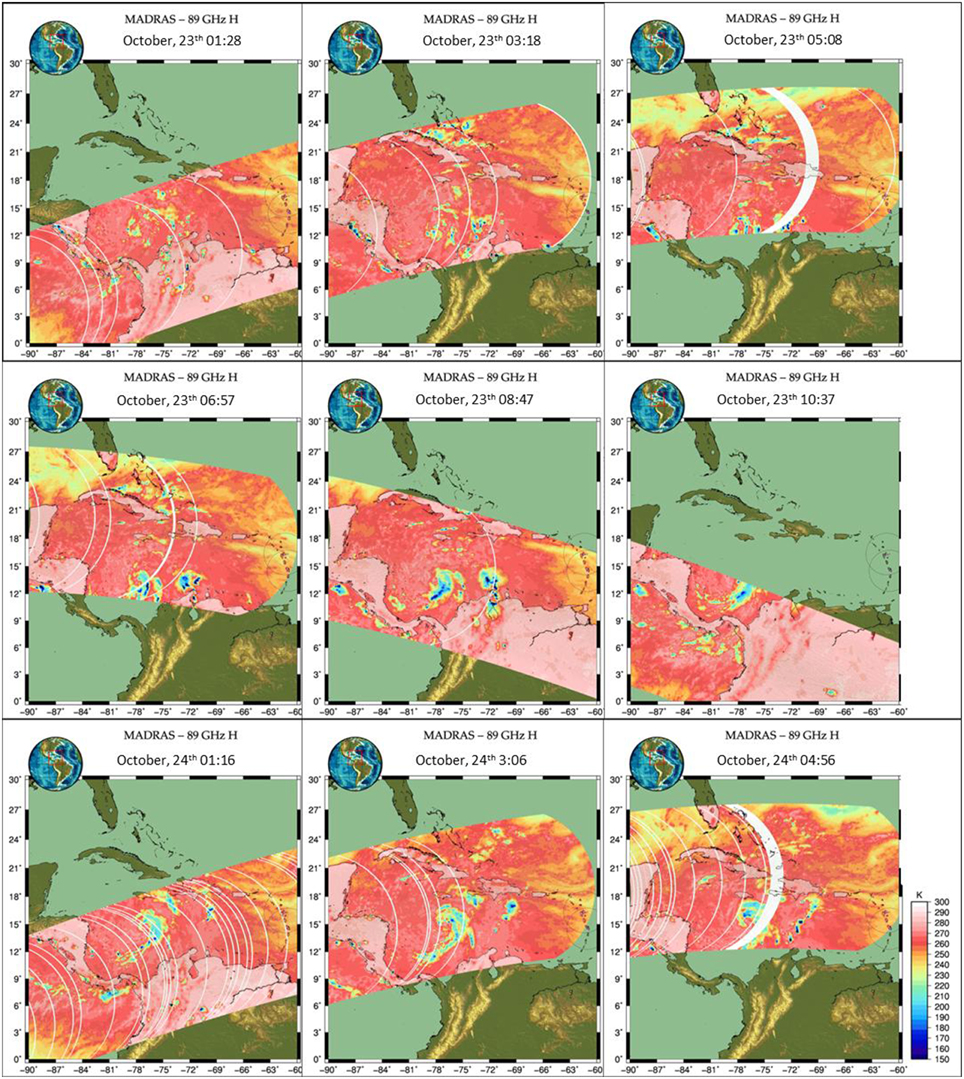
Figure 9. Time series of MADRAS 89 GHz observations of Hurricane Sandy from October 23 to 24, 2012.
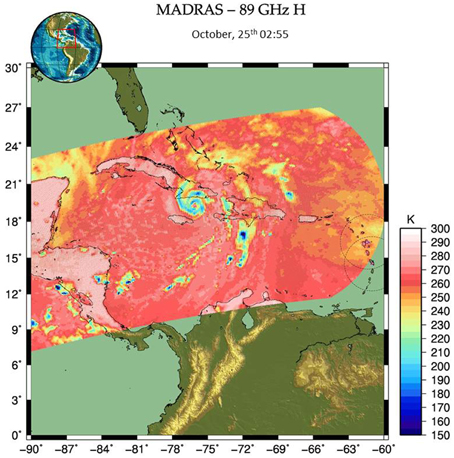
Figure 10. Same as Figure 8 but for the latest available snapshot of Sandy by MADRAS obtained on October 25th, 2012 at 2:55 local time.
Such an enhanced time sampling forms the basis of the composite products presented in Section The Mission and Its Performance and can be generalized not only to hurricanes but to all the MCS that populate the intertropical belt (Fiolleau and Roca, 2013b).
Impact of the Assimilation of the SAPHIR Clear Sky Radiances on the Météo-France Forecasting System
Hindcast experiments of assimilation of the SAPHIR radiances in the Météo-France global model ARPEGE reveal systematic improvements in the humidity distribution (Chambon et al., 2014). The positive impact of SAPHIR observations is seen early in the forecasts with up to 10% of improvement of the root mean square error on the relative humidity field between 200 and 300 hPa; it can also be seen in the lower level humidity distribution up to 72 h forecasts (1–3% of RMSE improvements between 850 and 500 hPa). In the observation space, the assimilation of SAPHIR led to an increase by a factor of 3.8 in the number of microwave observations sensitive to humidity used in the ARPEGE 4D-Var data assimilation system, with respect to other sensors such as AMSU-B and MHS. Figure 11 indicates that the comparisons of the model, in terms of analysis and 6 h forecasts, to other sounders like MHS onboard MetOp-A are improved: this is a good indicator of the positive interaction between SAPHIR and the present observing system.
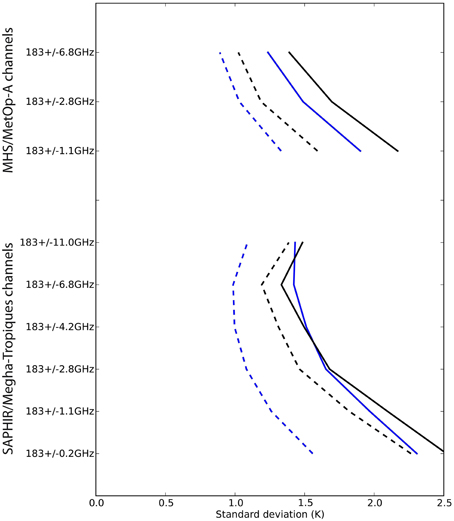
Figure 11. Improvements of innovation statistics of MHS/MetOp-A and SAPHIR/MT when SAPHIR is assimilated into the ARPEGE global model operational at Météo France. Innovation statistics are defined as the standard deviation of difference: observation minus model-simulated observations. In full lines, the simulated observations are based on short-range model forecasts and in dashed lines they are based on model analyses. Black lines are for the control experiment, and blue lines correspond to the experiment with SAPHIR data assimilated. From Chambon et al. (2014).
Impact of the MADRAS Data on Daily Accumulation Rainfall Estimation
The estimation of the improvements, due to MADRAS to the GPM constellation for daily accumulation rainfall estimation is not an obvious task. Synthetic computations indicate that a significant positive impact is expected from a low inclination satellite but adding sun synchronous observations does not change much the rainfall estimates after a given amount of satellite have been integrated in the constellation (Chambon et al., 2012b). To be useful to the multiplatform algorithm, the MADRAS radiometer should bring in a significant amount of rainy pixels to the merging process. The quantity of useful pixels depends on: (i) the quality and availability of the level 1 observations, (ii) the phasing between the MT sampling and the diurnal cycle of rainfall, and (iii) on the sampling brought by other members of the constellation. The currently available version of the MADRAS level 1 data, version 1.5, is an intermediate version and availability and quality will be improved in the next release. The 51 days precession cycle of the MT orbit yields a time varying sampling of the diurnal cycle well suited to study continental convection and rainfall in the tropics (Desbois et al., 1988). This effect and the third point mentioned above are illustrated in Figure 12. It shows 2 days in July 2012 over West Africa for which the TAPEER algorithm is run using a constellation that includes or excludes MADRAS. On July 18th, where MADRAS is not well phased with the rainfall event, the comparison between the two TAPEER computations shows small differences (less than 10%). On the opposite, on July 15th, where the phasing is better and more MADRAS observations are processed by the algorithm, the impact is much more clear with differences up to 100% (Figure 12). Further work is needed to establish statistics on the impact of the MADRAS imager to rainfall estimation.
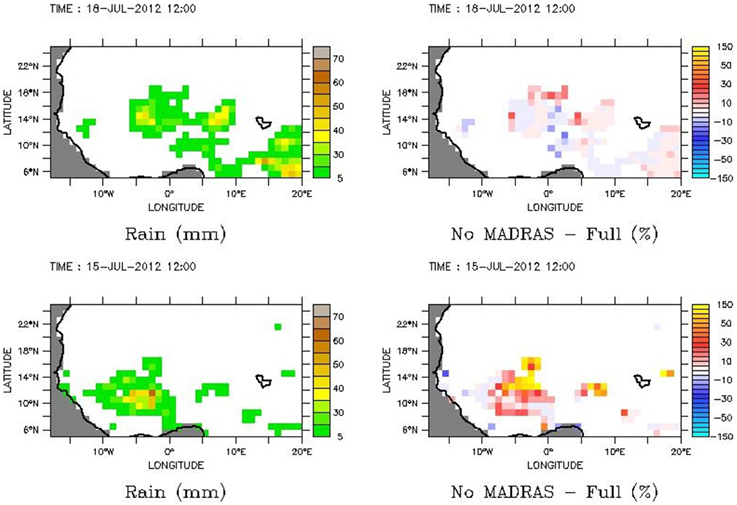
Figure 12. TAPEER daily rainfall for July 18 (top) and July 15, 2012 (bottom). The daily rainfall (left) and the relative difference without MADRAS-with MADRAS computation (right).
Conclusions
The Megha-Tropiques mission is operating since October, 2011. A long commissioning phase resulted in significant delays in the performance assessment of both the instruments and the geophysical products. After 3 years, it is seen that the instrumentation is performing within the specifications and the SAPHIR and SCARAB instruments are continuously acquiring measurements nominally. The level 1 data are readily available. Furthermore, the real time stream of the SAPHIR data has been operational since May 2014 by EUMETSAT though EUMetCast. MADRAS stopped data acquisition on January 26th, 2013; the MADRAS data are in an intermediate version and are still under a restricted data policy. Efforts are directed toward making a final version widely available in a short term future. A suite of geophysical products derived from MT and the GPM constellation platforms has been finalized and evaluated. The products show good levels of performance. Most of these products are already or are going to be widely available in a near future.
The last three decades have witnessed a strong enhancement of the water and energy cycle observing space fleet. Preliminary results suggest that the MT low inclined orbit brings in useful additional information for assimilation, rainfall constellation-based estimation and convective event monitoring, even under a modern and very dense observing system. This proof of concept should be consolidated using the full length of the MT record in order to quantify and demonstrate the importance of a tropical orbit mission. The operational use of SAPHIR is in its infancy and more is to be learned in the near future from operational forecasters on the importance of such a tropical orbit.
A natural extension of this preliminary analysis consists of combining together the various MT payloads. For instance, the investigation of cloud radiative forcing in the deep tropics with SCARAB would benefit from the concurrent observations of water vapor loading (from MADRAS and SAPHIR) in the clear and cloudy environments as identified as a key issue to understand the cloud radiative forcing (Thampi and Roca, 2014). As far as the precipitation scientific objectives are concerned, the loss of MADRAS is being mitigated with SAPHIR being used as a surrogate in the multi-platform data fusion algorithm. In particular, the use of the rain detection capability of SAPHIR permits to benefit from the MT sampling while using the 6 or 7 others GPM constellation radiometers for rain estimations (Roca, 2015). While the direct validation exercise has been recently finalized for all of the geophysical products, future work will be directed toward integrated validation efforts through hydrological modeling along the lines of Cassé et al. (2015) to assess the improvements of the MT mission for tropical flood monitoring.
The Megha-Tropiques mission has now reached the exploitation phase. Most of the data and the French geophysical products suite are validated and readily available for further scientific investigation by the international community and can be accessed at http://www.icare.univ-lille1.fr/mt.
Conflict of Interest Statement
The authors declare that the research was conducted in the absence of any commercial or financial relationships that could be construed as a potential conflict of interest.
Acknowledgments
The authors are grateful to Dr Michel Desbois who triggered and led the Megha-Tropiques mission from its inception up to 2007. We also acknowledge our late colleague Dr Michel Viollier for his significant contribution to the SCARAB scientific developments. Drs F. Aires, M. Capderou, L. Eymard, T. Fiolleau, I. Jobard, S. Kacimi, P.E. Kirstetter, A. Lifermann, A. Martini, D. Renaut, G. Sèze, and A. Szantai are all thanked for their useful contribution to the success of the scientific exploitation at various stages of its development. A large suite of short-term contract programmers considerably helped us to finalize the retrievals algorithms and their contributions to the mission are thankfully acknowledged. The authors further acknowledge Ms N. Karouche, T. Baroso, and M. M. Dejus, project managers at CNES for making the mission a reality and delivering the data to the scientists. The IPSL Climserv team efficiently hosted the development phase of the retrievals. The ICARE group is also acknowledged for realizing the scientific ground segment of the mission. Megha-Tropiques data are available at http://www.icare.univ-lille1.fr/mt. CNES and CNRS are gratefully acknowledged for the financial support to the scientific activity of the mission. The careful reading by the reviewers significantly helped to improve this paper.
Footnotes
1. ^Megha means cloud in Sanskrit and Tropiques means tropics in French. Megha-Tropiques was coined by R. Sadourny in the late 90's.
References
Aires, F., Bernardo, F., and Prigent, C. (2013). Atmospheric water-vapour profiling from passive microwave sounders over ocean and land. Part I: methodology for the Megha-Tropiques mission. Q. J. R. Meteorol. Soc. 139, 852–864. doi: 10.1002/qj.1888
Bernardo, F., Aires, F., and Prigent, C. (2013). Atmospheric water-vapour profiling from passive microwave sounders over ocean and land. Part II: validation using existing instruments. Q. J. R. Meteorol. Soc. 139, 865–878. doi: 10.1002/qj.1946
Brogniez, H., Clain, G., and Roca, R. (2015). Validation of Upper Tropospheric Humidity from SAPHIR onboard Megha-Tropiques using tropical soundings. J. Appl. Meteorol. Clim. 54, 896–908. doi: 10.1175/JAMC-D-14-0096.1
Brogniez, H., Kirstetter, P.-E., and Eymard, L. (2013). Expected improvements in the atmospheric humidity profile retrieval using the Megha-Tropiques microwave payload. Q. J. R. Meteorol. Soc. 139, 842–851. doi: 10.1002/qj.1869
Brogniez, H., Roca, R., and Picon, L. (2009). A study of the free tropospheric humidity interannual variability using Meteosat data and an advection-condensation transport model. J. Clim. 22, 6773–6787. doi: 10.1175/2009JCLI2963.1
Brown, P. J., and Kummerow, C. D. (2014). An assessment of atmospheric water budget components over tropical oceans. J. Clim. 27, 2054–2071. doi: 10.1175/JCLI-D-13-00385.1
Capderou, M. (2009). Sampling: Comparison with other Meteorological Satellites. Megha-Tropiques Technical Memorandum #1. Available online at: http://meghatropiques.ipsl.polytechnique.fr/available-documents/mttm/index.html
Capderou, M., Deleflie, F., and Chomette, O. (2013). Rendez-Vous Between MT and TERRA, Determination and Analysis. Megha-Tropiques Technical Memorandum #6. Available online at: http://meghatropiques.ipsl.polytechnique.fr/available-documents/mttm/index.html
Cassé, C., Gosset, M., Peugeot, C., Pedinotti, V., Boone, A., Tanimoun, B. A., et al. (2015). Potential of satellite rainfall products to predict Niger River flood events in Niamey. Atmos. Res. doi: 10.1016/j.atmosres.2015.01.010. (in press).
Chambon, P., Jobard, I., Roca, R., and Viltard, N. (2012a). An investigation of the error budget of tropical rainfall accumulation derived from merged passive microwave and infrared satellite measurements. Q. J. R. Meteorol. Soc. 139, 879–893. doi: 10.1002/qj.1907
Chambon, P., Meunier, L. F., Guillaume, F., Piriou, J. M., Roca, R., and Mahfouf, J. F. (2014). Investigating the impact of the water vapour sounding observations from SAPHIR on board Megha-Tropiques into the ARPEGE global model. Q. J. R. Meteorol. Soc. doi: 10.1002/qj.2478. (in press).
Chambon, P., Roca, R., Jobard, I., and Capderou, M. (2012b). The sensitivity of tropical rainfall estimation from satellite to the configuration of the microwave imagers constellation. IEEE Geosci. Remote Sens. Lett. 10. doi: 10.1109/LGRS.2012.2227668
Chomette, O., Kandel, R., Raberanto, P., Roca, R., and Viollier, M. (2012). “The european experiment ScaRaB (scanner for radiation budget),” in GEWEX-RFA Report, WCRP Report No. 19/2012, eds Raschke, Kine and Stackhouse, 75–80
Chomette, O., Raberanto, P., Capderou, M., Roca, R., Loeb, N., Bouniol, D., et al. (2015). Comparison of Radiances from SCARAB-3 on Board Megha-Tropiques and CERES FM-2 on Board Terra.
Clain, G., Brogniez, H., Payne, V., John, V., and Luo, M. (2014). An assessment of SAPHIR calibration using quality tropical soundings. J. Atmos. Oceanic Technol. 32, 61–78. doi: 10.1175/JTECH-D-14-00054.1
Defer, E., Galligani, V. S., Prigent, C., and Jimenez, C. (2014). First observations of polarized scattering over ice clouds at close-to-millimeter wavelengths (157 GHz) with MADRAS on board the Megha-Tropiques mission. J. Geophys. Res. Atmos. 119, 12301–12316. doi: 10.1002/2014JD022353
Desbois, M., Capderou, M., Eymard, L., Roca, R., Viltard, N., Viollier, M., et al. (2007). Megha-Tropiques: un satellite hydrométéorologique franco-indien. La Météorologie 57, 19–27. doi: 10.4267/2042/18185
Desbois, M., Kayiranga, T., Gnamien, B., Guessous, S., and Picon, L. (1988). Characterization of some elements of the sahelian climate and their interannual variations for July 1983, 1984 and 1985 from the Analysis of METEOSAT ISCCP Data. J. Clim. 1, 867–904.
Desbois, M., Roca, R., Eymard, L., Viltard, N., Viollier, M., Srinivasan, J., et al. (2003). “The Megha-Tropiques mission,” in Proceedings of SPIE, Vol. 4899, Atmospheric and Oceanic Processes, Dynamics, and Climate Change, 172. doi: 10.1117/12.466703
Duvel, J. P., Viollier, M., Raberanto, P., Kandel, R., Haeffelin, M., Pakhomov, L. A., et al. (2001). The ScaRaB-resurs earth radiation budget dataset and first results. Bull. Am. Metereol. Soc. 82, 1397–1408. doi: 10.1175/1520-0477(2001)082<1397:TSRERB>2.3.CO;2
Eymard, L., Gheudin, M., Laborie, P., Sirou, F., Le Gac, C., Vinson, J.-P., et al. (2002). The SAPHIR humidity sounder. Notes Act. Instrum. de l'IPSL 24.
Fiolleau, T., and Roca, R. (2013a). An algorithm for the detection and tracking of tropical mesoscale convective systems using infrared images from geostationary Satellite. Trans. Geosci. Remote Sens. 51, 4302–4315. doi: 10.1109/TGRS.2012.2227762
Fiolleau, T., and Roca, R. (2013b). Composite life cycle of tropical mesoscale convective systems from geostationary and low Earth orbit satellite observations: method and sampling considerations. Q. J. R. Meteorol. Soc. 139, 941–953. doi: 10.1002/qj.2174
Fontaine, E., Schwarzenboeck, A., Delanoë, J., Wobrock, W., Leroy, D., Dupuy, R., et al. (2014). Constraining mass–diameter relations from hydrometeor images and cloud radar reflectivities in tropical continental and oceanic convective anvils. Atmos. Chem. Phys. 14, 11367–11392. doi: 10.5194/acp-14-11367-2014
Gohil, B. S., Gairola, R. M., Mathur, A. K., Varma, A. K., Mahesh, C., Gangwar, R. K., et al. (2013). Algorithms for retrieving geophysical parameters from the MADRAS and SAPHIR sensors of the Megha-Tropiques satellite: Indian scenario. Q. J. R. Meteorol. Soc. 139, 954–963. doi: 10.1002/qj.2041
Goldstein, C., and Karouche, N. (2013). CAL/VAL MADRAS Radiometric Sensitivity, report MAD_RAD_02 TRO-NT-32-NT-2817-CNES, 8. Available online at: http://smsc.cnes.fr/MEGHAT/PDF/MADRASRadiometricSensitivity.pdf
Gosset, M., Viarre, J., Quantin, G., and Alcoba, M. (2013). Evaluation of several rainfall products used for hydrological applications over West Africa using two high-resolution gauge networks. Q. J. R. Meteorol. Soc. 139, 923–940. doi: 10.1002/qj.2130
Hou, A. Y., Kakar, R. K., Neeck, S., Azarbarzin, A. A., Kummerow, C. D., Kojima, M., et al. (2014). The global precipitation measurement mission. Bull. Amer. Meteor. Soc. 95, 701–722. doi: 10.1175/BAMS-D-13-00164.1
Huffman, G. J., Adler, R. F., Morrissey, M. M., Bolvin, D.T., Curtis, S., Joyce, R., et al. (2001). Global precipitation at one-degree daily resolution from multisatellite observations. J. Hydrometeor 2, 36–50. doi: 10.1175/1525-7541(2001)002<0036:GPAODD>2.0.CO;2
Kandel, R., Monge, J. L., Viollier, M., Pakhomov, L. A., Adasco, V. I., Reitenbach, R. G., et al. (1994). The ScaRaB project: earth radiation budget observations from the meteor satellites. Adv. Space Res. 14, 47–54. doi: 10.1016/0273-1177(94)90346-8
Kandel, R., and Viollier, M. (2010). Observation of the Earth's radiation budget from space. Comptes Rendus Geosci. 342, 286–300. doi: 10.1016/j.crte.2010.01.005.
Kandel, R., Viollier, M., Raberanto, P., Duvel, J. P., Pakhomov, L. A., Golovko, G. A., et al. (1998). The ScaRaB earth radiation budget dataset. Bull. Am. Meteor. Soc. 79, 765–783.
Karouche, N., Goldstein, C., Rosak, A., Malassingne, C., and Raju, G. (2012). “Megha-Tropiques satellite mission: in flight performances results,” in Geoscience and Remote Sensing Symposium (IGARSS), 2012 IEEE International, 4684–4687.
Kirstetter, P.-E., Viltard, N., and Gosset, M. (2013), An error model for instantaneous satellite rainfall estimates: evaluation of BRAIN-TMI over placeWest Africa. Q. J. R. Meteorol. Soc. 139, 894–911. doi: 10.1002/qj.1964
Koffi, A. K., Gosset, M., Zahiri, E.-P., Ochou, A. D., Kacou, M., Cazenave, F., et al. (2014). Evaluation of X-band polarimetric radar estimation of rainfall and rain drop size distribution parameters in West Africa. Atmos. Res. 143, 438–461. doi: 10.1016/j.atmosres.2014.03.009
Kummerow, C., Barnes, W., Kozu, T., Shiue, J., and Simpson, J. (1998). The tropical rainfall measuring mission (TRMM) sensor package. J. Atmos. and Ocean Tech. 15, 808–816.
Kuo, C., Staelin, D., and Rosenkranz, P. (1994). Statistical iterative scheme for estimating atmospheric relative humidity profiles. IEEE Trans. Geosci. Remote Sens. 32, 254–260. doi: 10.1109/36.295039
Liu, Q., and Weng, F. (2005). One-dimensional variational retrieval algorithm of temperature, water vapor and cloud water profiles from Advanced Microwave Sounding Unit (AMSU). IEEE Trans. Geosci. Remote Sens. 43, 1087–1095. doi: 10.1109/TGRS.2004.843211
Loeb, N. G., Wielicki, B. A., Doelling, D. R., Louis Smith, G., Keyes, D. F., Kato, S., et al. (2009). Toward optimal closure of the earth's top-of-atmosphere radiation budget. J. Clim. 22, 748–766. doi: 10.1175/2008JCLI2637.1
Martini, A., Viltard, N., Ellis, S. M., and Fontaine, E. (in press). Ice microphysics retrieval in the convective systems of the Indian Ocean during the CINDY-DYNAMO campaign. Atmos. Res. doi: 10.1016/j.atmosres.2014.12.013
Mathur, A. K., Gangwar, R. K., Gohil, B. S., Deb, S. K., Kumar, P., Shukla, M. V., et al. (2013). Humidity profile retrieval from saphir on-board the Megha-Tropiques. Curr. Sci. 104, 1650–1655.
Moradi, I. (2014). “Inter-calibration of observations from SAPHIR and ATMS instruments,” in GSICS Quarterly, Vol. 8 (College Park, MD: GSICS Coordination Center), 1–2.
Pierrehumbert, R. T. (1995). Thermostats, radiator fins, and the local runaway greenhouse. J. Atmos. Sci. 52, 1784–1806. doi: 10.1175/1520-0469(1995)052<1784:TRFATL>2.0.CO;2
Raberanto, P., Chomette, O., Capderou, M., and Roca, R. (2015). Validation of Flux from SCARAB-3 on Board Megha-Tropiques.
Raju, C. S., Antony, Y., Mathew, N., Uma, K. N., and Krishna Moorthy, K. (2013). MT-MADRAS brightness temperature analysis for terrain characterization and land surface microwave emissivity estimation. Curr. Sci. 104, 1643–1649.
Robertson, F. R., Bosilovich, M. G., Roberts, J. B., Reichle, R. H., Adler, R. Ricciardulli, L., et al. (2014). Consistency of estimated global water cycle variations over the satellite era. J. Clim. 27, 6135–6154. doi: 10.1175/JCLI-D-13-00384.1
Roca, R., Aublanc, J., Chambon, P., Fiolleau, T., and Viltard, N. (2014). Robust observational quantification of the contribution of mesoscale convective systems to rainfall in the tropics. J Clim. 27, 4952–4958. doi: 10.1175/JCLI-D-13-00628.1
Roca, R., Bergès, J. C., Brogniez, H., Capderou, M., Chambon, P., Chomette, O., et al. (2010a). On the water and energy cycle in the tropics. C. R. Geosci. 342, 390–402. doi: 10.1016/j.crte.2010.01.003
Roca, R., Chambon, P., Jobard, I., Kirstetter, P.-E., Gosset, M., and Bergès, J. C. (2010b). Comparing satellite and surface rainfall products over West Africa at meteorologically relevant scales during the AMMA campaign using error estimates. J. App. Met. Clim. 49, 715–731. doi: 10.1175/2009JAMC2318.1
Roca, R. (2015). Contribution of the Megha-Tropiques Mission to the Global Precipitation Mission Constellation Based Accumulated Rainfall Estimation.
Sathiyamoorthy, V., Shukla, B. P., Sikhakolli, R., Chaurasia, S., Simon, B., Gohil, B. S., et al. (2013). Top of atmosphere flux from the Megha-Tropiques ScaRaB. Curr. Sci. 104, 1656–1661.
Sèze, G., Pelon, J., Derrien, M., Le Gléau, H., and Six, B. (2015). Evaluation against CALIPSO lidar observations of the multi-geostationary cloud cover and type dataset assembled in the framework of the Megha-Tropiques mission. Q. J. R. Meteorol. Soc. 141, 774–797. doi: 10.1002/qj.2392
Sherwood, S. C., Roca, R., Weckwerth, T., and Andronova, N. (2010). Tropospheric water vapor, convection and climate. Rev. Geophys. 48, RG2001. doi: 10.1029/2009RG000301
Sivira, R., Brogniez, H., Mallet, C., and Oussar, Y. (2015). A layer-averaged relative humidity profile retrieval for microwave observations: design and results for the from Megha-Tropiques payload. Atmos. Meas. Tech. 8, 1055–1071. doi: 10.5194/amt-8-1055-2015
Smith, G. L., Peter Szewczyk, Z., Priestley, K. J., and Roca, R. (2012). “Method of comparing CERES and ScaRaB 3 measurements,” in Proceedings of SPIE 8533, Sensors, Systems, and Next-Generation Satellites XVI, 85331D.
Srinivasan, J., and Joshi, P. C. (2007). What have we learned about the Indian monsoon from satellite data? Curr. Sci. 93, 165–172.
Stephens, G. L., and Ellis, T. D. (2008). Controls of global-mean precipitation increases in global warming gcm experiments. J. Clim 21, 6141–6155. doi: 10.1175/2008JCLI2144.1
Szantai, A., Six, B., Cloché, S., and Sèze, G. (2011). Quality of Geostationary Satellite Images. Megha-Tropiques Technical Memorandum #3, http://meghatropiques.ipsl.polytechnique.fr/available-documents/mttm/index.html
Tao, W.-K., and Moncrieff, M. W. (2009). Multiscale cloud system modeling. Rev. Geophys. 47, RG4002. doi: 10.1029/2008RG000276
Thampi, B. V., and Roca, R. (2014). Investigation of negative cloud radiative forcing over the Indian subcontinent and adjacent oceans during the summer monsoon season. Atmos. Chem. Phys. 14, 6739–6758. doi: 10.5194/acp-14-6739-2014
Tobin, I., Bony, S., and Roca, R. (2012). Observational evidence for relationships between the degree of aggregation of deep convection, water vapor, surface fluxes, and radiation. J. Clim. 25, 6885–6904. doi: 10.1175/JCLI-D-11-00258.1
Viltard, N., Burlaud, C., and Kummerow, C. D. (2006). Rain retrieval from TMI brightness temperature measurements using a TRMM PR–based database. J. Appl. Meteorol. Climatol. 45, 455–466. doi: 10.1175/JAM2346.1
Viollier, M., and Raberanto, P. (2010). Radiometric and spectral characteristics of the ScaRaB-3 instrument on Megha-Tropiques: comparisons with ERBE, CERES, and GERB. J. Atmos. Oceanic Technol. 27, 428–442. doi: 10.1175/2009JTECHA1307.1
Viollier, M., Standfuss, C., Chomette, O., and Quesney, A. (2009). Top-of-atmosphere radiance-to-flux conversion in the SW domain for the ScaRaB-3 instrument on Megha-Tropiques. J. Atmos. Oceanic Technol. 26, 2161–2171. doi: 10.1175/2009JTECHA1264.1
Wilheit, T., Brogniez, H., Datta, S., Liinwood Jones, W., Payne, V., Stocker, E., et al. (2013). “The use of SAPHIR on Megha-Tropiques for intercalibration of polar-orbiting microwave water vapor sounders,” in 2013 EUMETSAT Meteorological Satellite Conference 19th American Meteorological Society Satellite Meteorology, Oceanography, and Climatology Conference (Vienna: EUMETSAT and American Meteor Society), 272.
Xu, L., Gao, X., Sorooshian, S., Arkin, P. A., and Imam, B. (1999). A microwave infrared threshold technique to improve the GOES precipitation index. J. Appl. Meteorol. 38, 569–579.
Keywords: tropical water and energy budget, mesoscale convective systems, Megha-Tropiques, CERES, GPM
Citation: Roca R, Brogniez H, Chambon P, Chomette O, Cloché S, Gosset ME, Mahfouf J-F, Raberanto P and Viltard N (2015) The Megha-Tropiques mission: a review after three years in orbit. Front. Earth Sci. 3:17. doi: 10.3389/feart.2015.00017
Received: 16 February 2015; Accepted: 17 April 2015;
Published: 18 May 2015.
Edited by:
William Albert Lahoz, NILU - Norwegian Institute for Air Research, NorwayReviewed by:
William Albert Lahoz, NILU - Norwegian Institute for Air Research, NorwayChuntao Liu, Texas A&M University - Corpus Christi, USA
Mathias Milz, Luleå University of Technology, Sweden
Copyright © 2015 Roca, Brogniez, Chambon, Chomette, Cloché, Gosset, Mahfouf, Raberanto and Viltard. This is an open-access article distributed under the terms of the Creative Commons Attribution License (CC BY). The use, distribution or reproduction in other forums is permitted, provided the original author(s) or licensor are credited and that the original publication in this journal is cited, in accordance with accepted academic practice. No use, distribution or reproduction is permitted which does not comply with these terms.
*Correspondence: Rémy Roca, Observatoire Midi-Pyrénées, Laboratoire d'Etudes Géophysiques et d'Océanographie Spatiale, 14 Av Edouard Belin, 31400 Toulouse, France,cmVteS5yb2NhQGxlZ29zLm9icy1taXAuZnI=