 Toby Meierbachtol
 Joel Harper
 Jesse Johnson
- 1Department of Geosciences, University of Montana, Missoula, MT, USA
- 2Department of Computer Sciences, University of Montana, Missoula, MT, USA
Ice flows when gravity acts on gradients in surface elevation, producing driving stresses. In the Isunnguata Sermia and Russell Glacier catchments of western Greenland, a 50% decline in driving stress along a flow line is juxtaposed with increasing surface flow speed. Here, these circumstances are investigated using modern observational data sources and an analysis of the balance of forces. Stress gradients in the ice mass and basal drag which resist the local driving stress are computed in order to investigate the underlying processes influencing the velocity and stress regimes. Our results show that the largest resistive stress gradients along the flowline result from increasing surface velocity. However, the longitudinal coupling stresses fail to exceed 15 kPa, or 20% of the local driving stress. Consequently, computed basal drag declines in proportion to the driving stress. In the absence of significant resistive stress gradients, other mechanisms are therefore necessary to explain the observed velocity increase despite declining driving stress. In the study area, the observed velocity—driving stress feature occurs at the long-term mean position of the equilibrium line of surface mass balance. We hypothesize that this position approximates the inland limit where seasonal surface meltwater penetrates the bed, and that the increased surface velocity reflects enhanced basal motion associated with these meltwater perturbations.
Introduction
As the Greenland Ice Sheet (GrIS) loses mass at an accelerating rate (Shepherd et al., 2012), understanding the flow dynamics that control mass flux and geometry of the ice sheet has increasingly become a research priority. This has motivated the collection of new high resolution datasets over the last decade of GrIS surface topography (e.g., Helm et al., 2014; Howat et al., 2014), bed geometry (e.g., Bamber et al., 2013), and surface velocity (e.g., Joughin et al., 2010; Rignot and Mouginot, 2012). While gravity drives the flow of ice, numerous other factors (e.g., basal topography and substrate, ice temperature, and rheology) also influence the basal sliding and deformational motion of the ice sheet in response to gravitational forcing. These new datasets of the ice sheet's physical domain have allowed the driving stress and velocity fields to be quantified with increasing accuracy, and thus facilitate investigation of additional processes and conditions which influence ice motion.
Establishing those processes driving ice flow through simple comparison of driving stress with surface velocity can be complicated by viscous stresses within the ice column. These stresses resist the transmission of driving stress to the bed by redistributing it to neighboring regions. The magnitude of these internal stresses has been found to be substantial over length scales reaching several ice thicknesses (e.g., Price et al., 2002; van der Veen et al., 2011). Consequently, the stress regime near the ice sheet base, where deformation and sliding are concentrated, can deviate significantly from the driving stress. Where observations are sufficiently resolved, the magnitude of resistive stress gradients can be estimated computationally by a force budget. Given knowledge of ice temperature and geometry, the computed spatial gradients in surface velocity yield column-averaged longitudinal and lateral resistive stresses. Gradients in these stresses determine the fraction of driving stress that is taken up in the ice column, with the remainder being locally transmitted to the ice sheet bed.
The southwest region of the GrIS (Figure 1) was previously identified as having anomalously low driving stress compared to the bulk of the ice sheet (Bamber and Layberry, 2001; Layberry and Bamber, 2001) (driving stress calculations are discussed below). Available data at the time of this identification indicated increasing bed elevations and reverse bed slopes toward the ice margin, which were interpreted to be the reason behind an extensive “ice plain” and lower driving stress in the region (Layberry and Bamber, 2001). Low driving stress also extends north to the Isunnguata Sermia and Russell Glacier catchments (boxed area in Figure 1), but new airborne-based surface and bed topography indicate that increasing bed elevations there are absent (Figures 2, 3).
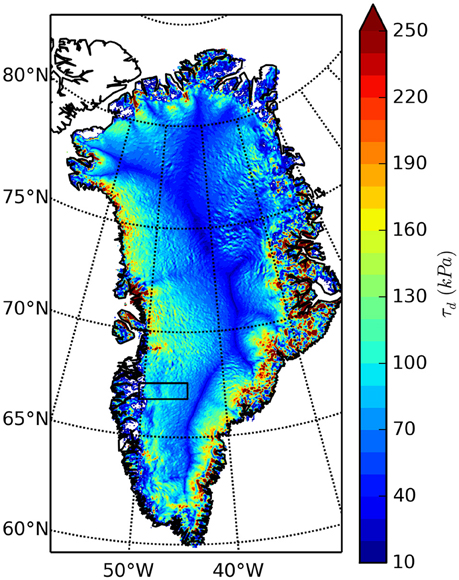
Figure 1. Driving stress calculated over the GrIS. Surface slopes are calculated over a 4 km length scale as described in the text. Black box outlines study area displayed in Figure 2.
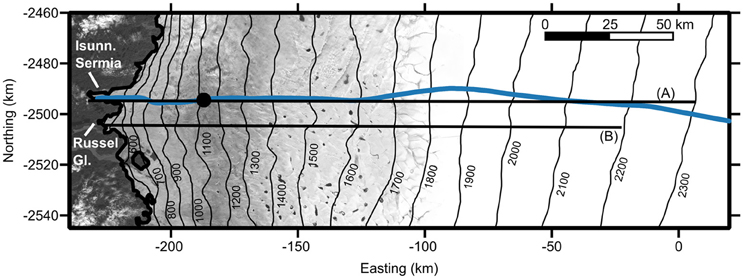
Figure 2. Study area. Surface elevation contours come from CryoSat-2 (Helm et al., 2014), and are overlain on a Landsat 8 image from July, 2015. Blue line locates the flow line used in Figure 8. Black dot locates the borehole yielding temperature data. Black lines identify the IceBridge transects presented in Figure 3.
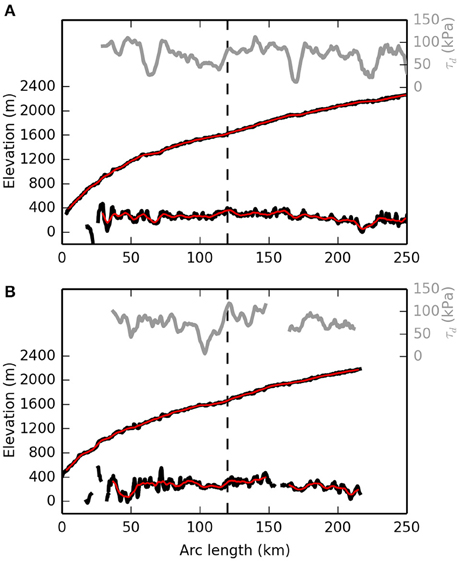
Figure 3. Surface and bed topography (black), and computed driving stress (gray) along two IceBridge flightlines (A) and (B) (Allen et al., 2010) which extend through our study area. Red lines represent smoothed topographic profiles used to compute driving stresses. Dashed black line marks the approximate onset of the decline in driving stress referenced throughout the text. Locations of the flightlines are shown in Figure 2.
For the Isunnguata Sermia and Russell Glacier catchments, high-resolution datasets of ice geometry, surface velocity, and borehole measurements of in situ ice sheet temperature (Harrington et al., 2015) are all available. Hence, this uniquely well-characterized region permits a well-constrained investigation of the factors behind a low driving stress and its relation to the observed surface motion. Here, motivated by incomplete explanation of the driving stress anomaly, we investigate the surface velocity profile accompanying the driving stress decline, and evaluate a force balance to assess the role of resistive stress gradients in modulating the transmission of low driving stress to the bed. We conclude by discussing the implications of the observed surface velocity and low driving stress for the deformational and basal sliding components of flow in the study area.
Study Area and Datasets
The study region in W-SW GrIS includes the Isunnguata Sermia and Russell Glacier catchments (Figure 2). These land-terminating outlet glaciers have been a focus of field-based research investigating subglacial hydrology (e.g., Chandler et al., 2013; Meierbachtol et al., 2013), lake drainage dynamics (Doyle et al., 2013; Dow et al., 2015), and meltwater influences on ice motion (e.g., Palmer et al., 2011; Bartholomew et al., 2012). The inland extent of the study domain reaches elevations of ~2300 m, and is selected based on the fidelity of InSAR velocity measurements, which degrade toward the ice sheet interior where control points are either based on balance velocity or are 100 s of km away from bedrock reference points (Joughin et al., 2010).
The relatively high density of observations made from remote (e.g., airborne-based radar) and in situ (e.g., borehole measurements) techniques uniquely position the study area for force balance analysis. InSAR-derived surface velocities from Joughin et al. (2010) define motion over the study reach during the winter period between Dec 1, 2008 and Feb 28, 2009, and are provided at 500 m spatial resolution. The digital elevation model (DEM) of bedrock topography by Bamber et al. (2013) is used. This DEM is informed by airborne radar flightlines that were collected at dense spacing (~500 m) through much of our study area as part of the IceBridge mission (Allen et al., 2010), and is posted at 1 km resolution.
We use the CryoSat-2 DEM (Helm et al., 2014) to define the ice sheet surface over the study area. It is posted at 1 km resolution. This surface DEM is advantageous in that it is computed from data collected using a single methodology (satellite radar altimetry) over a relatively short time period (2010–2012). This limits uncertainty arising from stitching together multiple datasets which were collected using different methods and over long time periods (e.g., the GIMP dataset).
Full depth ice temperature has been measured in multiple boreholes drilled in the ablation zone of the study reach (Harrington et al., 2015). In our force balance calculations we use a constant temperature of −10.2°C, which derives from the vertically averaged temperature measured in the study domains inland-most borehole (Figure 4), to determine the rate factor (Equation 9). This borehole is located 45.5 km from the terminus of Isunnguata Sermia (see Figure 2), where the ice thickness exceeds 800 m, but is still some 50 km down-flow from the driving stress anomaly of interest (see Section Results). As a result, the temperature value in our force balance calculations may be biased warm over the region of low driving stress (we discuss the implications of this in the Supplementary Material).
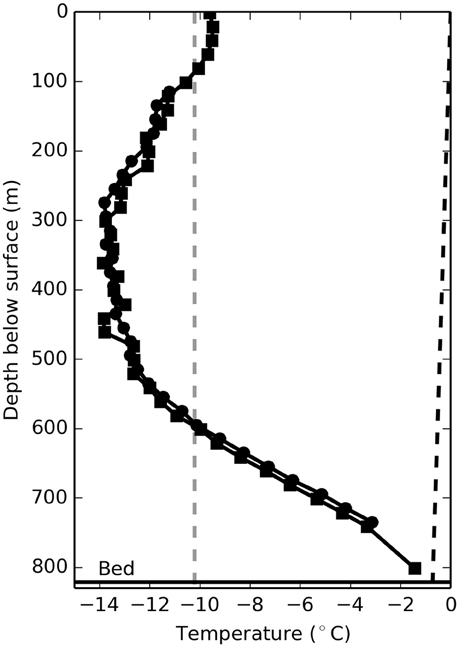
Figure 4. Temperature profiles in two boreholes, <20 m apart, drilled to the ice sheet bed (Harrington et al., 2015). Dashed black line represents the pressure melting temperature, calculated using a Clausius Clapeyron slope of 8.7 × 10⁻⁴°C m−1 for ice. Dashed gray line shows the average temperature of −10.2°C, calculated from the two profiles.
Force Balance
We implement the force balance technique developed by van der Veen and Whillans (1989a), which recasts the stress balance through the ice column in terms of its resistive and lithostatic components. In the direction of flow (x), gravitational driving stress (τd) is resisted by viscous stress gradients associated with longitudinal coupling (τl) and lateral shear (τt) to yield the resulting friction along the bed (τb):
The driving stress is calculated as:
where ρi is ice density, g is gravitational acceleration, H is ice thickness, and S is the surface elevation. Driving stress values are positive in the downstream direction. Viscous stresses acting in the same direction are also denoted positive when we assess the fraction of driving stress taken up by internal ice dynamics.
Calculation of the resistive terms τl and τt requires knowledge of ice temperature and stresses through the ice column that are poorly constrained. Where basal sliding constitutes a substantial fraction of observed surface motion, strain rates at depth are reasonably reflected by surface values, and the assumption of depth-invariance may be invoked (Price et al., 2002; O'Neel et al., 2005; van der Veen et al., 2011). Modeling and observation suggest that this assumption is satisfied in our study area, particularly where velocity errors are small (see Supplementary Material). We therefore adopt the assumption of depth-invariance in this study. In this isothermal block model, viscous terms are written as:
and
where y is the direction transverse to flow. Variables and represent the vertically averaged horizontal resistive stresses, and are expressed as:
and:
where n is Glen's exponent (assumed to equal 3) and strain rates are calculated from surface velocity gradients:
The effective strain rate in Equations (5) and (6) is given by:
which computes the vertical strain rate under the continuity condition . Vertical shear is omitted in Equation (8) following the depth-invariance assumption. Vertical resistive stresses in Equation (5) are omitted under the assumption that bridging effects are negligible over the length scales considered (~km). Vertical resistive stresses have been found to alter basal stress to a minor degree (van der Veen and Whillans, 1989b), particularly over grounded ice (Morlighem et al., 2010), supporting this omission. Horizontal resistive stresses in the ice are a function of the rate factor (B), which is temperature-dependent and follows the Arrhenius relation:
where A0 is an Arrhenius constant, Q is the activation energy for creep, R = 8.314 J mol−1K−1 is the universal gas constant, and T is the vertically averaged ice temperature.
Computational Methods and Selection of Smoothing Kernel
Input datasets must share a consistent spatial grid for force balance calculations. To achieve this, the velocity field is resampled at 1 km spacing to match the coarser DEMs. The bedrock DEM is projected to the same spatial projection as the velocity and surface elevation products, and linearly interpolated so that all datasets are populated along the same spatial coordinates. The bed DEM is then subtracted from the surface DEM to yield ice thickness. The force balance must be computed over a coarser resolution than 1 km in order to reduce the propagation of input data uncertainties. To achieve this, each dataset is smoothed using a two dimensional triangular smoothing window of size 4 × 4 km, and resampled at 4 km spacing to generate final datasets for the force balance calculations. The resulting ice thickness, surface slope, and surface speed are displayed in Figure 5.
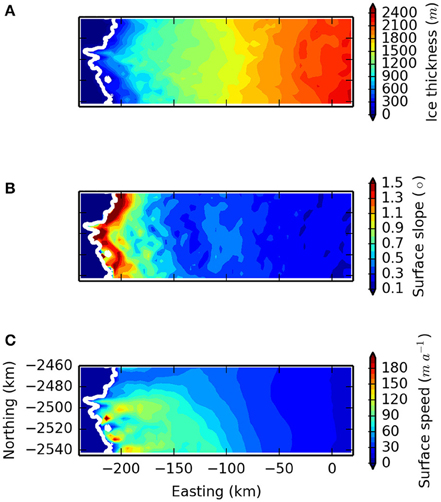
Figure 5. Ice thickness (A), surface slope (B), and surface speed (C) fields used for the force balance calculations after pre-processing as described in the text.
Each computed force balance term has a corresponding uncertainty that is a function of the input dataset uncertainty and length scale over which the spatial derivatives are computed (van der Veen, 2013). We use this error to inform the length scale of the smoothing window. Force balance components are computed using centered differences to calculate spatial derivatives over the resampled and smoothed data. We calculate uncertainty propagation following methods reported by Taylor (1997). Individual force balance and error components are computed as vectors on the x- and y-axes defined by the spatial projection, and then rotated to the local flow direction (which closely follows the projection x-axis) following established methods (van der Veen, 2013). Sensitivity testing indicates that the uncertainty in computed basal drag decreases to < 20% of the averaged basal drag values when the gridded data are resampled over 4 km (Figure 6). Input data are thus resampled over this length scale.
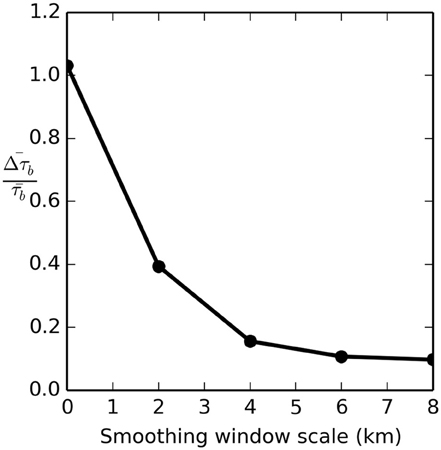
Figure 6. Mean basal drag uncertainty over the study domain () displayed as a fraction of the mean computed basal drag () for different smoothing window scales.
Results
Results from the force balance analysis over the study area are displayed in Figure 7. Figure 8 presents the force balance components along the flowline shown in Figure 2. This flowline is chosen because it terminates in the Isunnguata Sermia outlet. We have no reason to assume it is less representative than other flowlines through the study area.
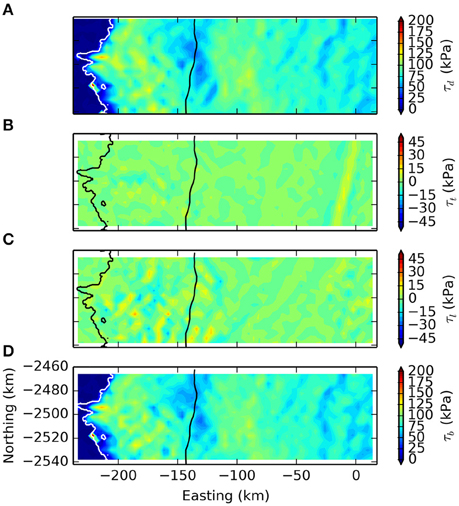
Figure 7. Force balance calculation results across the study domain showing driving stress (A), lateral drag (B), longitudinal stress gradient (C), and the basal drag residual (D). Black line shows the approximate long term ELA (1553 m elevation) for reference. Note the difference in scale between resistive terms (B,C), and driving stress (A) and basal shear (D).
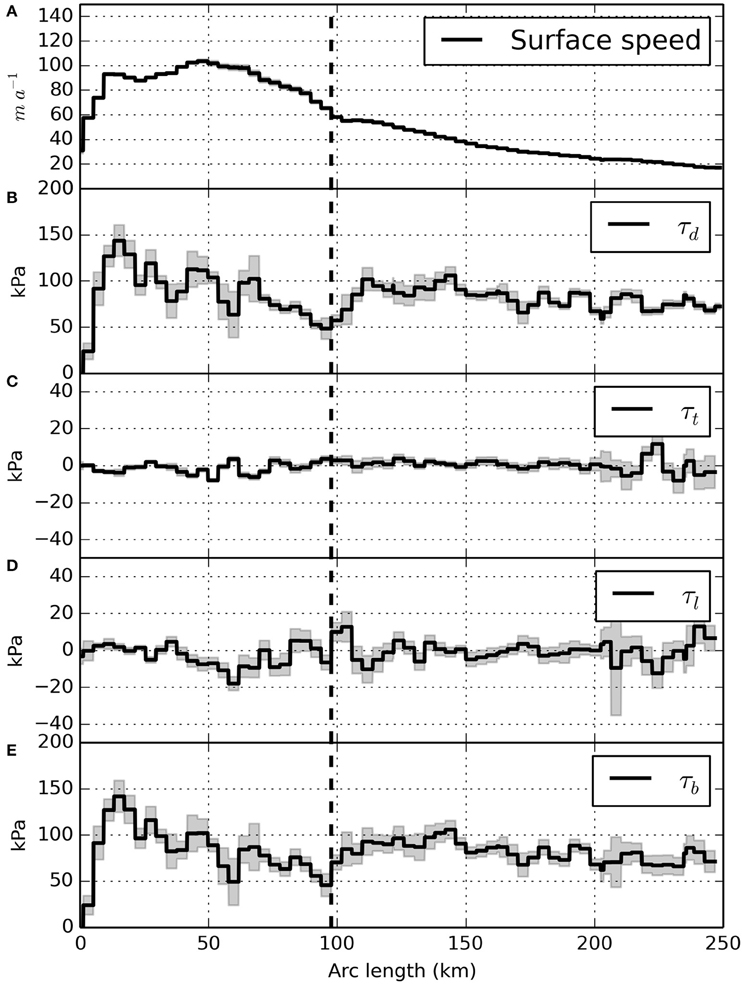
Figure 8. Force balance calculation results along the flowline presenting driving stress (B), lateral drag (C), longitudinal stress gradient (D), and basal drag (E). Surface speed is presented in (A) for reference. Shaded regions represent the computed uncertainty for each force balance component. Dashed black line locates the approximate long term ELA (1553 m elevation) for reference.
Driving Stress and Surface Velocity
With the exception of diminishing driving stress from thin ice near the margin, calculated driving stress across the study area is between ~50 and 120 kPa (Figure 7A). Along the flowline from the interior toward the ice margin, the driving stress shows an increasing trend from 75 kPa at 250 km to 100 kPa at 115 km (Figure 8B). Over the subsequent 20 km, driving stress falls by 50% from 100 kPa to a minimum of 50 kPa at 95 km. Away from the ice sheet edge, this marks the lowest driving stress along the entire flowline. Following the driving stress minimum, values slowly increase to a maximum of 140 kPa at 15 km before dropping near the ice sheet margin.
Surface flow speed generally increases from the interior toward the ice margin (Figures 5C, 8A). A brief plateau in speed at 110 km along the flowline is followed by a sharp increase to a peak value of 105 m a−1 ~50 km from the margin. The onset of the surface speed-up is coincident with declining driving stress and, with the exception of the ice sheet margin, the lowest driving stress values of the profile at 90–100 km align with the greatest increase in surface speed (Figure 8).
Force Balance
Lateral drag over the study area is small, and does not exceed 15 kPa in magnitude (Figure 7B). Gradients in longitudinal stresses (τl) are larger in magnitude than lateral drag. Fluctuations in τl are small in the interior, and increase in magnitude toward the ice sheet margin, locally reaching values between −25 and 25 kPa (Figure 7C).
Along the flowline, the largest positive τl are coincident with the acceleration in surface speed at 100 km. Here, τl reaches values that are ~20% of the local driving stress, or 15 kPa (Figure 8D). Positive longitudinal stress gradients subsequently decline toward the ice margin, trending to negative values that approach −20 kPa at 60 km. Negative τl acting against the direction of driving stress correspond to a change in curvature of the velocity profile from concave to convex.
Computed with our chosen averaging length scale, resistive stress components are no greater than ~20% of the corresponding driving stress anywhere on the flowline. Consequently, the deviations between basal drag and driving stress remain small (e.g., Figures 8B,E). Similar to the driving stress decline along the flowline, basal drag decreases by nearly 50% from 82 to 44 kPa between 103 and 95 km. Surface speed increases from 54 to 65 m a−1 over the same distance.
Discussion
Force Balance and Surface Velocity
The main conclusion from the force balance calculations is that basal traction balances most of the driving stress, including in the anomalous region where declining driving stress and increasing surface speed coincide. In ice stream settings, coincidence of declining driving stress, and increasing surface velocity has been used to define the onset of streaming flow, where a weak bed supports limited basal shear stress (e.g., Alley and Whillans, 1991; Bindschadler et al., 2001). The weak bed promotes increased sliding that draws down the ice surface, reduces surface slopes, and lowers driving stresses. The low resistive stress gradients we compute suggest that this behavior is not unique to marine terminating ice streams, but also occurs in our study area which terminates on land.
This interpretation, however, hinges on the assumption that ice sheet velocity and geometry are in balance over similar time scales. The datasets used in the force balance analysis span a period of a couple of years (assumptions and limitations of the force balance results are detailed in the Supplemental Material). While the datasets are self-consistent over this period, each likely reflects conditions that are unchanging over a different time scale. Observations show that the study area is not undergoing rapid thinning (Pritchard et al., 2009; Helm et al., 2014), suggesting that the surface geometry has been in a relatively steady state over perhaps many decades. However, while the velocity observations in the study area are consistent over multiple years, large changes in ice motion have been observed elsewhere on the ice sheet over time periods much shorter than the decadal scale that is likely represented by the surface geometry (Rignot and Kanagaratnam, 2006; Joughin et al., 2010). While these changes are generally limited to marine terminating regions, whether the observations in our study area can be interpreted to reflect ice dynamics over a longer time scale that is consistent with the surface geometry remains questionable.
This caveat complicates the interpretation of relationships between driving stress and velocity not just at our study area, but also in any study assimilating ice geometry and velocity into a physical modeling framework. Nevertheless, the unexpected finding that a substantial decline in driving stress is coincident with increasing surface velocity over such a large region (~20 km wide) begs explanation. We next explore processes that could explain this observation, bearing in mind the above caveat.
Enhanced Internal Deformation
Both direct observations and modeling indicate that in the study areas ablation zone the contribution to ice flow from internal deformation is secondary (see Supplementary Material). Nevertheless, in an effort to explore all possible scenarios, we assess whether enhanced internal deformation could accommodate the observed speed-up, despite declining driving stress. A zeroth order assessment can be achieved by assuming that deformation occurs by laminar flow, and estimating the minimum degree of softening necessary for ice deformation to maintain a constant velocity under reduced driving stress. Integrating the deformation rate through an ice column of thickness H yields the formula for surface velocity (U):
where E is an ill-constrained enhancement factor accommodating rheological changes and A is related to Equation (9) by A = B−n. In the absence of thickness changes, Equation (10) requires that the product of rheological factors E and A increase >6 fold to accommodate the documented drop in driving stress.
Achieving the required six-fold softening through warmer ice alone requires temperature changes that are unsupported by data. For instance, ice at −15°C must warm by 11°C in order to achieve the required softening, but this is contrary to borehole observations which show temperatures are still much colder lower in the ablation zone (Harrington et al., 2015). A more modest temperature increase (e.g., 5°C) would require doubling of the enhancement factor. Liquid water-induced softening through growth of a temperate basal layer is not physically viable, considering that a thick temperate layer is absent in the measured profile 50 km from the observed low driving stress (Harrington et al., 2015). Other factors influencing ice rheology (e.g., related to impurity content or crystal orientation) can cause E to change by a factor of two or more with ice depth (e.g., Shoji and Langway, 1984; Lüthi et al., 2002), but changes of a similar magnitude over the necessary horizontal length scales (~10 km) lack observational or conceptual basis.
Enhanced Basal Slip
If enhanced deformation is not a viable explanation, then the observed acceleration must result from enhanced basal slip. Knowledge of the thermal state of the ice-bed interface far from the ice sheet margin is lacking. However, there is broad agreement by numerical models that temperate basal conditions extend well inland of the ELA at our study area (Seroussi et al., 2013; Meierbachtol et al., 2015; Poinar et al., 2015), despite evidence of low geothermal heat flux (Meierbachtol et al., 2015). Consequently, it is unlikely that increased basal slip results from a frozen to temperate transition.
Assuming that temperate basal conditions extend above the ELA at our study region, the increased slip may result from a reduction in bed strength. If the basal substrate is composed of subglacial till, weakening must occur through changes in pore pressure and water saturation (Cuffey and Patterson, 2010). Alternatively, if the bed is predominantly hard bedrock, a redistribution of stresses to smaller contact patches would increase basal motion. In either scenario, a change in the amount or distribution of water at the bed is the most likely forcing mechanism.
Routing of surface water to the bed is well established lower in the ablation zone, but its inland extent remains unclear. Surface crevasses provide one mechanism facilitating meltwater transport. It has been suggested that conditions promoting crevasse formation are limited to below ~1400 m (Clason et al., 2015) to 1600 m elevation (Poinar et al., 2015) in the study area. Meltwater-induced seasonal variations in ice motion have been observed to elevations reaching ~1500–1600 m (Bartholomew et al., 2011; Palmer et al., 2011). Given this evidence, the long term measured ELA of 1553 m (van de Wal et al., 2012) appears to serve as a plausible limit of the inland extent of seasonal surface meltwater routing to the bed. Its location also aligns with the greatest rate of velocity change along the flowline (Figure 8), suggesting that the increase in velocity is related to the introduction of surface meltwater to the bed. If true, the fact that the velocity observations were collected during the winter period implies that the enhanced slip persists beyond the melt season.
Although the long term ELA aligns closely with accelerating velocity and declining driving stress, it has exhibited large variability over the past >20 years. Observational records along the nearby K-transect have shown that the annual ELA has varied from ~1400 to 1800 m (van de Wal et al., 2012). If the surface velocity and the ice sheet geometry are in a state of balance and reflect steady state flow dynamics over a decadal time scale across the study area, this implies that increased rates of sliding are sufficiently insensitive to seasonal variations in meltwater input so as to produce the observed ice geometry. Exactly why this is so is an intriguing question of basal hydrology beyond the scope of this paper. However, we note several factors which are perhaps relevant. First, owing to long travel paths (>100 km), and thick ice facilitating creep closure, the basal drainage system likely exhibits a high degree of isolation this far from the ice margin. Second, while the hydraulic potential field does not indicate a closed basin facilitating long term melt storage (see Supplementary Figure 2), the computed hydraulic gradient driving water flow is small due to the low surface slope. Coincident with the reduction in driving stress along the flowline, the hydraulic gradient declines in magnitude from nearly 80 Pa m−1 to < 40 Pa m−1. And third, the integration of basally generated melt from upstream temperate bed regions provides a continued source of basal water that introduces a buffering capacity against interannual variations in surface meltwater flux. These three factors may underpin the insensitivity of basal sliding to seasonal variations in meltwater input by modulating water flow variability at the bed.
Conclusions
Available datasets of ice geometry and surface speed indicate an unexpected relationship between gravitational driving stress and ice speed in a land terminating region of the western GrIS. Nearly 100 km from the ice sheet margin, driving stress declines by 50% over 20 km. This decline is colocated with an increase in surface speed that is the largest observed along a flowline through the well-studied Isunnguata Sermia drainage catchment. This finding shows that such behavior is not unique to ice stream onset in marine-terminating settings. Through force balance calculations, the effects of resistive stress gradients in modulating driving stress transmission to the bed are assessed. Lateral drag is found to be negligible over this interior region of the ice sheet. Longitudinal stress gradients locally reach 20% of the driving stress, but the declining driving stress is largely taken up by basal drag.
The surface speed for a given gravitational driving stress is a sensitive function of the properties of the ice and processes governing ice flow. At our study area, we find that possible explanatory mechanisms for increased surface motion despite low driving stress are limited to those associated with enhanced basal sliding. We hypothesize that this reflects a change in basal processes associated with the configuration and volume of water at the bed, rather than a transition from frozen to temperate basal conditions. This is supported by the colocation of the surface speed-up with the long term ELA in the study area, below which seasonal routing of surface meltwater to the ice sheet bed is likely.
The study area is defined by high ablation rates and low accumulation, owing to the blocking of southwesterly atmospheric moisture flow from the nearby Sukkertoppen ice cap (Ohmura and Reeh, 1991), which combine to yield the highest estimated ELA on the ice sheet (e.g., Reeh, 1991). At this elevation the ice is relatively thick and flat, making the driving stress sensitive to flattening from our hypothesized weakening of the bed. In this way, the interplay of surface mass balance and ice flow processes can generate unique driving stress and velocity characteristics in this heavily studied region.
Author Contributions
TM developed the project and performed all analysis and calculations. JH and JJ guided project development through collaborative discussions. All authors contributed to the writing of the manuscript.
Funding
This work is funded by SKB, NWMO, Posiva Oy, NAGRA, and NSF (PLR-ANS grants #1203418 and #0909495, PLR grant #1543533).
Conflict of Interest Statement
The authors declare that the research was conducted in the absence of any commercial or financial relationships that could be construed as a potential conflict of interest.
Acknowledgments
We thank the scientific editor FN, and reviewers SA, and SFP for comments which substantially improved the manuscript.
Supplementary Material
The Supplementary Material for this article can be found online at: http://journal.frontiersin.org/article/10.3389/feart.2016.00087
References
Allen, C., Leuschen, C., Gogineni, P., Rodriguez-Morales, F., and Paden, J. (2010). IceBridge MCoRDS L2 Ice Thickness, NASA DAAC at the Natl. Boulder, CO: Snow and Ice Data Center.
Alley, R. B., and Whillans, I. M. (1991). Changes in the West Antarctic ice sheet. Science 254, 959–963. doi: 10.1126/science.254.5034.959
Bamber, J. L., Griggs, J. A., Hurkmans, R. T. W. L., Dowdeswell, J. A., Gogineni, S. P., Howat, I., et al. (2013). A new bed elevation dataset for Greenland. Cryosphere 7, 499–510. doi: 10.5194/tc-7-499-2013
Bamber, J. L., and Layberry, R. L. (2001). A new ice thickness and bed data set for the Greenland ice sheet 1. Measurement, data reduction, and errors. J. Geophys. Res. 106, 33773–33780. doi: 10.1029/2001JD900054
Bartholomew, I., Nienow, P., Sole, A., Mair, D., Cowton, T., and King, M. A. (2012). Short-term variability in Greenland Ice Sheet motion forced by time-varying meltwater drainage: implications for the relationship between subglacial drainage system behavior and ice velocity. J. Geophys. Res. 117, 1–17. doi: 10.1029/2011JF002220
Bartholomew, I. D., Nienow, P., Sole, A., Mair, D., Cowton, T., King, M. A., et al. (2011). Seasonal variations in Greenland Ice Sheet motion: inland extent and behaviour at higher elevations. Earth Planet. Sci. Lett. 307, 271–278. doi: 10.1016/j.epsl.2011.04.014
Bindschadler, R. A., Bamber, J. L., and Anandakrishnan, S. (2001). Onset of streaming flow in the Siple Coast Region, West Antarctica. West Antarct. Ice Sheet Behav. Environ. 77, 123–136. doi: 10.1029/ar077p0123
Chandler, D. M., Wadham, J. L., Lis, G. P., Cowton, T., Sole, A., Bartholomew, I., et al. (2013). Evolution of the subglacial drainage system beneath the Greenland Ice Sheet revealed by tracers. Nat. Geosci. 6, 195–198. doi: 10.1038/ngeo1737
Clason, C. C., Mair, D. W. F., Nienow, P. W., Bartholomew, I. D., Sole, A., Palmer, S., et al. (2015). Modelling the transfer of supraglacial meltwater to the bed of Leverett Glacier, Southwest Greenland. Cryosphere 9, 123–138. doi: 10.5194/tc-9-123-2015
Dow, C. F., Kulessa, B., Rutt, I. C., Tsai, V. C., Pimentel, S., Doyle, S. H., et al. (2015). Modeling of subglacial hydrological development following rapid supraglacial lake drainage. J. Geophys. Res. Earth Surf. 120, 1127–1147. doi: 10.1002/2014jf003333
Doyle, S. H., Hubbard, A. L., Dow, C. F., Jones, G. A., Fitzpatrick, A., Gusmeroli, A., et al. (2013). Ice tectonic deformation during the rapid in situ drainage of a supraglacial lake on the Greenland Ice Sheet. Cryosphere 7, 129–140. doi: 10.5194/tc-7-129-2013
Harrington, J. A., Humphrey, N. F., and Harper, J. T. (2015). Temperature distribution and thermal anomalies along a flowline of the Greenland Ice Sheet. Ann. Glaciol. 56, 98–104. doi: 10.3189/2015AoG70A945
Helm, V., Humbert, A., and Miller, H. (2014). Elevation and elevation change of Greenland and Antarctica derived from CryoSat-2. Cryosphere 8, 1539–1559. doi: 10.5194/tc-8-1539-2014
Howat, I. M., Negrete, A., and Smith, B. E. (2014). The Greenland Ice Mapping Project (GIMP) land classification and surface elevation data sets. Cryosphere 8, 1509–1518. doi: 10.5194/tc-8-1509-2014
Joughin, I., Smith, B. E., Howat, I. M., Scambos, T., and Moon, T. (2010). Greenland flow variability from ice-sheet-wide velocity mapping. J. Glaciol. 56, 415–430. doi: 10.3189/002214310792447734
Layberry, R. L., and Bamber, J. L. (2001). A new ice thickness and bed data set for the Greenland ice sheet 2. Relationship between dynamics and basal topography. J. Geophys. Res. 106, 33781–33788. doi: 10.1029/2001JD900053
Lüthi, M., Funk, M., Iken, A., Gogineni, S., and Truffer, M. (2002). Mechanisms of fast flow in Jakobshavn Isbrae, West Greenland: Part III. Measurements of ice deformation, temperature and cross-borehole conductivity in boreholes to the bedrock. J. Glaciol. 48, 369–385. doi: 10.3189/172756502781831322
Meierbachtol, T., Harper, J., and Humphrey, N. (2013). Basal drainage system response to increasing surface melt on the Greenland ice sheet. Science 341, 777–779. doi: 10.1126/science.1235905
Meierbachtol, T. W., Harper, J. T., Johnson, J. V., Humphrey, N. F., and Brinkerhoff, D. J. (2015). Thermal boundary conditions on western Greenland: observational constraints and impacts on the modeled thermomechanical state. J. Geophys. Res. Earth Surf. 120, 623–636. doi: 10.1002/2014jf003375
Morlighem, M., Rignot, E., Seroussi, H., Larour, E., Ben Dhia, H., and Aubry, D. (2010). Spatial patterns of basal drag inferred using control methods from a full-Stokes and simpler models for Pine Island Glacier, West Antarctica. Geophys. Res. Lett. 37, 1–6. doi: 10.1029/2010GL043853
O'Neel, S., Pfeffer, W. T., Krimmel, R., and Meier, M. (2005). Evolving force balance at Columbia Glacier, Alaska, during its rapid retreat. J. Geophys. Res. 110:F03012. doi: 10.1029/2005JF000292
Ohmura, A., and Reeh, N. (1991). New precipitation and accumulation maps for Greenland. J. Glaciol. 37, 140–148.
Palmer, S., Shepherd, A., Nienow, P., and Joughin, I. (2011). Seasonal speedup of the Greenland Ice Sheet linked to routing of surface water. Earth Planet. Sci. Lett. 302, 423–428. doi: 10.1016/j.epsl.2010.12.037
Poinar, K., Joughin, I., Das, S. B., Behn, M. D., Lenaerts, J. T. M., and Broeke, M. R. (2015). Limits to future expansion of surface-melt-enhanced ice flow into the interior of western Greenland. Geophys. Res. Lett. 42, 1800–1807. doi: 10.1002/2015GL063192
Price, S. F., Bindschadler, R. A., Hulbe, C. L., and Blankenship, D. D. (2002). Force balance along an inland tributary and onset to Ice Stream D, West Antarctica. J. Glaciol. 48, 20–30. doi: 10.3189/172756502781831539
Pritchard, H. D., Arthern, R. J., Vaughan, D. G., and Edwards, L. A. (2009). Extensive dynamic thinning on the margins of the Greenland and Antarctic ice sheets. Nature 461, 971–975. doi: 10.1038/nature08471
Reeh, N. (1991). Parameterization of melt rate and surface temperature on the Greenland lce Sheet. Polarforschung 5913, 113–128.
Rignot, E., and Kanagaratnam, P. (2006). Changes in the velocity structure of the Greenland Ice Sheet. Science 311, 986–90. doi: 10.1126/science.1121381
Rignot, E., and Mouginot, J. (2012). Ice flow in Greenland for the International Polar Year 2008-2009. Geophys. Res. Lett. 39, 1–7. doi: 10.1029/2012GL051634
Seroussi, H., Morlighem, M., Rignot, E., Khazendar, A., Larour, E., and Mouginot, J. (2013). Dependence of century-scale projections of the Greenland ice sheet on its thermal regime. J. Glaciol. 59, 1024–1034. doi: 10.3189/2013JoG13J054
Shepherd, A., Ivins, E. R., A, G., Barletta, V. R., Bentley, M. J., Bettadpur, S., et al. (2012). A reconciled estimate of ice-sheet mass balance. Science 338, 1183–1189. doi: 10.1126/science.1228102
Shoji, H., and Langway, C. C. Jr. (1984). Flow behavior of basal ice as related to modeling considerations. Ann. Glaciol. 5, 141–148.
Taylor, J. R. (1997). An Introduction to Error Analysis, 2nd Edn. Mill Valley, CA: University Science Books.
van der Veen, C. J., Plummer, J. C., and Stearns, L. A. (2011). Controls on the recent speed-up of Jakobshavn Isbræ, West Greenland. J. Glaciol. 57, 770–782. doi: 10.3189/002214311797409776
van der Veen, C. J., and Whillans, I. M. (1989a). Force budget: I. Theory and numerical methods. J. Glaciol. 35, 53–60. doi: 10.3189/002214389793701581
van der Veen, C. J., and Whillans, I. M. (1989b). Force budget: II. Application to two-dimensional flow along byrd station strain network, Antarctica. J. Glaciol. 35, 61–67. doi: 10.3189/002214389793701455
Keywords: ice sheet dynamics, basal processes, driving stress, force balance, Greenland ice sheet
Citation: Meierbachtol T, Harper J and Johnson J (2016) Force Balance along Isunnguata Sermia, West Greenland. Front. Earth Sci. 4:87. doi: 10.3389/feart.2016.00087
Received: 05 April 2016; Accepted: 05 September 2016;
Published: 21 September 2016.
Edited by:
Felix Ng, University of Sheffield, UKReviewed by:
Surendra Adhikari, NASA Jet Propulsion Laboratory, USAStephen Frederick Price, Los Alamos National Laboratory, USA
Copyright © 2016 Meierbachtol, Harper and Johnson. This is an open-access article distributed under the terms of the Creative Commons Attribution License (CC BY). The use, distribution or reproduction in other forums is permitted, provided the original author(s) or licensor are credited and that the original publication in this journal is cited, in accordance with accepted academic practice. No use, distribution or reproduction is permitted which does not comply with these terms.
*Correspondence: Toby Meierbachtol, dG9ieS5tZWllcmJhY2h0b2xAdW1vbnRhbmEuZWR1