 Kristin Poinar
 Ian Joughin2
 David Lilien
 Ludovic Brucker
 Sophie Nowicki
- 1Cryospheric Sciences Laboratory, NASA Goddard Space Flight Center, Greenbelt, MD, USA
- 2Polar Science Center, Applied Physics Laboratory, University of Washington, Seattle, WA, USA
- 3Department of Earth and Space Sciences, University of Washington, Seattle, WA, USA
- 4Goddard Earth Sciences Technology and Research Studies and Investigations, Universities Space Research Association, Columbia, MD, USA
A firn aquifer in the Helheim Glacier catchment of Southeast Greenland lies directly upstream of a crevasse field. Previous measurements show that a 3.5-km long segment of the aquifer lost a large volume of water (26,000–65,000 m2 in cross section) between spring 2012 and spring 2013, compared to annual meltwater accumulation of 6000–15,000 m2. The water is thought to have entered the crevasses, but whether the water reached the bed or refroze within the ice sheet is unknown. We used a thermo-visco-elastic model for crevasse propagation to calculate the depths and volumes of these water-filled crevasses. We compared our model output to data from the Airborne Topographic Mapper (ATM), which reveals the near-surface geometry of specific crevasses, and WorldView images, which capture the surface expressions of crevasses across our 1.5-km study area. We found a best fit with a shear modulus between 0.2 and 1.5 GPa within our study area. We show that surface meltwater can drive crevasses to the top surface of the firn aquifer (~20 m depth), whereupon it receives water at rates corresponding to the water flux through the aquifer. Our model shows that crevasses receiving firn-aquifer water hydrofracture through to the bed, ~1000 m below, in 10–40 days. Englacial refreezing of firn-aquifer water raises the average local ice temperature by ~4°C over a ten-year period, which enhances deformational ice motion by ~50 m year−1, compared to the observed surface velocity of ~200 m year−1. The effect of the basal water on the sliding velocity remains unknown. Were the firn aquifer not present to concentrate surface meltwater into crevasses, we find that no surface melt would reach the bed; instead, it would refreeze annually in crevasses at depths <500 m. The crevasse field downstream of the firn aquifer likely allows a large fraction of the aquifer water in our study area to reach the bed. Thus, future studies should consider the aquifer and crevasses as part of a common system. This system may uniquely affect ice-sheet dynamics by routing a large volume of water to the bed outside of the typical runoff period.
Introduction
Water at the bed of the Greenland Ice Sheet has a substantial influence on ice velocity. The transport of surface meltwater to the bed, via moulins formed from supraglacial lakes and rivers, has been well studied in western Greenland (Das et al., 2008; Clason et al., 2015). In Southeast Greenland, surface melt has been found to correlate with ice motion over only limited time periods and spatial extents, for the few outlet glaciers studied (Andersen et al., 2011; Sundal et al., 2013; Moon et al., 2014). Over inland ice, the scarcity of supraglacial lakes in Southeast Greenland is also thought to limit the effect of surface melt on basal motion (Selmes et al., 2011).
Surface melt rates can reach 3 m year−1 in some areas of Southeast Greenland (Franco et al., 2013), but high accumulation rates (Miège et al., 2013) and cold wintertime temperatures help retain much of the meltwater in regional firn aquifers (Kuipers Munneke et al., 2014). Springtime radar observations (Forster et al., 2014) and climate model outputs (Kuipers Munneke et al., 2014) indicate that firn-aquifer water persists englacially in liquid form year-round. Such firn aquifers cover 20,000–70,000 km2 of the ice sheet in Southeast Greenland (Forster et al., 2014; Miège et al., 2016) and store up to approximately 140 km3 of water or, equivalently, 0.4 mm global sea level (Koenig et al., 2014).
The volume of water stored by the aquifer can vary in time and space (Miège et al., 2016). In particular, observations of the water level in a portion of the Southeast Greenland firn aquifer in the upstream reaches of Helheim Glacier indicate a loss of water volume between spring 2012 and spring 2013 (Miège et al., 2016). This portion of the aquifer sits at approximately 1520–1550 m elevation (Figure 1), directly upstream of a crevasse field. It is suspected that the water drained into crevasses (Miège et al., 2016), but the depth to which this water was able to drive the crevasses, and whether the firn-aquifer water reached the bed or refroze englacially, are unknown.
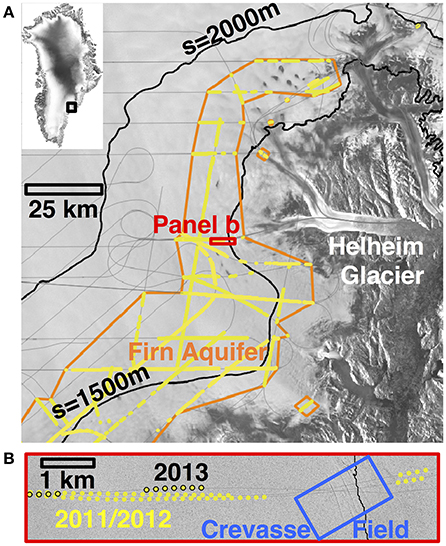
Figure 1. The region in Southeast Greenland where the firn aquifer overlies the upper reaches of Helheim Glacier. (A) Operation IceBridge flight lines (2010–2014) where firn-aquifer water is detected (yellow) and is not detected (gray), with the firn aquifer extent outlined in orange (Miège et al., 2016). Background is a radar mosaic from winter 2009–2010 (Joughin et al., 2016). Image dimensions are 140 × 150 km. (B) An 8 × 1.5 km section of a 24 June 2016 WorldView image that includes the study area (blue box; Figure 2A).
Here, we use a thermo-visco-elastic model for crevasse propagation to investigate the plausibility of firn-aquifer water draining to the bed through crevasses. The model is well-suited for crevasses that terminate above the ice-sheet bed, but we extend its application, with some caution, to full-thickness hydrofractures when required. We use the crevasse model to explore multiple scenarios, including the behavior of crevasses in the absence of a firn aquifer and when fed by a range of water fluxes from the firn aquifer, and multiple values for certain physical parameters. We conclude by discussing the effect that the crevasse field—firn aquifer system may have on ice dynamics at this location.
Methods
We study a ~1.5-km segment along an approximate flowline in the onset of the southern branch of Helheim Glacier (Figure 1), centered at 66.35°N, 39.07°W at surface elevation s ~1490–1520 m above sea level (a.s.l.). Radar measurements indicate that a portion of the Southeast Greenland firn aquifer terminates abruptly in this region, just above a crevasse field (Miège et al., 2016). WorldView satellite imagery (courtesy of Digital Globe, Inc.) indicates that this crevasse field comprises narrow crevasses (~1–2 m) at 1520 m a.s.l. and wider crevasses (>10 m) less than 1 km downstream, at 1510 m a.s.l. (Figure 2A). We generalize our study area into a conceptual model (Section “Conceptual model of firn aquifer—crevasse field system”), then apply a physically based numerical model (Section “Thermo-Mechanical Model for Crevasse Propagation”) to investigate the widths and depths of crevasses within our conceptual model. Table 1 contains all variables and physical constants used in the numerical model.
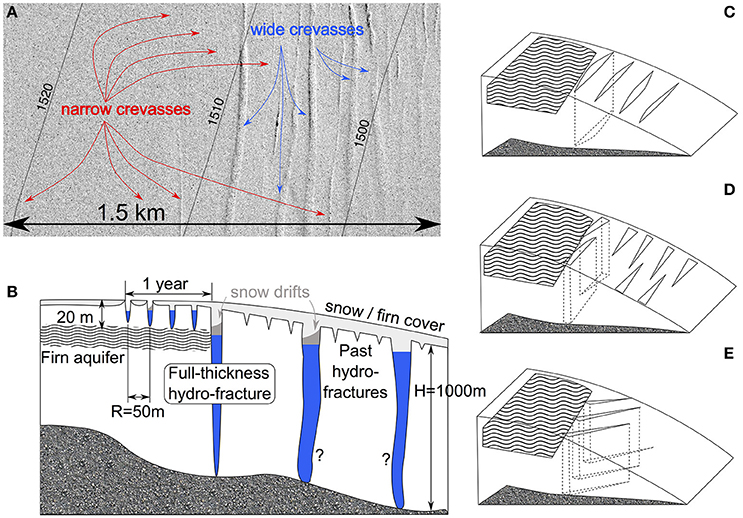
Figure 2. (A) Detail of the crevasse field within our study area (blue box in Figure 1B). Elevation contours (Howat et al., 2014) are in m. Background is a WorldView image from 24 June 2016, courtesy of DigitalGlobe. (B) Conceptual model of the firn aquifer—crevasse field system. Crevasses initiate above the firn aquifer (wavy lines), which begins at a depth of 20 m. Firn aquifer water may fill the crevasses, forming a train of wide hydrofractures. (C) Simplified 3D view of the conceptual model of the firn aquifer—crevasse field system. (D,E) Alternatives to the conceptual model presented here.
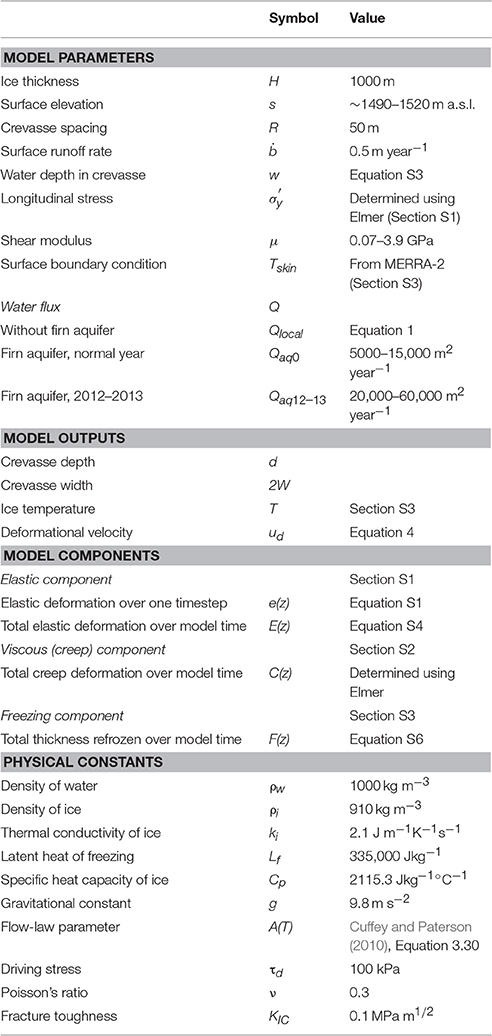
Table 1. Symbols and values of model parameters, variables, and physical constants.
Conceptual Model of Firn Aquifer—Crevasse Field System
We represent our study area in two-dimensional model space, with a vertical dimension and a down-surface-gradient horizontal dimension (Figures 2B–C). We thus report model-generated volumes in two dimensions (m2), i.e., as cross-sectional volumes. In our model, we feed the crevasses with water from different sources in turn: (1) locally generated meltwater, and (2) water from the firn aquifer.
Crevasses Fed by Local Surface Melt Only
First we consider the case of crevasses whose only water source is local snowmelt. We approximate the local catchment of a single crevasse within a crevasse field as the area that is closer to that crevasse than any other crevasse. That is, in a field of crevasses spaced by a distance R, each crevasse collects snowmelt that originates from the small, one-dimensional catchment of R/2 to either side of the crevasse. We limit the meltwater input to a crevasse to that produced within this small catchment because other crevasses collect melt generated nearby and because crevasses are usually found on topographic highs (Price et al., 2008), which isolates them from non-local meltwater sources such as supraglacial rivers.
To quantify the annual snowmelt for our study area, we use reanalysis data from MERRA-2 (Rienecker et al., 2011), which we average over 1980–2015. MERRA-2 uses a simple snowpack model for the ice-sheet surface, from which it generates surface meltwater production rates (Cullather et al., 2014). The MERRA-2 melt season is slightly longer, however, than that indicated from field observations (Forster et al., 2014). We thus adjust the model output by setting snowmelt to zero on days when the MERRA-2 average 2-m air temperature (1980–2012) is below 0°C. After this correction, the MERRA-2 output indicates an average of 0.5 m year−1 water equivalent of annual snowmelt in our study area, in agreement with previous mass-balance modeling of this area (McNerney, 2016).
We quantify the influx of local surface melt, Qlocal, that enters each crevasse as
where is the MERRA-2-derived local snow melt rate and R is the spacing between adjacent crevasses. We set R to 50 m based on our examination of WorldView imagery for our study area.
Crevasses Fed by Firn-Aquifer Water
Next, we consider the case where a firn aquifer is present ~20 m below the surface and crevasses propagate deep enough to intersect it, as illustrated in Figures 2B–C.
Although crevasses initiate as narrow, dry fractures in the top ~10–30 m of the ice sheet (Nye, 1955; Cuffey and Paterson, 2010), they can propagate deeper if they collect water (Weertman, 1973). We consider the firn aquifer as a possible water source to crevasses. Because the top surface of the firn aquifer in our study area lies 12–30 m below the ice-sheet surface (Forster et al., 2014; Miège et al., 2016), any water flow from the aquifer into a crevasse likely occurs below the ice-sheet surface, as suggested in Figure 2B.
In our model, we approximate the firn aquifer depth in our study area as a constant 20 m. When a surface-meltwater-filled crevasse reaches this depth, we assign it an influx of Qaq, a value we define based on the estimated water flux through the segment of the aquifer shown in Figure 1B, where it abuts the crevasse field (Miège et al., 2016). This segment, and our study area as a whole, represents only a small portion of the Southeast Greenland firn aquifer (Figure 1A); thus, we directly analyze the influence of only a small fraction of the firn-aquifer water. In addition, the data in Figure 1B indicate the intermittent presence of a ~500 m long firn aquifer downstream of the crevasse field we study. Water in this small aquifer may be sourced from the aquifer upstream (i.e., the water travels through the crevasse field) or from local surface melt (i.e., the water is distinct from upstream aquifer water). Our present model setup cannot constrain these hypotheses; we thus eliminate from our analysis the area downstream of the blue box in Figure 1B.
We assume in our two-dimensional model that only one crevasse can intersect the firn aquifer at a given time. That is, any upstream crevasse with depth greater than 20 m will cut off all downstream crevasses from the firn-aquifer water (Figure 2B). In a three-dimensional world, however, two or more crevasses at similar elevations could connect to the firn aquifer (Figure 2D). Alternately, crevasses may strike obliquely to the firn-aquifer boundary, so that firn-aquifer water could enter many crevasses simultaneously (Figure 2E). WorldView imagery (Figure 1B) suggests, however, that crevasses strike approximately parallel to the firn-aquifer boundary, supporting our assumption, in two dimensions, that the firn-aquifer water flows into one crevasse at a time (Figures 2B–C). Therefore, we discard the alternate scenarios (Figures 2D–E) from this analysis, although future, more detailed studies should consider them.
We vary the value of Qaq to reflect two specific scenarios. First, we define Qaq0 as the background water flux through the aquifer. We base Qaq0 on estimates of snowmelt directly upstream of this portion of the firn aquifer and on the results of a groundwater flow model constrained with radar observations and field estimates (Miège et al., 2016). There is considerable uncertainty in this value due to the assumption of spatially uniform aquifer thickness, uncertainties in the value of hydraulic conductivity, and steady-state 2D modeling that does not include seasonal variations in water input or 3D effects such as catchment extent and lateral water flow. We use a range of Qaq0 estimates between 6000 m2 year−1 (determined by summing snowmelt) and 15,000 m2 year−1 (determined by McNerney, 2016 from groundwater flow modeling) to define the range of values we test: Qaq0 = 5000, 10,000, and 15,000 m2 year−1. We vary Qaq0 over this wide range to reflect the uncertainties in its estimation.
We also consider Qaq12–13, which represents the enhanced water flux during the 2012–2013 aquifer drainage event. We define this quantity based on differences in the water levels identified in springtime radar observations for these 2 years (Miège et al., 2016). We subtract the observed level (top surface) of the firn aquifer in 2013 from that in 2012 over the ~3.5-km segment of the aquifer where the water surface dropped or disappeared completely (Figure 1B). This method yields a water flux Qaq12–13 ~ 65,000 m2 year−1. However, groundwater flow modeling suggests that some of the water from this 3.5-km segment may discharge at the surface at topographic inflection points, where it would refreeze (Miège et al., 2016) before reaching the crevasse field. If such discharge occurs, our initial estimate of Qaq12–13 may be too high. Thus, we also consider a scenario where water from only the lower 1–1.5 km of the transect, which is downstream of the lowest modeled hydraulic discharge point (McNerney, 2016), drains into the crevasse field. This second scenario gives Qaq12–13 ~ 26,000 m2 year−1. To reflect uncertainties, we test three values of Qaq12–13: 20,000, 40,000, and 60,000 m2 year−1.
Even using the smallest values, the aquifer-sourced water flux into crevasses (Qaq ~ 103–104 m2 year−1) exceeds the flux from local snowmelt (Qlocal ~ 101–102 m2 year−1) by approximately two orders of magnitude. We use these estimates of water flux to drive our model for the geometry of crevasses.
Thermo-Mechanical Model for Crevasse Propagation
When a sufficient volume of water flows into a crevasse, it will elastically open and deepen the crevasse (Weertman, 1996). Over a longer timescale (days to years), the crevasse walls will close viscously (through creep) as well as elastically, narrowing the crevasse and making it shallower. The meltwater inside will also steadily refreeze onto the crevasse walls, which diffusively warms the surrounding ice and contributes further to the closing and shoaling of the crevasse. Our crevasse model calculates the shape and depth of crevasses based on these elastic, viscous, and refreezing processes, which we model independently:
Here, W(z) denotes the half-width of a crevasse, symmetric about its vertical axis, as a function of the vertical coordinate z. The terms E(z), C(z), and F(z) represent the elastic deformation, creep (viscous) deformation, and refreezing, respectively, that have occurred cumulatively over the model time. Details of these components of the model can be found in the Supplementary Material. The elastic component of our model has previously been applied to calculate the propagation of full-thickness hydrofractures in western Greenland (Krawczynski et al., 2009). That study considered crevasses in bare ice in the ablation zone, whereas we consider crevasses in a firn-covered portion of the ice sheet. This approach introduces some limitations, which we discuss in Section “Influence of firn on crevasse width and shear modulus.”
The model runs for 10 years or until any one crevasse reaches the bed. At each timestep of the model, we first calculate Vwater, the cross-sectional volume of water that the crevasse is required to hold at that timestep, from the time-integrated water influx minus the total volume of water that has exited the crevasse by refreezing englacially onto the crevasse walls. We then solve for the crevasse depth d for which the volume of the crevasse, integrated from the crack tip d to the water line w, equals Vwater:
Crevasse Water Balance and Cryo-Hydrologic Warming
The propagation of a water-filled crevasse brings meltwater into contact with cold englacial ice, causing some of that water to refreeze, which warms and softens the ice and allows further deformation to occur. This process, cryo-hydrologic warming, has been observed in western Greenland (Phillips et al., 2010; Lüthi et al., 2015) in crevassed ice in the ablation zone. Here, we evaluate whether cryo-hydrologic warming likely is occurring in our study area, which is higher on the ice sheet than previous studies of cryo-hydrologic warming have considered. Our thermal model calculates the quantity of water refrozen englacially over time and the effect of the consequent release of latent heat on ice temperature across the modeled crevasse field (i.e., in ice between and below crevasses). We use these temperatures to calculate the expected deformational velocity of ice within our model domain, through a standard Arrhenius relation for the flow-law parameter, A(T) (Cuffey and Paterson, 2010). For a given driving stress τd, warmer ice will deform at a faster rate than colder ice. We calculate the deformational velocity ud of ice with temperature profile T(z) over the thickness H as follows:
We average ud over all ice columns in the model (i.e., across a crevasse field) to calculate the deformational velocity of ice in our study area.
Shear Modulus and Other Model Parameters
The visco-elastic model incorporates a number of material parameters, the values of some of which are poorly constrained for glacial ice. For instance, studies have approximated the fracture toughness KIC from 30 kPa m1/2 (Mottram and Benn, 2009) to 150 kPa m1/2 (Sassolas et al., 1996). Model runs over a range of values of these and other parameters (Poinar, 2015) indicate that the modeled crevasses are less sensitive to KIC (as also found by van der Veen, 1998; Alley et al., 2005; Mottram and Benn, 2009) and background longitudinal stress σy' (consistent with Krawczynski et al., 2009), and more sensitive to crevasse spacing R (consistent with Sassolas et al., 1996) and shear modulus μ (consistent with Krawczynski et al., 2009). Crevasse spacing often varies widely across a single crevasse field, but we approximate it as a constant value in our model. Because of this limitation, we do not explore sensitivity to crevasse spacing. We focus instead on the shear modulus μ.
Vaughan (1995) summarized field and laboratory studies of μ and used μ = 0.2–0.5 GPa to model the flexure of Antarctic ice shelves. Krawczynski et al. (2009) proposed values of μ = 0.32, 1.5, and 3.9 GPa for hydrofractures in western Greenland. We use the Krawczynski et al. (2009) values as a starting point in our model but also test lower values of μ (0.18, 0.10, and 0.07 GPa). We discuss the reasons for and implications of varying μ across this range in Section “Influence of firn on crevasse width and shear modulus.”
Remote Sensing of Crevasse Widths
We quantify crevasse widths from remotely sensed data to validate our model output.
ATM Data
NASA Operation IceBridge (OIB) has flown the Airborne Topographic Mapper (ATM) laser altimeter since 2009 (Krabill, 2010). The ATM scans the ice-sheet surface in a conical pattern and returns a swath of dense topographic measurements with vertical accuracy ~10 cm and horizontal accuracy ~3 cm (Martin et al., 2012). We used ATM observations from 17 April 2012 of wide crevasses in our study area to compare to crevasse widths predicted in our model. Because this flight, and most other OIB flights over our study area, occurred in spring, we expect the accumulated snow to bridge any shallow, narrow crevasses and to mute the surface expression of wider, deeper crevasses. We thus use the ATM data to indicate the shapes and approximate sizes of the widest and deepest crevasses in our study area.
WorldView Imagery
We used high-resolution (pixel size ~0.5 m) imagery from the WorldView-1 satellite, courtesy of DigitalGlobe, Inc., to study the widths of crevasses within our study area. We surveyed images from 7 August 2014, 1 August 2015, and 19 July 2016 for crevasses and outlined each crevasse from tip to tip, when possible. Image borders, snow cover, and image resolution (for very narrow crevasses) sometimes limited the extent of our digitization. We calculated the average width of each crevasse by dividing its two-dimensional area in the image by its length. We identified 30, 38, and 56 crevasses from the 2014, 2015, and 2016 images, respectively, for a total of 124 crevasses. Because a crevasse will advect ~200 m downstream over the course of a year and our study area spans ~3 km, our dataset likely includes many of the same crevasses reappearing from year to year.
Because we average the width over the entire crevasse, including very narrow end points, our technique should yield a smaller crevasse width than what is usually reported at the widest central span. At the same time, our dataset also likely omits a number of the narrowest crevasses, which the 0.5 m resolution of the imagery does not adequately resolve. We thus use this dataset, which excludes narrower crevasses that we did not model, to outline an approximate distribution of crevasse width in our study area.
Results
We ran our model forced with various meltwater sources and using various values for certain parameters. We then compared our model results for crevasse width at the ice-sheet surface to observations of crevasse width at the ice-sheet surface. Here we present the results of these simulations.
Evidence for Water-Filled Crevasses
Previous observations suggest that dry (non-water-filled) crevasses in grounded ice can reach widths of 2–3 m (Cook, 1956; Holdsworth, 1969) in northern Greenland and Antarctica, respectively. Crevasses observed near the calving faces of tidewater glaciers, on the other hand, are typically very wide: ~20–30 m on Jakobshavn Isbræ, for instance (Echelmeyer et al., 1991). These large widths are due to both high extensive stresses and the widening pressure from liquid water that fills these crevasses. Meier et al. (1957) observed 30-m-wide crevasses in northwest Greenland far from any calving faces; these crevasses, however, were exceptional in their age and flow history (Colgan et al., 2016) and may have contained moderate amounts of water (Meier et al., 1957). Based on these previous observations, we take 2–3 m as an approximate maximum width for dry crevasses.
OIB data from 17 April 2012 show multiple wide (>5 m) crevasses at s ~ 1490–1510 m a.s.l. in our study region. Images from the Digital Mapping System (DMS; Figure 3A) show sastrugi extending off of the southeast ends of three of the deepest crevasses. ATM data, collected concurrently, show that three crevasses are approximately 7, 11, and 10 m wide at the surface (Figures 3B–D, respectively), substantially wider than the 2–3 m we identify for dry crevasses. Thus, we hypothesize that these crevasses are water-filled. The top surface of this water would likely freeze over winter, providing a platform onto which windblown snow could collect (Figure 3E). Alternately, a snow bridge may form between the crevasse walls in the uppermost tens of m, independent of any such seasonal ice layer. The ATM and DMS data show that snow fills these crevasses to depths of 6–12 m, likely blown in by the wintertime winds that formed the sastrugi.
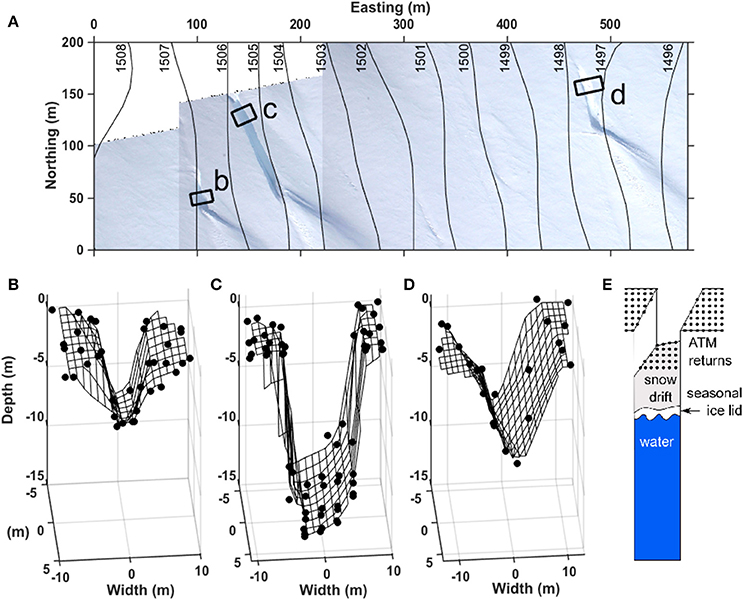
Figure 3. (A) Mosaic of Digital Mapping System (DMS) images from 17 April 2012 of the crevasse field study area. Elevations from the GIMP DEM (Howat et al., 2014) are overlain. (B–D) Returns from the Airborne Topographic Mapper (ATM) from 17 April 2012 for the three areas outlined in panel a. Black dots indicate level-1 returns, with a triangulation-based, linearly interpolated mesh to guide the eye. Crevasse widths are (B) 7, (C) 11, and (D) 10 m. (E) Schematic interpretation of the surfaces that give ATM returns.
These wide crevasses are located <1 km downstream of the lower border of the firn aquifer in this area (Figure 1B). As noted above, the firn aquifer is the largest source of water in the area, greatly exceeding the local melt supply (Section “Crevasses Fed by Firn-Aquifer Water”). Based on this observation, we hypothesize that these crevasses may have been widened by firn-aquifer water. We use our crevasse model to test this hypothesis.
Modeled Crevasses Isolated from the Firn Aquifer
We first investigate the expected springtime widths of crevasses if the firn aquifer were not present by running our model with a meltwater influx of Qlocal (Equation 1). That is, only snowmelt generated within R = 50 m of each crevasse is fed to the crevasse. We make this assumption because crevasses tend to form on or near local rises; therefore, their meltwater catchments are topographically limited.
We run our model with Qlocal for 10 years allowing ice to advect through our 2-km-wide study area at 200 m year−1. Figure 4 shows the time series of crevasse depth, modeled using various values for the shear modulus of ice (colors). Crevasses in ice with high shear moduli (μ = 1.5 GPa) seasonally penetrated to depths up to 500 m, while crevasses in ice with lower shear moduli (μ = 0.32 GPa) reached depths of ~200–300 m. In all cases, the crevasses refroze all their water and closed up each winter. Ice with a high shear modulus (stiff ice) cannot open wide, and thus a crevasse must extend relatively deep to hold the volume of water produced by local snow melt. The variation of our results with shear modulus is consistent with the modeling conclusions of Krawczynski et al. (2009).
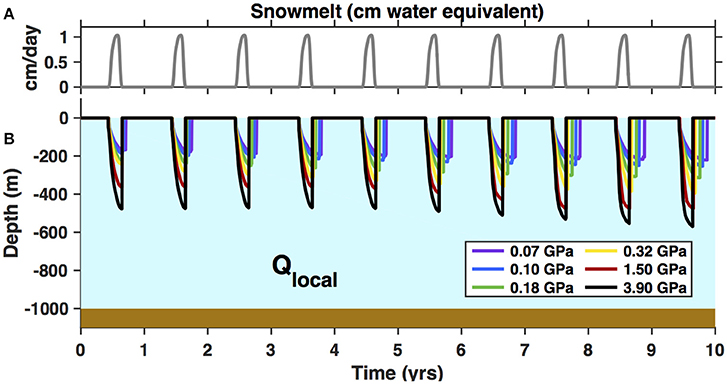
Figure 4. (A) MERRA-2-derived surface melt rates, in water-equivalent units, averaged over 1980–2015 at our study site, which we used to inform Qlocal, the meltwater influx into crevasses in the absence of a firn aquifer (Equation 1). (B) Time series of the depth of crevasses receiving Qlocal. Colors indicate the values for shear modulus tested and are consistent across other figures.
We found that crevasses modeled in ice with high shear moduli (μ = 1.5–3.9 GPa) had surface widths of 0.1–0.2 m. These widths are smaller than the 0.5 m pixel size of the 2016 WorldView imagery, which clearly shows ~1-m-wide crevasses initiating at high elevations (s ~ 1520 m; Figure 2A). Crevasses modeled with μ = 0.32 GPa were 0.5 m wide, slightly narrower than indicated by the imagery. To produce crevasses with widths consistent with our imagery observations, we also tested lower shear moduli (μ = 0.18, 0.10, and 0.07 GPa), which may reflect the influence of the firn layer, as we discuss further in Section “Influence of firn on crevasse width and shear modulus”. These values yielded crevasses with surface expressions of 0.7–1.0 m, a better match to the high-elevation crevasses. We use this full set of shear moduli (μ ranging over 0.07–3.9 GPa) in subsequent model runs.
We were unable to reproduce the observed crevasse widths of 6–11 m at s ~ 1500 m a.s.l. (Figure 3) using Qlocal; in fact, our modeled widths are almost an order of magnitude too low. Thus, we conclude that Qlocal provides an insufficient meltwater volume to explain these observations. We do find, however, that crevasses fed by local snowmelt (Qlocal) reach well beyond the depth of the firn aquifer (20 m), for all values of the shear modulus we tested (Figure 4). Thus, firn aquifer water should drain into crevasses in this area, consistent with our conceptual model (Figure 2B).
Modeled Crevasse Field—Firn Aquifer System
We next run our model with higher water fluxes, Qaq0 and Qaq12–13, which represent the water fluxes through the firn aquifer in our study area in typical years and in 2012–2013, respectively.
Penetration to the Bed
We first investigate how deep the water fluxes from the firn aquifer can drive crevasses in our model. For all values of the shear modulus we tested (μ = 0.07–3.9 GPa) and for all values for firn-aquifer-sourced water flux that we tested (Qaq0 = 5000–15,000 m2 year−1 and Qaq12–13 = 20,000–60,000 m2 year−1), we found that crevasses hydrofractured through the full thickness of the ice sheet (H = 1000 m) in less than 180 days. We use observations of the surface widths of crevasses in our study area to adjust the shear modulus we use in our model, in an effort to better constrain the amount of time required for firn-aquifer water to drive crevasses to the bed.
Comparison to Observed Surface Widths
We compare the surface widths of crevasses modeled using the median value of Qaq0, 10,000 m2 year−1, to the dataset of observed surface widths. Figure 5A shows ATM data from s ~ 1500 m a.s.l. (Figure 3C) alongside the walls of crevasses modeled using all values of the shear modulus we tested. Once again, previously accepted values of μ (0.32–3.9 GPa) produce crevasses (0.3–5 m) that are substantially narrower than this crevasse (11 m). While lower values of μ (0.07–0.18 GPa) generate wider crevasses, we seek further evidence that these values, which are outside the previously published range (Vaughan, 1995), are realistic for our study area.
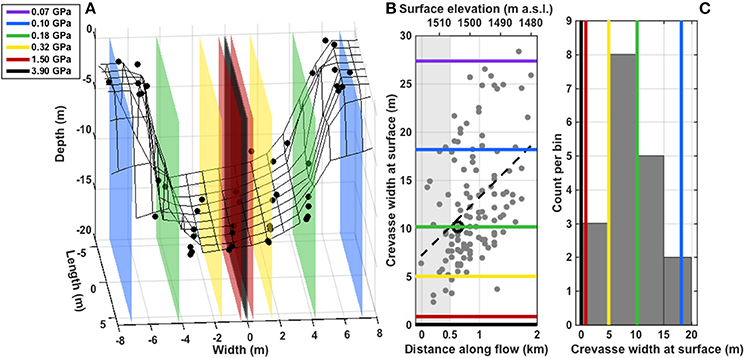
Figure 5. (A) ATM data (black points) from 17 April 2012 for the crevasse shown in Figure 3C. Colored surfaces show the modeled crevasse walls for Qaq0 = 10,000 m2 year−1 using various values of the shear modulus. (B) Average surface width of 124 crevasses (identified in WorldView images) versus elevation (Howat et al., 2014) and horizontal distance along flow. Dashed black line shows the linear fit; black circle shows the crevasse detailed in panel (A). The colored lines show modeled crevasse widths at the surface for Qaq0 = 10,000 m2 year−1 and various values of the shear modulus. (C) Histogram of the average surface widths of the 18 crevasses within the first 500 m downstream of the firn-aquifer boundary (gray area in panel B). The colored lines show modeled crevasse widths at the surface for Qaq0 = 10,000 m2 year−1 and various shear moduli.
Figures 5B,C compare the modeled crevasse widths to the set of 124 observed crevasse widths in our study area. The observed crevasses show a general widening trend along flow (Figure 5B; r2 = 0.8). The calculated longitudinal stress at the ice-sheet surface (Section S1) increases smoothly from 120 to 150 kPa across the first kilometer of Figure 5B, as the crevasses widen, then decreases smoothly to 110 kPa along the next kilometer while the crevasses continue to widen. This lack of correlation suggests that the local stress field is unlikely the cause of the observed along-flow increase in crevasse width. We also consider enhanced ablation of crevasse walls (Cathles et al., 2011) due to trapping of solar radiation (Pfeffer and Bretherton, 1987). Using results from Cathles et al. (2011) appropriate for our study area, we estimate that this effect (<0.5 m year−1 widening) accounts for up to approximately half of the trend we see (1.2 m year−1 widening).
We note an asymmetry in the along-flow crevasse width data (Figure 5B). Very few narrow crevasses (<5 m wide) occur downstream of the first ~500 m of our study area; in contrast, wide crevasses (>10 m wide) appear throughout the study area. We hypothesize that the narrower crevasses penetrate to less than the full ice thickness (that is, they are in the process of hydrofracturing), and that wider crevasses have reached the bed. The physics behind our model assume an infinite ice thickness, which is violated as the crevasses approach the bed. Hence, we are cautious about comparing modeled crevasse widths with observations in regions where crevasses may extend to the bed, as we discuss later (Sections “Effect of Finite Ice-Sheet Thickness and S1”). We therefore confine our analysis to the ~500 m segment at the upstream end of our study area (gray area in Figure 5B), where the narrower observed widths are more likely to represent crevasses (d < H) than full-thickness rifts (d = H). These data are fit best by the model results with μ = 0.32 GPa, for which crevasse width varies from 3 to 7 m over the 5000–60,000 m2 year−1 range of Q we consider (Figure 6A). We thus focus our analysis on model results generated with μ = 0.32 GPa while also considering our results for the full range of shear modulus we test.
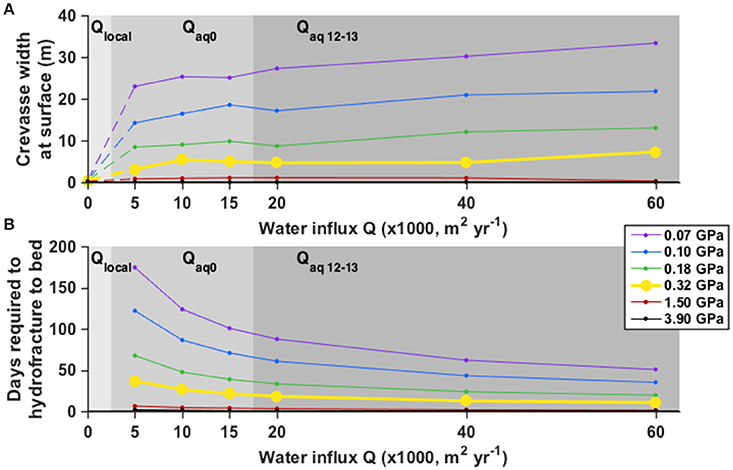
Figure 6. Model results for various influx values Q (x-axis) and shear moduli (colored curves). Results for the best-fit shear modulus, μ = 0.32 GPa (yellow), are in bold. Influx regimes are indicated by the gray shading: lightest gray, local snowmelt only (Qlocal); medium gray, background aquifer flux (Qaq0); dark gray, 2012–2013 aquifer flux (Qaq12–13). (A) Modeled crevasse width at the ice-sheet surface at the timestep just before the crevasse reaches the bed. For Qlocal (dashed lines), crevasse widths at model time of 10 years are shown. (B) Model results for the time required for firn aquifer water to drive a crevasse 1000 m deep to the bed. For Qlocal, crevasses did not reach the bed.
Hydrofracture Driven by Average Firn-Aquifer Water Flux
Over many years, the average water flux through this section of the firn aquifer should balance the average annual snowmelt volume in the catchment, 6000–15,000 m2 year−1 (Miège et al., 2016), if the firn aquifer is in mass balance. For μ = 0.32 GPa, we find that a full-thickness hydrofracture can form in just 22–37 days (Figure 6B), depending on the influx Qaq0 (5000, 10,000, or 15,000 m2 year−1). Immediately before reaching the bed, the cross-sectional volume of water held in the modeled crevasse is 500–900 m2, depending on Qaq0 (Figures 7A,B).
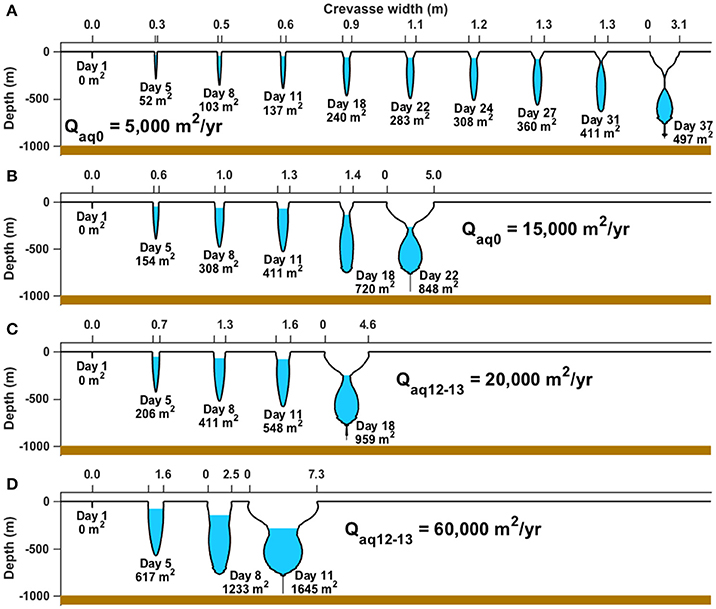
Figure 7. Evolution of modeled crevasse geometry over time (increasing rightward) for μ = 0.32 GPa (all panels) and (A) Qaq0 = 5000 m2 year−1, (B) Qaq0 = 15,000 m2 year−1, (C) Qaq12–13 = 20,000 m2 year−1, and (D) Qaq12–13 = 60,000 m2 year−1. Labels at each crevasse show the crevasse life time and the total volume of water accepted by the crevasse at that time.
Hydrofracture Driven by 2012–2013 Firn-Aquifer Water Flux
The drop in the firn-aquifer water level observed over 2012–2013 (Miège et al., 2016) suggests that a much larger volume of water, 26,000–65,000 m2, exited the firn aquifer over this one-year period. Model results with Qaq12–13 = 20,000, 40,000, and 60,000 m2 year−1 suggest that this higher volume may have generated slightly wider crevasses (5–7 m; Figure 6A with μ = 0.32 GPa) than did Qaq0 (3–5 m), and that these crevasses reached the bed more quickly (11–18 days for μ = 0.32 GPa; Figures 6B, 7C, D). Extensive snow cover obscures these crevasses in the 2013–2015 OIB campaigns, so it was not possible to compare crevasse widths modeled with Qaq12–13 to ATM measurements.
Englacial Refreezing and Deformational Ice Motion
We track the volume of meltwater refrozen within each crevasse over its lifetime in the model (i.e., until it reaches the bed). For Qlocal, the entirety of the meltwater refreezes each winter, and because crevasses penetrate only to depths of <500 m (Figure 4), no water is lost to the bed. Thus, in the scenario where the firn aquifer does not exist, 100% of the surface meltwater would refreeze englacially. Figure 8A shows that this would warm the ice by 1.8°C, averaged over all depths and the full horizontal extent of the modeled crevasse field. This would enhance deformational ice motion by 6.5 m year−1 (Figure 8A).
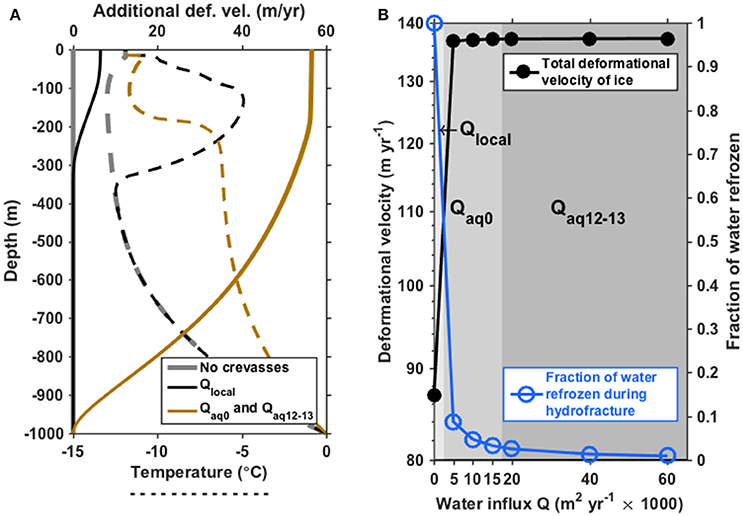
Figure 8. (A) The effect of crevassing on mean englacial temperature (dashed lines; bottom axis) and deformational velocity (solid lines; top axis) for shear modulus μ = 0.32 GPa. Velocity difference is the difference between deformational velocity calculated based on the temperature profile of uncrevassed ice (gray dashed line) and that calculated for each influx Q (brown and black dashed lines). (B) Total deformational velocity averaged over the crevasse field (black; left axis) and fraction of firn-aquifer water that refreezes onto the crevasse walls (blue; right axis), as a function of water influx Q, for a 10-year model run with μ = 0.32 GPa. Influx regimes are indicated by the gray shading, as in Figure 6.
For Qaq0 and μ = 0.32 GPa, we find that a cross-sectional meltwater volume of 50–80 m2 refreezes in the ~20–40 days over which the crevasse hydrofractured to the bed. For Qaq12–13, the modeled crevasses refroze 30–40 m2 over ~10–20 days. These volumes are less than 10% of the volume of firn-aquifer water that went into the crevasse over these time periods (~1000–3000 m2). After a crevasse reaches the bed, its heat balance becomes more complicated due to unknown influxes and outfluxes of water with the basal system. Thus, we do not calculate refreezing rates within crevasses after this point, but we do continue to calculate the temperature of the ice between crevasses, assuming that the crevasse walls remain in contact with water and thus provide 0°C boundary conditions (see Section S3). Performing these calculations over the duration of the ten-year model run shows a 4°C increase in ice temperature averaged over all ice within the crevasse field, which enhances ice deformation by ~50 m year−1. This is a substantial portion of the observed surface velocity, which includes both deformation and sliding, of ~200 m year−1 in our study area.
Discussion
Model Assumptions
We make a number of approximations in our representation of this problem. Here we discuss some of the limitations of our approach.
Influence of Firn on Crevasse Width and Shear Modulus
Our model was developed for application to exposed glacial ice in the ablation zone, in the absence of firn. Our application of this model to our study area, where approximately 35 m of firn overlies the ice, therefore may introduce errors: the weak firn layer should be less able to support the high stresses that fractures generate. Thus, in the presence of firn, crevasses must propagate deeper to balance these stresses, compared to a scenario of uniform glacial ice (van der Veen, 1998). In our model, fracture propagation depths therefore may be too shallow. Thus, the lack of a firn layer in our model may cause us to overestimate the time required for water to hydrofracture to the bed.
We also speculate on the influence of the firn layer on our value of the shear modulus, which we adjusted to match observed crevasse widths. Our model assumes a constant shear modulus with depth, yet the range of shear moduli for snow (μ = 8.5 × 10⁻⁴ − 0.02 GPa; Sigrist, 2006) is at least two orders of magnitude lower than the accepted values for ice, suggesting that firn should have a substantially lower shear modulus than ice. Because we chose μ to match surface widths, where the crevasses outcrop through firn, our value of μ = 0.32 GPa, which is at the low end of previously published values for ice, may partially reflect the influence of firn. This value, which we borrowed from a previous study (Krawczynski et al., 2009), implies a level of precision that is inconsistent with our confidence in its value. However, considering the relatively poor fit of the results of our model using other values of μ, we have confidence in the bounds of 0.2 < μ <1.5 GPa, averaged over the ice column in our study area.
Effect of Finite Ice-Sheet Thickness
We find a wide distribution of crevasse width in our study area (Figure 5B) and identified a set of values of shear modulus that fit these observations. Because wider crevasses appear farther along flow, the best-fit shear modulus appears to decrease along flow (Figure 5C). In reality, the shear modulus is unlikely to vary greatly between crevasses within our relatively small study area; instead, the apparent need for lower shear moduli likely reflects the limitations of our model.
Our model assumes that crevasses exist within an ice sheet of infinite thickness, which provides cryostatic resistance at the crack tip that limits the opening width of the crevasse. A nearby basal boundary, however, alters the stress field around the crack tip (Weertman, 1996; van der Veen, 2007), which may limit the accuracy of our model for crevasses that approach the bed. This limitation of our crevasse model precludes our ability to explore the along-flow variability in crevasse width (Section “Comparison to observed surface widths”).
Figure 7 shows that as a crevasse approaches the bed, our model starts to predict unusual shapes that require rapid deformation of the crevasse walls. In general, crevasse geometries evolve smoothly until the crevasse reaches a depth of approximately 0.8H, at which point the crevasses widen considerably, exhibit increased necking at the water line, and sometimes develop isolated reservoirs (e.g., Figure 7A). Although the latter two features are consistent with the model results of Weertman (1973) in infinite ice, our awareness of the basal boundary effects compels us to interpret the modeled shapes of deep crevasses (d > 0.8H) with caution.
Volumetric Constraints on Englacial Water Storage
The results of our model show that the influx of firn-aquifer water into the crevasse field is sufficient to drive our modeled crevasses to the ice-sheet bed 1000 m below. Here, we introduce a second line of reasoning to add to our confidence that firn-aquifer water reaches the bed.
We consider a hypothetical case where firn-aquifer water resides permanently within crevasses that are shallower than H = 1000 m. Were this to occur, the firn-aquifer water would slowly refreeze englacially without reaching the bed. To perform this test, we compare the volume of crevasses in our model to the volume of water lost by the firn aquifer in the scenarios Qaq0 and Q12–13.
Figure 7 shows the time evolution of the geometry of crevasses modeled using Qaq0 and Q12–13. As the crevasses collect more water over time, they widen and deepen. We calculate the volume of meltwater that a crevasse holds at the penultimate timestep of our model (rightmost crevasses on Figure 7), when the crevasse has reached its maximum depth before breaking through to the bed. Figure 7 shows these cross-sectional volumes for each crevasse. These volumes are the sum of the volume of liquid water held inside the crevasse and the water-equivalent volume that has refrozen onto the crevasse walls. These span ~900–1600 m2, depending on Qaq0. These volumes are less than the annual volume flux of water through the firn aquifer (5000–15,000 m2 for Qaq0) by approximately a factor of 5–10, suggesting that it would take 5–10 such crevasses to englacially store the annual volume of water lost by the firn aquifer.
In our conceptual model, shallow crevasses spaced by 50 m advect across the firn aquifer at ~200 m year−1; thus, only 4 crevasses annually can receive firn-aquifer water. It is possible, within uncertainties, that firn-aquifer water could reach 5 or more crevasses in 1 year and drive them to within tens of m of the bed. Such deep hydrofractures, however, would be likely to ultimately reach the bed through additional creep deformation, by intersecting with a basal fracture, by advecting onto a bedrock high, or by the addition of more meltwater beyond our one-year model time. Thus, we reason that firn-aquifer water likely reaches the ice-sheet bed near the downstream end of the aquifer, and that this happens regularly (i.e., with Qaq0).
We repeat this analysis for the higher water fluxes Qaq12–13. The cross-sectional water volumes that each crevasse holds immediately before reaching the bed range over ~1800–3100 m2, larger than crevasse capacities modeled with Qaq0. At the same time, the volume of firn-aquifer water lost (20,000–60,000 m2) is a factor of 10–20 larger than this. Using similar arguments as above, we conclude that the firn-aquifer water lost between 2012 and 2013 OIB measurements is even more unlikely to have been contained englacially in crevasses.
Although Figure 7 presents volumetric results for only μ = 0.32 GPa, our results for all six values of shear modulus that we tested (μ = 0.07–3.9 GPa) also suggest that the annual volume generated from Qaq12–13 is unlikely to be held englacially (i.e., it exceeds the volume of ~5 crevasses). For Qaq0, this is also the case for shear moduli μ = 0.18 GPa. This result further strengthens our confidence that firn-aquifer water regularly reaches the bed in our study area.
Our model assumes that each crevasse evolves mechanically independently from its neighboring crevasses. However, the short distance (R = 50 m) between crevasses compared to the much greater ice thickness (H = 1000 m) suggests that crevasses may interact. In the presence of a deep crevasse downstream, a newly formed crevasse may not fracture directly downwards but instead may propagate toward the thin ice block between crevasses. This would be analogous to faulting observed at sites of supraglacial lake drainage (Doyle et al., 2013). Lateral fracturing some tens or hundreds of m below the surface may connect new crevasses with existing downstream hydrofractures. Over many such connections, firn-aquifer water could form an englacial fracture network similar to those observed on mountain glaciers (Fountain et al., 2005). This scenario is outside of the capabilities of our crevasse model, but we note that it may be possible for such a network to store a large volume of firn-aquifer water annually, without it reaching the bed. At the same time, this network of deep hydrofractures would be susceptible to the same processes mentioned above that would be likely to connect near-full-thickness fractures to the bed.
It is also possible that the fate of the 2012–2013 firn-aquifer water was not tied to the crevasse field: perhaps the water flowed to the ice-sheet surface at an unidentified hydraulic discharge point, or perhaps the aquifer expanded laterally along-strike of the crevasse field, or even flowed around the crevasse field and reconverged in the downstream reaches of our study area (Figure 1B). These scenarios could occur outside the bounds of our flowline model and the 1D OIB radar flight lines. While we cannot rule out these possibilities, our model results for the observed water-filled crevasses at the downstream end of the firn aquifer provide a compelling argument that drainage of the firn-aquifer water into the subglacial system is plausible.
We study only a 3.5 km transect within the vast Southeast Greenland firn aquifer (~10,000 km2; Miège et al., 2016). While we have shown that crevasses provide the firn-aquifer water in our study area with a credible, rapid path to the bed, crevasse fields do not necessarily exist at the lower boundary of the firn aquifer across all of Southeast Greenland. Thus, other drainage mechanisms or englacial refreezing may occur in other areas of the firn aquifer.
Contribution of the Firn Aquifer—Crevasse Field System to Ice Deformation
Our results show that if the firn aquifer were absent, crevasses would carry meltwater to depths of ~300–500 m annually (Figure 4B), where it would refreeze. Over the ten-year period we model, this refreezing would warm the top few hundred m of the ice column by up to 8°C (Figure 8A). In this upper portion of the ice column, vertical shear stresses are relatively low, which limits the effect that this warming would have on ice velocities (Lüthi et al., 2015) to an additional 6 m year−1 (Figure 8A), for a total deformational velocity ~87 m year−1 (Figure 8B). This is consistent with the observed (deformational plus sliding) ice velocity of ~200 m year−1 in our study area. WorldView imagery (Figure 1B) shows that the crevasse field we study spans 1–2 km, equivalent to 5–10 years of advection; thus, our ten-year model time is likely an upper bound. Furthermore, some fraction of the surface meltwater would likely refreeze within the snow and firn (Humphrey et al., 2012) without reaching the crevasses. Thus, our estimates of enhanced ice deformation from Qlocal are likely upper bounds.
We find that for Qaq0 and Qaq12–13, a relatively small fraction of firn-aquifer water refreezes englacially (1–10%; Figure 8B); this warms the ice by 4°C and enhances deformation by 56 m year−1 (Figure 8A) over a 10-year period. This represents an additional warming of ~2°C and additional deformation of ~50 m year−1 compared to the base case Qlocal. These values are robust across our tested ranges for Qaq0 and Qoq12–13 (Figure 8B). If these processes act regionally such that the 4°C warming occurs over a horizontal scale of multiple ice thicknesses, then our results suggest that the firn aquifer—crevasse field system may contribute a considerable portion (~20%) of the observed surface velocity in our study area by enhancing ice deformation.
Potential Influence of Firn Aquifer Water at the Bed
We have demonstrated that the firn aquifer—crevasse field system in our study area likely delivers surface meltwater to the bed through crevasses. We compare this to the formation of similar full-thickness hydrofractures in western Greenland. There, the wide ablation zone and the large number of visually obvious meltwater lakes and streams make the surface hydrology (Box and Ski, 2007; Smith et al., 2015) and the formation of full-thickness hydrofractures well-studied topics (Das et al., 2008; Stevens et al., 2015). The community has thus made great progress in understanding the effects of meltwater reaching the bed seasonally in western Greenland, but this question has been less addressed in East Greenland.
A primary consideration is whether the full-thickness hydrofractures we infer in our study area bring water to a bed that is frozen or thawed. Existing knowledge (MacGregor et al., 2016) gives high confidence that a melted bed underlies our study area and the area 80–100 km upstream. While we have shown that the firn aquifer—crevasse field system most likely contributes to the basal water supply in our study area, other heat sources (frictional dissipative or geothermal) are likely to produce basal melt upstream, where no crevasses are visible. It therefore appears likely that the bed in our study area would be thawed even in the absence of the firn aquifer—crevasse field system.
To estimate the water flux from the firn aquifer to the bed, we scale the average annual 2D flux of water out of the firn aquifer (Qaq0 = 5000–15,000 m2 year−1) over the median length of the crevasses we observe in our study area (600 m) to reach a 3D water flux of 3–9 × 10⁶ m3year−1. This is on the low end of the range of water volumes that fast-draining Greenland supraglacial lakes deliver to the bed: 7–40 × 106 m3 (Das et al., 2008; Doyle et al., 2013) in approximately annual occurrences. However, many lakes drain more slowly, over periods comparable to the melt season (Selmes et al., 2011); these and other western Greenland catchments drain through rivers, which ties the basal water flux more closely to surface melt rates (Smith et al., 2015), leading to lower but sustained inputs to the bed.
The rate of water delivery to the bed is of fundamental importance to its effect on basal hydrology (Schoof, 2010). High water fluxes to the bed can channelize the basal system over the course of a melt season (Bartholomew et al., 2011); however, channelization may fail to occur during episodes of extremely high water flux such as rapid lake drainages (Dow et al., 2015) or when the water flux is too low (Bartholomew et al., 2011). Thus, if we are to understand the effect of firn-aquifer water on the subglacial system, we must first know its rate of input to the bed. The water fluxes we use are constrained by observations of firn-aquifer water level (2016) that are currently performed on an annual basis. The water flux at any one time, however, may well differ from the annual average, and with higher or lower instantaneous Qaq, crevasses may hydrofracture and deliver water to the bed at different rates.
The annual average water flux through the firn aquifer (~0.1–0.3 m3s−1) is comparable to observed daily flow rates through supraglacial streams during the melt season (0.5–8 m3s−1, McGrath et al., 2011; Chandler et al., 2013) but 4–5 orders of magnitude less than instantaneous water fluxes during rapid supraglacial lake drainages (3300–8700 m3s−1, Das et al., 2008; Doyle et al., 2013). However, in a hypothetical scenario where the firn-aquifer water is delivered to the bed over a 90-min period similar to a rapid supraglacial lake drainage (Das et al., 2008), the basal water flux for Qaq12–13 would be similar to that from a fast-draining lake. Such a rapid timescale is likely an upper bound, as the diffusive nature of the firn aquifer would likely impede such rapid evacuation of water; instead, the firn aquifer may provide a steadier flux of water into the crevasse field and therefore to the bed. The travel time through the firn aquifer could introduce an offset between the timing of delivery of water to the bed and the timing of the melt season. This would further differentiate this system from western Greenland, where basal water fluxes peak roughly with the melt season (Bartholomew et al., 2011; Smith et al., 2015). Further remote sensing or field observations are required to better constrain any intra-annual variability in water flux.
Overall, we show that the volume of water that a segment of the firn aquifer—crevasse field system delivers to the bed is comparable to water volumes from supraglacial lakes and streams in western Greenland. Current observations, however, limit our ability to know the temporal character of the water flux and thus its effect on basal hydrology.
Conclusion
Our results show that the water flux through the Southeast Greenland firn aquifer is likely sufficient to hydrofracture to the bed through crevasses. Without the firn aquifer, crevasses filled with meltwater would not reach the bed. Similarly, without the adjacent downstream crevasse field, the firn-aquifer water would lack a delivery mechanism to the bed. Thus, the firn aquifer and the crevasse field should be thought of together, as a single system that brings surface meltwater to the bed under relatively high-elevation ice (s ~ 1500 m a.s.l.) in this area. Refreezing over the weeks-long hydrofracture period in our study area raises ice temperature by ~4°C and contributes ~50 m year−1 of ice deformation to the observed surface velocity of ~200 m year−1.
We study here only one specific transect (~3.5 km) of the Southeast Greenland firn aquifer, which covers ~10,000 km2 (Miège et al., 2016) over a broad range of elevations and ice speeds. The fast flow of Helheim Glacier directly adjacent to our study area likely aids the formation of crevasses; other areas of the Southeast Greenland firn aquifer also border smaller fast-flowing outlet glaciers (Moon et al., 2012). Other firn-aquifer areas may therefore also encounter crevasse fields that could seed hydrofractures and deliver surface-sourced meltwater to the bed in areas of the ice sheet that lack visible supraglacial lakes or rivers.
Author Contributions
KP devised the project, performed all model runs and analysis, and wrote the manuscript. KP and IJ conceived and developed the crevasse model. DL implemented and ran the creep component of the crevasse model. LB guided the application of the crevasse model to the study area. LK provided separate model results that constrained parameters for use in the crevasse model. All authors contributed to the organization, focus, and editing of the manuscript.
Funding
CReSIS funded the model development (NSF ANT-0424589) and the NASA Postdoctoral Program funded its application to the Southeast Greenland firn aquifer (NNH15CO48B).
Conflict of Interest Statement
The authors declare that the research was conducted in the absence of any commercial or financial relationships that could be construed as a potential conflict of interest.
Acknowledgments
We thank Clément Miège, Laura McNerney, Rick Forster, and Lauren Andrews for helpful discussions and Clément Miège for feedback on the manuscript. We acknowledge DigitalGlobe, Inc. for providing WorldView images. We thank Michael Studinger for suggesting the use of the ATM data to examine crevasse geometries. We are grateful to the reviewers for constructive criticism that improved and clarified the manuscript.
Supplementary Material
The Supplementary Material for this article can be found online at: http://journal.frontiersin.org/article/10.3389/feart.2017.00005/full#supplementary-material
References
Alley, R. B., Dupont, T. K., Parizek, B. R., and Anandakrishnan, S. (2005). Access of surface meltwater to beds of sub-freezing glaciers: preliminary insights. Ann. Glaciol. 40, 8–14. doi: 10.3189/172756405781813483
Andersen, M. L., Nettles, M., and Elosegui, P. (2011). Quantitative estimates of velocity sensitivity to surface melt variations at a large Greenland outlet glacier. J. Glaciol. 57, 609–620. doi: 10.3189/002214311797409785
Bartholomew, I. D., Nienow, P., Sole, A., Mair, D., Cowton, T., King, M. A., et al. (2011). Seasonal variations in Greenland Ice Sheet motion: inland extent and behaviour at higher elevations. Earth Planet. Sci. Lett. 307, 271–278. doi: 10.1016/j.epsl.2011.04.014
Box, J. E., and Ski, K. (2007). Remote sounding of Greenland supraglacial melt lakes: implications for subglacial hydraulics. J. Glaciol. 53, 257–265. doi: 10.3189/172756507782202883
Catania, G. A., and Neumann, T. A. (2010). Persistent englacial drainage features in the Greenland Ice Sheet. Geophys. Res. Lett. 37, 1–5. doi: 10.1029/2009GL041108
Cathles, L. M., Abbot, D. S., Bassis, J. N., and MacAyeal, D. R. (2011). Modeling surface-roughness/solar-ablation feedback: application to small-scale surface channels and crevasses of the Greenland ice sheet. Ann. Glaciol. 52, 99–108. doi: 10.3189/172756411799096268
Chandler, D. M., Wadham, J. L., Lis, G. P., Cowton, T., Sole, A., Bartholomew, I., et al. (2013). Evolution of the subglacial drainage system beneath the Greenland Ice Sheet revealed by tracers. Nat. Geosci. 6, 195–198. doi: 10.1038/ngeo1737
Clason, C. C., Mair, D., Nienow, P., Bartholomew, I., Sole, A., Palmer, S., et al. (2015). Modelling the transfer of supraglacial meltwater to the bed of Leverett Glacier, southwest Greenland. Cryosphere 9, 123–128. doi: 10.5194/tc-9-123-2015
Colgan, W., Rajaram, H., Abdalati, W., McCutchan, C., Mottram, R., Moussavi, M., et al. (2016). Glacier Crevasses: observations, models and mass balance implications. Rev. Geophys. 54, 1–43. doi: 10.1002/2015RG000504
Cuffey, K. M., and Paterson, W. S. B. (2010). The Physics of Glaciers. Available online at: http://booksite.elsevier.com/9780123694614/?ISBN=9780123694614
Cullather, R. I., Nowicki, S. M. J., Zhao, B., and Suarez, M. J. (2014). Evaluation of the surface representation of the Greenland Ice Sheet in a general circulation model. J. Clim. 27, 4835–4856. doi: 10.1175/JCLI-D-13-00635.1
Das, S. B., Joughin, I., Behn, M. D., Howat, I. M., King, M. A., Lizarralde, D., et al. (2008). Fracture propagation to the base of the Greenland Ice Sheet during supraglacial lake drainage. Science 320, 778–781. doi: 10.1126/science.1153360
Dow, C. F., Kulessa, B., Rutt, I. C., Tsai, V. C., Pimentel, S., Doyle, S. H., et al. (2015). Modeling of subglacial hydrological development following rapid supraglacial lake drainage. J. Geophys. Res. Earth Surf. 120, 1127–1147. doi: 10.1002/2014JF003333
Doyle, S. H., Hubbard, A. L., Dow, C. F., Jones, G. A., Fitzpatrick, A., Gusmeroli, A., et al. (2013). Ice tectonic deformation during the rapid in situ drainage of a supraglacial lake on the Greenland Ice Sheet. Cryosphere 7, 129–140. doi: 10.5194/tc-7-129-2013
Echelmeyer, K., Clarke, T. S., and Harrison, W. D. (1991). Surficial glaciology of Jakobshavns Isbræ, West Greenland: Part I. Surface morphology. J. Glaciol. 37, 368–382.
Forster, R. R., Box, J. E., van den Broeke, M. R., Miège, C., Burgess, E. W., van Angelen, J. H., et al. (2014). Extensive liquid meltwater storage in firn within the Greenland ice sheet. Nat. Geosci. 7, 95–98. doi: 10.1038/ngeo2043
Fountain, A. G., Jacobel, R. W., Schlichting, R., and Jansson, P. (2005). Fractures as the main pathways of water flow in temperate glaciers. Nature 433, 618–621. doi: 10.1038/nature03296
Franco, B., Fettweis, X., and Erpicum, M. (2013). Future projections of the Greenland ice sheet energy balance driving the surface melt. Cryosphere 7, 1–18. doi: 10.5194/tc-7-1-2013
Gagliardini, O., Zwinger, T., Gillet-Chaulet, F., Durand, G., Favier, L., de Fleurian, B., et al. (2013). Capabilities and performance of Elmer/Ice, a new-generation ice sheet model. Geosci. Model Dev. 6, 1299–1318. doi: 10.5194/gmd-6-1299-2013
Holdsworth, G. (1969). Primary transverse crevasses. J. Glaciol. 8, 107–129. doi: 10.3198/1969JoG8-52-107-129
Howat, I. M., Negrete, A., and Smith, B. E. (2014). The Greenland Ice Mapping Project (GIMP) land classification and surface elevation data sets. Cryosphere 8, 1509–1518. doi: 10.5194/tc-8-1509-2014
Humphrey, N. F., Harper, J. T., and Pfeffer, W. T. (2012). Thermal tracking of meltwater retention in Greenland's accumulation area. J. Geophys. Res. 117, F01010. doi: 10.1029/2011JF002083
Joughin, I., Smith, B. E., Howat, I. M., Moon, T., and Scambos, T. A. (2016). A SAR record of early 21st century change in Greenland. J. Glaciol. 62, 62–71. doi: 10.1017/jog.2016.10
Koenig, L. S., Miège, C., Forster, R. R., and Brucker, L. (2014). Initial in situ measurements of perennial meltwater storage in the Greenland firn aquifer. Geophys. Res. Lett. 41, 81–85. doi: 10.1002/2013GL058083
Krabill, W. B. (2010). IceBridge ATML1B Qfit Elevation and Return Strength. Boulder: NASA DAAC at the National Snow and Ice Data Center.
Krawczynski, M. J., Behn, M. D., Das, S. B., and Joughin, I. (2009). Constraints on the lake volume required for hydro-fracture through ice sheets. Geophys. Res. Lett. 36:L10501. doi: 10.1029/2008GL036765
Kuipers Munneke, P., Ligtenberg, S. M., van den Broeke, M. R., van Angelen, J. H., and Forster, R. R. (2014). Explaining the presence of perennial liquid water bodies in the firn of the Greenland Ice Sheet. Geophys. Res. Lett. 41, 476–483. doi: 10.1002/2013GL058389
Lüthi, M. P., Ryser, C., Andrews, L. C., Catania, G. A., Funk, M., Hawley, R. L., et al. (2015). Excess heat in the Greenland Ice Sheet: dissipation, temperate paleo-firn and cryo-hydrologic warming. Cryosphere 9, 245–253. doi: 10.5194/tcd-8-5169-2014
MacGregor, J. A., Fahnestock, M. A., Catania, G. A., Aschwanden, A., Clow, G. D., Colgan, W. T., et al. (2016). A synthesis of the basal thermal state of the Greenland Ice Sheet. J. Geophys. Res. Earth Surf. 121, 1328–1350. doi: 10.1002/2015JF003803
MacGregor, J. A., Li, J., Paden, J. D., Catania, G. A., Clow, G. D., Fahnestock, M. A., et al. (2015). Radar attenuation and temperature within the Greenland Ice Sheet. J. Geophys. Res. Earth Surf. 120, 983–1008. doi: 10.1002/2014JF003418
Martin, C. F., Krabill, W. B., Manizade, S. S., Russell, R. L., Sonntag, J. G., Swift, R. N., et al. (2012). Airborne Topographic Mapper Calibration Procedures and Accuracy Assessment. NASA/TM-2012-215891.
McGrath, D., Colgan, W., Steffen, K., Lauffenburger, P., and Balog, J. (2011). Assessing the summer water budget of a moulin basin in the Sermeq Avannarleq ablation region, Greenland ice sheet. J. Glaciol. 57, 954–964. doi: 10.3189/002214311798043735
McNerney, L. (2016). Constraining the Greenland Firn Aquifer's Ability to Hydrofracture a Crevasse to the Bed of the Ice Sheet. Master's Thesis, 1–54, University of Utah. Available online at: https://content.lib.utah.edu/cdm/ref/collection/etd3/id/4086
Meier, M. F., Conel, J. E., Hoerni, J. A., Melbourne, W. G., Pings, C. J. J., and Walker, P. T. (1957). Preliminary Study of Crevasse Formation. Wilmette, IL: Snow Ice and Permafrost Research Establishment (SIPRE). Available online at: http://acwc.sdp.sirsi.net/client/search/asset/1022260
Miège, C., Forster, R. R., Box, J. E., Burgess, E. W., McConnell, J. R., Pasteris, D. R., et al. (2013). Southeast Greenland high accumulation rates derived from firn cores and ground-penetrating radar. Ann. Glaciol. 54, 322–332. doi: 10.3189/2013AoG63A358
Miège, C., Forster, R. R., Brucker, L., Koenig, L. S., Solomon, D. K., Paden, J. D., et al. (2016). Spatial extent and temporal variability of Greenland firn aquifers detected by ground and airborne radars. J. Geophys. Res. Earth Surf. 121, 2381–2398. doi: 10.1002/2016JF003869
Moon, T., Joughin, I., Smith, B., and Howat, I. (2012). 21st-Century evolution of greenland outlet glacier velocities. Science 336, 576–578. doi: 10.1126/science.1219985
Moon, T., Joughin, I., Smith, B., van den Broeke, M., van de Berg, W. J., Noel, B., et al. (2014). Distinct patterns of seasonal Greenland glacier velocity. Geophys. Res. Lett. 41, 7209–7216. doi: 10.1002/2014GL061836
Morlighem, M., Rignot, E., Mouginot, J., Seroussi, H., and Larour, E. (2014). Deeply incised submarine glacial valleys beneath the Greenland ice sheet. Nat. Geosci. 7, 418–422. doi: 10.1038/ngeo2167
Mottram, R. H., and Benn, D. I. (2009). Testing crevasse-depth models: a field study at Breiğamerkurjökull, Iceland. J. Glaciol. 55, 746–752. doi: 10.3189/002214309789470905
Pfeffer, W. T., and Bretherton, C. S. (1987). The effect of crevasses on the solar heating of a glacier surface. IAHS Publ. 170, 191–205.
Phillips, T., Rajaram, H., and Steffen, K. (2010). Cryo-hydrologic warming: a potential mechanism for rapid thermal response of ice sheets. Geophys. Res. Lett. 37, 1–5. doi: 10.1029/2010GL044397
Poinar, K. (2015). The Influence of Meltwater on the Thermal Structure and Flow of the Greenland Ice Sheet. Ph.D. thesis, 1–166, University of Washington. Available online at: https://digital.lib.washington.edu/researchworks/handle/1773/35062
Poinar, K., Joughin, I., Lenaerts, J. T. M., and van den Broeke, M. R. (2017). Englacial latent-heat transfer has limited influence on seaward ice flux in western Greenland. J. Glaciol. 63, 1–16. doi: 10.1017/jog.2016.103
Price, S. F., Payne, A. J., Catania, G. A., and Neumann, T. A. (2008). Seasonal acceleration of inland ice via longitudinal coupling to marginal ice. J. Glaciol. 54, 213–219. doi: 10.3189/002214308784886117
Rienecker, M. M., Suarez, M. J., Gelaro, R., Todling, R., Bacmeister, J., Liu, E., et al. (2011). MERRA: NASA's modern-era retrospective analysis for research and applications. J. Clim. 24, 3624–3648. doi: 10.1175/JCLI-D-11-00015.1
Sassolas, C., Pfeffer, T., and Amadei, B. (1996). Stress interaction between multiple crevasses in glacier ice. Cold Reg. Sci. Technol. 24, 107–116.
Schoof, C. (2010). Ice-sheet acceleration driven by melt supply variability. Nature 468, 803–806. doi: 10.1038/nature09618
Selmes, N., Murray, T., and James, T. D. (2011). Fast draining lakes on the Greenland Ice Sheet. Geophys. Res. Lett. 38, 1–5. doi: 10.1029/2011GL047872
Sigrist, C. (2006). Measurement of Fracture Mechanical Properties of Snow and Application to Dry Snow Slab Avalanche Release. ETH Dissertation No. 16736. Available online at: http://www.wsl.ch/fe/warnung/projekte/snow_fracture_mechanics/phd_thesis_sigrist.pdf
Smith, L. C., Chu, V. W., Yang, K., Gleason, C. J., Pitcher, L. H., Rennermalm, A. K., et al. (2015). Efficient meltwater drainage through supraglacial streams and rivers on the southwest Greenland ice sheet. Proc. Natl. Acad. Sci. U.S.A. 112, 1001–1006. doi: 10.1073/pnas.1413024112
Stevens, L. A., Behn, M. D., McGuire, J. J., Das, S. B., Joughin, I., Herring, T., et al. (2015). Greenland supraglacial lake drainages triggered by hydrologically induced basal slip. Nature 522, 73–76. doi: 10.1038/nature14480
Sundal, A. V., Shepherd, A., van den Broeke, M., Van Angelen, J., Gourmelen, N., and Park, J. (2013). Controls on short-term variations in Greenland glacier dynamics. J. Glaciol. 59, 883–892. doi: 10.3189/2013JoG13J019
van der Veen, C. J. (1998). Fracture mechanics approach to penetration of surface crevasses on glaciers. Cold Reg. Sci. Technol. 27, 31–47. doi: 10.1016/S0165-232X(97)00022-0
van der Veen, C. J. (2007). Fracture propagation as means of rapidly transferring surface meltwater to the base of glaciers. Geophys. Res. Lett. 34, 1–5. doi: 10.1029/2006GL028385
Weertman, J. (1973). Can a water-filled crevasse reach the bottom surface of a glacier? IASH Publ. 95, 139–145.
Keywords: firn aquifer, crevasse, englacial hydrology, meltwater runoff, meltwater retention
Citation: Poinar K, Joughin I, Lilien D, Brucker L, Kehrl L and Nowicki S (2017) Drainage of Southeast Greenland Firn Aquifer Water through Crevasses to the Bed. Front. Earth Sci. 5:5. doi: 10.3389/feart.2017.00005
Received: 01 October 2016; Accepted: 17 January 2017;
Published: 07 February 2017.
Edited by:
Horst Machguth, University of Zurich, SwitzerlandReviewed by:
Baptiste Vandecrux, Technical University of Denmark, DenmarkRuth Mottram, Danish Meteorological Institute, Denmark
Copyright © 2017 Poinar, Joughin, Lilien, Brucker, Kehrl and Nowicki. This is an open-access article distributed under the terms of the Creative Commons Attribution License (CC BY). The use, distribution or reproduction in other forums is permitted, provided the original author(s) or licensor are credited and that the original publication in this journal is cited, in accordance with accepted academic practice. No use, distribution or reproduction is permitted which does not comply with these terms.
*Correspondence: Kristin Poinar, a3Jpc3Rpbi5wb2luYXJAbmFzYS5nb3Y=