 Fátima Viveiros
 Márcio Marcos2
 Teresa Ferreira
- 1Instituto de Investigação em Vulcanologia e Avaliação de Riscos, Universidade dos Açores, Ponta Delgada, Portugal
- 2Secretaria Regional da Educação, Santa Cruz da Graciosa, Portugal
- 3Secretaria Regional da Energia, Ambiente e Turismo, Horta, Portugal
- 4Centro de Informação e Vigilância Sismovulcânica dos Açores, Ponta Delgada, Portugal
The Azores archipelago is composed of nine volcanic islands located at the triple junction between the North American, Eurasian, and Nubian plates. Nowadays the volcanic activity in the archipelago is characterized by the presence of secondary manifestations of volcanism, such as hydrothermal fumaroles, thermal and cold CO2-rich springs as well as soil diffuse degassing areas, and low magnitude seismicity. Soil CO2 degassing (concentration and flux) surveys have been performed at Pico, Faial, and São Jorge islands to identify possible diffuse degassing structures. Since the settlement of the Azores in the fifteenth Century these three islands were affected by seven onshore volcanic eruptions and at least six destructive earthquakes. These islands are crossed by numerous active tectonic structures with dominant WNW-ESE direction, and less abundant conjugate NNW-SSE trending faults. A total of 2,855 soil CO2 concentration measurements have been carried out with values varying from 0 to 20.7 vol.%. Soil CO2 flux measurements, using the accumulation chamber method, have also been performed at Pico and Faial islands in the summer of 2011 and values varied from absence of CO2 to 339 g m−2 d−1. The highest CO2 emissions were recorded at Faial Island and were associated with the Pedro Miguel graben faults, which seem to control the CO2 diffuse degassing and were interpreted as the pathways for the CO2 ascending from deep reservoirs to the surface. At São Jorge Island, four main degassing zones have been identified at the intersection of faults or associated to WNW-ESE tectonic structures. Four diffuse degassing structures were identified at Pico Island essentially where different faults intersect. Pico geomorphology is dominated by a 2,351 m high central volcano that presents several steam emissions at its summit. These emissions are located along a NW-SE fault and the highest measured soil CO2 concentration reached 7.6 vol.% with a maximum temperature of 77°C. The diffuse degassing maps show that anomalous CO2 degassing areas are controlled essentially by the tectonic structures and the lithology of the sites since the youngest volcanic systems are characterized by very low CO2 emissions.
Introduction
Carbon dioxide (CO2) together with water vapor (H2O) and sulfur dioxide (SO2) are usually the most abundant gases released to the atmosphere during volcanic eruptions (Giggenbach, 1996; Fischer and Chiodini, 2015 and references therein). During non-eruptive periods, gas emissions are also frequent in many volcanic systems not only through the presence of permanent fumaroles, but also due to the existence of thermal and cold CO2-rich springs, as well as soil diffuse degassing emissions (Allard et al., 1991; Chiodini et al., 1998). In the latter, the most studied gases released through volcanic soils are usually CO2 and the radioactive gas radon (222Rn); in some cases the CO2 diffusely emitted by the soils is of similar magnitude to the CO2 released from fumaroles and crater plumes (e.g., Allard et al., 1991; Chiodini et al., 2010a; Viveiros et al., 2010; Pedone et al., 2015). Mantle-derived CO2 can also be released away from active volcanoes through deep tectonic structures, as demonstrated by several studies (Chiodini et al., 1999, 2010b; Jung et al., 2014; Lee et al., 2016). In fact, in the last 30 years, CO2 spatial distribution has been used worldwide to identify hidden tectonic structures, since faults/fractures act as preferential pathways (high permeability zones) for the escape of gases from the deep crust or mantle to the surface (Giammanco et al., 1999, 2006; Baubron et al., 2002; Hutchison et al., 2015; Liuzzo et al., 2015). Based on the release of soil gases in confined areas, Chiodini et al. (2001) named the anomalous CO2 degassing areas, where hydrothermal/volcanic CO2 is released, as diffuse degassing structures (DDS), whose shape depends on morphological, geological, and structural factors, such as the topography, existence of lithological heterogeneities, and presence of faults/fractures (Schöpa et al., 2011; Peltier et al., 2012; Pantaleo and Walter, 2014).
CO2 has been widely used for volcanic monitoring due to its low solubility in silicate melts, being consequently one of the first gases released to the surface in case of replenishment of a magma chamber (e.g., Hernández et al., 2001; Carapezza et al., 2004; Giammanco et al., 2006; Aiuppa et al., 2010; Liuzzo et al., 2013; de Moor et al., 2016). Carbon dioxide is also an inert asphyxiant gas if present in high concentrations in the air, and above 10 vol.% can be lethal (Blong, 1984; Weinstein and Cook, 2005). Several hundreds of deaths have been reported in volcanic and non-volcanic environments due to deep-derived CO2 emissions (Hansell and Oppenheimer, 2004) and high CO2 concentrations have been reported in buildings located on CO2 anomalous zones (Baxter et al., 1999; Viveiros et al., 2009, 2016a). This fact highlights the importance of identifying CO2 anomalous areas by producing degassing maps, which should constitute valuable tools for land-use planners (Beaubien et al., 2003; Viveiros et al., 2009, 2010, 2015, 2016a). Building in high CO2 degassing areas should be avoided, or, depending on the soil gas concentrations measured, buildings should follow few “gas-resistant” construction rules as the ones defined by Viveiros et al. (2016a).
Carbon dioxide is a colorless and odorless gas that is only detected with specific equipment. Several instruments have been developed in the last decades to detect this gas in soils in volcanic/tectonic environments, even if the first studies started to be applied in agricultural fields to measure soil respiration rates (e.g., Kanemasu et al., 1974; Parkinson, 1981). Relatively short-time and low-cost methodologies using infrared CO2 detectors have been implemented to measure soil CO2 emissions since the end of the eighties, which include soil CO2 concentration measurements (Giammanco et al., 1999, 2006; Evans and Staudacher, 2001) and soil CO2 fluxes (dynamic concentration and accumulation chamber methods; Gurrieri and Valenza, 1988; Chiodini et al., 1998). Studies performed in diffuse degassing environments show that not only CO2 is permanently emitted to the atmosphere from soils, but also significant variations in the amount of gases emitted are observed. Several spike-like and long term variations have been interpreted as resulting from meteorological influences and seasonal effects (Granieri et al., 2003; Viveiros et al., 2008, 2014; Rinaldi et al., 2012). Gases released from soils in hydrothermal-volcanic environments may also result from organic matter decomposition and fauna respiration, the so-called soil respiration (Luo and Zhou, 2006). Discrimination of the different CO2 sources has been done through the use of statistical methodologies (Chiodini et al., 1998), as well as the carbon isotopic composition of the CO2 released (e.g., Chiodini et al., 2008).
Soil CO2 concentration surveys were performed at Faial, Pico, and São Jorge islands in the period between 2001 and 2004, and preliminary results are available in Master theses (Faria, 2002; Marcos, 2006). In 2011, sporadic soil CO2 flux measurements were also performed in the islands of Faial and Pico, with the main scope of evaluating the stability of the previously recognized anomalous CO2 degassing areas and select an area to install a permanent soil CO2 flux station. This equipment is necessary to integrate with other seismo-volcanic monitoring techniques and to complement the gas geochemistry network already installed in the Azores archipelago (Viveiros et al., 2008). This study reviews the preexisting database on soil CO2 concentration applying more recent statistical tools in order to (1) evaluate the existence of different sources for the CO2 diffusely released from soils, (2) produce CO2 degassing maps, (3) identify the main DDS, and (4) correlate the soil CO2 emitted with the main volcano-tectonic structures identified in the islands.
Geological Setting
The Azores archipelago is composed of nine volcanic islands located in the North Atlantic Ocean where the American, Eurasian and the Nubian plates meet at a triple junction (Searle, 1980). The main tectonic features are (1) the Mid-Atlantic Ridge (MAR) that crosses the archipelago between the islands of Flores and Faial, (2) the East Azores Fracture Zone (EAFZ), which extends E-W from the MAR to south of Santa Maria, and the Azores-Gibraltar Fault Zone that includes the E-W trending Gloria Fault, and (3) its western segment, the Terceira Rift (TR), which extends from the MAR to the island of Santa Maria along a general WNW-ESE direction, and corresponds to the present-day EU-NU plate boundary (e.g., Searle, 1980; Madeira and Ribeiro, 1990; Vogt and Jung, 2004; Miranda et al., 2015; Figure 1). The main tectonic structures in the islands are normal dextral faults with a WNW-ESE trend, characteristic of the Terceira rift; the NNW-SSE conjugate fault system exhibits oblique normal left lateral displacement (Madeira and Brum da Silveira, 2003; Madeira et al., 2015). These main fault systems are also present in Faial, Pico, and São Jorge islands, with the dominant structures striking WNW-ESE and dipping 60–90° to the NNE or to the SSW controlling the general shape of some islands (Madeira and Brum da Silveira, 2003).
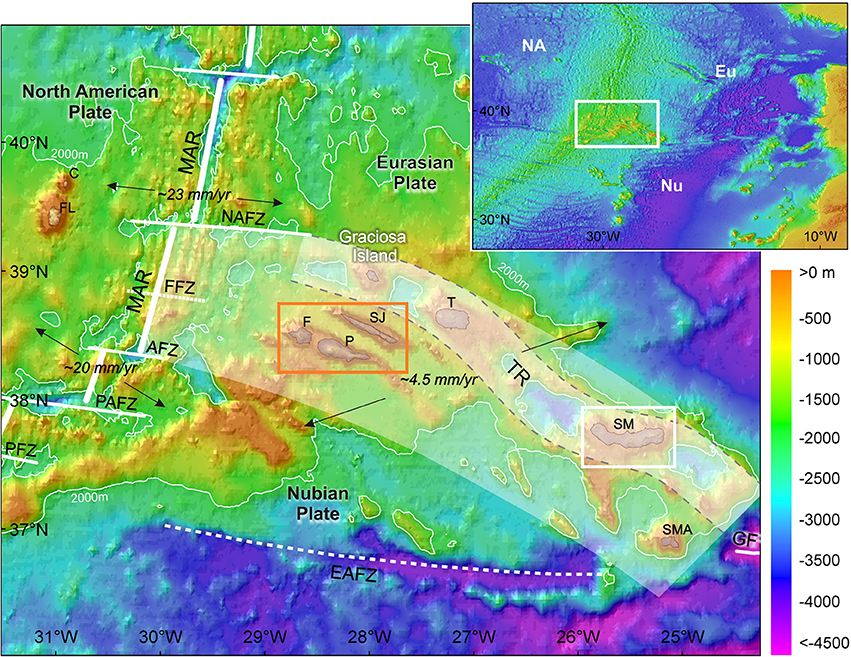
Figure 1. Main morphotectonic features of the Azores region. White lines define approximately the morphological expression of each structure; white shaded area represents the sheared western segment of the Eu-Nu plate boundary, whereas the white shaded area limited by a dotted gray line represents its main structure, the Terceira Rift (TR). Tectonic structures: MAR, Mid-Atlantic Ridge; EAFZ, East Azores Facture Zone; NAEZ, North Azores Fracture Zone; GF, Gloria Fault; FFZ, Faial Fracture Zone; AFZ, Açor Fracture Zone; PAFZ, Princesa Alice Fracture Zone; PFZ, Pico Facture Zone. Islands: SMA, Santa Maria; SM, São Miguel; T, Terceira; SJ, São Jorge; P, Pico; F, Faial; FL, Flores; C, Corvo. Azores bathymetry adapted Lourenço et al. (1997); World topography and bathymetry from GEBCO_08 database (2010). Datum: WGS 1984 (in Hipólito et al., 2013); The red square shows the area that comprises the three studied islands.
Most of the identified faults in the Azores archipelago are considered active (Madeira, 1998; Madeira and Brum da Silveira, 2003; Marques et al., 2013; Madeira et al., 2015) and the major faults usually have well-developed scarps; however the volcanic nature of the islands, together with differential erosion, can attenuate or amplify the tectonic slope (Madeira and Brum da Silveira, 2003) and even make the identification of tectonic structures difficult (due to scarp burial by pumice deposits, for instance). In addition, the exuberant vegetation of some of the Azorean islands covers most of the geological structures. Tectonic structures used in the present study were mapped by Madeira and Brum da Silveira (2003) and Madeira et al. (2015) through fieldwork and vertical air-photo interpretation. All the faults in the study islands are considered active by Madeira and Brum da Silveira (2003) as they displace volcanic sequences younger than 100 ka.
The cause for the volcanism in the islands is highly debated in the literature and most studies suggest the presence of a mantle plume (e.g., Schilling, 1975; Cannat et al., 1999; Moreira et al., 1999; Jean-Baptiste et al., 2009), even if some studies argue that the addition of H2O to the mantle together with a small temperature anomaly could be enough to induce melting (Bonatti, 1990; Asimow et al., 2004; Métrich et al., 2014).
The complex geodynamic setting of the Azores explains the frequent seismicity and volcanism in the islands. Since the settlement of the islands, in the fifteenth century, at least 28 volcanic eruptions and more than 15 major earthquakes caused a large number of casualties (>6,500 deaths; Gaspar et al., 2015 and references therein).
Present seismo-volcanic activity in the archipelago is characterized by almost daily record of seismic events (Gaspar et al., 2015 and references therein) and the presence of secondary manifestations of volcanism in most islands. These manifestations include hydrothermal fumaroles, cold CO2-rich, and thermal springs, as well as soil diffuse degassing areas (Ferreira et al., 2005; Cruz et al., 2010; Viveiros et al., 2010; Caliro et al., 2015; Silva et al., 2015). Fumarolic emissions are found at Faial and Pico islands, respectively, at the remnant of the 1957–58 eruption (Capelinhos) and at the summit of Pico Volcano. São Jorge manifestations are characterized only by the presence of cold CO2-rich springs, which are also found out at Pico and Faial (Ferreira et al., 2005).
Faial Island
Tectonic Structures and Seismicity
The eastern part of Faial Island is dominated by a WNW-ESE trending graben structure (named Pedro Miguel Graben), which is formed by seven normal dextral faults (Madeira and Brum da Silveira, 2003; Figure 2). Pedro Miguel graben formed as a result of the activity of transtensive dextral faults with an extension rate between ~3.4 and ~8.2 mm/y was proposed by Trippanera et al. (2014). Other important WNW-ESE tectonic structures are located south of the summit caldera and in the western part of the island (Figure 2). The conjugate normal left lateral faults system (trending NNW-SSE to NW-SE) shows less developed geomorphic expression (Madeira and Brum da Silveira, 2003).
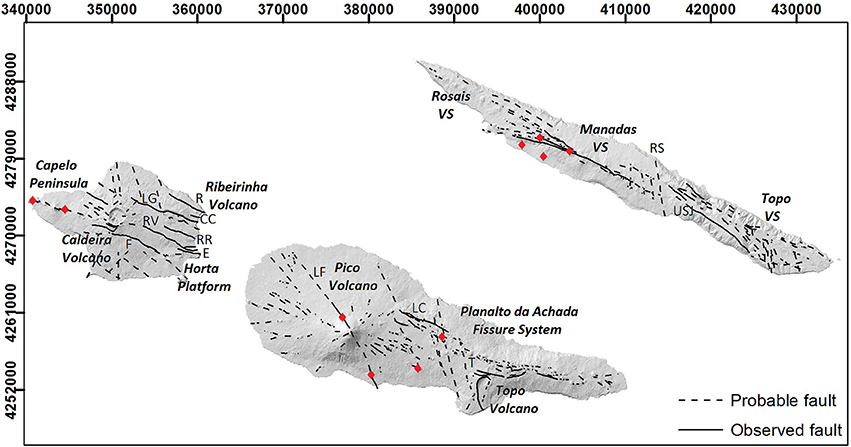
Figure 2. Faial, Pico, and São Jorge digital elevation models with the identification of the volcanic systems and the main tectonic structures. Legend of the tectonic structures: Faial Island: LG, Lomba Grande; R, Ribeirinha; CC, Chã da Cruz; RR, Ribeira do Rato; RV, Rocha Vermelha; E, Espalamaca; F, Flamengos; Pico Island: LF, Lomba de Fogo-S. João; LC, Lagoa do Capitão; T, Topo; São Jorge Island: RS, Ribeira Seca; USJ, Urze-São João. VS, Volcanic System. The red diamonds represent the approximate locations of the onshore historical volcanic centers (tectonic structures modified from Madeira and Brum da Silveira, 2003).
In the last century Faial Island was affected by four important seismic events in 1926, 1958, 1973, and 1998, with intensities equal or higher than VII (Mercalli Modified Scale). The last destructive earthquake that caused nine casualties occurred offshore in 1998, and had a magnitude of (ML) 5.8 (Dias et al., 2007; Matias et al., 2007).
Volcanism
Faial Island is composed by four main volcanic systems: the Ribeirinha (848 to 358 ka) and Caldeira (>440 ka) central volcanoes and two basaltic fissure systems (Horta Platform and Capelo Peninsula fissure systems; Chovelon, 1982; Demande et al., 1982; Serralheiro et al., 1989; Pacheco, 2001, 2015; Hildenbrand et al., 2012). Ribeirinha Volcano, located on the northeast sector of the island, is the oldest system and extensively dissected by the Pedro Miguel Graben (Pacheco, 2015). Caldeira Volcano dominates the morphology of the island as the summit is truncated by a 2 km wide, 400 m deep caldera (Madeira and Brum da Silveira, 2003). Hildenbrand et al. (2012) proposed a much younger age (about 120 ka ago) for the beginning of the subaerial shield-building phase of this volcanic system, when compared with the previous studies (Féraud et al., 1980). In what concerns the fissural systems, Horta Platform system should be active since at least 11 ka BP and its more recent activity is older than 6 ka BP (Serralheiro et al., 1989; Pacheco, 2015); Capelo Peninsula fissure system is the youngest volcanic system on the Island and the activity may have started between 8 and 6 ka BP (Madeira, 1998; Di Chiara et al., 2014).
Seismic tomography performed at Faial Island suggests the existence of a low P velocity between 3 and 7 km depth beneath Caldeira Volcano, which was interpreted by Dias et al. (2007) as a possible magma chamber. Zanon and Frezzotti (2013) studied CO2-rich fluid inclusions at Faial and Pico islands and estimated different depths for magma ponding sites, which varied from 5.6 to 21.2 km. The intra-crustal ponding system of small size was proposed to be located beneath the Caldeira Volcano, in agreement with the depths obtained by the tomography studies.
Two volcanic eruptions affected the island since the settlement and both occurred in the eastern part of the island, in the Capelo Peninsula volcanic system (1672/73 and 1957/58). During this last eruptive episode, a phreatic explosion also occurred inside the caldera of the Caldeira Volcano and the fumarolic emissions associated to this event persisted from May to October 1958 (Machado et al., 1962; Madeira, 1998; Pacheco, 2001). At least three deaths were attributed to the 1672–73 volcanic eruption (Weston, 1964; Pacheco, 2001).
Nowadays, the only visible secondary manifestations of volcanism in Faial correspond to residual steam emissions from the Capelinhos eruption (1957–58) (Ferreira, 1994; Gaspar and Ferreira, 1995). Maximum temperatures of 91°C were measured in 1993, and the gases identified were CO2, N2, O2, Ar, and H2 (Table 1). In what concerns the origin of the volatiles, Jean-Baptiste et al. (2009) measured a value of 8.53 Ra for the 3He/4He on Faial water samples, which are typical MORB values and similar to the He isotopic composition measured on Faial volcanic rocks (Moreira et al., 1999).
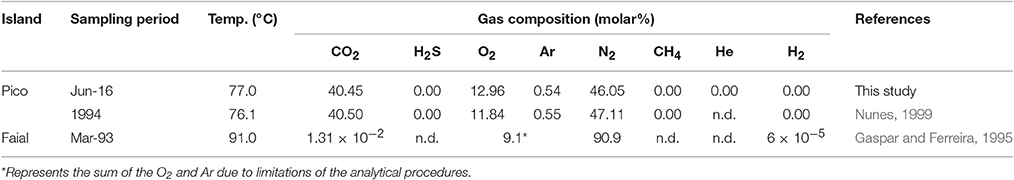
Table 1. Gas composition (molar%) of the fumarolic emissions from Faial and Pico islands.
Pico Island
Tectonic Structures and Seismicity
Several authors consider that Faial and Pico are the emerged parts of a single main volcanic ridge, the Pico-Faial ridge (Hildenbrand et al., 2012 and references therein; Quartau et al., 2015). In the present study we will analyze the degassing patterns associated to each island individually.
The main tectonic structures of Pico Island trend WNW-ESE, similarly to what is observed in Faial Island. The main structures are Lagoa do Capitão and Topo faults that progressively merge to the east and both define a graben structure, smaller than Pedro Miguel graben in Faial Island. Several other WNW-ESE and conjugated NNW-SSE faults are defined by volcanic alignments (Madeira, 1998; Nunes, 1999; Madeira and Brum da Silveira, 2003; Figure 2). The larger cones and Pico Volcano are located in the intersection of WNW-ESE with NNW-SSE conjugate faults (Madeira and Brum da Silveira, 2003).
A magnitude VII earthquake (EMS-98, Silva, 2005) that occurred in 1973 was the strongest earthquake with epicenter in Pico Island. However, and due to the proximity of the studied islands, strong earthquakes that occurred in Faial, São Jorge, and in the surrounding offshore areas also caused damage at Pico. This is the case of the 1757 earthquake that had epicenter close to São Jorge Island and severely damaged Pico causing 11 casualties. Damage on Pico was also reported associated with the seismic events of 1926 and 1998 that mostly affected Faial Island, and the 1980 Terceira earthquake (Silva, 2005; Gaspar et al., 2015 and references therein).
Volcanism
Pico is the youngest island of the archipelago and is formed by three volcanic systems: the Topo Volcano (186 ± 5 ka), the Planalto da Achada fissure system (270 ± 150 ka to <25 ka), and the Pico central volcano (Féraud et al., 1980; Chovelon, 1982; Madeira, 1998; Nunes, 1999; Costa et al., 2015). The older Topo Volcano is partially dismantled by landslides, displaced by faults and partially covered by more recent volcanic products (Madeira, 1998; Costa et al., 2015).
Three historic volcanic eruptions affected the island (1562–64; 1718 and 1720), and two deaths are reported for the 1718 eruption. Both 1562–64 and 1720 volcanic eruptions were associated with the Pico Island fissural system (Achada Plateau); the 1718 activity occurred at the Pico Volcano. In 1963 a submarine eruption was reported offshore the NW coast of Pico Island (Madeira, 1998; Nunes, 1999; Gaspar et al., 2015 and references therein).
Fumarolic emissions at Pico Island are located on the summit of the 2,351 m-tall Pico Volcano and a survey performed in 1994 showed that the dry gas is composed of CO2, O2, Ar, and N2 (Table 1; Nunes, 1999). MORB-type values for the 3He/4He ratio (8.5 Ra) were measured by Jean-Baptiste et al. (2009) in a water well, a slightly lower value from the He isotopic composition measured in olivine crystals by Métrich et al. (2014), which varied between 10.2 and 11.1 ± 0.1 Ra.
São Jorge Island
Tectonic Structures and Seismicity
The main tectonic structures defined for São Jorge are parallel to the WNW-ESE elongation of the island (Figure 2). The younger western half of São Jorge is dominated by the Picos and Pico do Carvão fault zones, which are marked by alignments of cones, craters, scoria ramparts, and short fault scarps (Madeira, 1998; Madeira and Brum da Silveira, 2003; Madeira et al., 2015). In the older eastern part of the island, Madeira and Brum da Silveira (2003) identified a set of faults with WNW-ESE direction. The most important faults in this region are the Urze-S. João Fault that displays a 10 km long continuous scarp (Figure 2). The two sectors of the island are separated by the NNW-SSE Ribeira Seca hidden fault according to Madeira and Brum da Silveira (2003).
The strongest earthquake (M = 7.4) that affected the Azores islands after settlement occurred offshore São Jorge in 1757 and was responsible for the death of ~1,000 persons, corresponding to about 20% of the population of the island at that time (Madeira, 1998; Madeira and Brum da Silveira, 2003; Gaspar et al., 2015 and references therein). In 1964 a seismic swarm with events reaching intensity VII (EMS-98, Silva, 2005) caused severe damage on the NW part of the island. This activity was probably associated to a submarine volcanic eruption located just west of the village of Velas, on the south coast. Similarly to what was referred for Pico Island, earthquakes with epicenters close to the other islands of the Central Group also affected São Jorge. This was the case of the recent 1980 and 1998 seismic events, the first of which caused severe damage and the death of 20 persons in the island.
Volcanism
Three main fissure basaltic volcanic systems have been defined in São Jorge Island: Topo (1.32 ± 0.02 Ma), Rosais (368 ± 6 ka to 270 ka), and Manadas (<6 ka years) volcanic systems (Hildenbrand et al., 2008 and references therein).
Since settlement two sub-aerial eruptions occurred in the island, one in 1580 and other in 1808; persistent fumarolic activity was reported associated to the main vents (north of Urzelina village) for several years following the 1808 eruption, but nowadays no evidence of these emissions is possible to find out; as previously mentioned a submarine eruption occurred in 1964 associated to intense seismicity (Weston, 1964; Madeira, 1998). Even if the historical volcanic eruptions at São Jorge Island are dominated by Hawaiian/Strombolian eruptive styles, more than 45 deaths were reported as a consequence of the volcanic activity (Gaspar et al., 2015 and references therein).
No thermal anomalies are reported in the island and two cold CO2-rich springs located in the eastern half of the island are the only secondary manifestations of volcanism presently found at São Jorge (Viveiros, 2003; Ferreira et al., 2005).
Materials and Methods
Soil Diffuse Degassing
Field Surveys and Instruments
Soil CO2 concentrations were measured at a depth of about 50 cm through the insertion of an iron probe in the soil. The probe is connected to an infrared CO2 detector (Geotechnical Instruments, model Anagas CD95) and the gas is pumped to the instrument until the concentration reaches a stable value. This detector measures the CO2 concentration in the range 0–100 vol.% (resolution of 0.1 and precision of 2%).
The Faial Island survey was carried out on two campaigns: during the summer of 2001 (1712 measurements; Faria, 2002) and the summer of 2003 (446 measurements; Marcos, 2006). A total of 263 sites were sampled at São Jorge Island and the measurements were performed during three missions: April and December 2003, and August 2004. Similarly, on Pico Island, the field work was also performed along three surveys (April 2003, December 2003, and July/August 2004). These surveys resulted in a total of 317 sampled sites (Figure 3).
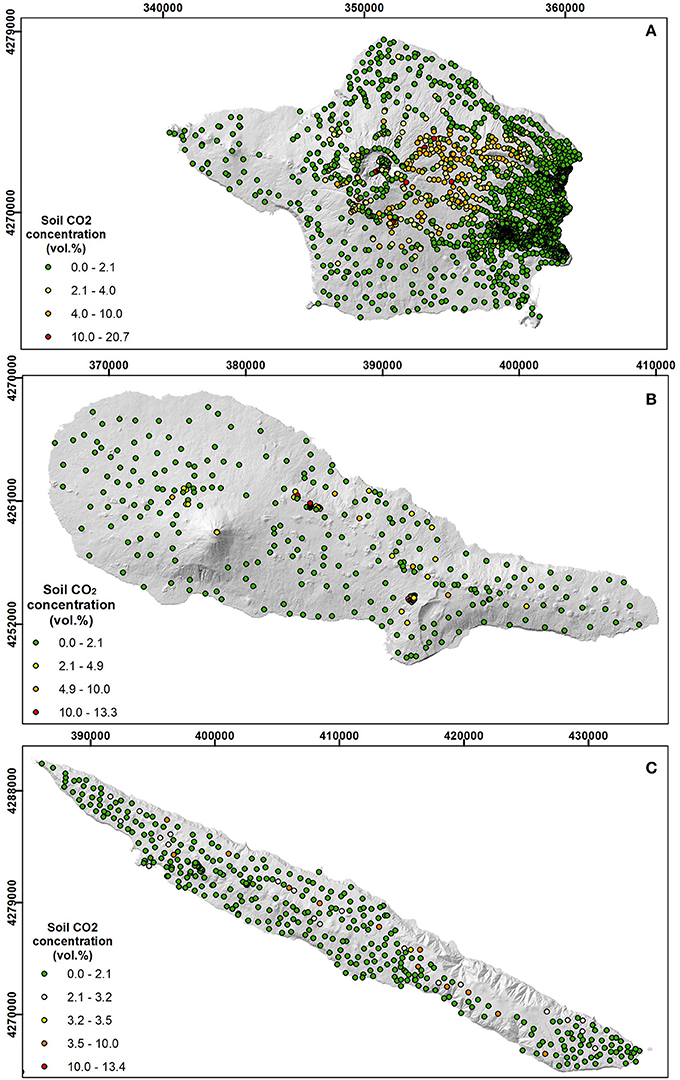
Figure 3. Sampling location and soil CO2 concentration distribution maps for the studied islands: (A) Faial, (B) Pico, and (C) São Jorge islands.
Soil CO2 fluxes were also measured at Pico and Faial islands during August 2011. These measurements were performed using the accumulation chamber method (Chiodini et al., 1998). The instrument (manufactured by West Systems® S.r.l.) is equipped with a LICOR LI-800 infrared CO2 detector (L-IR) that measures CO2 concentrations in the range from 0 to 2 vol.%. The reproducibility was estimated around 10% for CO2 fluxes between 10 and 10,000 g m−2d−1 by Chiodini et al. (1998), using a similar instrument. Carapezza and Granieri (2004) found that the uncertainty increased to 24% for measurements in low soil CO2 flux areas.
A total of 93 and 107 sites were surveyed, respectively, at Pico and Faial islands (Table 2, Figure 4). Considering the significant impact that environmental conditions can have on the soil gas fluxes (e.g., Granieri et al., 2003; Viveiros et al., 2008, 2009, 2014), measurements were performed during summer time and in days with stable weather conditions.
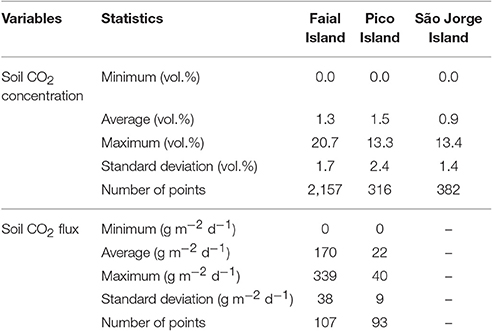
Table 2. Descriptive statistics of the soil CO2 concentration/flux data.
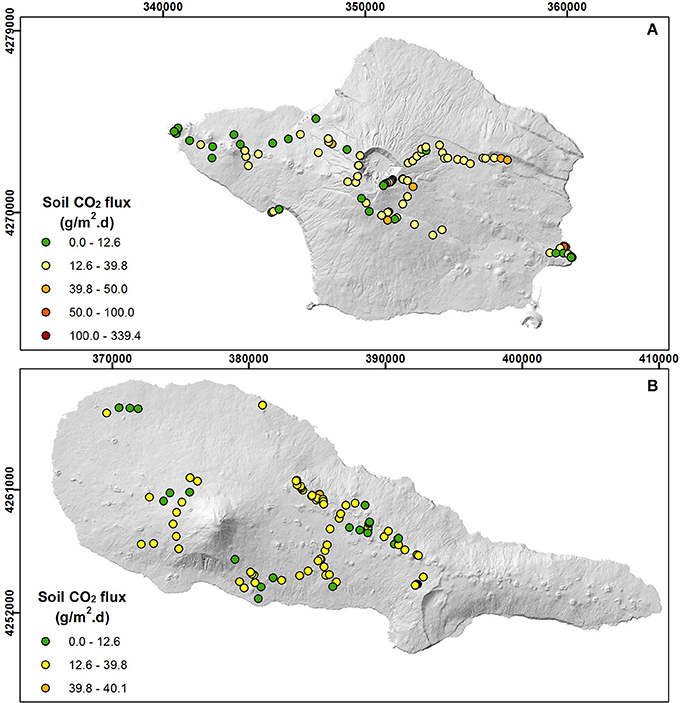
Figure 4. Sampling location and soil CO2 flux distribution maps for Faial (A) and Pico (B) islands.
Field conditions (e.g., geomorphologic features, anthropogenic infrastructures, authorization to access the sites) affected the sampling design resulting in an irregular grid (Figures 3, 4). Nevertheless, sampled sites were distributed throughout the entire islands in order to cover as much as possible the sub-aerial surface of the islands. Locations of the sampling points were determined by a handheld Global Positioning System (GPS, GPSMAP® 76S from Garmin Company) with uncertainty of ±6 m.
Soil temperature measurements have been performed in the Faial (Capelinhos) and Pico (Pico Volcano) fumaroles using a portable thermocouple (Hanna Instruments, model HI93531). Measurements in Faial were carried out in August 2011 and in Pico in July 2003 (Table 3).
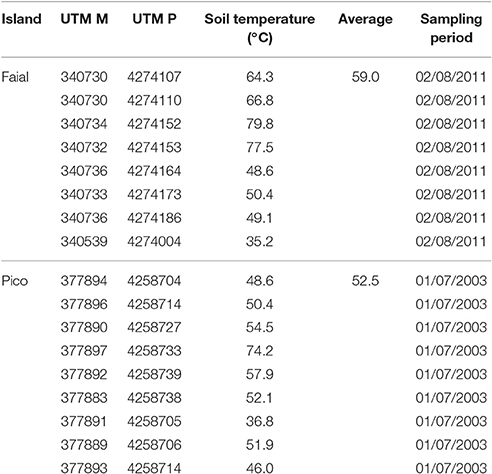
Table 3. Soil temperature measured in the fumarolic areas of Pico and Faial islands.
Data Processing
CO2 released by soils can be fed by multiple gas sources, such as biogenic and volcanic-hydrothermal origins (Chiodini et al., 1998, 2008). For this reason, statistical methodologies have been applied to the data in order to evaluate the presence of different populations for the CO2 degassing.
Graphical statistical approach (GSA)
Cumulative probability plots have been widely applied in the literature to distinguish different CO2 populations that can be representative of distinct CO2 sources (biogenic and volcanic-hydrothermal; e.g., Chiodini et al., 1998; Cardellini et al., 2003; Viveiros et al., 2010). Sinclair (1974) developed a method for choosing threshold values between anomalous and background geochemical data, based on partitioning cumulative probability plots of the data. Considering that spatial geochemical data, such as soil CO2 fluxes/concentrations are usually lognormal distributed, the GSA methodology is applied to the log transformed data and consists of partitioning complex statistical data distribution, which results from overlapping lognormal populations, into individual populations. The mean, the standard deviation and the proportion of each partitioned lognormal population are then graphically estimated by applying the procedure proposed by Sinclair (1974). The validity of the model and of the estimated statistical parameters of the populations is assessed by comparing, on a probability plot, the distribution resulting from the combination of the theoretical populations with the distribution of the data. Since the computed statistical parameters refer to the logarithm of the values, the mean CO2 flux and the 90% confidence interval of the mean are then computed with the Sichel's t-estimator (David, 1977).
The 95th percentile of the lowest values population, which usually represents the biological CO2, is used as cutt-off for the biological (background) CO2 fluxes. A similar criteria was used in previous studies (e.g., Chiodini et al., 1998; Cardellini et al., 2003; Viveiros et al., 2010).
Interpolated maps
Final CO2 degassing maps have been elaborated based on the sequential Gaussian simulations (sGs) methodology (Deutsch and Journel, 1998; Cardellini et al., 2003), which consists on the production of numerous simulations of the spatial distribution of the attribute (the soil CO2 concentration, in this study). Stochastic simulation produces realizations that respect the original data (e.g., histograms, variograms) without smoothing the extreme values. A simulated value at one location is randomly selected from the normal distribution function defined by the kriging mean and variance based on the neighborhood values. The simulation is conditional and sequential, meaning that the simulated value at the new randomly visited point is dependent upon both the original data and the previously simulated values (Deutsch and Journel, 1998; Goovaerts, 1999). The process is repeated until all points are simulated. Considering that the sGs procedure requires a Gaussian distribution, and considering that original data do not follow the normal distribution, a normal scores transformation of the data was applied. Omnidirectional variograms (Figure 5) were also computed in order to fit the best parameters that adjust to the spatial distribution of the surveyed values (Isaaks and Srivastava, 1989), and use them in the sGs interpolation. One hundred realizations were performed per each map and results were displayed as E-type maps that show the “expected” value at any location, obtained through a point-wise linear average of all the simulations (Cardellini et al., 2003).
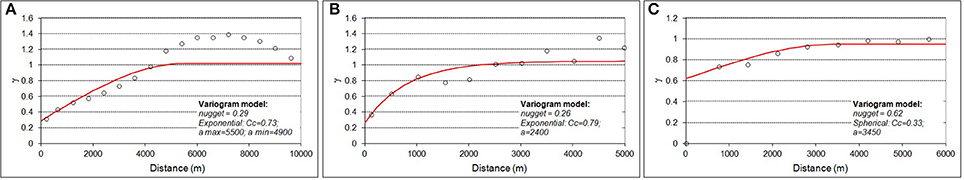
Figure 5. Omnidirectional variograms of the soil CO2 concentration data for Faial (A), Pico (B), and São Jorge (C). Cc: Partial sill; a: range (in m).
Fumarolic Emissions
Sampling Methodology
Gases released at Pico Volcano fumaroles were collected in June 2016 using the methodology defined by Giggenbach (1975) and Giggenbach and Goguel (1989), which consists on the use of evacuated flasks that contain a 4 N NaOH solution. A tube was directly inserted in the main fumarolic vent and the gas guided through a silicon tube to the flask.
Analytical Procedures
The analysis of the chemical composition of the gases was carried out at the gas geochemistry laboratories of the University of the Azores, using gas chromatography and titration techniques. Gases in the headspace of the bottle (CH4, N2, O2, Ar, He, and H2) were analyzed with a Perkin Elmer Clarus 580 gas chromatograph. This chromatograph has two channels equipped with two Thermal Conductivity Detectors and both a MS 5A plot column and a MS packed column that allow using He and Ar as carrier gases to separately quantify Ar and O2. Gases dissolved in the alkaline suspension were quantified by titration: the CO2 was detected by potentiometric titration with an automatic titrator from Radiometer Copenhagen, model VIT90 Video Titrator and the H2S quantified by colorimetric titration with mercury acetate using dithizone for end point detection.
Results
Descriptive Statistics
Soil CO2 concentration ranged between 0 and 20.7 vol.%, with the maximum values recorded at Faial Island (Table 2). Higher soil CO2 fluxes were also measured at Faial Island (339 g m−2 d−1). Maximum soil CO2 concentrations in Pico and São Jorge were lower (~13 vol.%; Figure 3).
Soil temperatures measured in the Pico and Faial fumaroles and in the surrounding areas are presented in Table 3 and maximum values were similar, i.e., 74.2 and 79.8°C, for Pico and Faial degassing areas, respectively. Higher temperatures were measured in the fumarolic/steam vents (Table 1).
Gas composition of the Pico fumarole, sampled in June 2016, is showed in Table 1. These emissions release essentially water vapor (~0.49 for the ratio dry gases/H2O), N2, CO2, O2, and Ar. The other elements, characteristic of hydrothermal fumaroles (CH4, He, H2, and H2S), were not detected.
CO2 Degassing Maps
Omnidirectional variograms of the soil CO2 concentration data were computed and modeled for each dataset (Figure 5). Degassing maps of the CO2 concentrations resulting from the sequential Gaussian simulation procedure for the sampled datasets are shown in Figures 6–8. The scarce data for the soil CO2 flux values do not allow the elaboration of an interpolated map, and for this reason only the distribution of the sampled points is showed (Figure 4).
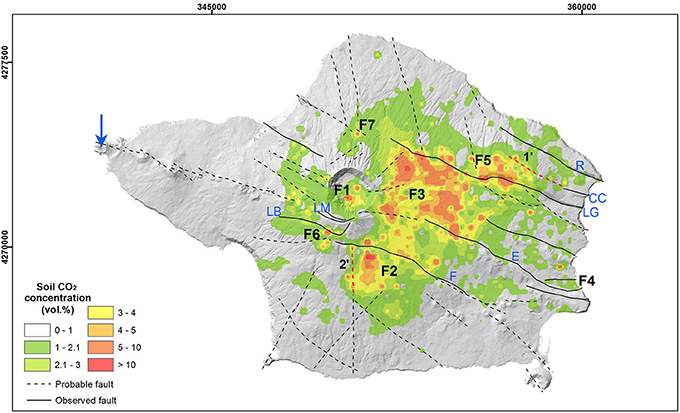
Figure 6. E-type soil CO2 concentration map for Faial Island (cell size = 50 × 50 m; interpolation method: sGs). Numbers F1–F7 represent the DDS identified at Faial Island, which correspond to areas where CO2 is fed by hydrothermal sources (highlighted as orange and red—soil CO2 concentration >4 vol.%) (UTM(m)-WGS84, zone 26S). The blue arrow points to the location of the Capelinhos fumarolic field and red dotted lines represent degassing lineaments. Blue letters represent tectonic structures mentioned in the text: LB, Lomba de Baixo; LM, Lomba do Meio; F, Flamengos; E, Espalamaca; LG, Lomba Grande; CC, Chã da Cruz; R, Ribeirinha.
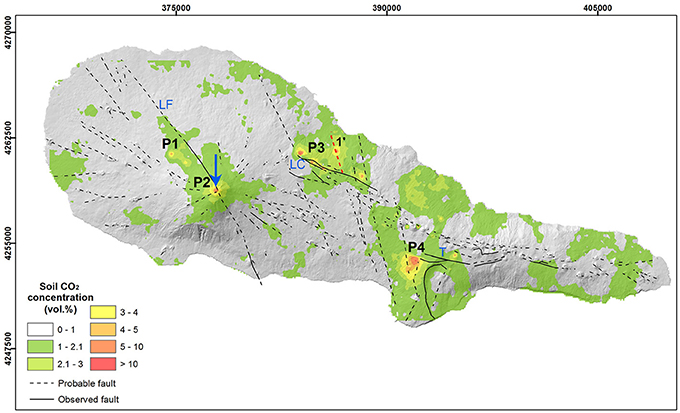
Figure 7. E-type soil CO2 concentration map for Pico Island (cell size = 50 × 50 m; interpolation method: sGs). Numbers P1–P4 represent the DDS identified at Pico Island (highlighted as orange and red colors) (UTM(m)-WGS84, zone 26S). The blue arrow represents the location of the Pico fumarolic field and red dotted line represents a degassing lineament. Blue letters represent tectonic structures mentioned in the text: LF, Lomba de Fogo-S. João; LC, Lagoa do Capitão; T, Topo.
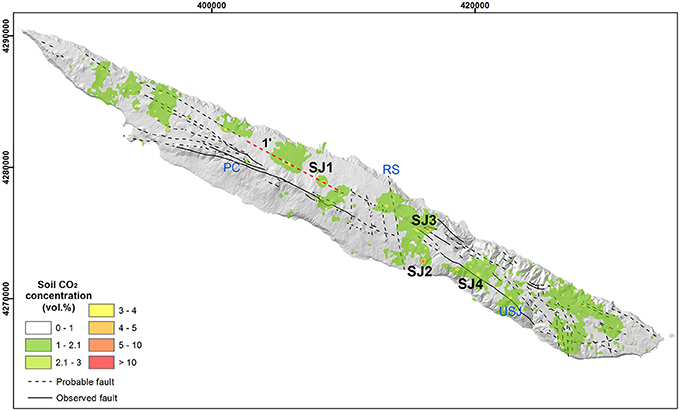
Figure 8. E-type soil CO2 concentration map for São Jorge Island (cell size = 50 × 50 m; interpolation method: sGs). Numbers SJ1–SJ4 represent the DDS identified at São Jorge Island (highlighted as orange and red colors) (UTM(m)-WGS84, zone 26S). The red dotted line represents a degassing lineament. Blue letters represent tectonic structures mentioned in the text: PC, Pico do Carvão; RS, Ribeira Seca; USJ, Urze-S. João.
CO2 Populations
Logarithmic probability plots of the soil CO2 flux/concentrations are presented in Figures 9, 10. Soil CO2 concentration shows bimodal populations for the data measured in the three islands, suggesting the presence of different CO2 sources (biogenic and volcanic-hydrothermal). In what concerns the soil CO2 flux data, polymodal distribution of the Faial Island data represents the overlapping of three log-normal populations (Figure 10).
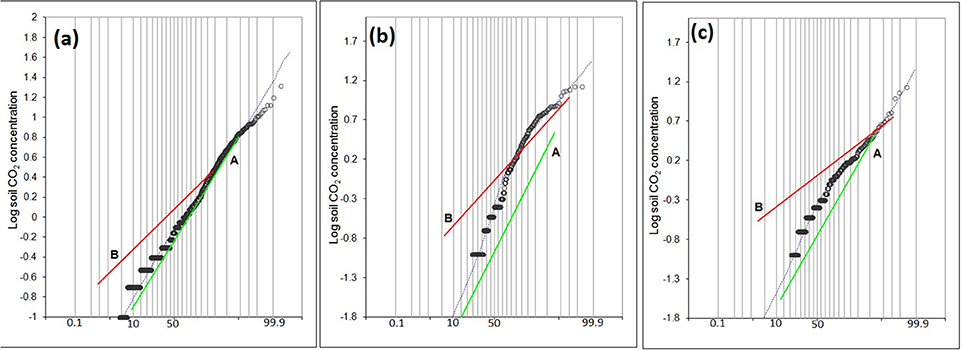
Figure 9. Probability plots of soil CO2 concentrations measured at Faial (A), Pico (B), and São Jorge (C) islands. Green and red lines represent populations A and B, respectively.
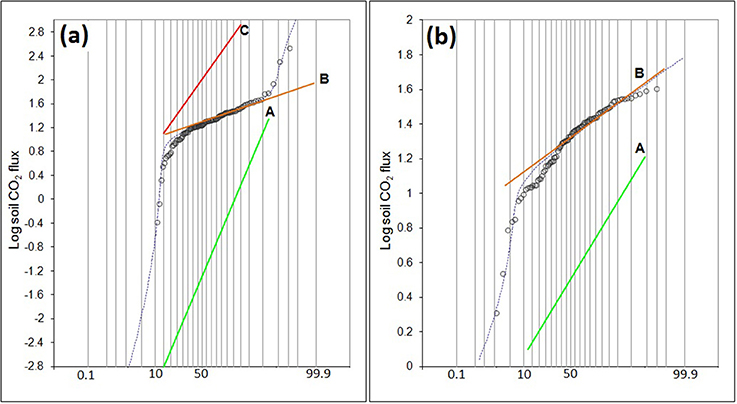
Figure 10. Probability plots of soil CO2 fluxes measured at Faial (A) and Pico (B) islands. Green, orange and red lines represent populations A, B, and C, respectively.
Statistical parameters from the partitioned CO2 populations and the 90% confidence intervals of the mean for the different study sites are presented in Table 4. Populations named “A” are characterized by very low soil CO2 flux/concentration values. Population “C” is identified only for the case of Faial Island soil CO2 flux data.
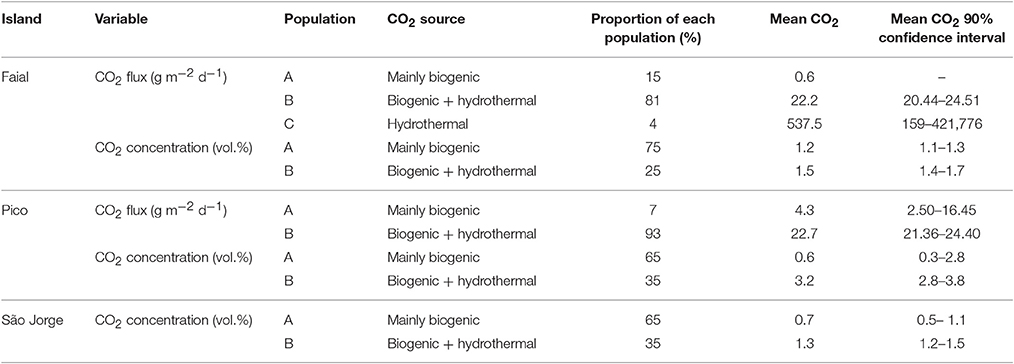
Table 4. Statistical parameters from the partitioned CO2 concentration/flux populations and the 90% confidence intervals of the mean.
Discussion
Visible secondary manifestations of volcanism were previously recognized in the islands of Faial, Pico, and São Jorge (Ferreira et al., 2005; Cruz et al., 2010). The present study highlights the additional presence of soil CO2 diffuse degassing areas, most of them associated to faults crossing the study sites. The maximum soil CO2 concentration (20.7 vol.%) and flux (339 g m−2 d−1) values were measured at Faial Island, in the Praia do Almoxarife area and are associated to the Espalamaca fault (DDS F4 in Figure 6). These measured soil CO2 concentration values are comparable with the concentrations recorded at Mosteiros and Ribeira Seca villages (São Miguel Island), but significantly lower than at Furnas Volcano, where values as high as 100 vol.% were measured (Viveiros et al., 2015). The maximum soil CO2 concentration values at Pico and São Jorge islands were similar (~13 vol.%), but lower than those recorded at Faial Island.
The measured ranges of CO2 suggest different origins for the gases released from soils. Statistical methodologies applied to the recorded data showed different populations both for the CO2 concentrations and fluxes, suggesting biogenic and volcanic-hydrothermal sources. Discrimination of these sources is particularly relevant in the Azores archipelago due to the abundant vegetation that covers the volcanic soils. Lowest CO2 values (population “A,” Table 4) probably correspond to areas where biologic processes are responsible for the gas released from soils. Values very close to zero, or even zero, should represent areas where even the biologic production is scarce. Population “C,” only present in the soil CO2 flux dataset of Faial Island, is representative of CO2 fed by an endogenous source (volcanic-hydrothermal origin). Data associated with population “B” probably represent the mixture of biogenic and hydrothermal CO2 contributions. Most of the measured soil CO2 concentration data fall within populations “A” (65–75% of the data), corresponding to biogenic contribution for the emitted CO2 (Table 4). In what concerns the soil CO2 flux determinations, most of the data are interpreted as a mixture of biogenic and hydrothermal/volcanic contributions. The high percentage of CO2 flux data in population “B” is probably explained by the fact that the flux surveys were carried out in the areas where anomalous CO2 values were previously detected and mostly related with the presence of faults. The main objective of the 2011 campaigns was to select an area to install permanent soil CO2 flux stations in the islands of Pico and Faial.
The cut-off value defined for each dataset according to the criteria suggested by Sinclair (1974), i.e., the 95th percentile of a determined population, allows to establish thresholds to discriminate the biogenic contribution from a deep source (Table 5). The 95th percentile for population “B” is selected in this study to define the DDS (Chiodini et al., 2001). For the particular case of Faial Island, the 95th percentile of populations “A” and “B” (soil CO2 concentrations) is similar. In what concerns the limits defined for the soil CO2 fluxes, the thresholds are the same for Pico and Faial islands (12.6 g m−2 d−1 for the biogenic contribution and 39.8 g m−2 d−1 for the definition of DDS). Scales of the distribution maps presented in Figures 3, 4 were defined according to these limits. The final DDS proposed in the present study resulted from the integration of soil CO2 flux and concentration values.
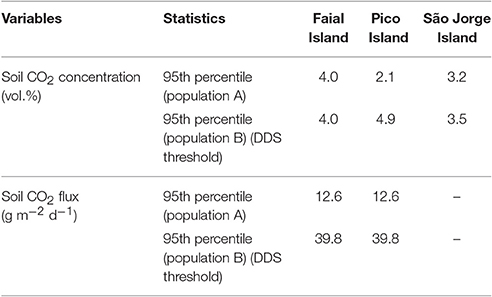
Table 5. Values for the biogenic and DDS thresholds following the criteria of Sinclair (1974).
The thresholds proposed here are similar to data available in the literature. For instance, available data on CO2 production from a wide variety of ecosystems show CO2 fluxes ranging from ~0.5 to ~19 g m−2 d−1 (e.g., Raich and Schlesinger, 1992; Raich and Tufekcioglu, 2000) with maximum flux values attributed to grassland (~50 g m−2 d−1; e.g., Norman et al., 1992; Bajracharya et al., 2000; Nakadai et al., 2002). The biogenic threshold for the soil CO2 fluxes at Faial and Pico islands is thus within the values published for other areas. At Furnas Volcano (S. Miguel Island) a value of 25 g m−2 d−1 was selected as the limit, which integrated both statistical methodologies and carbon isotopic data (Viveiros et al., 2010). The threshold defined for the DDS at Furnas Volcano was 50 g m−2 d−1, not far from the value suggested in this study (39.8 g m−2 d−1). The CO2 sources should be better constrained by the δ13CCO2 data, which is not available for this study. For this reason, the evaluation of different feeding sources was only based on the cumulative probability plots.
The CO2 degassing map for Faial Island shows an absence of CO2 emission in the youngest part of the island (Capelo Volcanic Complex), including the areas where the recent volcanic eruptions occurred (Figures 2, 6). Even in areas where thermal anomalous values were measured, which are associated to the only fumarolic (steam) field in Faial, in Capelinhos Volcano, no soil CO2 degassing (both concentration and flux) was detected. In the fumarolic field the maximum temperature measured was 91°C and the main gases released are the atmospheric constituents (N2, O2, and Ar), with minor amounts of CO2 and H2. These emissions are probably due to some remnant heat from the 1957–58 volcanic eruption that still heats some water and air in the system. Higher soil CO2 concentrations were measured in the floor of the summit caldera (Caldeira Volcano; DDS F1, Figure 6), where a phreatic eruption occurred during the Capelinhos 1957–58 volcanic eruption, however no thermal anomaly was identified in the area.
Two main fault systems trending WNW-ESE and NNW-SSE were recognized in the study islands by previous works (Madeira and Brum da Silveira, 2003; Madeira et al., 2015), and most of the DDS identified in this study occur associated with the previously mapped tectonic structures. A clear correlation between distribution of the CO2 degassing anomalies and one of the main trending pattern is not observed; instead, and similarly to the observed for volcanism that is tectonically controlled (Madeira et al., 2015 and references therein), the main degassing anomalies seem to be found out in the intersection of different fault systems.
Based on soil CO2 concentrations coupled with the soil CO2 flux values, seven DDS were then identified in the Faial island (Figure 6). Main CO2 anomalies are located in the eastern side of the island, essentially delimited by the Pedro Miguel graben structure that affects products from the Ribeirinha and Caldeira central volcanoes. The large DDS F3, which comprises more than half of the graben floor, lays between the important WNW-ESE tectonic structures that define the Pedro Miguel graben: between the Lomba Grande Fault (LG, Figure 2) that dips to the south and the north-dipping Espalamaca and Flamengos faults that define the southern part of the graben structure. The presence of deeply-derived CO2 in the Pedro Miguel graben suggests that the graben faults correspond to deep structures that link the surface to deep areas where CO2 is trapped and then channeled to the surface. DDS F5 probably results from the intersection of the graben faults with the mapped NNW-SSE structure identified in the area. In addition, this DDS contributes to define a degassing lineament (1′, Figure 6) that can be the prolongation of the Chã da Cruz Fault.
The graben faults do not constitute barriers to the gas traveling to the surface since diffuse degassing structures are not limited to the graben floor and, for instance, DDS F2 is identified in the upthrown block of the Flamengos Fault. Two degassing lineaments are also associated with this DDS, which argue to confirm the presence of the hidden N-S radial fracture (lineament 2′; Figure 6).
The DDS F6 is associated with Flamengos and Lomba de Baixo faults, which dip to the north. The main CO2 anomaly is however observed in the top of the scarp of Lomba de Baixo Fault and should result from the high permeability of the area that is crossed by several tectonic structures. Similarly, DDS F7 is also found out in the intersection of different trending tectonic structures (WNW-ESE, NNW-SSE, and NE-SW). As mentioned before, the CO2 anomalous areas occur, in general, where a network of faults/fractures are identified, and thus seem to result from the intersection of permeable structures that allow the gas to travel from depth and escape to the surface (see DDS F2, F5, F6, and F7 in Figure 6).
The highest soil CO2 flux and concentration values, representing a clear volcanic-hydrothermal origin, were measured at Praia do Almoxarife village (DDS F4) and were detected close to a building where in 2007 lethal indoor CO2 concentrations (>15 vol.%) were measured (Ferreira and Viveiros, 2007). This very localized DDS is aligned with submarine gas emissions offshore of Faial, along the submerged Espalamaca Fault scarp, which are mainly constituted by cold CO2 (Viveiros et al., 2016b).
From a public health risk assessment perspective, the DDS F4, located at Praia do Almoxarife, highlights the need to perform a detailed CO2 flux map in that village to identify which buildings may be located over anomalous CO2 degassing sites, with the consequent impacts that it may have on the population. Even if the other DDS are not directly associated with inhabited areas, detailed CO2 degassing maps should also be performed to evaluate possible risks for future constructions.
A total of four DDS were identified at Pico Island. The main CO2 degassing anomalies are located in the summit area of the youngest volcano (DDS P2), Pico Volcano, where the only fumarolic emissions of the island are found (Figure 7). DDS P1 and P2 are associated with the Lomba de Fogo-S. João NNW-SSE trending fault that crosses the summit of Pico Volcano and fed the 1718 eruption. Similarly to the central volcano, the fumarolic field occurs in the intersection of the NNW-SSE, WNW-ESE, and NE-SW structures. Chemical analyses performed on Pico fumaroles in the summer of 2016 are similar to those previously obtained in 1994, showing the stability of its feeding system across two decades. The gases emitted are mainly composed of N2 and CO2, with minor amounts of O2 and Ar, whose composition suggests air contamination during the ascend of gas from the deep reservoir to the surface. This fact is probably correlated with the location of the fumaroles in the volcano's summit, allowing atmospheric air to be introduced in the system, interfering with the original gas composition in the hydrothermal reservoir.
Despite the DDS P1 and P2 the remaining anomalous CO2 degassing sites are also associated with tectonic structures previously identified by Madeira and Brum da Silveira (2003) in older volcanic areas. These important CO2 degassing anomalies are correlated with the Lagoa do Capitão and Topo areas (DDS P3 and DDS P4, respectively, Figure 7), where several faults intersect. DDS P3 is correlated with the important WNW-ESE trending Lagoa do Capitão Fault. This structure dips to the south, but CO2 anomalies are observed also in the upthrown block of the fault. This behavior may be associated with a higher permeability in the top of the scarp (due to fracture along the scarp) or with the presence of not mapped tectonic structures, such as the suggested lineament 1' that can be the elongation of the probable NNW-SSE fault defined by Madeira and Brum da Silveira (2003). In what concerns DDS P4, identified in the southwestern side of the WNW-ESE Topo trending fault, it probably results from the intersection of hidden NNW-SSE and NE-SW tectonic structures (Figure 7).
Similarly to Faial, faults/fractures intersection seems to favor higher permeability for the gas to travel from depth to the surface. Madeira and Brum da Silveira (2003) suggested several probable/hidden faults for the island trending WNW-ESE and NW-SE, and the present study shows that significant CO2 anomalies correlate well with the areas of intersection of hidden/probable NNW-SSE structures with the dominant WNW-ESE faults.
The areas associated with historical eruptions in Pico Island (1562–64, 1718 and 1720, Figure 2), similarly to what was observed for Faial (Capelo Peninsula), do not show CO2 emissions, what can be probably explained by the low or absent coverage of soils together with the high permeability of the recent lava flows that allow ingress of atmospheric air in the sub-superficial layers and dilution of the deep gases in their traveling to the surface. Nevertheless, it cannot be excluded that lava flows may act locally as barriers to the gas ascent to the surface when they are compact and low fractured. This behavior was also observed by Padrón et al. (2013) at Timanfaya Volcano (Lanzarote, Canary Islands), where the absence of CO2 emission along the eruptive fissures was justified by the capping nature of the lava flow fields of the 1730–36 eruptions. Even in the vent areas or in the eruptive fissures the CO2 degassing is low. Studies performed by Giammanco et al. (1999) on Mt. Etna (Italy) justified the absence of soil degassing in recent eruptive fissures due to obstruction after magma solidification or to sealing from hydrothermal alteration.
From a hazard perspective, none of the main anomalous CO2 sites are located in areas with buildings; nevertheless, and considering the distances between sampling sites, a detailed survey should be carried out in the villages located close to the identified DDS.
The comparison of the two surveys carried out at Pico fumarolic emissions shows that the gas composition remained quite stable in the last two decades; this fact argues for the stability of the feeding systems, and consequently can be useful for any seismo-volcanic monitoring programme.
Four main DDS were identified in São Jorge Island, where no thermal anomalous zones are known. SJ3 is the only DDS located in the intersection of different WNW-ESE trending faults (Figure 8) and probably corresponds to an area of increased permeability that allows the gas to escape at the surface. The DDS SJ1 is aligned with a WNW-ESE trending probable fault located to the west and east of the degassing anomaly and mapped by Madeira and Brum da Silveira (2003). The alignment of the soil CO2 degassing anomalies (1′, Figure 8), once again, may contribute to define the location of hidden faults. The main WNW-ESE fault zones that dominate the younger western part of the island do not show any CO2 degassing, what can be explained by the superimposed lithological control, as mentioned also for Pico and Faial islands. In the eastern part of the island, and along the WNW-ESE north dipping Urze-São João Fault (Madeira et al., 2015) few anomalous soil CO2 concentrations are observed, even if not directly associated with the dipping direction, and were identified as DDS SJ4.
No tectonic structure has been identified in the area surrounding the SJ2 anomaly, thus further studies are needed to better understand the permeability in the area. These future works should include soil CO2 flux surveys that could contribute to better define the DDS here proposed and eventually identify other anomalous areas. This study does not show significant anomalous CO2 emissions close to the probable Ribeira Seca Fault, and thus cannot contribute to support its existence, that is still under debate.
Considering that CO2 may act as asphyxiant, a detailed survey at Ribeira Seca village is needed for land-use planning. Three of the anomalous zones (SJ2, SJ3, and SJ4) are located in the oldest volcanic system of the island (Topo Volcanic System) and, similarly to what is observed on Pico and Faial islands, no soil CO2 degassing was detected on the areas where historical eruptions (1580 and 1808) occurred (Figure 2), fact that should be explained by the same factors as mentioned above for Faial and Pico islands (absence of well-developed soils, permeability of the lava flows and existence of natural barriers for the gas migration and release at the surface).
Degassing phenomena during periods of quiescence may be a permanent risk in any volcanic area (Viveiros et al., 2009) and, even if no incidents were reported for the islands of Pico and São Jorge, a family was relocated in Faial Island in 2007 due to high indoor CO2 concentrations (>90 vol.%) (Ferreira and Viveiros, 2007). As mentioned above, additional detailed surveys need to complement these studies, mainly focusing in the inhabited areas close to the DDS. For the specific case of São Jorge, and considering that no recent surveys are available, the stability of the degassing areas cannot be confirmed and as so a soil CO2 flux survey is highly recommended. In addition, Mendes et al. (2013), based on GPS data, suggested possible magma movement in the youngest part of the island, highlighting the need to obtain complementary information from a geochemical point of view.
Concluding Remarks
Anomalous soil CO2 degassing areas were identified at Faial, Pico, and São Jorge islands and a total of 15 diffuse degassing structures (DDS) were defined based on the integration of soil CO2 flux and concentration measurements. Statistical methodologies applied to the measured values show distinct populations for the CO2 emitted at the surface, which probably represent different origins (biogenic and hydrothermal-volcanic). Thresholds were defined for each population highlighting the existence of deeply-derived CO2 that is transported to the surface through active faults. In fact, main WNW-ESE and NNW-SSE trending faults in the three study islands are usually well correlated with CO2 degassing and constitute the pathways for the migration of CO2 from deep reservoirs to the surface; few exceptions may be associated with the superimposed effect of the lithology. The main CO2 emissions seem to occur in the older volcanic systems, where the development of soils reduces possible air contamination and the gases migrate to the surface through the high permeability zones that correspond to the intersection of fractures/faults. The absence of soils and the permeability of the recent lava flows, which allow the dilution of the deep gases with atmospheric air, may explain the lack of CO2 emission in the younger volcanic systems. In addition, locally, some low permeable lava flows may act as barriers for the deep gas emissions.
For Pico and Faial islands two different methodologies were used in the present study to measure the soil CO2diffuse degassing. Even if no simultaneous measurements were performed, higher soil CO2 flux values were essentially coincident with areas with anomalous soil CO2 concentrations. The generally good spatial correlation observed between the soil CO2 flux and concentration values in different surveyed periods shows that the anomalous CO2 degassing areas remain stable along time, arguing for the use of these techniques as useful tools for volcanic monitoring programmes. Considering the need to establish a permanent gas monitoring network in these islands, several DDS are here suggested as potential sites to install a permanent soil CO2 flux station, taking into account the state of activity of the different volcanic systems. DDS F2 or F3 at Faial Island are two potential areas to install a permanent soil CO2 flux station since they correspond to the flank of the active Caldeira central volcano. At Pico Island both DDS P1 and P2 seem to be adequate to install a permanent equipment, even if detailed soil CO2 flux measurements should be performed to select the highest CO2 emission site.
Considering that (a) about 32% of the historical volcanic eruptions that affected the Azores archipelago occurred inland or offshore the islands of Pico, Faial, and São Jorge (Gaspar et al., 2015), (b) some of the events were lethal causing the death of a high number of persons, even when the type of volcanism was less explosive (Hawaiian or Strombolian activity), (c) the state of activity of the volcanoes that form these three islands, and (d) the number of inhabitants (38,180, according to the Census, 2011) that can be vulnerable to a future volcanic event, the existence of a volcano monitoring programme that involves different techniques (geophysics, geochemistry) is crucial to identify periods of unrest. The CO2 degassing maps here presented are thus important tools that characterize the CO2 emission in quiescent periods of activity and are important to identify future periods of reactivation. Besides, several studies performed in these islands (e.g., Madeira and Brum da Silveira, 2003; Hildenbrand et al., 2012; Zanon and Frezzotti, 2013; Zanon et al., 2013; Trippanera et al., 2014) have highlighted the importance of the tectonic control on the plumbing systems of the volcanoes, and most of the main degassing areas are also tectonically controlled, what reinforces the need to integrate different geological studies to better understand the volcanic systems. On another hand, the location of some of the identified DDS close to inhabited areas highlights the need to identify hazardous CO2 zones both for the existing and for future constructions.
Author Contributions
FV revisited/processed the data and drafted the manuscript. MM, CF, FV, and CS carried out the soil diffuse degassing field surveys and contributed for the elaboration of the data. JG and TF provided important suggestions during the processing. All the authors have read and approved the final manuscript.
Conflict of Interest Statement
The authors declare that the research was conducted in the absence of any commercial or financial relationships that could be construed as a potential conflict of interest.
Acknowledgments
FV is supported by a Post-Doc Grant from Fundação para a Ciência e Tecnologia (FCT, Ref. SFRH/BPD/100032/2014). This study was also a part of the MARES Project (Ref. TDC/GEO-FIQ/1088/2014), funded by the FCT. The authors would like also to thank Vittorio Zanon for sampling the Pico fumaroles during June 2016 and Lucia Moreno for performing the chemical analyses.
References
Aiuppa, A., Burton, M., Caltabiano, T., Giudice, G., Gurrieri, S., Liuzzo, M., et al. (2010). Unusually large magmatic CO2 gas emissions prior to a basaltic paroxysm. Geophys. Res. Lett. 37, L17303. doi: 10.1029/2010GL043837
Allard, P., Carbonnelle, J., Dajlevic, D., Le Bronec, J., Morel, P., Robe, M. C., et al. (1991). Eruptive and diffuse emissions of CO2 from Mount Etna. Nature 351, 387–391. doi: 10.1038/351387a0
Asimow, P. D., Dixon, J. E., and Langmuir, C. H. (2004). A hydrous melting and fractionation model for mid-ocean ridge basalts: application to the Mid-Atlantic Ridge near the Azores. Geochem. Geophys. Geosys. 5:Q01E16. doi: 10.1029/2003GC000568
Bajracharya, R. M., Lal, R., and Kimble, J. M. (2000). Erosion effects on carbon dioxide concentration and carbon flux from an Ohio alfisol. Soil Sci. Soc. Am. J. 64, 694–700. doi: 10.2136/sssaj2000.642694x
Baubron, J. C., Rigo, A., and Toutain, J. P. (2002). Soil gas profiles as a tool to characterise active tectonics areas: the Jaut Pass example (Pyrenees, France). Earth Planet. Sci. Lett. 196, 69–81. doi: 10.1016/S0012-821X(01)00596-9
Baxter, P., Baubron, J. C., and Coutinho, R. (1999). Health hazards and disaster potential of ground gas emissions at Furnas Volcano, São Miguel, Azores. J. Volcanol. Geotherm. Res. 92, 95–106. doi: 10.1016/S0377-0273(99)00070-0
Beaubien, S. E., Ciotoli, G., and Lombardi, S. (2003). Carbon dioxide and radon gas hazard in the Alban Hills area (central Italy). J. Volcanol. Geotherm. Res. 123, 63–80. doi: 10.1016/S0377-0273(03)00028-3
Blong, R. J. (1984). Volcanic Hazards. A Sourcebook on the Effects of Eruptions. San Diego, CL: Academic Press.
Bonatti, E. (1990). Not so hot “hot spots” in the Oceanic mantle. Science 250, 107–111. doi: 10.1126/science.250.4977.107
Caliro, S., Viveiros, F., Chiodini, G., and Ferreira, T. (2015). Gas geochemistry of hydrothermal fluids of the S. Miguel and Terceira Islands, Azores. Geochim. Cosmochim. Acta 168, 43–57, doi: 10.1016/j.gca.2015.07.009
Cannat, M., Briais, A., Deplus, C., Escartín, J., Georgen, J., Lin, J., et al. (1999). Mid-Atlantic Ridge-Azores hotspot interactions: along-axis migration of a hotspot-derived event of enhanced magmatism 10 to 4 Ma ago. Earth Planet. Sci. Lett. 173, 257–269. doi: 10.1016/s0012-821x(99)00234-4
Carapezza, M. L., and Granieri, D. (2004). CO2 soil flux at Vulcano (Italy): comparison between active and passive methods. Appl. Geochem. 19, 73–88. doi: 10.1016/s0883-2927(03)00111-2
Carapezza, M. L., Inguaggiato, S., Brusca, L., and Longo, M. (2004). Geochemical precursors of the activity of an open-conduit volcano: the Stromboli 2002–2003 eruptive events. Geophys. Res. Lett. 31, L07620. doi: 10.1029/2004gl019614
Cardellini, C., Chiodini, G., and Frondini, F. (2003). Application of stochastic simulation to CO2 flux from soil: mapping and quantification of gas release. J. Geophys. Res. 108, 2425–2437. doi: 10.1029/2002JB002165
Chiodini, G., Caliro, S., Cardellini, C., Avino, R., Granieri, D., and Schmidt, A. (2008). Carbon isotopic composition of soil CO2 efflux, a powerful method to discriminate different sources feeding soil CO2 degassing in volcanic-hydrothermal areas. Earth Planet. Sci. Lett. 274, 372–379. doi: 10.1016/j.epsl.2008.07.051
Chiodini, G., Caliro, S., Cardellini, C., Granieri, D., Avino, R., Baldini, A., et al. (2010a). Long-term variations of the Campi Flegrei, Italy, volcanic system as revealed by the monitoring of hydrothermal activity. J. Geophys. Res. 115:B03205. doi: 10.1029/2008JB006258
Chiodini, G., Cioni, R., Guidi, M., Raco, B., and Marini, L. (1998). Soil CO2 flux measurements in volcanic and geothermal areas. Appl. Geochem. 13, 543–552. doi: 10.1016/S0883-2927(97)00076-0
Chiodini, G., Frondini, F., Cardellini, C., Granieri, D., Marini, L., and Ventura, G. (2001). CO2 degassing and energy release at Solfatara Volcano, Campi Flegrei, Italy. J. Geophys. Res. 106, 16213–16221. doi: 10.1029/2001JB000246
Chiodini, G., Frondini, F., Kerrick, D. M., Rogie, J., Parello, F., Peruzzi, L., et al. (1999). Quantification of deep CO2 fluxes frm Central Italy. Examples of carbon balance for regional aquifers and soil diffuse degassing. Chem. Geol. 159, 205–222. doi: 10.1016/S0009-2541(99)00030-3
Chiodini, G., Granieri, D., Avino, R., Caliro, S., Costa, A., Minopoli, C., et al. (2010b). Non-volcanic CO2 Earth degassing: the case of Mefite di Ansanto (Southern Apennines), Italy. Geophys. Res. Lett. 37, L11303. doi: 10.1029/2010GL042858
Chovelon, P. (1982). Evolution Volcanotectonique des Iles de Faial et de Pico. Thesis, University Paris-Sud, Orsay.
Costa, A. C. G., Hildenbrand, A., Marques, F. O., Sibrant, A. L. R., and Santos de Campos, A. (2015). Catastrophic flank collapses and slumping in Pico Island during the last 130 kyr (Pico-Faial ridge, Azores Triple Junction). J. Volcanol. Geotherm. Res. 302, 33–46. doi: 10.1016/j.jvolgeores.2015.06.008
Cruz, J. V., Freire, P., and Costa, A. (2010). Mineral waters characterization in the Azores archipelago (Portugal). J. Volcanol. Geotherm. Res. 190, 353–364. doi: 10.1016/j.jvolgeores.2009.12.001
David, M. (1977). Geostatistical Ore Reserve Estimation. Amsterdam: Elsevier Scientific Publishing Company.
Demande, J., Fabriol, R., Gérard, A., and Iundt, F. (1982). Prospection Géothermique des Iles de Faial e Pico (Açores). 82SGN003GTH. Bureau de Recherches Géologiques et Minières, Orléans.
de Moor, J. M., Aiuppa, A., Avard, G., Wehrmann, H., Dunbar, N., Muller, C., et al. (2016). Turmoil at turrialba volcano (Costa Rica): degassing and eruptive processes inferred from high-frequency gas monitoring. J. Geophys. Res. 121, 5761–5775. doi: 10.1002/2016JB013150
Deutsch, C. V., and Journel, A. G. (1998). GSLIB: Geostatistical Software Library and User's Guide. Applied Geostatistics Series. New York, NY; Oxford: Oxford Univerity Press.
Dias, N. A., Matias, L., Lourenço, N., Madeira, J., Carrilho, F., and Gaspar, J. L. (2007). Crustal seismic velocity strcuture near Faial and Pico Islands (Azores), from local earthquake tomography. Tectonopphysics 445, 301–317. doi: 10.1016/j.tecto.2007.09.001
Di Chiara, A., Speranza, F., Porreca, M., Pimentel, A., D'Ajello Caracciolo, F., and Pacheco, J. (2014). Constraining chronology and time-space evolution of Holocene volcanic activity on the Capelo Peninsula (Faial Island, Azores): the paleomagnetic contribution. Geol. Soc. Am. Bull. 126, 1164–1180. doi: 10.1130/B30933.1
Evans, B. M., and Staudacher, T. H. (2001). In situ measurements of gas discharges across fissures associated with lava flows at Réunion Island. J. Volcanol. Geotherm. Res. 106, 255–263. doi: 10.1016/S0377-0273(00)00242-0
Faria, C. (2002). Estudo de Anomalias Geoquímicas Associadas a Processos de Desgaseificação Difusa na Ilha do Faial: Contribuição Para a Cartografia de Falhas Activas. Master Thesis, University of the Azores.
Féraud, G., Kaneoka, I., and Allègre, C. J. (1980). K-Ar ages and stress pattern in the Azores: geodynamic implications. Earth Planet. Sci. Lett. 46, 275–286. doi: 10.1016/0012-821X(80)90013-8
Ferreira, T. (1994). Contribuição Para o Estudo das Emanações Gasosas Associadas a Processos de Vulcanismo no Arquipélago dos Açores. Master Thesis, University of the Azores.
Ferreira, T., Gaspar, J. L., Viveiros, F., Marcos, M., Faria, C., and Sousa, F. (2005). Monitoring of fumarole discharge and CO2 soil degassing in the Azores: contribution to volcanic surveillance and public health risk assessment. Ann. Geophys. 48, 787–796. doi: 10.4401/ag-3234
Ferreira, T., and Viveiros, F. (2007). Anomalia Geoquímica em Zona Residencial da Freguesia da Praia do Almoxarife (Ilha do Faial, Açores). Technical Report Ref. 01/CVARG/07
Fischer, T. P., and Chiodini, G. (2015). “Volcanic, magmatic and hydrothermal gases,” in The Encyclopedia of Volcanoes, 2nd Edn., eds H. Sigurdsson, B. Houghton, S. R. McNutt, H. Rymer, and J. Stix (San Diego, CL: Elsevier Inc.), 779–797.
Gaspar, J. L., and Ferreira, T. (1995). Temperatura e composição química das emanações gasosas do Vulcão dos Capelinhos no decorrer da crise sísmica que se desenvolveu a NW da ilha do Faial em 1992/93. Açoriana 8, 167–175.
Gaspar, J. L., Queiroz, G., Ferreira, T., Medeiros, A. R., Goulart, C., and Medeiros, J. (2015). “Earthquakes and volcanic eruptions in the Azores region: geodynamic implications from major historical events and instrumental seismicity,” in Volcanic Geology of S. Miguel Island (Azores archipelago), eds J. L. Gaspar, J. E. Guest, A. M. Duncan, F. J. A. S. Barriga, D. K. Chester (London: Geological Society, London, Memoirs), 33–49.
Giammanco, S., Gurrieri, S., and Valenza, M. (1999). Geochemical investigations applied to active fault detection in a volcanic area: the North-East Rift on Mt. Etna (Sicily, Italy). Geophys. Res. Lett. 26, 2005–2008. doi: 10.1029/1999gl900396
Giammanco, S., Gurrieri, S., and Valenza, M. (2006). Fault-controlled soil CO2 degassing and shallow magma bodies: summit and lower east rift of Kilauea volcano (Hawaii), 1997. Pure Appl. Geophys. 163, 853–867. doi: 10.1007/3-7643-7584-1_15
Giggenbach, W. F. (1975). A simple method for the collection and analysis of volcanic gas samples. Bull.Volcanol. 39, 132–145. doi: 10.1007/BF02596953
Giggenbach, W. F. (1996). “Chemical composition of volcanic gases,” in Monitoring and Mitigation of Volcano Hazards, eds R. Scarpa and R. I. Tilling (Berlin; Heidelberg: Springer-Verlag), 221–253.
Giggenbach, W. F., and Goguel, R. L. (1989). Collection and Analysis of Geothermal Volcanic Water and Gas Discharges. Chemistry Division, DSIR, Report no. CD 2401.
Goovaerts, P. (1999). Geostatistics in soil science: state-of-the-art and perspectives. Geoderma 89, 1–45. doi: 10.1016/S0016-7061(98)00078-0
Granieri, D., Chiodini, G., Marzocchi, W., and Avino, R. (2003). Continuous monitoring of CO2 soil diffuse degassing at Phlegraean Fields (Italy): influence of environmental and volcanic parameters. Earth Planet. Sci. Lett. 212, 167–179. doi: 10.1016/S0012-821X(03)00232-2
Gurrieri, S., and Valenza, M. (1988). Gas transport in natural porous mediums: a method for measuring CO2 flows from the ground in volcanic and geothermal areas. Rendiconti della Società Italiana di Mineralogia e Petrologia 43, 1151–1158.
Hansell, A., and Oppenheimer, C. (2004). Health hazards from volcanic gases: a systematic literature review. Arch. Environ. Health 59, 628–639. doi: 10.1080/00039890409602947
Hernández, P. A., Notsu, K., Salazar, J. M., Mori, T., Natale, G., Okada, H., et al. (2001). Carbon dioxide degassing by advective flow from Usu Volcano, Japan. Science 292, 83–86. doi: 10.1126/science.1058450
Hildenbrand, A., Madureira, P., Marques, F. O., Cruz, I., Henry, B., and Silva, P. (2008). Multi-stage evolution of a sub-aerial volcanic ridge over the last 1.3 Myr: S. Jorge Island, Azores Triple Junction. Earth Planet. Sci. Lett. 273, 289–298. doi: 10.1016/j.epsl.2008.06.041
Hildenbrand, A., Marques, F. O., Costa, A. C. G., Sibrandt, A. L. R., Silva, P. F., Henry, B., et al. (2012). Reconstructing the architectural evolution of volcanic islands from combined K/Ar, morphologic, tectonic, and magnetic data: the Faial Island example (Azores). J. Volcanol. Geotherm. Res. 241–242, 39–48. doi: 10.1016/j.jvolgeores.2012.06.019
Hipólito, A., Madeira, J., Carmo, R., and Gaspar, J. L. (2013). Neotectonics of Graciosa Island (Azores): a contribution to seismic hazard assessment of a volcanic area in a complex geodynamic setting. Ann. Geophys. 56:S0677. doi: 10.4401/ag-6222
Hutchison, W., Mather, T. A., Pyle, D. M., Biggs, J., and Yirgu, G. (2015). Structural controls on fluid pathways in an active rift system: a case study of the Aluto volcanic complex. Geosphere 11, 542–562. doi: 10.1130/GES01119.1
Isaaks, E. H., and Srivastava, R. M. (1989). An Introduction to Applied Geostatistics. New York, NY; Oxford: Oxford University Press.
Jean-Baptiste, P., Allard, P., Coutinho, R., Ferreira, T., Fourré, E., Queiroz, G., et al. (2009). Helium isotopes in hydrothermal volcanic fluids of the Azores archipelago. Earth Planet. Sci. Lett. 281, 70–80. doi: 10.1016/j.epsl.2009.02.009
Jung, N.-H., Han, W. S., Watson, Z. T., Graham, J. P., and Kim, K.-Y. (2014). Fault-controlled CO2 leakage from natural reservoirs in the Colorado Plateau, East-Central Utah. Earth Planet. Sci. Lett. 403, 358–367. doi: 10.1016/j.epsl.2014.07.012
Kanemasu, E. T., Powers, W. L., and Sij, J. W. (1974). Field chamber measurements of CO2 flux from soil surface. Soil Sci. 118, 233–237. doi: 10.1097/00010694-197410000-00001
Lee, H., Muirhead, J. D., Fischer, T. P., Ebinger, C. J., Kattenhorn, S. A., Sharp, Z. D., et al. (2016). Massive and prolonged deep carbon emissions associated with continental rifting. Nat. Geosci. 5, 145–149. doi: 10.1038/ngeo2622
Liuzzo, M., Di Muro, A., Giudice, G., Michon, L., Ferrazzini, V., and Gurrieri, S. (2015). New evidence of CO2 soil degassing anomalies on Piton de la Fournaise volcano and the link with volcano tectonic structures. Geochem. Geophys. Geosyst. 16, 4388–4404. doi: 10.1002/2015gc006032
Liuzzo, M., Gurrieri, S., Giudice, G., and Giuffrida, G. (2013). Ten years of soil CO2 continuous monitoring on Mt. Etna: exploring the relationship between processes of soil degassing and volcanic activity. Geochem. Geophys. Geosyst. 14, 2886–2899. 10.1002/ggge.20196
Lourenço, N., Luís, J., and Miranda, J. M. (1997). Azores Triple Junction Bathymetry. Map edited by Science Faculty, Lisbon and Algarve Universities, 1 sheet.
Machado, F., Parsons, W., Richards, A., and Mulford, J. W. (1962). Capelinhos eruption of Fayal Volcano, Azores, 1957-1958. J. Geophys. Res., 67, 3519–3529. doi: 10.1029/JZ067i009p03519
Madeira, J. (1998). Estudos de Neotectónica nas Ilhas do Faial, Pico e S. Jorge: Uma Contribuição Para o Conhecimento Geodinâmico da Junção Tripla dos Açores. Ph.D. thesis, Faculdade de Ciências da Universidade de Lisboa, 481.
Madeira, J., and Brum da Silveira, A. (2003). Active tectonics and first paleoseismological results in Faial, Pico and S. Jorge islands (Azores, Portugal). Ann. Geophys. 46, 733–761.
Madeira, J., Brum da Silveira, A., Hipólito, A., and Carmo, R. (2015). “Active tectonics in the Central and Eastern Azores islands along the Eurasia-Nubia boundary: a review,” in Volcanic Geology of S. Miguel Island (Azores archipelago), Vol. 44, eds J. L. Gaspar, J. E. Guest, A. M. Duncan, F. J. A. S. Barriga, and D. K. Chester (London: Geological Society, London, Memoirs), 15–32.
Madeira, J., and Ribeiro, A. (1990). Geodynamic models for the Azores triple junction: a contribution from tectonics. Tectonophysics 184, 405–415. doi: 10.1016/0040-1951(90)90452-e
Marcos, M. (2006). Estudo dos Processos de Desgaseificação Difusa nos Açores, com base na Análise de Variações Espaciais de CO2 e Temporais de 222Rn. Master Thesis, University of the Azores, 135.
Marques, F. O., Catalão, J. C., DeMets, C., Costa, A. C. G., and Hildenbrand, A. (2013). GPS and tectonic evidence for a diffuse plate boundary at the Azores Triple Junction. Earth Planet. Sci. Lett. 381, 177–187. doi: 10.1016/j.epsl.2013.08.051
Matias, L., Dias, N. A., Morais, I., Vales, D., Carrilho, F., Madeira, J., et al. (2007). The 9th of July 1998 Faial Island (Azores, North Atlantic) seismic sequence. J. Seismol. 11, 275–298. doi: 10.1007/s10950-007-9052-4
Mendes, V. B., Madeira, J., Brum da Silveira, A., Trota, A., Elosegui, P., and Pagarete, J. (2013). Present-day deformation in São Jorge Island, Azores, from episodic GPS measurements (2001-2011). Adv. Space Res. 51, 1581–1592. doi: 10.1016/j.asr.2012.10.019
Métrich, N., Zanon, V., Créon, L., Hildenbrand, A., Moreira, M., and Marques, F. O. (2014). Is the 'Azores Hotspot'a Wetspot? Insights from the geochemistry of fluid and melt inclusions in olivine of Pico Basalts. J. Petrol. 55, 377–393. doi: 10.1093/petrology/egt071
Miranda, J. M., Luís, J. F., Lourenço, N., and Fernandes, R. M. S. (2015). “The structure of the Azores Triple Junction: implications for São Miguel Island,” in Volcanic Geology of S. Miguel Island (Azores archipelago), eds J. L. Gaspar, J. E. Guest, A. M. Duncan, F. J. A. S. Barriga, and D. K. Chester (London: Geological Society, London, Memoirs), 5–13.
Moreira, M., Doucelance, R., Kurz, M. D., Dupré, B., and Allègre, C. J. (1999). Helium and lead isotope geochemistry of the Azores Archipelago. Earth Planet. Sci. Lett. 169, 189–205. doi: 10.1016/S0012-821X(99)00071-0
Nakadai, T., Yokozawa, M., Ikeda, H., and Koizumi, H. (2002). Diurnal changes of carbon dioxide flux from bare soil in agricultural field in Japan. Appl. Soil Ecol. 19, 161–171. doi: 10.1016/S0929-1393(01)00180-9
Norman, J. M., Garcia, R., and Verma, S. B. (1992). Soil surface CO2 fluxes and the carbon budget of a grassland. J. Geophys. Res. 97, 18845–18853. doi: 10.1029/92JD01348
Nunes, J. C. (1999). A Actividade Vulcânica na Ilha do Pico do Plistocénico Superior ao Holocénico: Mecanismo Eruptivo e Hazard Vulcânico. Ph.D. thesis, University of the Azores, Ponta Delgada, 356.
Pacheco, J. (2015). 14C Ages of the last eruptive stage of Faial Island Caldeira Volcano. Radiocarbon 57, 1021–1027. doi: 10.2458/azu_rc.57.17957
Pacheco, J. M. R. (2001). Processos Associados ao Desenvolvimento de Erupções Vulcânicas Hidromagmátics Explosivas na ilha do Faial e Sua Interpretação Numa Perspectiva de Avaliação do Hazard e Minimização do Risco. Ph.D. thesis, Azores University, Ponta Delgada, 300.
Padrón, E., Padilla, G., Hernández, P. A., Pérez, N. M., Calvo, D., Nolasco, D., et al. (2013). Soil gas gechemistry in relation to eruptive fissures on Timanfaya volcano, Lanzarote Island (Canary Islands, Spain). J. Volcanol. Geotherm. Res. 250, 91–99. doi: 10.1016/j.jvolgeores.2012.10.013
Pantaleo, M., and Walter, T. R. (2014). The ring-shaped thermal field of Stefanos crater, Nisyros Island: a conceptual model. Solid Earth 5, 183–198. doi: 10.5194/se-5-183-2014
Parkinson, K. J. (1981). An improved method for measuring soil respiration in the field. J. Appl. Ecol. 18, 221–228. doi: 10.2307/2402491
Pedone, M., Viveiros, F., Aiuppa, A., Giudice, G., Grassa, F., Gagliano, A. L., et al. (2015). Total (fumarolic + diffuse soil) CO2 output from Furnas volcano. Earth Planets Space 67, 174, doi: 10.1186/s40623-015-0345-5
Peltier, A., Finizola, A., Douillet, G. A., Brothelande, E., and Garaebiti, E. (2012). Structure of an active volcano associated with a resurgent block inferred from thermal mapping: the Yasur-Yenkahe volcanic complex (Vanuatu). J. Volcanol. Geotherm. Res. 243–244, 59–68. doi: 10.1016/j.jvolgeores.2012.06.022
Quartau, R., Madeira, J., Mitchell, N. C., Tempera, F., Silva, P. F., and Brandão, F. (2015). The insular shelves of the Faial-Pico Ridge (Azores archipelago): a morpholical record of its evolution. Geochem. Geophys. Geosyst. 16, 1401–1420. doi: 10.1002/2015GC005733
Raich, J. W., and Schlesinger, W. H. (1992). The global carbon dioxide flux in soil respiration and its relationship to vegetation and climate. Tellus 44B, 81–99. doi: 10.3402/tellusb.v44i2.15428
Raich, J. W., and Tufekcioglu, A. (2000). Vegetation and soil respiration: correlations and controls. Biogeochemistry 48, 71–90. doi: 10.1023/A:1006112000616
Rinaldi, A. P., Vandemeulebrouck, J., Todesco, M., and Viveiros, F. (2012). Effects of atmospheric conditions on surface diffuse degassing. J. Geophys. Res. 117, B11201. doi: 10.1029/2012JB009490
Schilling, J. G. (1975). Azores mantle blob: rare-earth evidence. Earth Planet. Sci. Lett. 25, 103–115. doi: 10.1016/0012-821X(75)90186-7
Schöpa, A., Pantaleo, M., and Walter, T. R. (2011). Scale-dependent location of hydrothermal vents: stress field models and infrared field observations on the Fossa Cone, Vulcano Island, Italy. J. Volcanol. Geotherm. Res. 203, 133–145. doi: 10.1016/j.jvolgeores.2011.03.008
Searle, R. (1980). Tectonic pattern of the Azores spreading centre and triple junction. Earth Planet. Sci. Lett. 51, 415–434. doi: 10.1016/0012-821X(80)90221-6
Serralheiro, A., Forjaz, V. H., Alves, C. A. M., and Rodrigues, B. (1989). Carta Vulcanológica dos Açores – ilha do Faial, scale 1:15000, Sheets 1, 2, 3 & 4. Ponta Delgada: Centro de Vulcanologia do INIC, Serviço Regional de Proteção Civil dos Açores e Universidade dos Açores.
Silva, C., Ferreira, T., Viveiros, F., and Allard, P. (2015). Soil radon (222Rn) monitoring at Furnas Volcano (São Miguel, Azores): applications and challenges. Eur. Phys. J. Spec. Top. 224, 659–686. doi: 10.1140/epjst/e2015-02398-6
Silva, M. (2005). Caracterização da Sismicidae Histórica dos Açores com Base na Reinterpretação de Dados de Macrossísmica: Contribuição Para a Avaliação do Risco Sísmico nas Ilhas do Grupo Central. Master thesis, Universidade dos Açores, 146.
Sinclair, A. J. (1974). Selection of threshold values in geochemical data using probability graphs. J. Geochem. Explor. 3, 129–149. doi: 10.1016/0375-6742(74)90030-2
Trippanera, D., Porreca, M., Ruch, J., Pimentel, A., Acocella, V., Pacheco, J., et al. (2014). Relationships between tectonics and magmatism in a transtensive/transform setting: an example from Faial Island (Azores, Portugal). Geol. Soc. Am. Bull. 126, 164–181. doi: 10.1130/B30758.1
Viveiros, F. (2003). Contribuição Para o Estudo dos Processos de Desgaseificação Difusa nos Açores no mbito da Monitorização Sismovulcânica e da Avaliação do Risco: Discriminação de Factores que Influenciam a Variação do Fluxo do CO2. Master thesis, University of the Azores, 140.
Viveiros, F., Cardellini, C., Ferreira, T., Caliro, S., Chiodini, G., and Silva, C. (2010). Soil CO2 emissions at Furnas volcano, São Miguel Island, Azores archipelago: volcano monitoring perspectives, geomorphologic studies, and land use planning application. J. Geophys. Res. 115:B12208, doi: 10.1029/2010JB007555
Viveiros, F., Ferreira, T., Cabral Vieira, J., Silva, C., and Gaspar, J. L. (2008). Environmental influences on soil CO2 degassing at Furnas and Fogo volcanoes (São Miguel Island, Azores archipelago). J. Volcanol. Geotherm. Res. 177, 883–893. doi: 10.1016/j.jvolgeores.2008.07.005
Viveiros, F., Ferreira, T., Silva, C., and Gaspar, J. L. (2009). Meteorological factors controlling soil gases and indoor CO2 concentration: a permanent risk in degassing areas. Sci. Tot. Environ. 407, 1362–1372. doi: 10.1016/j.scitotenv.2008.10.009
Viveiros, F., Gaspar, J. L., Ferreira, T., and Silva, C. (2016a). Hazardous indoor CO2 concentrations in volcanic environments. Environ. Pollut. 214, 776–786, doi: 10.1016/j.envpol.2016.04.086
Viveiros, F., Gaspar, J. L., Ferreira, T., Silva, C., Marcos, M., and Hipólito, A. (2015). “Mapping of soil CO2 diffuse degassing at São Miguel Island and its public health implications,” in Volcanic Geology of S. Miguel Island (Azores archipelago), eds J. L. Gaspar, J. E. Guest, A. M. Duncan, F. J. A. S. Barriga, and D. K. Chester (London: Geological Society, London, Memoirs), 185–195.
Viveiros, F., Moreno, L., Carreiro-Silva, M., Couto, R., Silva, C., Range, P., et al. (2016b). “Volcanic gas emissions offshore of São Miguel and Faial islands (Azores archipelago),” in Actas das 4as Jornadas de Engenharia Hidrográfica, Instituto Hidrográfico (Lisbon), 320–323.
Viveiros, F., Vandemeulebrouck, J., Rinaldi, A. P., Ferreira, T., Silva, C., and Cruz, J. V. (2014). Periodic behavior of soil CO2 emissions in diffuse degassing areas of the Azores archipelago: application to seismovolcanic monitoring. J. Geophys. Res. 119, 7578–7597. doi: 10.1002/2014JB011118
Vogt, P. R., and Jung, W. Y. (2004). The Terceira rift as hyper-slow, hotspot dominated oblique spreading axis: a comparison with other slow-spreading plate boundaries. Earth Planet. Sci. Lett. 218, 77–90. doi: 10.1016/S0012-821X(03)00627-7
Weinstein, P., and Cook, A. (2005). “Volcanic emissions and health,” in Essentials of Medical Geology – Impacts of the Natural Environment on Public Health, ed O. Selinus (Burlington, MA: Elsevier), 203–226.
Weston, F. S. (1964). List of recorded volcanic eruptions in the Azores with brief reports. Bol. Mus. Lab. Min. Geol. Fac. Ciências Lisboa. 10, 3–18.
Zanon, V., and Frezzotti, M. L. (2013). Magma storage and ascent conditions beneath Pico and Faial islands (Azores Islands). A study on fluid inclusions. Geochem. Geophys. Geosys. 14, 3494–3514. doi: 10.1002/ggge.20221
Keywords: volcanic gases, diffuse degassing structures, CO2 degassing, tectonics, Azores archipelago, Faial Island, Pico Island, São Jorge Island
Citation: Viveiros F, Marcos M, Faria C, Gaspar JL, Ferreira T and Silva C (2017) Soil CO2 Degassing Path along Volcano-Tectonic Structures in the Pico-Faial-São Jorge Islands (Azores Archipelago, Portugal). Front. Earth Sci. 5:50. doi: 10.3389/feart.2017.00050
Received: 13 November 2016; Accepted: 01 June 2017;
Published: 14 June 2017.
Edited by:
Benjamin Alexander Black, City College of New York (CUNY), United StatesReviewed by:
José Madeira, Universidade de Lisboa, PortugalJ. Maarten De Moor, OVSICORI-UNA, Costa Rica
Copyright © 2017 Viveiros, Marcos, Faria, Gaspar, Ferreira and Silva. This is an open-access article distributed under the terms of the Creative Commons Attribution License (CC BY). The use, distribution or reproduction in other forums is permitted, provided the original author(s) or licensor are credited and that the original publication in this journal is cited, in accordance with accepted academic practice. No use, distribution or reproduction is permitted which does not comply with these terms.
*Correspondence: Fátima Viveiros, bWFyaWEuZmIudml2ZWlyb3NAYXpvcmVzLmdvdi5wdA==