 Daniel Müller1
 Thomas R. Walter1*
 Anne Schöpa2
 Tanja Witt1
 Bastian Steinke1Magnús T. Gudmundsson3Tobias Dürig3
- 1Section 2.1: Physics of Earthquakes and Volcanoes, GFZ German Research Centre for Geosciences, Potsdam, Germany
- 2Section 5.1: Geomorphology, GFZ German Research Centre for Geosciences, Potsdam, Germany
- 3Nordvulk, Institute of Earth Sciences, University of Iceland, Reykjavík, Iceland
Fissure eruptions are commonly linked to magma dikes at depth and are associated with elastic and inelastic surface deformation. Elastic deformation is well described by subsidence occurring above the dike plane and uplift and lateral widening occurring perpendicular to the dike plane. Inelastic deformation is associated with the formation of a graben, which is bordered by graben parallel faults that might express as sets of fractures at the surface. Additionally, secondary structures, such as push-ups, bends and step overs, yield information about the deforming domain. However, once these structures are formed during fissure eruptions, they are rarely preserved in nature, due to the effects of rapid erosion, sediment coverage or overprinting by other faulting events. Therefore, simple normal fault displacements are commonly assumed at dikes. At the 2014/2015 Holuhraun eruption sites (Iceland), increasing evidence suggests that developing fractures exhibited variations in their displacement modes. In an attempt to investigate these variations, a fieldwork mapping project combining Terrestrial Laser Scanning (TLS) and Unmanned Aerial Vehicle (UAV)-based aerophoto analysis was undertaken. Using these data, we generated local high-resolution Digital Elevation Models (DEMs) and a structural map that facilitated the identification of kinematic indicators and the assessment of the observed structures. We identified 315 fracture segments from these satellite data. We measured the strike directions of single segments, including the amount of opening and opening angles, which indicate that many of the measured fractures show transtensional dislocations. Of these, ~81% exhibit a significant left-lateral component and only ~17% exhibit a right-lateral component. Here, we demonstrate that the local complexities in these fracture traces and geometries are closely related to variations in their transtensional opening directions. Moreover, we identified local changes in fracture azimuths and offsets close to eruption sites, which we speculate are associated with geometric changes in the magma feeder itself. The results highlight that the opening of fractures associated with an erupting fissure may record transtensional modes with both, left-lateral and right-lateral components. These results further highlight the value of using UAV-based high-resolution data to contribute to the integrity of the observations of the structural complexities produced by local geologic events.
Introduction
Dike intrusions and fissure eruptions are associated with elastic and inelastic deformation at the surface. While the effects of elastic deformation can be identified from a distance using remote sensing techniques (Dzurisin et al., 1984), the effects of inelastic deformation appear locally, may exhibit complexities at smaller scales and may be rapidly obscured by weathering; consequently, they have been less thoroughly investigated. Commonly observed is the formation of a graben, i.e., a depression bordered by inward-dipping normal faults that may be expressed as a series of complex fractures at the surface. However, reverse slip has also been reported (Gudmundsson and Loetveit, 2005) and reproduced in analog models (Gudmundsson et al., 2008; Trippanera et al., 2015a). Faults associated with dike intrusions and rifted margins may develop in both oblique and normal spreading conditions. However, there is still debate about the vertical propagation direction of faults (Opheim and Gudmundsson, 1989; Gudmundsson, 1992; Grant and Kattenhorn, 2004; Trippanera et al., 2015b), thus demonstrating the need for detailed structural analysis in extensional regions.
The results of previous detailed studies performed at volcanoes indicate that extensional structures may exhibit high complexity (Peacock and Parfitt, 2002). The active rift in Iceland provides very recent examples of structures associated with intrusion-related faulting in an extensional regime that may accommodate significant strike-slip movement, as was recently evidenced by divergence that was oblique with respect to the direction of the underlying dike (Ruch et al., 2016). To better understand the development of extensional faulting structures, here, we study the geomorphology and structural geology of the 2014/2015 Holuhraun eruption site, which is the site of the most recent rifting episode in Iceland. By analyzing Terrestrial Laser Scanning (TLS) derived Digital Elevation Models (DEMs), together with Unmanned Aerial Vehicle (UAV) based high resolution aerophoto mosaics, we were able to identify local structures, such as step overs, push-ups and en echelon arrays, that confirm a component of strike-slip motion. We show that the strike-slip component is locally highly heterogeneous and that the reactivation of preexisting structures, topography and heterogeneities have played important roles in developing the observed complexity of the structural arrangement.
The area studied here is a part of the Bardarbunga volcanic system, which is located in the extensional Eastern Volcanic Zone (EVZ in Figure 1A), a tensional tectonic environment in central Iceland (Sigmundsson, 2006). The Bardarbunga system consists of a central volcano and large fissure swarms (extending 55 km toward the NNE and 115 km toward the SE). The central volcano (Figure 1B) is located under the northwestern sector of Vatnajökull glacier, from which a magma-filled crack propagated to the northeast in August–September 2014 to feed the 2014/2015 Holuhraun eruption (Sigmundsson et al., 2015). The dike intrusion preceding the eruption was connected to the Bardarbunga caldera; this intrusion was exceptionally well monitored by multinational research projects and was instrumentally recorded using scientific infrastructure (http://futurevolc.vedur.is/).
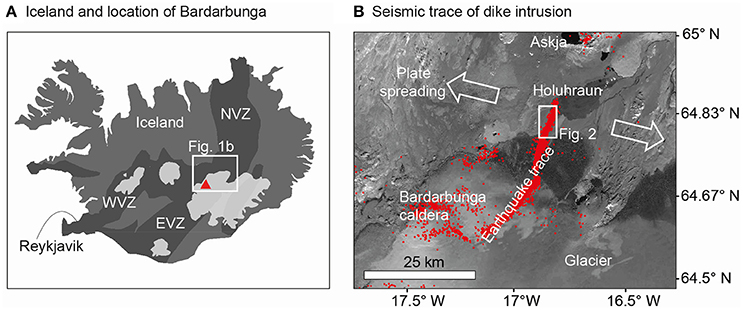
Figure 1. Study area–(A) Iceland and locations of the volcanic zones, namely, the Northern Volcanic Zone (NVZ), Western Volcanic Zone (WVZ) and Eastern Volcanic Zone (EVZ). The red triangle depicts the location of the Bardarbunga central volcano, under Vatnajökull glacier (glaciers are light gray). (B) Northern sector of Vatnajökull glacier within the Bardarbunga caldera. Red dots depict earthquake locations (Icelandic Meteorological Office) recorded over a time span of 3 weeks, indicating the path of the intruding dike. The 2014/2015 Holuhraun eruption occurred at its northern end and produced lava flows covering 86 km2 (dark gray areas). Background image: WorldView-2, September 2015. The white box outlines the region shown in Figure 2D.
The Holuhraun eruption, which lasted for 6 months (August 2014–February 2015), involved the mobilization of ~1.9 ± 0.3 km3 of magma (Gudmundsson et al., 2016). Petrologic data and seismic records obtained by the Icelandic Meteorological Office (Figure 1B) suggest that the ascent of magma beneath the Bardarbunga central volcano was followed by the lateral transport of magma through the upper crust over a distance of ~45 km to the Holuhraun eruption site (Sigmundsson et al., 2015; Geiger et al., 2016). Based on the analysis of seismic data, this lateral magma propagation was associated with normal faulting, as well as strike-slip faulting at variable depths (Agustsdottir et al., 2016). Seismic records reflect the presence of dominantly left-lateral slip components, as well as some right-lateral slip components (Agustsdottir et al., 2016); a relatively high number of right-lateral seismic events occurred close to the Holuhraun eruption site in the north, at depths of 5–8 km. Geodetic and field surveys revealed that dominantly left-lateral slip and only minor right-lateral slip occurred prior to the onset of the main eruption on 29th August 2014 (Ruch et al., 2016). These differences might be associated with the depths and resolutions by which the used methods are constrained.
The eruptive vents of the 2014/2015 Holuhraun eruption can be grouped, based on their locations and eruptive characteristics, into three distinct clusters, namely, (i) the main Holuhraun eruption site, which reactivated the 1797/98 crater row and was active for over 6 months; (ii) a row of small craters that formed to the east of the main fissure; and (iii) the 5th September 2014 eruption site, which formed 2.5 km to the south of the main fissure along a series of en echelon segments and was active for only 2 days. Satellite radar data allowed the survey of these structures at a resolution of better than 10 m (Floricioiu et al., 2015; Rossi et al., 2016); these data revealed details about the crater row and the eruptive fissure. Compared to the crater row of the previous eruption in 1797/98, its final shape is composed of only four major vents along the main fissure, the highest of which (Baugur crater, Figure 2D) reached a height of ~100 meters. Photographic analysis revealed that the orientation of the newly formed craters resembles that of the old crater row of the 1797/98 eruption (Hjartardottir et al., 2016).
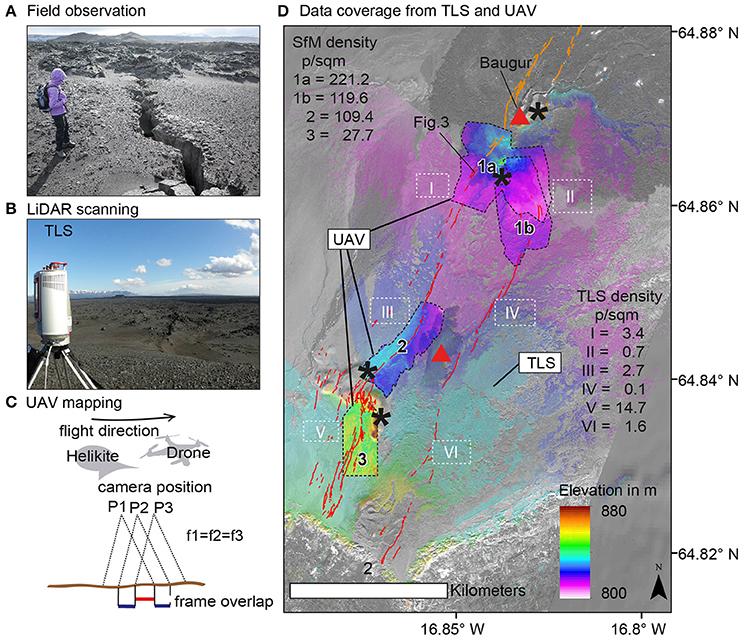
Figure 2. Methods–(A) Field observations in August 2015. (B) LiDAR scanning was performed using a TLS device, a Riegl VZ-6000 instrument, with a scanning distance of up to 6 km. (C) Sketch of UAV data acquisition. We used either a balloon kite or drones, equipped with cameras, moving in loops over the ground and constantly acquiring photos. (D) Data coverage of the used acquisition techniques. The colored point cloud in the background shows the topographic data set acquired by TLS, with black stars depicting single scan positions spanning an area of almost 20 km2. Colored point clouds with higher intensities are areas where UAV imaging data were acquired. Point densities (in points per square meter) are indicated. Red lines indicate fractures observed from our data. Orange lines indicate fractures buried by lava as observed by Hjartardottir et al. (2016).
The high-resolution structural analysis of the 2014/15 Holuhraun eruption site should yield a better understanding of the structures that resulted from the lateral propagation of a dike through crust that was previously affected by earlier faulting and oblique rifting processes (Ruch et al., 2016). To accomplish this, we mapped and analyzed the 2014/15 Holuhraun eruption site. Here, we identify the locations of 315 fractures and trace their extend. At the northern tip of the dike, the displacements of fractures are quantified and their orientations and relationships to the general rifting direction are analyzed. This local analysis is then placed into the context of the 2014/15 Holuhraun rifting episode and compared to other sites exhibiting similar structural complexities.
Data and Methods
We used satellite data to obtain an overview of the 2014/15 Holuhraun eruption site both before and after the eruption, which occurred between 29th August 2014 and 27th February 2015. To investigate further details about the fractures identified in this area, we acquired high-resolution TLS data and aerial photographs using cameras mounted on UAVs during a field campaign in August 2015, 6 months after the end of the eruption.
Satellite Data
The structural overview presented here is based on the analysis of satellite imagery and the results of the TanDEM-X satellite mission (Floricioiu et al., 2015; Rossi et al., 2016). For further details on the TanDEM-X data, we refer to those publications. The presented elevation change is based on the differences between the pre-eruptive and co-eruptive DEMs, which were acquired on 21st November 2011 and 9th September 2014, respectively. In addition, we used the available WorldView-2 data, which were acquired on 12th July 2014 (immediately prior to the onset of the seismic crisis) and 25th September 2015 (6 months after the termination of the eruption), with off-nadir angles of 12.4 and 26.8°, respectively. These data are panchromatic and have a spatial resolution of ~0.6 m.
Close Range Aerial Photographs from UAV
The use of UAVs facilitates the acquisition of high-resolution photo data, which represent much higher resolution data than the morphological and structural data obtained by recent satellite systems (Amici et al., 2013; Mancini et al., 2013; Nakano et al., 2014). Commonly used UAVs include multicopters, kites and balloons (Carrivick et al., 2016), which allow for especially wide applications in the fields of photogrammetry and remote sensing if equipped with cameras or other sensors. The use of optical cameras carried by UAVs over certain terrains permits the application of modern computer vision approaches; here, they allow for the derivation of digital terrain models at unprecedented levels of detail (James and Varley, 2012).
We mounted lightweight cameras on two quadcopter drones and a helium-filled balloon-kite (Figure 2C) flying at a height of 100–150 m. This combination of UAVs was selected because it allowed us to efficiently record images on both calm and windy days. We acquired all data presented here on 2 days (14th and 15th August 2015). The UAVs used were Phantom 2 quadcopters from DJI, which were equipped with 12 Megapixel GoPro Hero 3+ cameras and H3-3D gimbals (camera suspension system) to avoid shaking. The cameras typical fish-eye distortion was significantly reduced by replacing the original lens (a 170° wide-angle lens) with an OST 10 mp 5.4 mm IR CUT Replacement Lens with a 60° objective. The helikite used here (by Allsopp Helikites Limited, UK) is a helium-filled balloon-kite that is attached via a Dyneema line to a field scientist walking along a desired path on the ground. A helium volume of 2 m3 carried our modified GoPro cameras and allowed them to remain stable in wind speeds of up to 35 km/h. The cameras were placed in time-lapse mode. The drone-based cameras, flying at a speed of 5 m/s, used a setting of 1 fps (frame per second) whereas the cameras on the helikite, which traveled at a walking speed of <1 m/s, used a setting of 0.2 fps. In total, we acquired over 7,000 images of the Holuhraun eruption site and its associated graben structure.
We first visually inspected the images and deleted those that were out of focus or otherwise of low quality. The remaining images were grouped into chunks of distinct regions and were then photogrammetrically processed using the Structure from Motion (SfM) approach (Westoby et al., 2012; Carrivick et al., 2016). The SfM technique, which is able to reproduce high-resolution 3D surfaces from 2D photographs, was applied using the Agisoft PhotoScan Professional commercial software package (version 1.2.6). The ideal conditions of data acquisition are a constant focal length during the overflight, perpendicular target acquisition geometry, sufficient overlap in the images (which was ~80% on average in our study), and the measurement of Ground Control Points (GCPs) for georeferencing purposes. The processing of these images is based on the identification of corresponding pixels in different images and consists of three steps, namely, (i) image alignment, (ii) dense cloud construction and (iii) surface generation. This process yields a dense cloud of points defining the most likely positions for corresponding points in a 3D space, as well as geolocated photo mosaics and DEMs. Following this rationale, we focused on the following four regions: the western and eastern graben faults close to the vent region (areas 1a and 1b), a bent segment of the western fault system at the 5th September eruption site (area 2) and the southern part of the western fault system, which is located near a pronounced hill (area 3). These locations are detailed in Figure 2D.
Laser Scanning
Terrestrial Laser Scanning (TLS) is based on the principles of LiDAR (Light Detection and Ranging), which measures the time delay between emitted laser pulses and their echo receptions (Fornaciai et al., 2010; Richter et al., 2016). We used a Riegl VZ-6000 scanner (Figure 2B), which features a rotating head scanner with a horizontal field of view of 360° and a vertical field of view of −30 to 30°. It operates using near-infrared wavelengths, with a pulse rate between 30 and 300 kHz. The scanner is equipped with an internal GPS antenna, an internal leveling device and an optical camera. The Riegl VZ-6000 has a maximum range of 6 km and an angle measurement resolution of 0.0005°. Although the range of 6 km theoretically covers most of the area of interest between the eruption site and the glacier, we selected different viewing points and merged their data in order to increase the density of scans in the far field and reduce shadowing problems. Scans were acquired from four different scan positions (Figure 2D) that exhibited some overlap; they were then merged using point cloud matching techniques. To geocode the TLS scans, we used reflectors (recognized in the scans) that were placed around the scanning position and measured using differential GPS. Each TLS scan thus yielded a point cloud containing tens of millions of data points. The data processing of each scan was performed using Riegl RiSCAN Pro 2.0.2 (http://www.riegl.com), which is a commercial software designed to process TLS point cloud data.
Point Cloud Density and Referencing
As graphically illustrated in Figure 2D, from the UAV data, we were able to derive 237 M points for area 1a (221 points/m2), 82 M points for area 1b (119 points/m2), 55 M points for area 2 (109 points/m2) and 11 M points for area 3 (27 points/m2). The obtained resolutions range from 0.067 to 0.19 m (Table 1). Thus, the resolutions of drone based photos are ~3–8 times higher than those of the WorldView-2 satellite-derived optical data (Figure 3). The drone-based DEMs have resolutions that are 60 to 180 times higher than the already high 12 m resolution derived from the TanDEM-X mission.
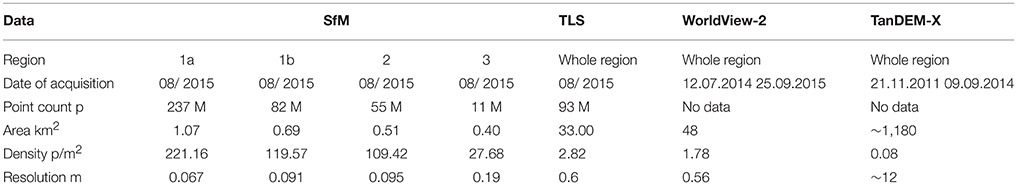
Table 1. Data comparison for different areas using the methods described in the text.
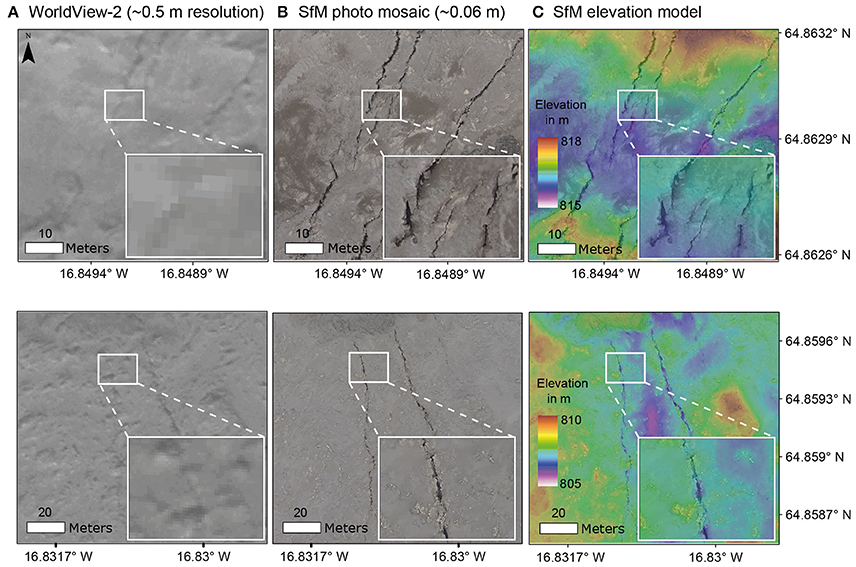
Figure 3. Resolution–(A) WorldView-2 panchromatic data with a spatial resolution of ~0.6 m, (B) UAV-based SfM photo mosaic with a resolution of 0.067 m, and (C) UAV-based photo mosaic draped over the DEM obtained from SfM. Locations are inside areas a1 and a2 in Figure 4B. The upper row (area a1) shows the fracturing close to the 2014 Holuhraun eruption site at the western graben fault; the lower row (area a2) shows the fracturing at the eastern graben fault.
The dense point clouds obtained from UAV data processing were georeferenced based on the TLS data. This was achieved in two steps: first, rough tie-point matching was performed; second, the Multi-Station Adjustment module, as implemented in the RiSCAN Pro 2.0.2 software package, was applied. The Multi-Station Adjustment tool calculates the best fit of the coarsely aligned SfM point cloud to the reference point cloud (which, in our case, represents the TLS data) by rotating, translating and scaling the data. In this way, we minimized the spatial offset between the point clouds. Using the highly consistent TLS data with millions of possible GCPs for the registration of our SfM point clouds made the additional measurement of GCPs in the field redundant. Therefore, the procedure of referencing one point cloud against another reference point cloud is similar to that described in Richter et al. (2016). This technique was beneficial, as placing GCPs on sharp fresh lava flow surfaces is difficult. After meshing the dense clouds, we produced mosaics and DEMs from these data.
The data collected from satellite images, UAV photographs and TLS produced a very high-resolution topography database, slope maps and aerophoto mosaics that allowed us to perform structural mapping and directly measure displacements at fracture traces (Figure 4). The mosaic was first visually analyzed in order to locate compressional or restraining structures. Then, the horizontal displacements in the photo mosaic were measured. We identified locations where fault traces were clearly detectable and displacements could be quantified. By linking several cohesive points on either side of the fractures using polylines (providing start and end coordinates) in ArcGIS, we were able to determine the amount and directions of opening (heave). Comparing these data to the azimuths of the respective fracture segments allowed us to assess whether their horizontal slip was right-lateral or left-lateral. Vertical displacements (throw), in turn, were assessed using our high-resolution DEMs, based on profiles that were normal to the observed fractures. The strike directions and lengths of fractures were obtained in a similar manner and were then sampled at intervals of 5 m.
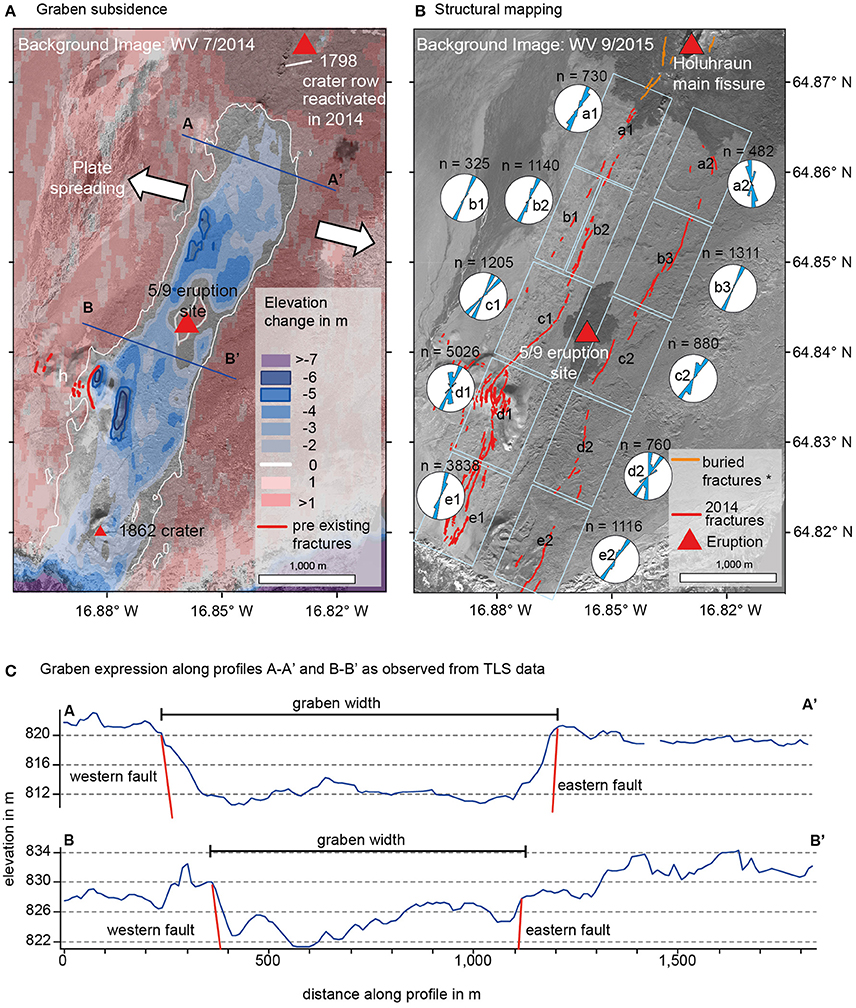
Figure 4. Graben subsidence and structural mapping of (A) uplift (in red) and graben subsidence (in blue) based on a comparison of TanDEM-X data from November 2011 and September 2014. The background image is a WorldView-2 image acquired prior to the eruption in July 2014. Note that the location of the old crater row in the north corresponds exactly to the site of the 2014 Holuhraun fissure. The red lines indicate fractures that were identified using pre-eruptive WorldView-2 data. The average plate spreading direction (104° azimuth) is indicated by white arrows. (B) Structure lineament mapping results and associated strike directions of fractures, grouped (light blue boxes) along both boundary faults on either side of the graben. The red lines indicate the newly formed fractures, as observed from WorldView-2 post-eruptive data (acquired in September 2015), and orange lines indicate the pre-eruptive fractures observed by Hjartardottir et al. (2016). Note the hourglass-like fracture convergence at the 5th September eruption site and the fracture convergence toward the 2014 Holuhraun main eruptive site in the north. The strike directions of the fracture groups are shown by rose plots in 10 degree classes, weighted by fracture length, where n corresponds to the accumulated fracture segment length for this fracture group in m. (C) Graben profiles drawn normal to the graben along A–A′ and B–B′ display variations in graben width and shape. While the graben has a symmetric shape in the northern profile, it comprises a tilted block or half graben formation in the southern profiles, thus confirming that reactivation and higher deformation have occurred on the western fault.
Data Limitations
The densities of TLS point clouds strongly depend on the distance to the scanning system and the chosen scan frequency. We observed a density of 2,000 points per m2 in the near-field region of our scans but a density of only 0.1 points per m2 at the maximum distance of our scans. This difference may become an issue when attempting to automatically align different scans. In particular, because the density in overlapping areas (e.g., in the area of the 5th September eruption site) was very low, it was difficult to accurately align the different scans in these regions.
Structure from Motion (SfM) data must be acquired using proper acquisition geometries. Changing acquisition geometries may introduce perspective effects to the data, as was identified in region 3 (Figure 2D). Therefore, region 3 is not assessed further in the fracture displacement analysis. In general, the fact that SfM point clouds tend to bend at their edges must be taken into consideration. Nevertheless, in the central regions of the SfM point clouds, the accuracy is usually on the order of a few cm. The flight height of 100–150 m used for acquisition here is appropriate for covering large areas but limits the resolution and, thus, the accuracy of 3D model reconstruction. This limited resolution may become an issue when analyzing vertical objects, such as fracture traces. Therefore, our data allow us to only partly measure displacements in 3D.
Results
First, we provide a structural overview of the region; then, we detail its structural geology.
The WorldView-2 satellite imagery, as well as the elevation changes calculated from the data of the TanDEM-X satellite mission, reveal the clear structural boundaries of a graben system (Figure 4A). Comparing the WorldView-2 data set collected in 2014 (immediately prior to the onset of the seismic swarms preceding the Holuhraun eruption) to those collected in 2015 (6 months after the termination of the eruption) allows us to identify major fractures and distinguish between preexisting fractures and those that developed during the intrusion in 2014. On either side of the graben, graben bounding faults are expressed as single or multiple sub-parallel fractures. More fracture segments (260) were identified on the western graben fault (Figure 4B) than on the eastern fault (55). Here, single fractures have rather large throws (on the order of m) compared to those of multiple fracture arrangements. In the case of two parallel fractures, the throw at the fracture trace is usually small (<0.2 m), but the central regions of the blocks located in between these fractures exhibit bending and sagging. A dominant preexisting fault is located on a hill that is made of pillow lava rising above the Holuhraun lava field at the western graben fault (hill h in Figure 4A). At this location, steep scarps can be observed in the images (red lines in Figure 4A) obtained prior to the 2014 dike intrusion. These scarps deepened during the 2014 intrusion.
A comparison of the image quality and resolution of the WorldView-2 satellite data and the UAV data shows that the traces of major fractures can generally be identified in the WorldView-2 satellite data, whereas small-scale fractures with widths that are below 0.5 m cannot easily be identified. The UAV images allow us to not only identify more and smaller fractures (Figure 3) but also to measure the displacements and complexities of these fractures, as well as the morphologies associated with them. The UAV results are discussed in the following sections.
Topographic Expression
Changes in elevation observed in the near-field regions of the dike range from +1.5 m uplift outside the graben (Figure 4A) to −4 m slip for central parts of the graben, which locally even exceed −5 m, for instance north of the 5th September 2014 eruption site (red triangle in Figure 4A) and at the fractured hill in the southwest (h in Figure 4A). Generally, elevation changes appear to be concentrated on the western side of the graben, where slightly higher uplift and slip values are recorded. In contrast, the uplift outside the graben remains almost constant at 1–1.5 m in the near-field region of the graben, where variations in graben slip were observed from south to north along the graben. We note that due to the local scale analyzed in this study, a decrease in uplift with distance to the graben (cf. Sigmundsson et al., 2015) is not seen in Figure 4A. In terms of the dislocation recorded at the graben faults, which starts at −4 m at the edge of the glacier (S), the graben slip decreases to −3 m at the location of the 1862 crater (southern red triangle in Figure 4A). At the intersection with hill h (Figure 4A), the graben slip reaches an average value of 4.5 m and increases to the north of the 5th September eruption site, where the maximum slip values occur. Closer to the main eruption site, the graben slip decreases and finally reaches −1 to −2 m close to the main eruption site (N). Hence, the displacements of the graben faults decrease as the faults approach the main eruption site. At the second and smaller eruption site (5/9 eruption site in Figure 4B), the topographic changes are rather large.
On a local scale, the topographic expressions associated with the graben faults comprise restraining and releasing bends and push-up structures (Figure 5). In general, the UAV-based topographic data confirm that in the north, the topographic throw at the graben faults is relatively small and is generally below 1 m (Figures 5B,C). In turn, clear topographic steps are found in regions that are closer to the 5th September eruption site (Figure 5E). Interestingly, the widespread appearance of very local push-up structures occurs at sites where changes in azimuth can be identified (Figure 5D).
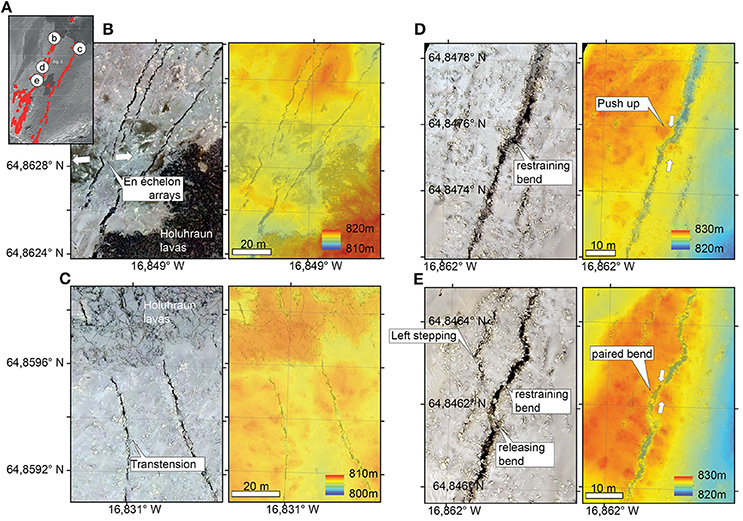
Figure 5. Local structural examples–(A) Fracture overview map together with close-up view locations as shown in insets b-e (SfM photo mosaic and SfM DEM model). Red triangles show the 2014 Holuhraun and 5 September 2014 eruption sites. (B) Photo mosaic showing en echelon arrays of surface fractures commonly associated with strike-slip kinematics. The DEM shows no dominant vertical throw and the observed fractures mainly opened horizontally. (C) Curved fractures directed to the NNW and partly covered by lavas. Field data and aerophotos suggest a transtensional type of fracturing. (D) Local restraining bends lead to push-up structures that are visible in photo mosaic and DEM. (E) Local bending fracture traces lead to releasing bends and restraining bends as topographic complexities.
The topographic expression of the graben therefore varies on a larger scale (decreasing closer to the main Holuhraun eruption site) and on a local scale (at restraining bends). In summary, the analysis of topographic expressions reveals that the sections of the western graben fault display larger changes in elevation, which may mean that the reactivation of preexisting structures occurred on the western graben fault in a similar manner as that described above for the fractured hill (area 3).
Fractures and Their Azimuths
Comparing the WorldView-2 data (obtained before and after the eruption) to the SfM data reveals that the emergence of intrusion-related fractures occurred in 2014 (red lines in Figure 4B). Manually tracing these fractures clearly depicts the outline of the graben. These fractures are concentrated in the southwestern region of the study area. Here, we distinguish 260 fractures on the western side of the graben and 55 fractures on the eastern side of the graben. The total fracture segment lengths are 13.3 km on the western side of the graben and 4.6 km on the eastern side of the graben.
The fractures of the graben system have an average strike direction of N20°. Changes in azimuth were mainly observed (i) where fractures intersect with local topography on the western side of the graben, (ii) in the southern region of the eastern graben fault and iii) close to the Holuhraun main eruption site, where fractures on the western side of the graben are directed to the NE and fractures on eastern side are directed to the N or even NW. On the western side of the graben, the mean deviation from the general trend of the fractures toward the eruptive fissure is +12° (positive direction is clockwise); therefore, the fractures are rotated compared to the fracture segments located further south. On the eastern side, the trend of the fractures is rotated in an anticlockwise direction up to −60°. This creates an hourglass pattern, with varying strike directions on either side of the graben (Figure 4B). Because the center axis of the graben has a mean strike of N23°, the fractures identified in 2014 slightly deviate from that trend, as they record an average strike direction of N20°.
Additionally, although the 5th September 2014 eruption site is located in the center of a 600 m wide graben, the fissure of the Holuhraun main eruption site is located in the center of a narrower graben (260–400 m) that is only collinear with the western graben fault. Therefore, the fractures of the western graben fault maintain a nearly constant azimuth (box a1 in Figure 4B), while fractures of the eastern graben fault display a counterclockwise curvature of up to −60°, with an azimuth that points directly toward the main eruptive fissure (box a2 in Figure 4B), thus again resembling an hourglass pattern close to the eruption site. The same trend can also be observed at the smaller eruption cones that are located at the intersection of a bent segment of the eastern fault and the fractures that are parallel to the main fissure (secondary fissure in Figure 6A).
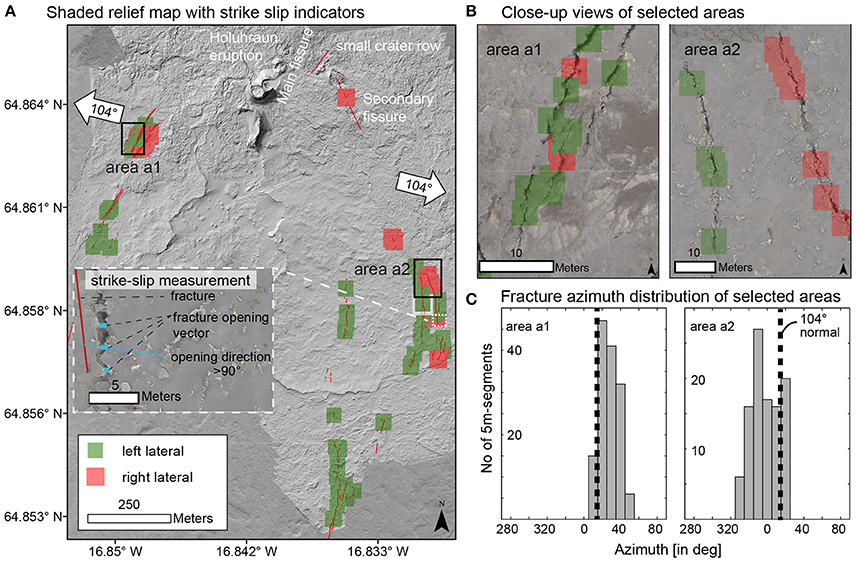
Figure 6. Assessment of strike-slip components–(A) Strike-slip components measured at 143 positions, indicated by red and green boxes in areas a1 and a2 (Figure 4B), showing the dominance of left-lateral motion (green boxes). Right-lateral slip (red boxes) and tensile opening components (no color at fracture) can also be observed. Systematic analysis reveals the consistency of kinematics along distinct fracture traces as well as local complexities, such as opposite motions at adjacent fracture traces. The inset indicates how strike-slip was determined. (B) Close-up views of selected areas a1 and a2. Note that although both left-lateral and right-lateral components can be observed in our data close to this eruption site, the left-lateral transtensional mode is clearly dominant. (C) Histogram analysis and comparison of the strike directions of the two areas against the rift-normal direction; a uniform rifting of 104° is assumed.
Comparing the mean fracture azimuth (N20°), the mean rift axis (N25°) and the mean rifting direction (N104°) reveals that fracture patterns are not simply parallel to the rift axis, but are instead rotated with respect to the expected rifting trend. Fracture trends that are not simply perpendicular to the stretching vector have previously been identified as being typical products of oblique rifting in brittle-ductile systems (Tron and Brun, 1991); a similar conceptual model may thus apply here.
Horizontal Fracture Offsets and Strike-Slip Component
The obtained photo mosaics allow us to study the modes of opening in more detail by using structural geologic and kinematic criteria. In total, we identify 143 sites at areas 1a and 1b (Figure 2D) where we could differentiate between faults with right-lateral and opening, left-lateral and opening and faults with purely extensional components (Figure 6). In transtensional regions located close to the main eruption site, 81% of faults contain left-lateral components, 17% contain right-lateral components, and 2% do not exhibit clear strike-slip components. These results are in agreement with those of independent studies (Agustsdottir et al., 2016), as they reflect the presence of both left-lateral and right-lateral transtensional components at the surface, which Agustsdottir et al. (2016) observed at depth.
The spatial distribution of the identified transtensional fractures is not uniform. For instance, fractures located to the S and SE of the Holuhraun eruption site and near the lavas exhibit dominantly right-lateral and opening components (Figure 6B, area a2). Fractures located ~2 km to the south of the Baugur crater, in turn, exhibit dominantly left-lateral and opening modes (Figure 6A). Fractures located within the western graben show similar patterns, exhibiting right-lateral and left-lateral motions; however, they become dominantly left-lateral with increasing distance to the eruption site (Figure 6B, area a1). We find that surface fracture kinematics are strongly site-specific and that their correct identification depends on determining from which fracture branch of a specific graben segment the data were acquired.
Approximately 68% of the identified faults that have a right-lateral component strike to the NW. Only 16% of the faults that have left-lateral components strike to the NW, while most strike to the NE. This difference implies that strike-slip motion may be related to the average strike direction of its respective fracture segment. Using UAV photographs, we were able to determine the amount of opening occurring at tensional fractures, as well as the amount of strike-slip occurring at transtensional fractures. Measurements collected along profiles close to the 2014/15 eruption site indicate that the cumulative fracture opening measured throughout the entire graben is 3.8 m and that its cumulative strike-slip motion is ~0.4 m.
Discussion
The 2014/15 Holuhraun eruption was associated with a dike intrusion in a segment of a rift zone located between the central volcanoes of Askja and Bardabunga. This eruption caused extensive surface rupturing, with an average azimuth that is rotated with respect to the mean rifting direction of N104°E (Figure 6C). Details of these surface ruptures were investigated using satellite imagery, TLS and drone-based close-range photogrammetry, which revealed a locally complex pattern of surface fractures and delimited the extent of the graben above the inferred eruption feeder dike. We observed a non-uniform spatial distribution of strike-slip and opening mode components, as well as the presence of both left-lateral and right-lateral fault components, among which the former is dominant. Therefore, these results agree with those of seismic (Agustsdottir et al., 2016), geodetic and structural field studies (Ruch et al., 2016). Preexisting topography, earlier fault locations and the locations of eruption sites close to that of an eruption in 1797/98 produced highly variable transtensional displacement with primarily left-lateral strike-slip indicators. Before discussing the implications of this work and its relationship to those of independent studies further, we provide details about the limitations of the methods used here, the collected data and their analytical techniques in the following sections.
Limitations
Based on the analysis of these data, we identified a number of limitations that are further discussed here. The fractures identified using the WorldView-2 data are rather large, as the highest resolution of these data is ~0.6 m. In contrast, the drone-based data yield centimeter-scale resolutions but are limited in that they could not be used to map the entire area to the south of the 2014/2015 Holuhraun eruption site. We selected key areas close to the two eruption sites that were systematically overflown and where closer studies of the kinematics could also be performed. As a consequence, large parts of the graben fault systems were not imaged by our drone cameras. We solved this problem by combining the drone-based results with a TLS campaign in which the TLS instrument with a scan range of up to 6 km provided the reference data. By doing so, we were able to generate a topographic data set with a resolution of 10 m throughout the graben region and to obtain close-range drone-based mosaics and DEMs with resolutions ranging from 0.067 to 0.19 m at selected key areas. Nevertheless, the resolutions of the drone-based data are 8–180 times higher than those of the satellite-based mosaics and DEMs derived from the WorldView and Tandem-X data sets, respectively.
During our field observations, we walked in between fractures and realized that fine-grained, wind-blown sand often partially covered or obscured fractures. The analysis of additional photographs that we acquired from an airplane during the eruption reveals that even more fractures were initially present in this region (Figure 7). Specifically, small-scale fractures that are clearly traceable in aerial images from September 2014 appear only as isolated sinkholes and short fractures in UAV images from August 2015. Therefore, we reiterate that the timing of UAV mapping projects is crucial for obtaining complete structural analyses and that rapid UAV-based campaigns are needed immediately following eruptions. Therefore, although drone-based morphological and structural mapping is a highly efficient tool for the analysis of small areas, acquiring data directly after or even during an eruption could yield even better results and could be used to analyze temporal changes in the years following an eruption. However, these temporal changes, which are also associated with the cooling of magma bodies, were not the focus of our field campaign.
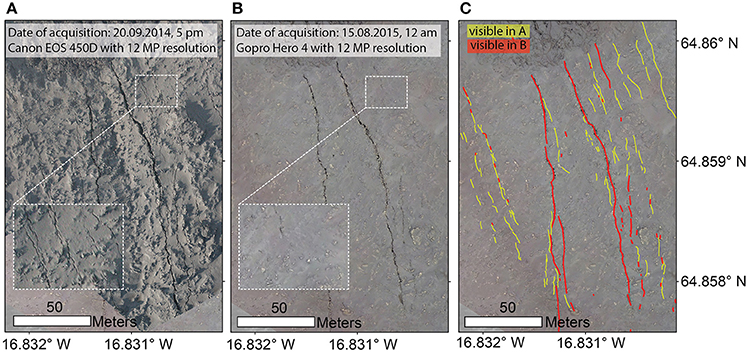
Figure 7. Example of limitations-(A) Close-range aerial image taken during the eruption in September 2014, showing multiple small-scale fractures near the two main larger fractures. Image taken using hand held digital SLR camera with 16 megapixels in the early morning hours. (B) UAV camera images used in this study show larger fractures in detail; however, small-scale fractures are hard to identify. Image taken using GoPro camera at noon. Differences between (A) and (B) are due to camera type, time of image acquisition, and time lag between fracture formation and image acquisition. (C) Lineament map of the two images illustrates differences. Especially in small-scale fractures, local sinkholes and disconnected fractures are predominant, while large parts of the fractures are obscured and hidden by fine-grained deposits (i.e., ash and sand).
Graben Expression and Vertical Throw
Due to the large dimensions, a good overview of the morphological expressions of the graben is given by satellite-based DEMs, such as those that were earlier presented (Floricioiu et al., 2015; Rossi et al., 2016) or in our study. Given the identified reactivation of preexisting faults (Ruch et al., 2016), we can only speculate about their offset prior to our measurement campaign. Reactivation has played an important role, as is evidenced by the fact that the eruption occurred at exactly the same site as an earlier eruption, as well as the fact that the largest fault offset occurred at exactly the same site as those of earlier faults at the hill in the south. The graben has an average strike of 23°, which coincident with the general strike directions of fissures in the Northern Volcanic Zone. In comparison to the mean spreading direction of N104°, the graben is non-normal to the tectonic trend expected for a pure rift opening. The subsidence area of the graben is clearly bounded by fracture sets on both of its sides; it also exhibits variable widths, ranging from <400 m to more than 1,000 m (Figure 4A). Starting in the south, with a width of 900 m, the subsidence area of the graben increases slightly toward the north, where it reaches a maximum width of 1,100 m at its intersection with a hill in the southwestern region. To the north of the hill, the subsidence area of the graben narrows and reaches a local minimum of ~600 m at the 5th September 2014 eruption site. Assuming that the dike location did not change substantially following the formation of the graben faults, this width change may suggest that the vertical flow of magma occurred from a dike at a depth of several hundreds of meters extending to the surface vents. Further north, between the two eruption sites, the width of the graben subsidence area increases again to more than 1,000 m. Next, moving toward the main fissure in the north, the fault systems bend and cause the graben to narrow to widths of 400 m or less. The narrowing of the graben near the eruption sites resembles an hourglass pattern and may be related to the changing geometry or depth of the magma feeder or the depth of the dike tip. The latter could strongly influence the geometry of the graben (Figure 8). A shallower dike segment would locally narrow the graben and would likely be associated with an increasing cumulative throw. However, while we do observe a narrowing in the width of the graben, we find that the fault throw is only ~1–2 m and is therefore relatively small close to the main eruption site (N). Further south, at the 5th September eruption site, we observe a different fault throw pattern, which increases to over 4.5 m and locally reaches 6 m. The vertical throw therefore ranges from 1 to 2 m in the northeastern region of the study area to ~6 m at the 5th September eruption site; we speculate that this reflects the complex deviation of the upper edge of the propagating dike. Finger-like magma paths originating from a deeper dike could potentially produce less surface deformation and fault throw than a continuous dike opening at a shallow depth would create (Figure 9). The presence of finger-like connections linking surface vents to a crustal dike was also recently suggested based on the analysis of tremor data (Eibl et al., 2017) collected near the Holuhraun eruption site.
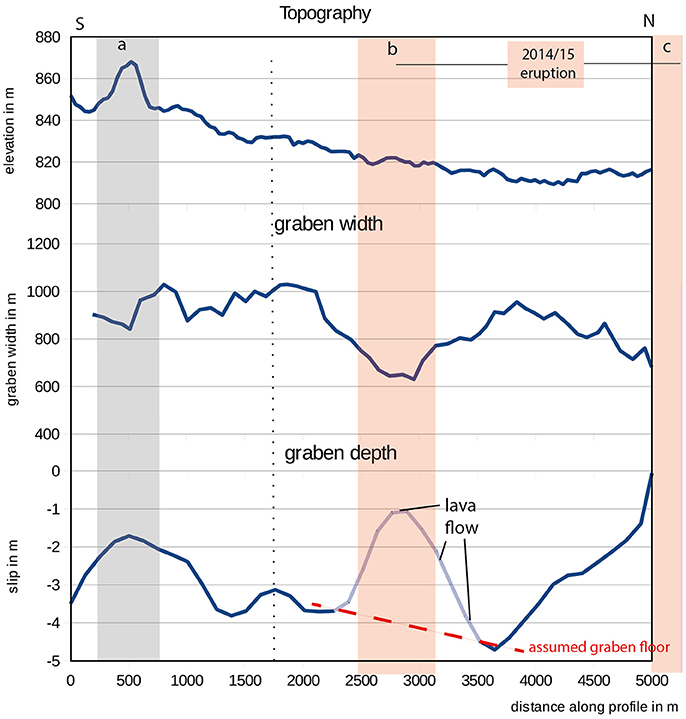
Figure 8. Comparison of topography and relevant graben parameters. The elevation profile was drawn in the center of the graben from south (edge of the glacier) to north (Holuhraun eruption site). Graben depth and width were measured along parallel profiles (at a distance of 100 m from each other), normal to the graben. Area a depicts the location of the 1862 crater, b depicts the location of the 5th September 2014 eruption site and c depicts the location of the Holuhraun main eruption site. The influence of the upward migrating dike segment at location b is clearly visible.
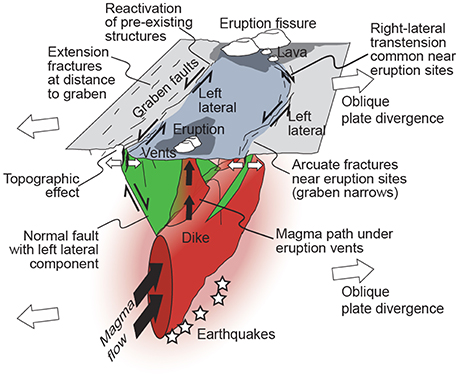
Figure 9. Sketch illustrating the structural relations at the Holuhraun eruption sites. Graben subsidence is identified above the feeder dike (red color), and delimited by graben faults (green color) and smaller fractures at distance (black lines). At the surface, the graben faults show transtensional dislocations with predominantly (>80%) left-lateral component, which is similarly identified in seismic focal mechanisms (white star symbology) during the dike intrusion at depth (Agustsdottir et al., 2016). Near the surface, the graben faults appear near vertical in dip, and show large slip and splays close to pre-existing topographic highs (“topographic effect”) and reactivation of other pre-existing structures and weak zones (e.g., associated with the 1797/98 vents in the north). The strike variation of graben faults show convergence toward eruption sites, yielding an arcuate expression, often associated with en-echelon arrays and step overs. This hourglass fracture convergence toward the eruption sites leads to fractures are rotated with respect to the plate divergence direction, so that they have a right-lateral component. Changes in the fault strike and formation of arcuate graben faults and an hourglass appearance close to the eruption sites are allegedly associated to a change in dike geometry at depth, either due to the presence of a locally shallower dike, or the establishment of a conduit-like magma path feeding the eruption vents, as suggested in Eibl et al. (2017).
Fracture Azimuth and Mode Changes
Changes in the azimuths and numbers of fractures have been demonstrated in regions where fractures interact and change their azimuthal directions toward topographic heights or volcanic edifices (Belousov et al., 2005; Kervyn et al., 2009). Fractures located closer to the Holuhraun eruption site display complex distributions of mixed modes, where the sinistral direction is generally dominant. As these complexities are observed close to the Holuhraun eruption site, the propagation and rise of magma could have led to the formation of one or more sets of fractures. During the further propagation of the feeder system or the drain back and cooling of the dike, fracture modes recording different senses of motion could have developed.
We identified that 81% of the faults in regions 1a/b contain a left-lateral component and that 17% contain a right-lateral component. These results are in agreement with the inferred seismic focal mechanisms of earthquake events during the dike intrusion identified in this region (Agustsdottir et al., 2016), of which 85% are left-lateral and 15% are right-lateral. However, our results are only locally representative, as we did not analyze all of the eastern and western fracture systems; additionally, in many cases, surface ruptures were too intense to allow for the identification of any distinct cohesive points on either side. However, the surface expressions of the fracture kinematics identified from our drone data match the seismic observations, despite the fact that the seismic data mainly represent the deeper proportions of the intruding dike whereas we can only measure the surface effects. This similarity suggests that the stress conditions and rupture processes at depth might be comparable to those observed at the surface.
In addition, we observed a change toward more right-lateral components in fractures located close to the main 2014/15 Holuhraun eruption site, which we explain by changing strike directions.
Although displacement components at the graben faults were identified using geodetic and structural field data (Sigmundsson et al., 2015; Ruch et al., 2016), as well as the results of seismic studies (Agustsdottir et al., 2016), some differences are evident. For example, while geodetic studies suggest that an oblique opening recording dominant left-lateral motion occurred throughout the study area, with only minor right-lateral events (Sigmundsson et al., 2015; Ruch et al., 2016), earlier seismic studies (Agustsdottir et al., 2016) suggested that this region records the presence of both left-lateral (85%) and right-lateral (15%) kinematics. Our results record both opening and dominantly left-lateral motions, as well as a locally increased right-lateral component. Therefore, the results of these three studies agree well with each other. The observed differences are likely related to the different depths from which these data were collected. While seismic data mainly originate at depths of 5 to 8 km, our observations and those of Ruch et al. (2016) are limited to the surface, where the horizontal component (lateral widening) also becomes relevant. Ruch et al. (2016) used these surface observations to constrain a dike dislocation model, thus indicating that the large fault throw at the surface is linked to the opening of a large dike at shallow levels. In our study, we also find that fault throw and fault width differ from those in their surrounding areas at the 5th September eruption site. Therefore, the interpretation that fault throw is larger closer to the eruption site may be biased by the larger dike width. Seismic tremors marked the arrival of the dike in the shallow crust, as was recently illustrated by Eibl et al. (2017).
GPS and direct point wise field measurements are advantageous because they produce high-precision, locally robust data. The SAR technique yields spatial measurements of hundreds of thousands of points with a pixel scale of several meters. Our study demonstrates the added value of using high-resolution near-field photogrammetry derived from UAV platforms with centimeter-scale resolutions, which can be used to identify local deformation structures. Ideally, a combination of these data is realized and obtaining consistent results is best, as is demonstrated by the comparison of our data to those of previous studies.
Geodetic data suggest a mean dike opening of 4.5 meters and a mean left-lateral component of 1 m, which compare well to the identified historical slip deficit values of 4 and 0.7 m, respectively (Sigmundsson et al., 2015; Ruch et al., 2016). Our results indicate a fracture opening of up to 3.8 m and recorded a strike-slip of ~0.4 m. The fracture opening and strike-slip kinematics identified in our data somewhat underestimate those estimated by the analysis of geodetic data, which may be due to the sedimentation and coverage of a number of surface fractures (see also Figure 7). Minor fractures may be lacking, which may explain the 20% difference between our results and those obtained from the analysis of satellite geodetic data.
However, the quantification of strike-slip values must be handled with care, as measurements obtained directly at the fracture trace are not very distinct and may even lead to misinterpretations. Underestimated values may be produced because we observe processes happening in very near-field regions, whereas satellite geodesy techniques, such as InSAR (e.g., Sigmundsson et al., 2015), observe mid- to far-field displacement. Techniques, such as pixel tracking allow faults in both the far field and the near field to be analyzed, as was shown for the Holuhraun eruption by Ruch et al. (2016). As the fault slip values given by Ruch et al. (2016) are comparable to those determined using the drone-based data we presented, their results and implications appear to be sound and valid. We note that our interpretations of only the brittle deformation component at the surface are simplistic, whereas the entire deformation regime encompasses more complex elastic-brittle-ductile behavior with different relevance at different depths. This depth-dependent complexity may also have contributed to the production of fractures during the eruption.
Nevertheless, our results are consistent with those of geodetic and historical investigations indicating that the amount of fracture opening is ~5–6 times larger than the amount of strike-slip motion. We note that our results suggest that the identification of the opening and strike-slip motion strongly depend on the location where measured and therefore close-range photogrammetric data can be applied to contribute to the analyses of local geologic processes.
Reactivation
The presence of preexisting fractures played a significant role during the 2014/2015 Holuhraun eruption, as was previously demonstrated by the analysis of satellite and airborne imaging data (Hjartardottir et al., 2016) and geodetic and field data (Ruch et al., 2016). The 2014 Holuhraun eruption occurred exactly where a major eruption occurred in the 1797; this older crater row is also visible in the satellite image taken before the 2014 eruption (Figure 4A). Earlier studies (Sigurdsson and Sparks, 1978) suggested that the so-called Holuhraun 1 or Kvislahraun lavas formed during an eruption originating in the Askja volcanic system. Later workers propose, based on the analysis of the geochemical composition of the lavas, that Holuhraun 1 is likely to have formed during two separate eruptions and are rather related to the Veidivötn volcanic system (Hartley and Thordarson, 2013). Structurally, as proposed by Hjartardottir et al. (2016), the inferred 2014/2015 dike plane is in line with these older lineaments. The old Holuhraun 1 crater row was made up of at least ten small vents that were covered by the 2014/2015 Holuhraun eruption. These old cones did not lie along a straight line, as our data and those of previous studies demonstrate (Ruch et al., 2016). Instead, the old crater row exhibits a segmented structural orientation. Therefore, the graben fault systems and eruption fissures could display a similar segmentation that might be predisposed to existing structural weaknesses.
Conclusions
The 2014/2015 Holuhraun eruption site exhibits complex topographic and structural surface expressions that were analyzed by combining satellite imagery, TLS and UAV-based close-range photogrammetry. We derived a high-resolution DEM and photo mosaic data set that allowed us to identify sites of fault reactivation and the delineation of structures that formed during this eruption and its preceding dike intrusion. We find that the azimuths of fractures vary locally and that the fracture sets record transtensional motion, with 81% of the fractures exhibiting a left-lateral component and 17% of the fractures exhibiting a right-lateral component. These results are in agreement with those of independent geophysical monitoring and modeling studies, which suggest that the surface fracture expression is in agreement with indirect constraints at depth. We find an hourglass-shaped narrowing of the expression of the surface fractures close to the eruption sites, which might be interpreted as the shallower upper edge of a feeding dike at a depth of several hundred meters. We also identify a larger fault throw closer to the 5th September eruption site, which might be associated with a larger dike opening. Moreover, this work demonstrates that the flexible use of UAV techniques, together with the use of other remote sensing methods, can be applied to study large areas. Additionally, this work demonstrates that the rapid implementation of campaigns can be used to obtain high-resolution imagery of the kinematics of volcano-tectonic events.
Author Contributions
DM collected the helikite data, performed the analysis on data and led the writing of the manuscript. TRW collected multicopter data and analyzed data, and coordinated writing of the manuscript. AS collected and processed TLS data. BS collected drone data. TW collected and processed the dGPS data. MG was involved in data interpretation and the writing of the manuscript. TD contributed by airborn photography and visual descriptions of the event.
Conflict of Interest Statement
The authors declare that the research was conducted in the absence of any commercial or financial relationships that could be construed as a potential conflict of interest.
Acknowledgments
This work contributed to and was partially supported by the FUTUREVOLC project. We especially thank IMO for releasing detailed monitoring information from the Holuhraun eruption. Financial support came from an expedition fund of the GFZ Potsdam. This is a contribution to VOLCAPSE, a research project funded by the European Research Council under the European Union's H2020 Programme/ERC consolidator grant ERC-CoG 646858. The TanDEM-X data analysis in this work is considered to be a contribution to the Helmholtz Alliance EDA. We thank Armann Höskuldsson for support during our field work. Moreover, we thank the DLR for providing the TanDEM-X data set that was used to derive a topographic base map of the region.
References
Agustsdottir, T., Woods, J., Greenfield, T., Green, R. G., White, R. S., Winder, T., et al. (2016). Strike-slip faulting during the 2014 Baroarbunga-Holuhraun dike intrusion, central Iceland. Geophys. Res. Lett. 43, 1495–1503. doi: 10.1002/2015GL067423
Amici, S., Turci, M., Giulietti, F., Giammanco, S., Buongiorno, M. F., La Spina, A., et al. (2013). Volcanic environments monitoring by drones mud volcano case study. Int. Arch. Photogramm. XL-1/W2, 5–10. doi: 10.5194/isprsarchives-XL-1-W2-5-2013
Belousov, A., Walter, T. R., and Troll, V. R. (2005). Large-scale failures on domes and stratocones situated on caldera ring faults: sand-box modeling of natural examples from Kamchatka, Russia. Bull. Volcanol. 67, 457–468. doi: 10.1007/s00445-004-0387-1
Carrivick, J. L., Smith, M. W., and Quincey, D. J. (2016). “Background to structure from motion,” in Structure from Motion in the Geosciences (Chichester: John Wiley & Sons, Ltd.). doi: 10.1002/9781118895818.ch3
Dzurisin, D., Koyanagi, R. Y., and English, T. T. (1984). Magma supply and storage at Kilauea volcano, Hawaii, 1956-1983. J. Volcanol. Geother. Res. 21, 177–206. doi: 10.1016/0377-027390022-2
Eibl, E. P. S., Bean, C. J., Jónsdóttir, I., Höskuldsson, A., Thordarson, T., Coppola, D., et al. (2017). Multiple coincident eruptive seismic tremor sources during the 2014-2015 eruption at Holuhraun, Iceland. J. Geophys. Res. Solid Earth 122, 2972–2987. doi: 10.1002/2016JB013892
Floricioiu, D., Jaber, W. A., Minet, C., Rossi, C., and Eineder, M. (2015). “Tandem-X for mass balance of glaciers and subglacial volcanic activities,” in 2015 IEEE International Geoscience and Remote Sensing Symposium (IGARSS) (Milan), 2903–2906. doi: 10.1109/IGARSS.2015.7326422
Fornaciai, A., Bisson, M., Landi, P., Mazzarini, F., and Pareschi, M. T. (2010). A LiDAR survey of Stromboli volcano (Italy): digital elevation model-based geomorphology and intensity analysis. Int. J. Remote Sens. 31, 3177–3194. doi: 10.1080/01431160903154416
Geiger, H., Mattsson, T., Deegan, F. M., Troll, V. R., Burchardt, S., Gudmundsson, O., et al. (2016). Magma plumbing for the 2014–2015 Holuhraun eruption. Iceland. Geochem. Geophys. Geosys. 17, 2953–2968. doi: 10.1002/2016GC006317
Grant, J. V., and Kattenhorn, S. A. (2004). Evolution of vertical faults at an extensional plate boundary, southwest Iceland. J. Struct. Geol. 26, 537–557. doi: 10.1016/j.jsg.2003.07.003
Gudmundsson, A. (1992). Formation and growth of normal faults at the divergent plate boundary in Iceland. Terra Nova 4, 464–471. doi: 10.1111/j.1365-3121.1992.tb00582.x
Gudmundsson, A., Friese, N., Galindo, I., and Phillipp, S. L. (2008). Dike-induced reverse faulting in a graben. Geology 36, 123–126. doi: 10.1130/G24185A.1
Gudmundsson, A., and Loetveit, I. F. (2005). Dyke emplacement in a layered and faulted rift zone. J. Volcanol. Geother. Res. 144, 311–327. doi: 10.1016/j.jvolgeores.2004.11.027
Gudmundsson, M. T., Jónsdóttir, K., Hooper, A., Holohan, E. P., Halldórsson, S. A., Ófeigsson, B. G., et al. (2016). Gradual caldera collapse at Bardarbunga volcano, Iceland, regulated by lateral magma outflow. Science 353:262. doi: 10.1126/science.aaf8988
Hartley, M. E., and Thordarson, T. (2013). The 1874-1876 volcano-tectonic episode at Askja, North Iceland: lateral flow revisited. Geochem. Geophys. Geosy 14, 2286–2309. doi: 10.1002/ggge.20151
Hjartardottir, A. R., Einarsson, P., Gudmundsson, M. T., and Hognadottir, T. (2016). Fracture movements and graben subsidence during the 2014 Bardarbunga dike intrusion in Iceland. J. Volcanol. Geother. Res. 310, 242–252. doi: 10.1016/j.jvolgeores.2015.12.002
James, M. R., and Varley, N. (2012). Identification of structural controls in an active lava dome with high resolution DEMs: volcán de Colima. Mexico. Geophys. Res. Lett. 39:L22303. doi: 10.1029/2012gl054245
Kervyn, M., Ernst, G. G. J., de Vries, B. V. W., Mathieu, L., and Jacobs, P. (2009). Volcano load control on dyke propagation and vent distribution: insights from analogue modeling. J. Geophys. Res. 114:B03401. doi: 10.1029/2008JB005653
Mancini, F., Dubbini, M., Gattelli, M., Stecchi, F., Fabbri, S., and Gabbianelli, G. (2013). Using Unmanned Aerial Vehicles (UAV) for high-resolution reconstruction of topography: the structure from motion approach on coastal environments. Remote Sens. Basel 5, 6880–6898. doi: 10.3390/rs5126880
Nakano, T., Kamiya, I., Tobita, M., Iwahashi, J., and Nakajima, H. (2014). “Landform monitoring in active volcano by UAV and SFM-MVS technique,” in ISPRS Technical Commission VIII Symposium (Hyderabad), 71–75. doi: 10.5194/isprsarchives-XL-8-71-2014
Opheim, J. A., and Gudmundsson, A. (1989). Formation and geometry of fractures and related volcanism of the Krafla fissure swarm. Northeast Iceland. Geol. Soc. Am. Bull. 101, 1608–1622. doi: 10.1130/0016-7606(1989)101<1608:FAGOFA>2.3.CO;2
Peacock, D. C. P., and Parfitt, E. A. (2002). Active relay ramps and normal fault propagation on Kilauea, Hawaii. J. Struct. Geol. 24, 729–742. doi: 10.1016/S0191-814100109-2
Richter, N., Favalli, M. E., de Zeeuw-van Dalfsen, E., Fornaciai, A., da Silva Fernandes, R. M., Perez, N. M., et al. (2016). Lava flow hazard at Fogo Volcano, Cabo Verde, before and after the 2014-2015 eruption. Nat. Hazard Earth Sys. 16, 1925–1951. doi: 10.5194/nhess-16-1925-2016
Rossi, C., Minet, C., Fritz, T., Eineder, M., and Bamler, R. (2016). Temporal monitoring of subglacial volcanoes with TanDEM-X-Application to the 2014–2015 eruption within the Bardarbunga volcanic system, Iceland. Remote Sens. Environ. 181, 186–197. doi: 10.1016/j.rse.2016.04.003
Ruch, J., Wang, T., Xu, W. B., Hensch, M., and Jonsson, S. (2016). Oblique rift opening revealed by reoccurring magma injection in central Iceland. Nat. Commun. 7:12352. doi: 10.1038/ncomms12352
Sigmundsson, F. (2006). Iceland Geodynamics: Crustal Deformation and Divergent Plate Tectonics. Berlin: Springer, 1–214.
Sigmundsson, F., Hooper, A., Hreinsdóttir, S., Vogfjörd, K. S., Ófeigsson, B. G., Heimisson, E. R., et al. (2015). Segmented lateral dyke growth in a rifting event at Bardarbunga volcanic system, Iceland. Nature 517, U191–U158. doi: 10.1038/nature14111
Sigurdsson, H., and Sparks, R. S. J. (1978). Rifting episode in north iceland in 1874–1875 and the eruptions of askja and sveinagja. Bull. Volcanol. 41, 149–167. doi: 10.1007/BF02597219
Trippanera, D., Ruch, J., Acocella, V., and Rivalta, E. (2015a). Experiments of dike-induced deformation: insights on the long-term evolution of divergent plate boundaries. J. Geophys. Res. 120, 6913–6942. doi: 10.1002/2014JB011850
Trippanera, D., Acocella, V., Ruch, J., and Abebe, B. (2015b). Fault and graben growth along active magmatic divergent plate boundaries in Iceland and Ethiopia. Tectonics 34, 2318–2348. doi: 10.1002/2015TC003991
Tron, V., and Brun, J. P. (1991). Experiments on oblique rifting in brittle-ductile systems. Tectonophysics 188, 71–84. doi: 10.1016/0040-195190315-J
Keywords: Holuhraun eruption Iceland, camera drone, oblique rifting, Structure from Motion, Terrestrial Laser Scanning, dike intrusion, volano deformation
Citation: Müller D, Walter TR, Schöpa A, Witt T, Steinke B, Gudmundsson MT and Dürig T (2017) High-Resolution Digital Elevation Modeling from TLS and UAV Campaign Reveals Structural Complexity at the 2014/2015 Holuhraun Eruption Site, Iceland. Front. Earth Sci. 5:59. doi: 10.3389/feart.2017.00059
Received: 14 February 2017; Accepted: 06 July 2017;
Published: 27 July 2017.
Edited by:
Adelina Geyer, Instituto de Ciencias de la Tierra Jaume Almera (CSIC), SpainReviewed by:
Joël Ruch, KAUST King Abdullah University of Science and Technology, Saudi ArabiaAlessandro Tibaldi, University of Milano-Bicocca, Italy
David Garcia Selles, University of Barcelona, Spain
Copyright © 2017 Müller, Walter, Schöpa, Witt, Steinke, Gudmundsson and Dürig. This is an open-access article distributed under the terms of the Creative Commons Attribution License (CC BY). The use, distribution or reproduction in other forums is permitted, provided the original author(s) or licensor are credited and that the original publication in this journal is cited, in accordance with accepted academic practice. No use, distribution or reproduction is permitted which does not comply with these terms.
*Correspondence: Thomas R. Walter, dHdhbHRlckBnZnotcG90c2RhbS5kZQ==