 Tatiana Egorova
 Eugene Rozanov
 Pavle Arsenovic
 Thomas Peter2
 Werner Schmutz
- 1Physikalisch-Meteorologisches Observatorium Davos, World Radiation Center, Davos, Switzerland
- 2Institute for Atmospheric and Climate Science ETH, Zurich, Switzerland
- 3EMPA, Dübendorf, Switzerland
The warming observed in the early 20th century (1910–1940) is one of the most intriguing and less understood climate anomalies of the 20th century. To investigate the contributions of natural and anthropogenic factors to changes in the surface temperature, we performed seven model experiments using the chemistry-climate model with interactive ocean SOCOL3-MPIOM. Contributions of energetic particle precipitation, heavily (shortwave UV) and weakly (longwave UV, visible, and infrared) absorbed solar irradiances, well-mixed greenhouse gases (WMGHGs), tropospheric ozone precursors, and volcanic eruptions were considered separately. Model results suggest only about 0.3 K of global and annual mean warming during the considered 1910–1940 period, which is smaller than the trend obtained from observations by about 25%. We found that half of the simulated global warming is caused by the increase of WMGHGs (CO2, CH4, and N2O), while the increase of the weakly absorbed solar irradiance is responsible for approximately one third of the total warming. Because the behavior of WMGHGs is well constrained, only higher solar forcing or the inclusion of new forcing mechanisms can help to reach better agreement with observations. The other forcing agents considered (heavily absorbed UV, energetic particles, volcanic eruptions, and tropospheric ozone precursors) contribute less than 20% to the annual and global mean warming; however, they can be important on regional/seasonal scales.
Introduction
Two of the strongest global warming periods occurred in the 20th century: 1925–1944 with a temperature increase of 0.37 K and 1978–1997 with a global mean temperature increase of more than 0.32 K (Jones et al., 1999). The former event has been coined as Early Twentieth Century Warming or ETCW. Although the observed global warming in the second half of the 20th century was most likely caused by anthropogenic activities (IPCC, 2013), the reasons for the early 20th century warming have not been clearly identified (Hegerl et al., 2018).
There are several external climate drivers that possessed a positive trend in 1910–1940. The rising trend of solar activity (Solanki et al., 2013) could have some influence on the surface temperature. Large volcanic eruptions inject sulfur gases into the stratosphere, which on conversion to sulfate aerosols can scatter solar radiation back into space and cool down the Earth’s surface (Robock, 2000). There were no major tropical volcanic eruptions during this period (Sato et al., 1993); therefore, the warming in the early 20th century could have only been related to recovery after the climate cooling by two major volcanic eruptions before 1910: Krakatau eruption in 1883 and Santa Maria eruption in 1902. At the same time, the concentrations of well-mixed greenhouse gases (WMGHGs; CO2, N2O, and CH4) and emissions of CO and NOx were rising because of industrialization. These species are also important for the production of tropospheric ozone, which is also a strong greenhouse gas (Monks et al., 2015). Although the concentration of tropospheric sulfate aerosols was also increasing in this period, it could not have directly contributed to warming as these aerosols prevent sunlight from reaching the surface, which leads to climate cooling. The increase of black carbon aerosol loading can lead to climate warming but only on regional and limited time scales.
Several explanations for this warming have been suggested. Delworth and Knutson (2000) found that the observed warming could be induced by a combination of anthropogenic factors and the unusually large internal variability of the atmosphere-ocean system. Tett et al. (1999) stated that the early 20th century warming can be explained by anthropogenic influence, internal variability, and possibly by solar activity. A subsequent modeling study by Tett et al. (2002) suggested that the global warming in 1907–1957 was caused by the increase in greenhouse gases, natural forcing, and internal variability, but they concluded that the warming was mainly caused by natural factors. Meehl et al. (2004) exploited their coupled atmosphere-ocean climate model and suggested that the early 20th century warming was mainly driven by the increase in solar activity. Another modeling study was performed by Nozawa et al. (2005), and they found that natural factors such as volcanic eruptions and solar activity caused more warming than anthropogenic factors. The importance of solar forcing was challenged by Schurer et al. (2014) based on the results from their detection and attribution study. The state of variability modes such as the Atlantic Multidecadal Oscillation and the Pacific Decadal Oscillation (AMO and PDO) was also discussed as a possible contributor to ETCW; however, it is not clear whether these modes are purely internal (Hegerl et al., 2018).
The recent advances in climate models and the knowledge of forcing factors motivated us to reevaluate the contributions of natural and anthropogenic factors to early 20th century warming. We address this problem by using our atmosphere-ocean chemistry-climate model SOCOL-MPIOM (Muthers et al., 2014) driven by different combinations of climate forcing agents to distinguish between the so-called “top-down” and “bottom-up” mechanisms of solar influence on climate (Gray et al., 2010). As the shortwave part of the solar UV radiation is absorbed above the troposphere and the other part of the solar irradiance is able to reach the Earth’s surface, we separately evaluate their contributions. It is known that energetic particle precipitation can impact surface climate (Baumgaertner et al., 2011; Rozanov et al., 2012; Seppälä et al., 2013; Maliniemi et al., 2014), and the recently published forcing data set (Matthes et al., 2017) allows us to estimate their contribution to the early 20th century warming. We also separately evaluated the role of WMGHGs, tropospheric ozone precursors, and volcanic eruptions in the early 20th century temperature and ozone trends.
Materials and Methods
We used the state of the art chemistry-climate model SOCOL3-MPIOM (Stenke et al., 2013; Muthers et al., 2014), which consists of the atmospheric component ECHAM5.4 (Roeckner et al., 2003), the chemistry module MEZON (Rozanov et al., 1999; Egorova et al., 2003), and the interactive ocean module MPIOM (Marsland et al., 2003; Jungclaus et al., 2006). The model has T31 spectral horizontal resolution and 39 vertical levels covering the atmosphere from the ground to 0.01 hPa (∼80 km). The transient climate sensitivity of the model is 1.9 K (Muthers et al., 2014; Figure 7), which is close to the mean values defined in the IPCC AR5 report (IPCC, 2013).
The model is free running; however, the stratospheric zonal wind evolution in the tropics is prescribed from the available reconstructions because the applied vertical resolution does not allow the proper representation of the quasi-biennial oscillation. For solar activity, we used spectral solar irradiance (SSI) from the Shapiro et al. (2011) reconstruction integrated over six spectral intervals used in the ECHAM5 radiation code: 180–250 nm, 250–440 nm, 440–660 nm, 660–1190 nm, 1190–2380 nm, and 2380–4000 nm. The same SSI reconstructions were used for the parameterization of the heating rates missed in the ECHAM5 radiation code (Sukhodolov et al., 2014) and photolysis rates. Daily ionization rates by galactic cosmic rays, solar protons, and reactive nitrogen influx from the thermosphere proportional to the geomagnetic Ap index are prescribed as in the paper by Matthes et al. (2017). Greenhouse gases, ozone depleting substances, aerosol properties, and emissions of the tropospheric ozone precursors (CO and NOx) are prescribed using Meinshausen et al. (2011) historic values.
Figure 1A shows the natural factors considered: SSI changes in 180–250 nm and 250–4000 nm spectral intervals and Ap indexes relative to 1910–1940 period mean. The change in 180–250 nm is up to 8%, while the change in 250–4000 nm does not exceed 0.1%. Figure 1B shows the anthropogenic factors: prescribed CO2 as a representative for WMGHGs and relative change in global NOx emissions for 1910–1940.
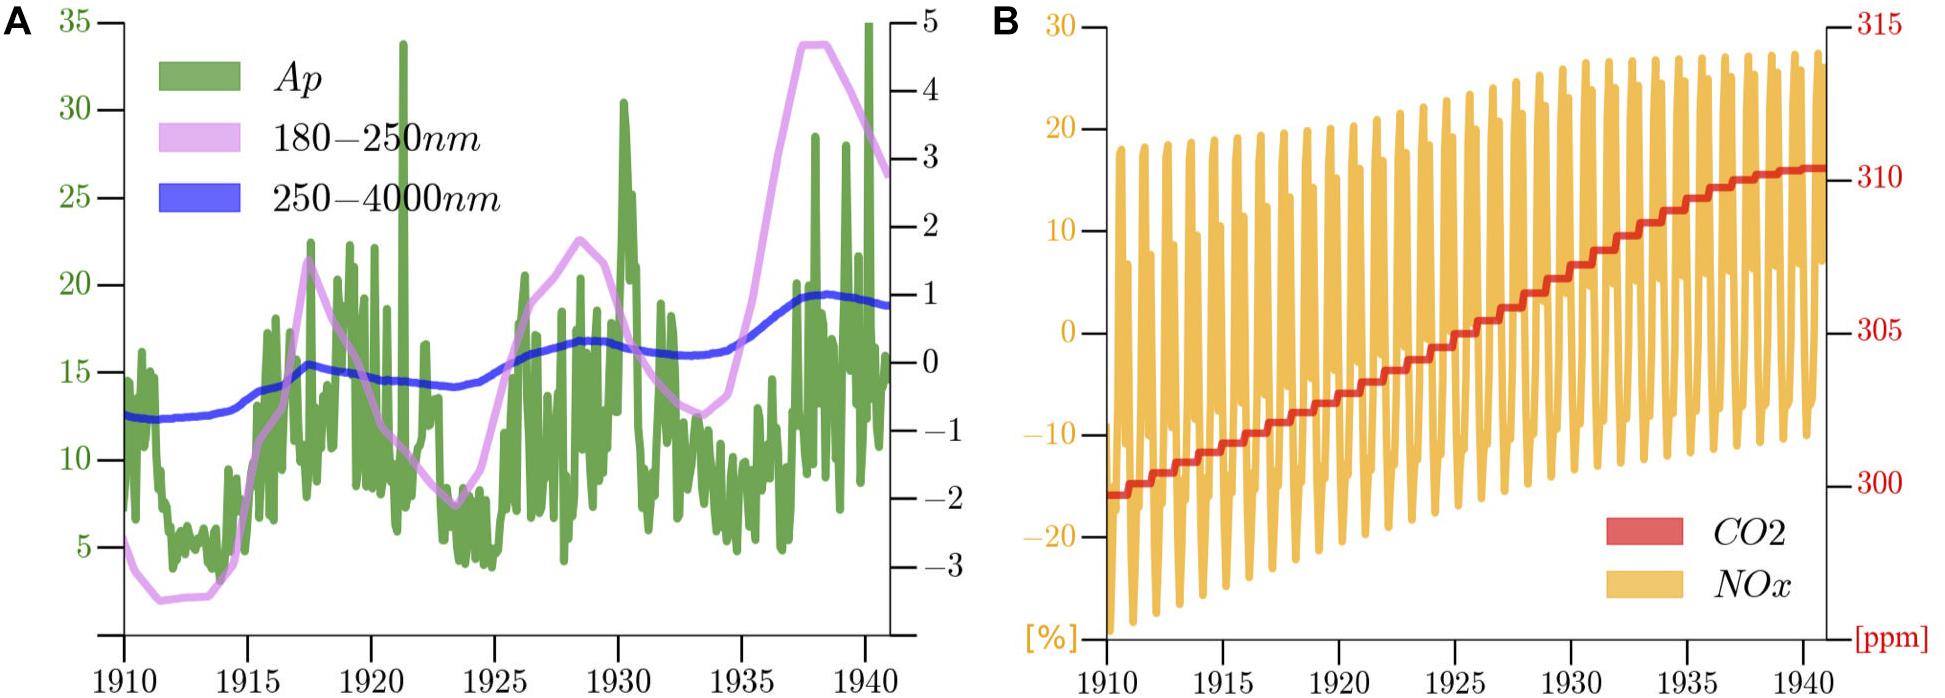
FIGURE 1. The model boundary conditions for 1910–1940 period: (A) natural factors: Ap index describing energetic particle precipitation intensity, relative solar 180–250 nm irradiance change (%) with respect to 1910–1940 period and solar 250–4000 nm irradiance change (‰) relative to 1910–1940 period; (B) Anthropogenic factors: CO2 concentrations (ppm) and global surface NOx emissions change relative to 1910–1940 (%).
We performed seven ten-member ensemble model simulations covering the 1851–1940 period. The initial conditions for all the runs were taken from the long-term model run initiated in 1600 and driven by a realistic set of natural and anthropogenic forcing agents (Muthers et al., 2014). The ensemble members were initiated using different small perturbations of the atmospheric radiation fields during the initial 1-month long period. Our experience with the model confirmed that this perturbation generates different model pathways after only a month of integration. The method is based on the dominating influence of atmospheric weather type variability and is similar to the application of the widely applied lagged initialization of the atmospheric fields (Müller et al., 2012). The first experiment (referred hereafter as ALL) includes all known climate drivers obtained from observations or reconstructed from proxies. To investigate the contributions of individual factors, we fixed them at 1851 values or switched them off completely. For the second simulation (no energetic particle precipitation, PAR), all forcing agents related to the energetic particle precipitation were set to zero during the whole simulation. The third experiment (fixed solar ultraviolet; UV) was forced with the same boundary conditions as in ALL except for the first wavelength band of the ECHAM5 radiation code (180–250 nm) and extra heating and photolysis rates, which were set to January 1851 value. This experiment was designed to exclude all drivers responsible for the initiation of the top-down mechanism (Gray et al., 2010). In the fourth experiment (fixed solar visible and infrared irradiance; VIS), we only fixed irradiance in wavelength bands from 250–4000 nm at January 1851. This experiment was designed to exclude direct heating from the troposphere and surface by solar irradiance. The fifth simulation (GHG) employs fixed concentrations of WMGHGs (CO2, N2O, and CH4) and ozone depleting substances at January 1851. For the sixth simulation (OPR), we fixed the emissions of ozone precursors (NOx and CO) on the preindustrial level. Finally, the VOL simulation was performed by keeping the stratospheric aerosols at January 1851 levels, when the stratospheric aerosol loading was low.
There are several observation-based data sets that can be used for the evaluation of the simulated surface temperature trends. Here, we used combined land and ocean temperature anomalies on a 5° by 5° grid (HadCRUT4, Morice et al., 2012), Berkeley Earth Surface Temperature gridded data (BEST1), and CCC400 reanalysis (Bhend et al., 2012).
For the trend analysis, we exploited the robust linear trend calculation with the Sen-Mann-Kendall trend significance test using the 95% confidence interval. We analyzed the trends for the 1910–1940 period. The results were presented as the temperature change during the considered period calculated from the obtained linear trends. It was decided to exclude the major tropical volcanic eruption of 1902. When comparing the global mean model output with observations and reanalysis, we only used the grid points that had no missing observations during the 1910–1940 period.
Results
The geographical distribution of the 1910–1940 annual mean linear trends from these data sets as well our model ensemble mean results for the ALL case are presented in Figure 2. The presented results have some common and many different features. The ETCW is visible in all data sources. Overall, it was most pronounced in the BEST data, while the smallest magnitude was reached in our model results. All data sets agree on the warmer central Atlantic with a magnitude of up to 1 K in observation data and about 0.5 K in model and reanalysis. Warming in the northern Atlantic is clear in the observation data, while the model does not show any significant temperature trend there. A pronounced (up to 2.5 K) Arctic winter warming (Yamanouchi, 2011) is visible in the BEST data and partially supported by HadCRUT4. In CCC4000 and in our model results, Arctic warming was also observable, but its magnitude did not exceed 0.4 K. The warming over Alaska or adjacent areas presents in all data sets with some scatter in magnitude (from 0.8 K to almost 2 K) and geographical location. The warming over the land masses appears in reanalysis and our model results but not in the observation data except over Russian Far East, Eastern Africa, and Arabian Peninsula. The global, hemispheric, annual, and seasonal mean trends are illustrated in Figure 3 for our model and CCC400.
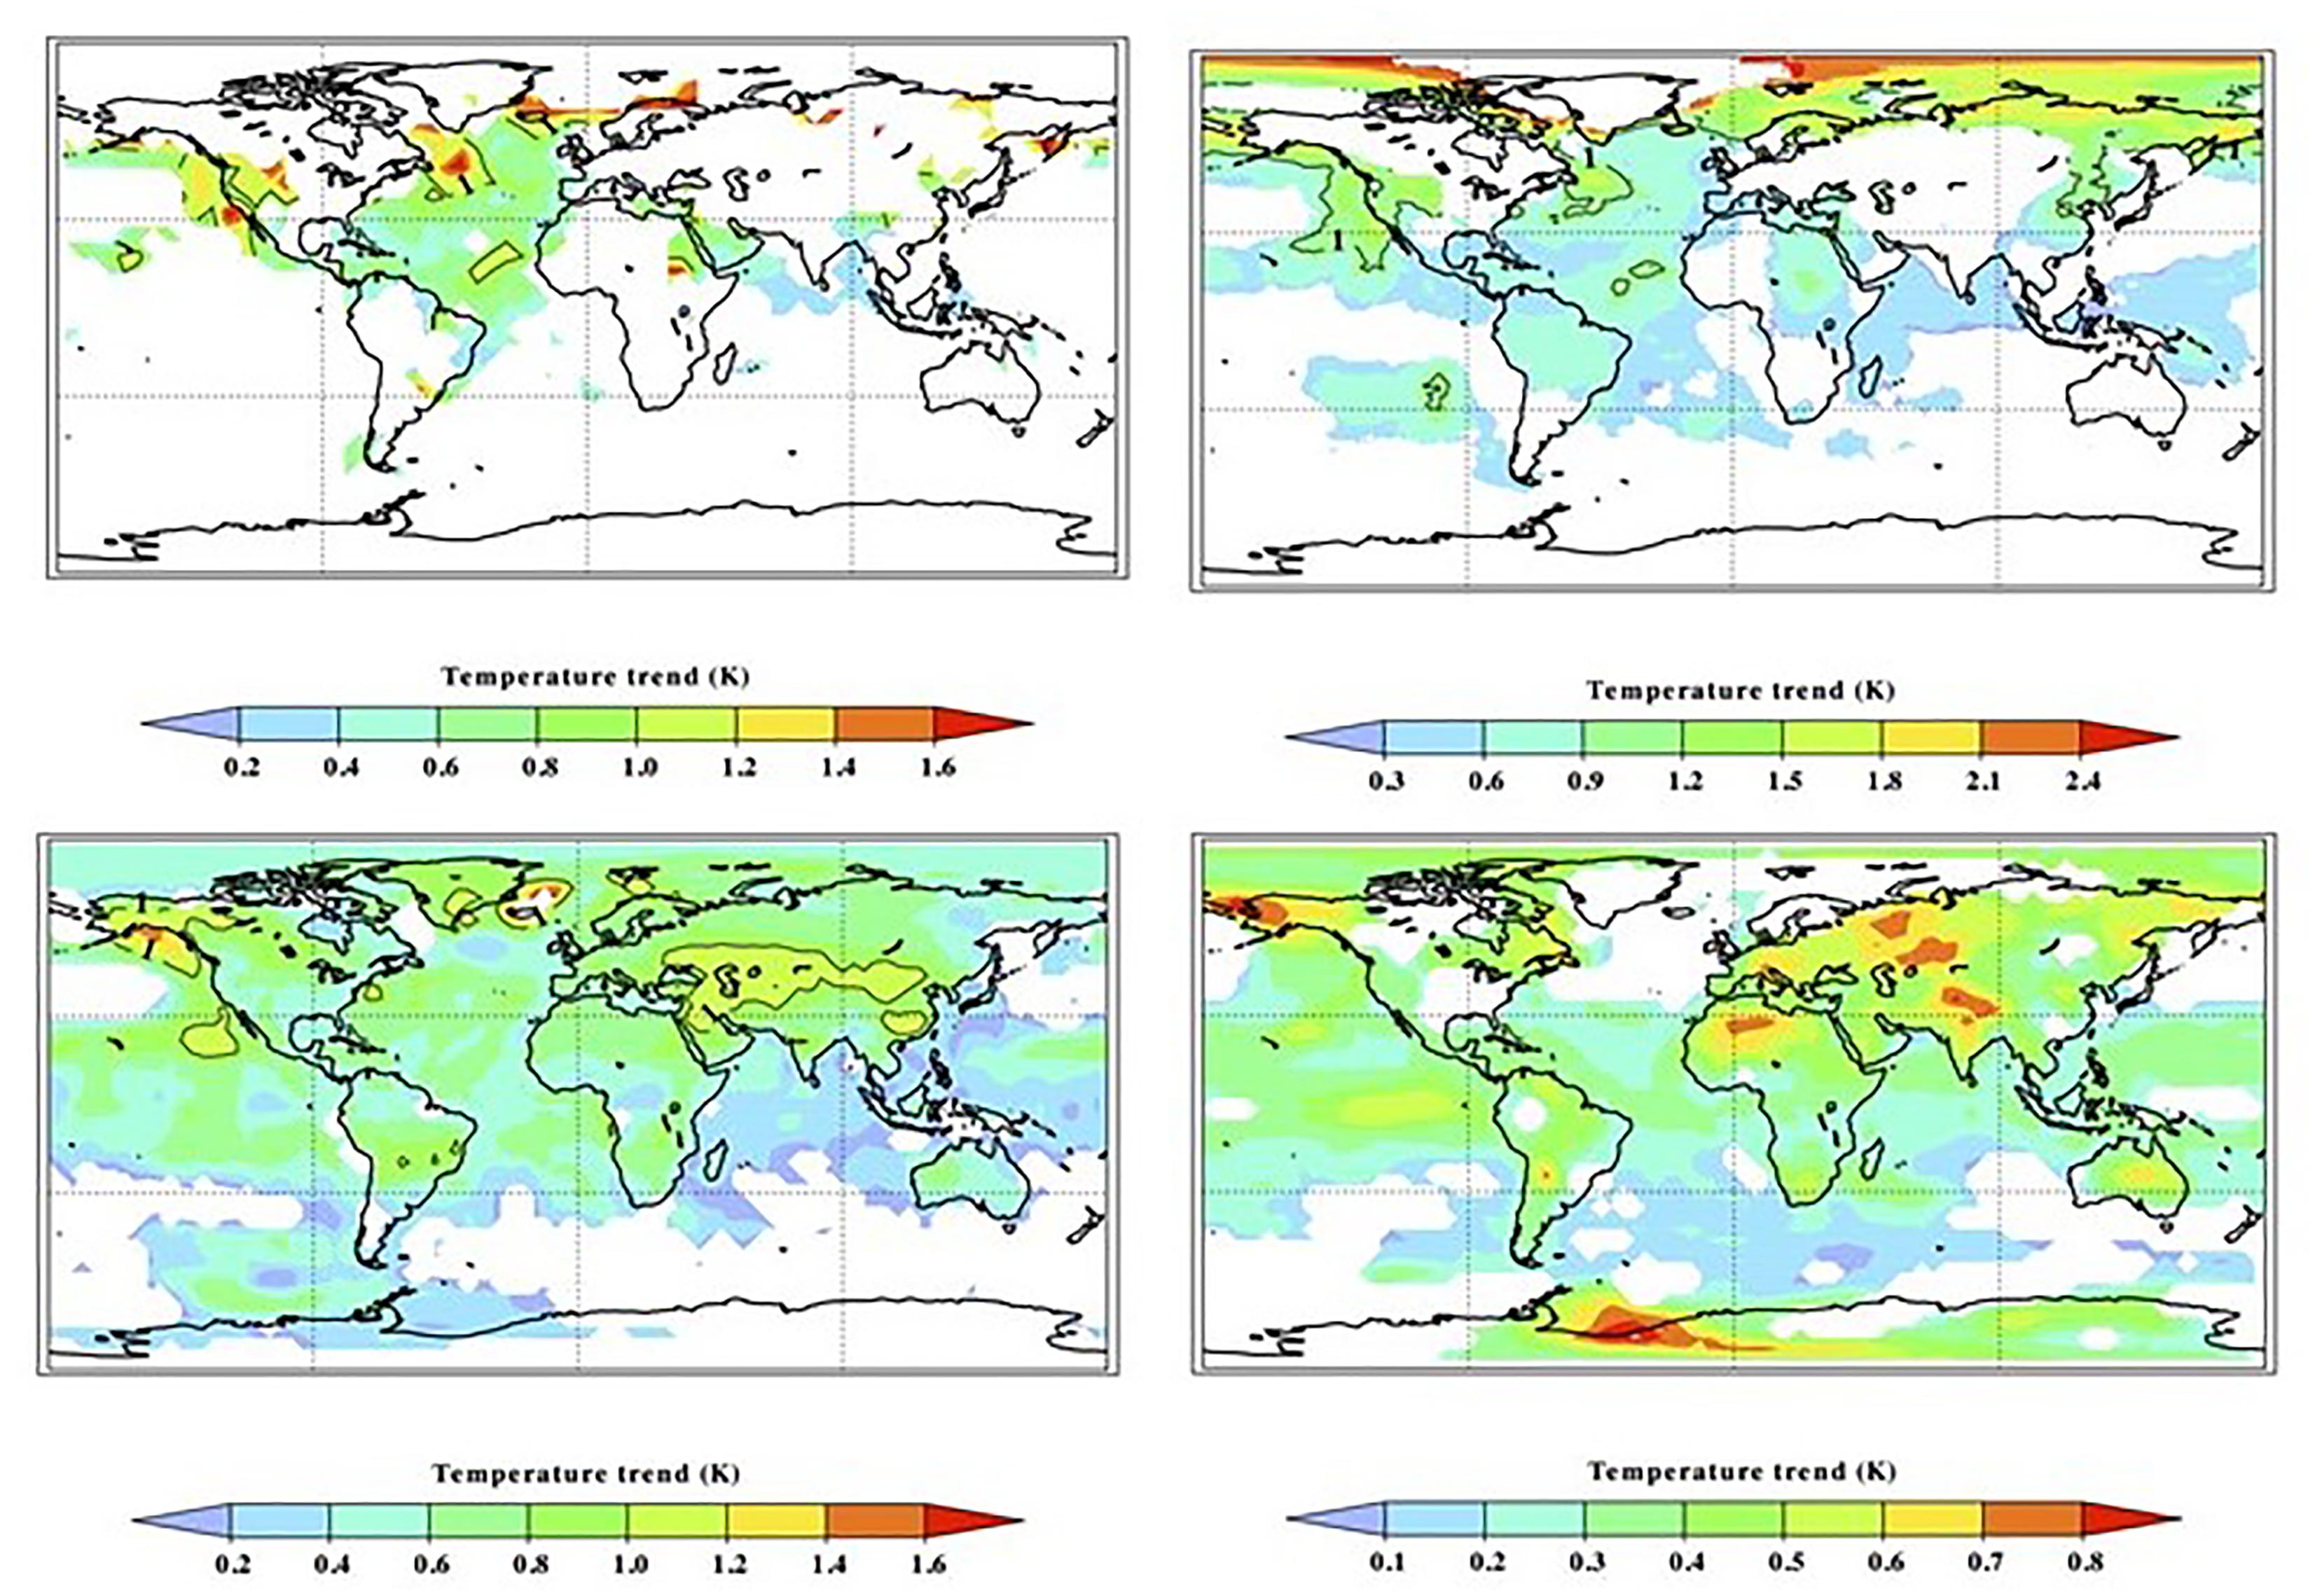
FIGURE 2. Geographical distribution of annual mean temperature change (K) during the 1910–1940 period calculated from linear trend HadCRUT4 (upper left), BEST (upper right), CCC400 (lower left), and our model results (lower right). The areas where the trend is significant on 95% or a better level are shown in color. Please note the difference in color scale ranges, which illustrates generally smaller warming magnitude in our model results.
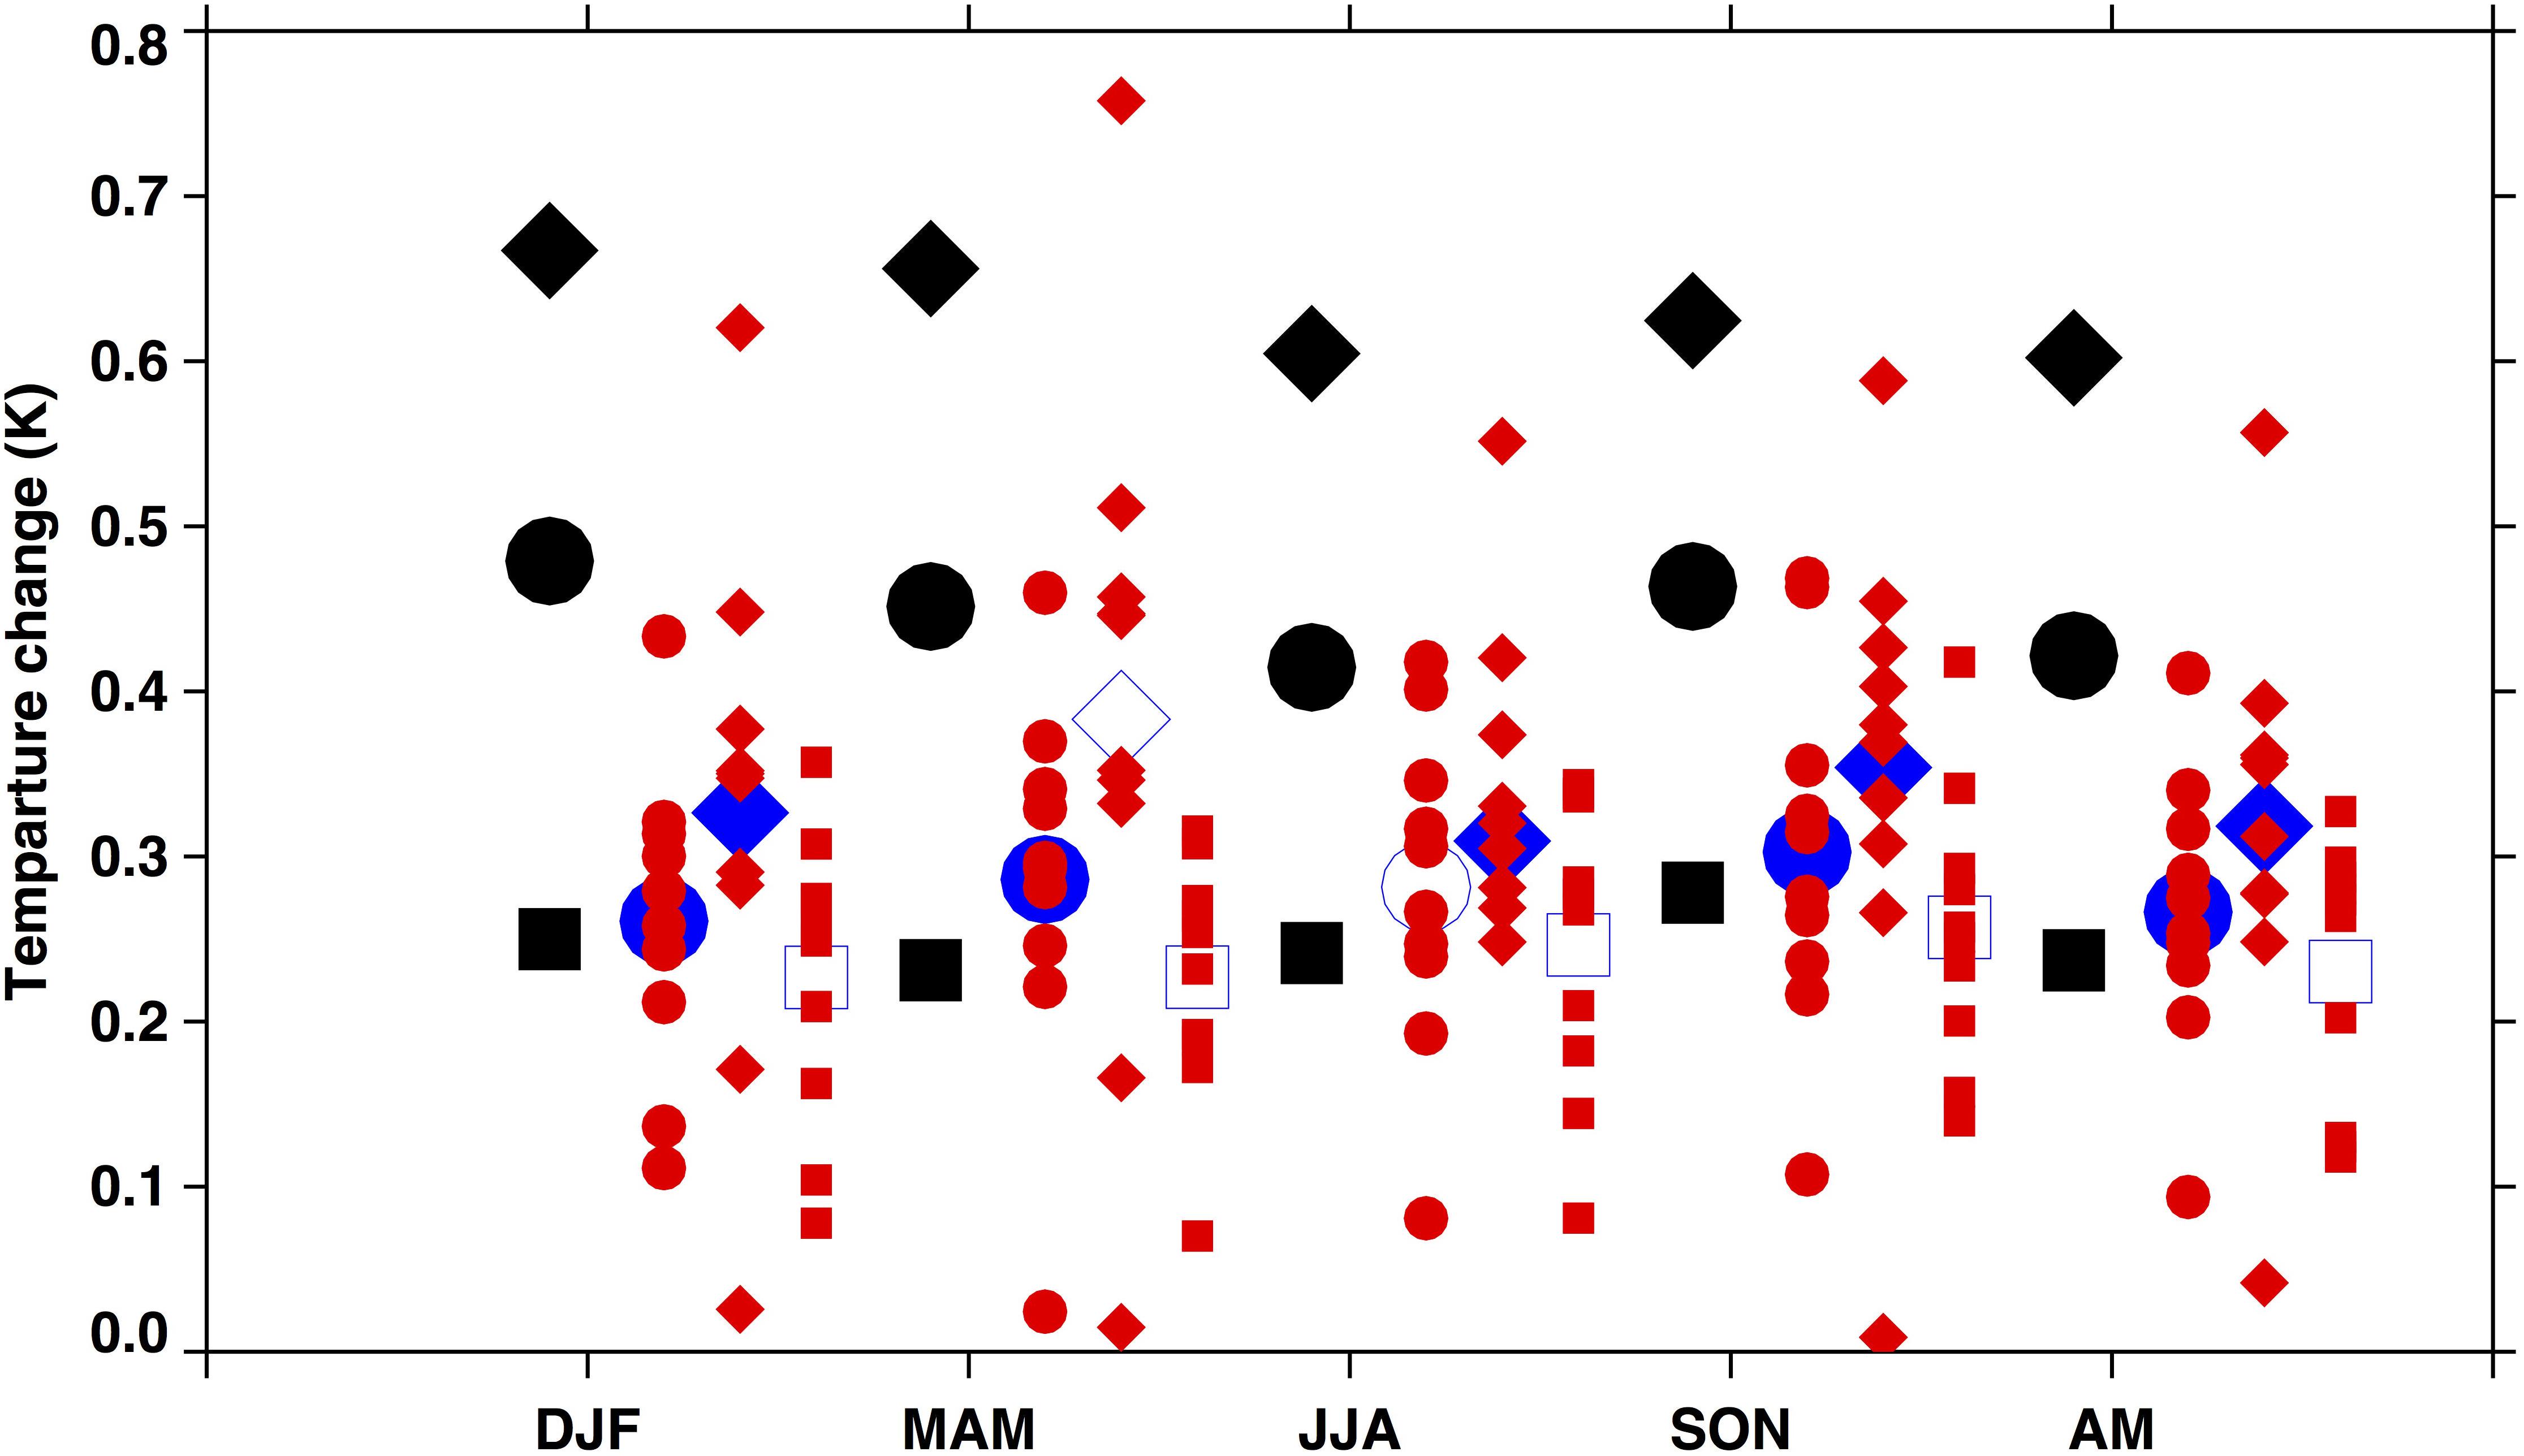
FIGURE 3. Comparison of the simulated and reanalyzed global, annual, and seasonal mean surface air temperature trends for the period 1910–1940. CCC400 data are shown in black. The results of model run ALL for ensemble mean are shown in blue, while all ten individual members are shown in red. Global, Northern Hemisphere, and Southern Hemisphere mean trends are shown with circles, rhombuses, and squares. Filled large symbols mark the points where the simulated trends differ from observations with more than 95% statistical significance.
The statistical significance of the difference between the global trends in the model simulations and observations was calculated using Student’s t-test (Rice, 2006) and considers variability among ensemble members and observation uncertainties.
The comparison shows that in the Southern Hemisphere, simulated temperature changes are about 0.3 K for all seasons, which is not significantly different from the CCC400 reanalysis. In the Northern Hemisphere, the temperature trends are substantially (up to 0.3 K) underestimated by the model for all seasons except boreal spring. Owing to the deviation in the Northern Hemisphere, the model also underestimates the global mean trends by up to 0.2 K. Moreover, the model does not accurately reproduce high hemispheric asymmetry in the CCC400 data. This is most likely caused by weaker warming over the Northern Atlantic and landmasses in the model. The weaker trends in the northern part of the Atlantic Ocean can be potentially caused by the suppressed internal variability in the analyzed ensemble mean results, leading to a compensation of different AMO phases in different ensemble members. Less pronounced warming over the northern landmasses can also be connected to the underestimated strength of the applied forcing agents. The results for all members of the ensemble simulation, however, show that the internal variability does not play an important role because in 9 out of 10 ensemble members the model underestimates the warming magnitude. In one case, global warming is well reproduced, but the pattern of this warming shown in Figure 4 is characterized by excessive warming over the Pacific Ocean, which is not visible in all observation-based data sets (see Figure 2). Therefore, the underestimation of the magnitude of global warming is rather related to the strength of the applied forcing.
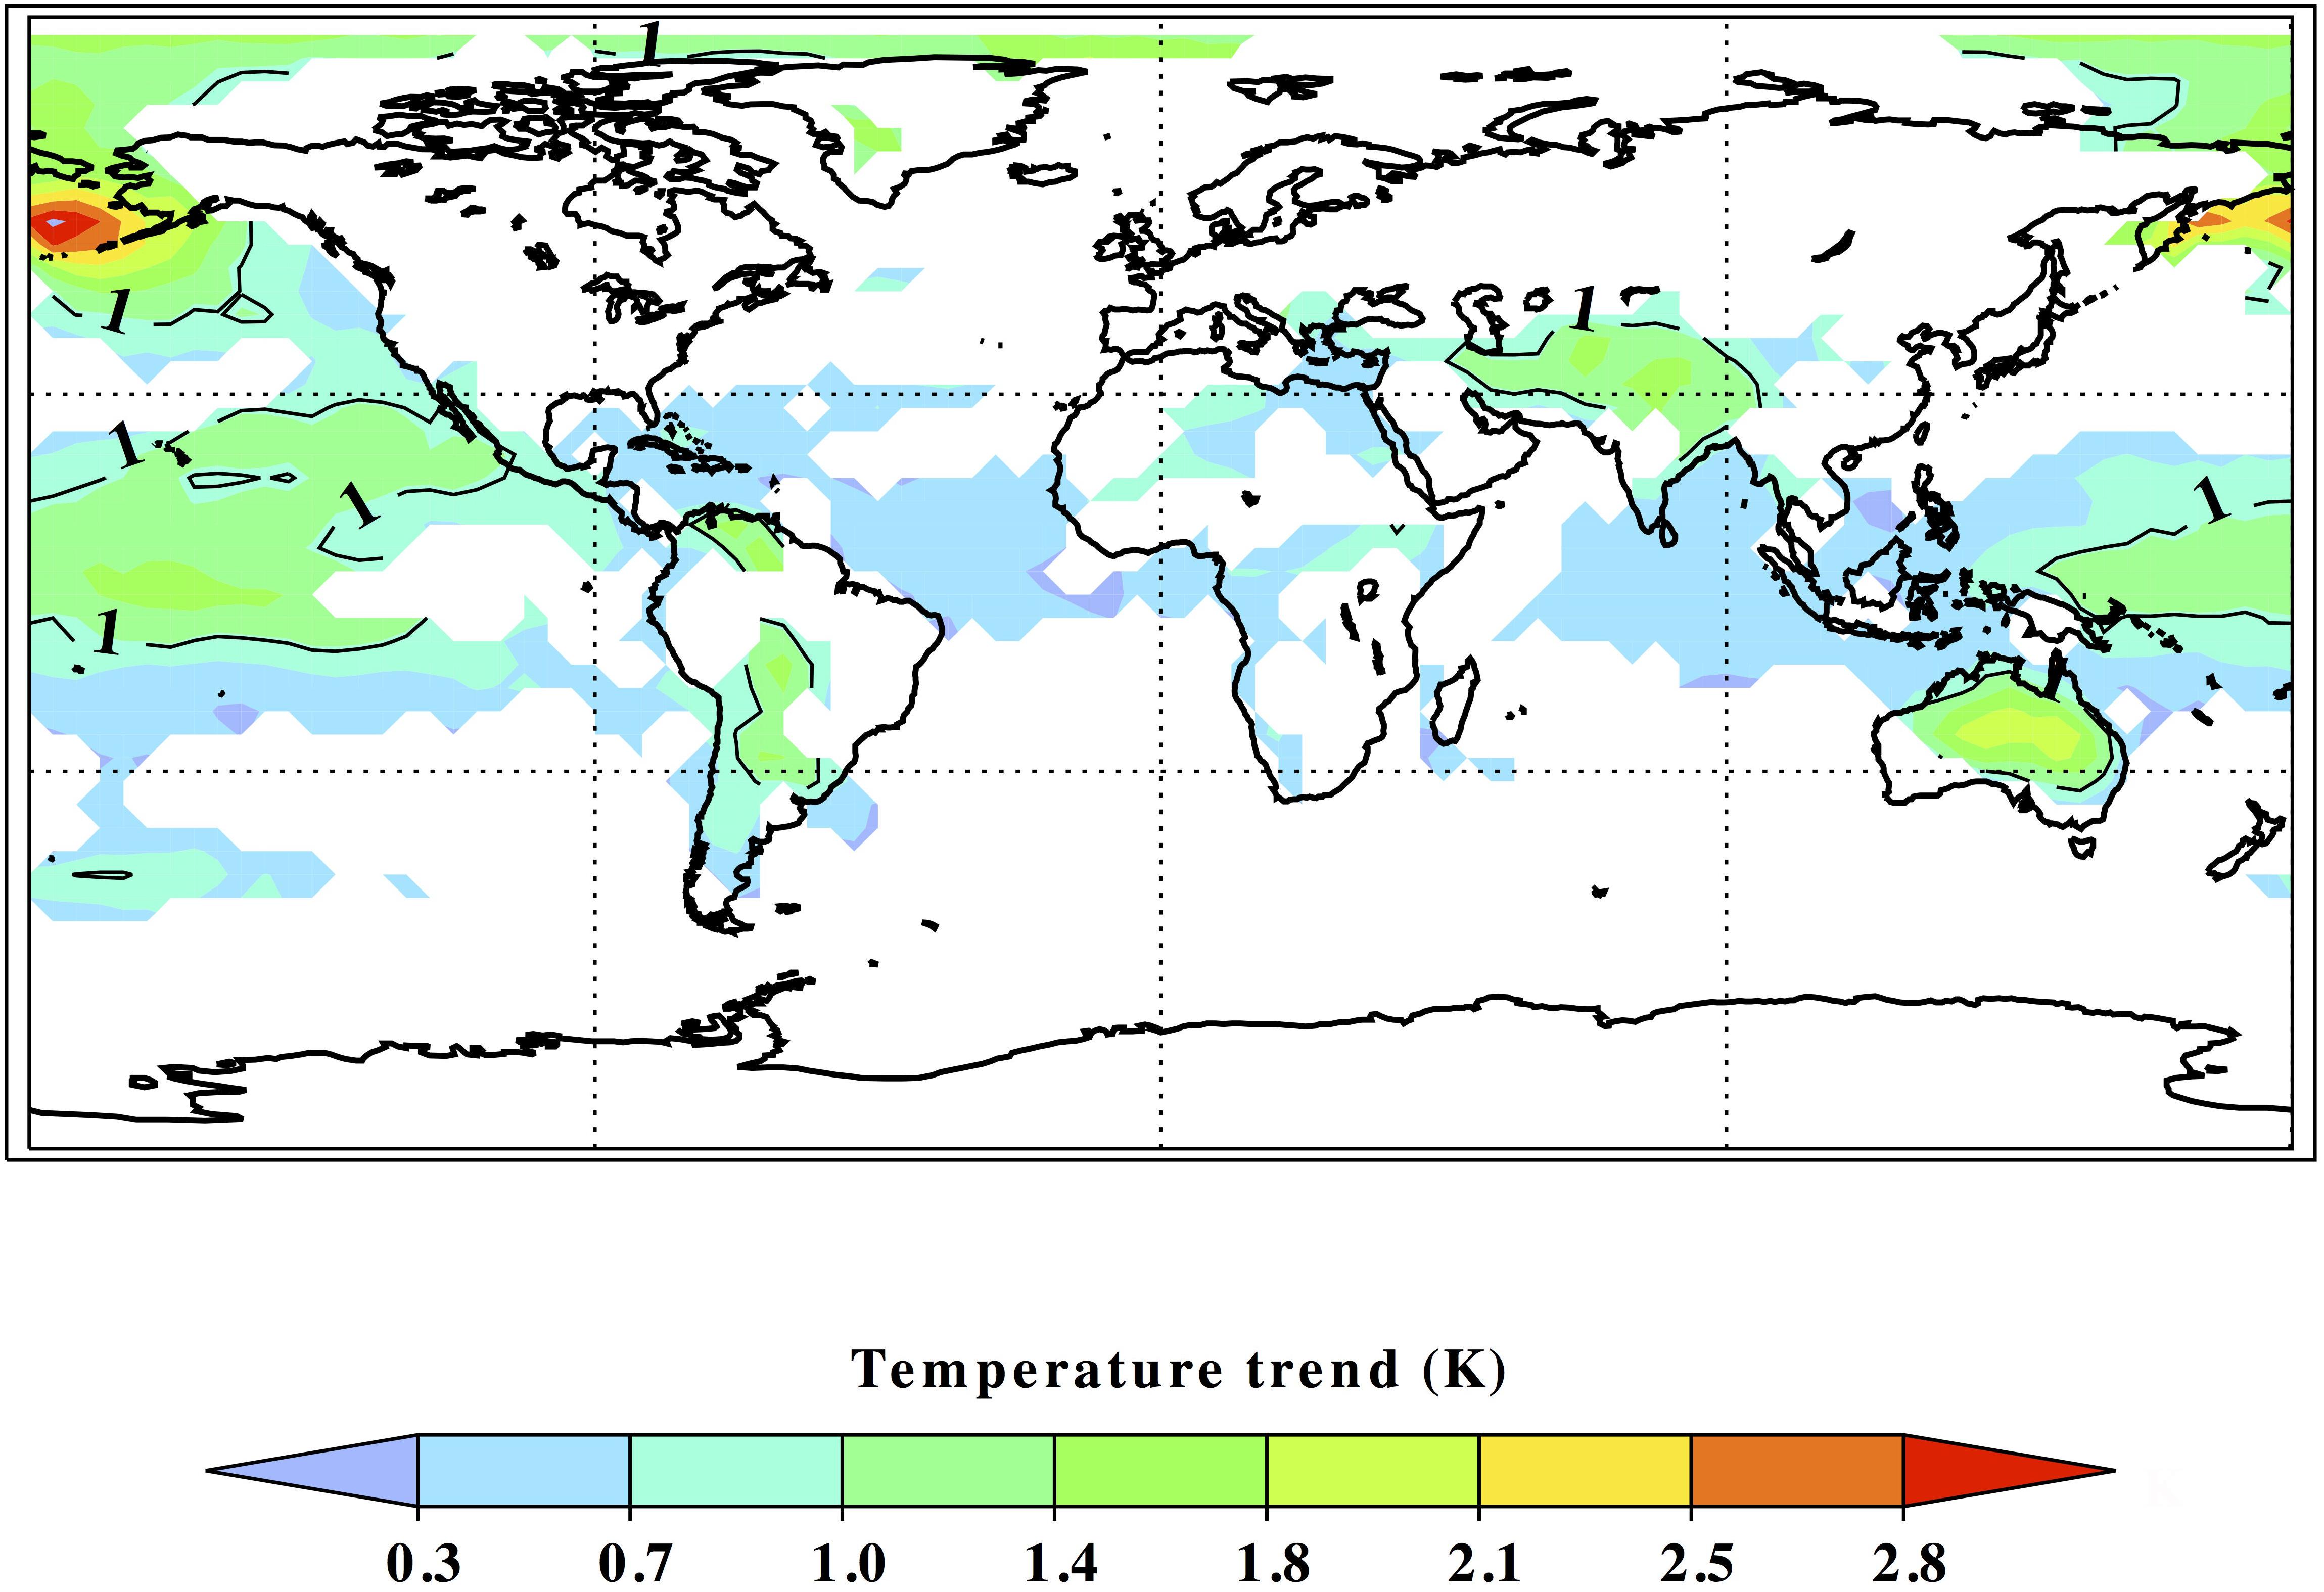
FIGURE 4. Geographical distribution of annual mean temperature trend (K) during 1910–1940 time period calculated from the results of the first member of the model ensemble run ALL.
The problems revealed from the comparison of our model results with observation and reanalysis data are less pronounced than those of other climate models. Hegerl et al. (2018, see their Figure S2) showed that multimodel mean CMIP5 forced trends are substantially lower when compared with observations. It could be partially explained by the application of solar irradiance forcing in the work conducted by Shapiro et al. (2011), which provides a much stronger increase of total solar irradiance (TSI) and spectral solar irradiance (SSI) during the considered period.
To characterize the contribution of different forcing agents to the global and seasonal mean temperature trends, we calculated the contributions of all applied factors, which are shown in Figure 5. Model results suggest only 0.3 K annual and global mean warming during the considered time interval (see Figure 3), which is smaller than the observed trend by about 30%. Figure 5 shows that the main contributors are the increase in WMGHGs (GHG, ∼50%), deep penetrating solar irradiance (VIS, ∼35%), and tropospheric ozone precursors (OPR, ∼15%). These estimates are independent of the season except for the contribution from tropospheric ozone precursors, which is very small during the boreal autumn season. The contribution from weakly absorbed solar irradiance (VIS) maximizes during autumn, reaching the level of annual mean WMGHG influence. The contribution of the other forcing agents considered (heavily absorbed UV, energetic particles and volcanic eruptions) to annual, seasonal, and global mean warming is within 20%. The small influence of volcanic eruptions is explained by their virtual absence during the considered period and the weak contribution from 19th century volcanic eruptions and Santa Maria eruption in 1902. The heavily absorbed UV and energetic particles substantially affect ozone and temperature in the stratosphere (not shown), but the downward propagation via the “top-down” mechanism (Gray et al., 2010) is not visible in the annual and global mean temperature trends considered in this paper. These effects should be stronger on monthly and regional scales. On the other hand, the influence of the weakly absorbed solar irradiance results from the direct surface warming caused by the absorption of the incoming solar radiation (“bottom-up” mechanism) and is detectable in the global mean data.
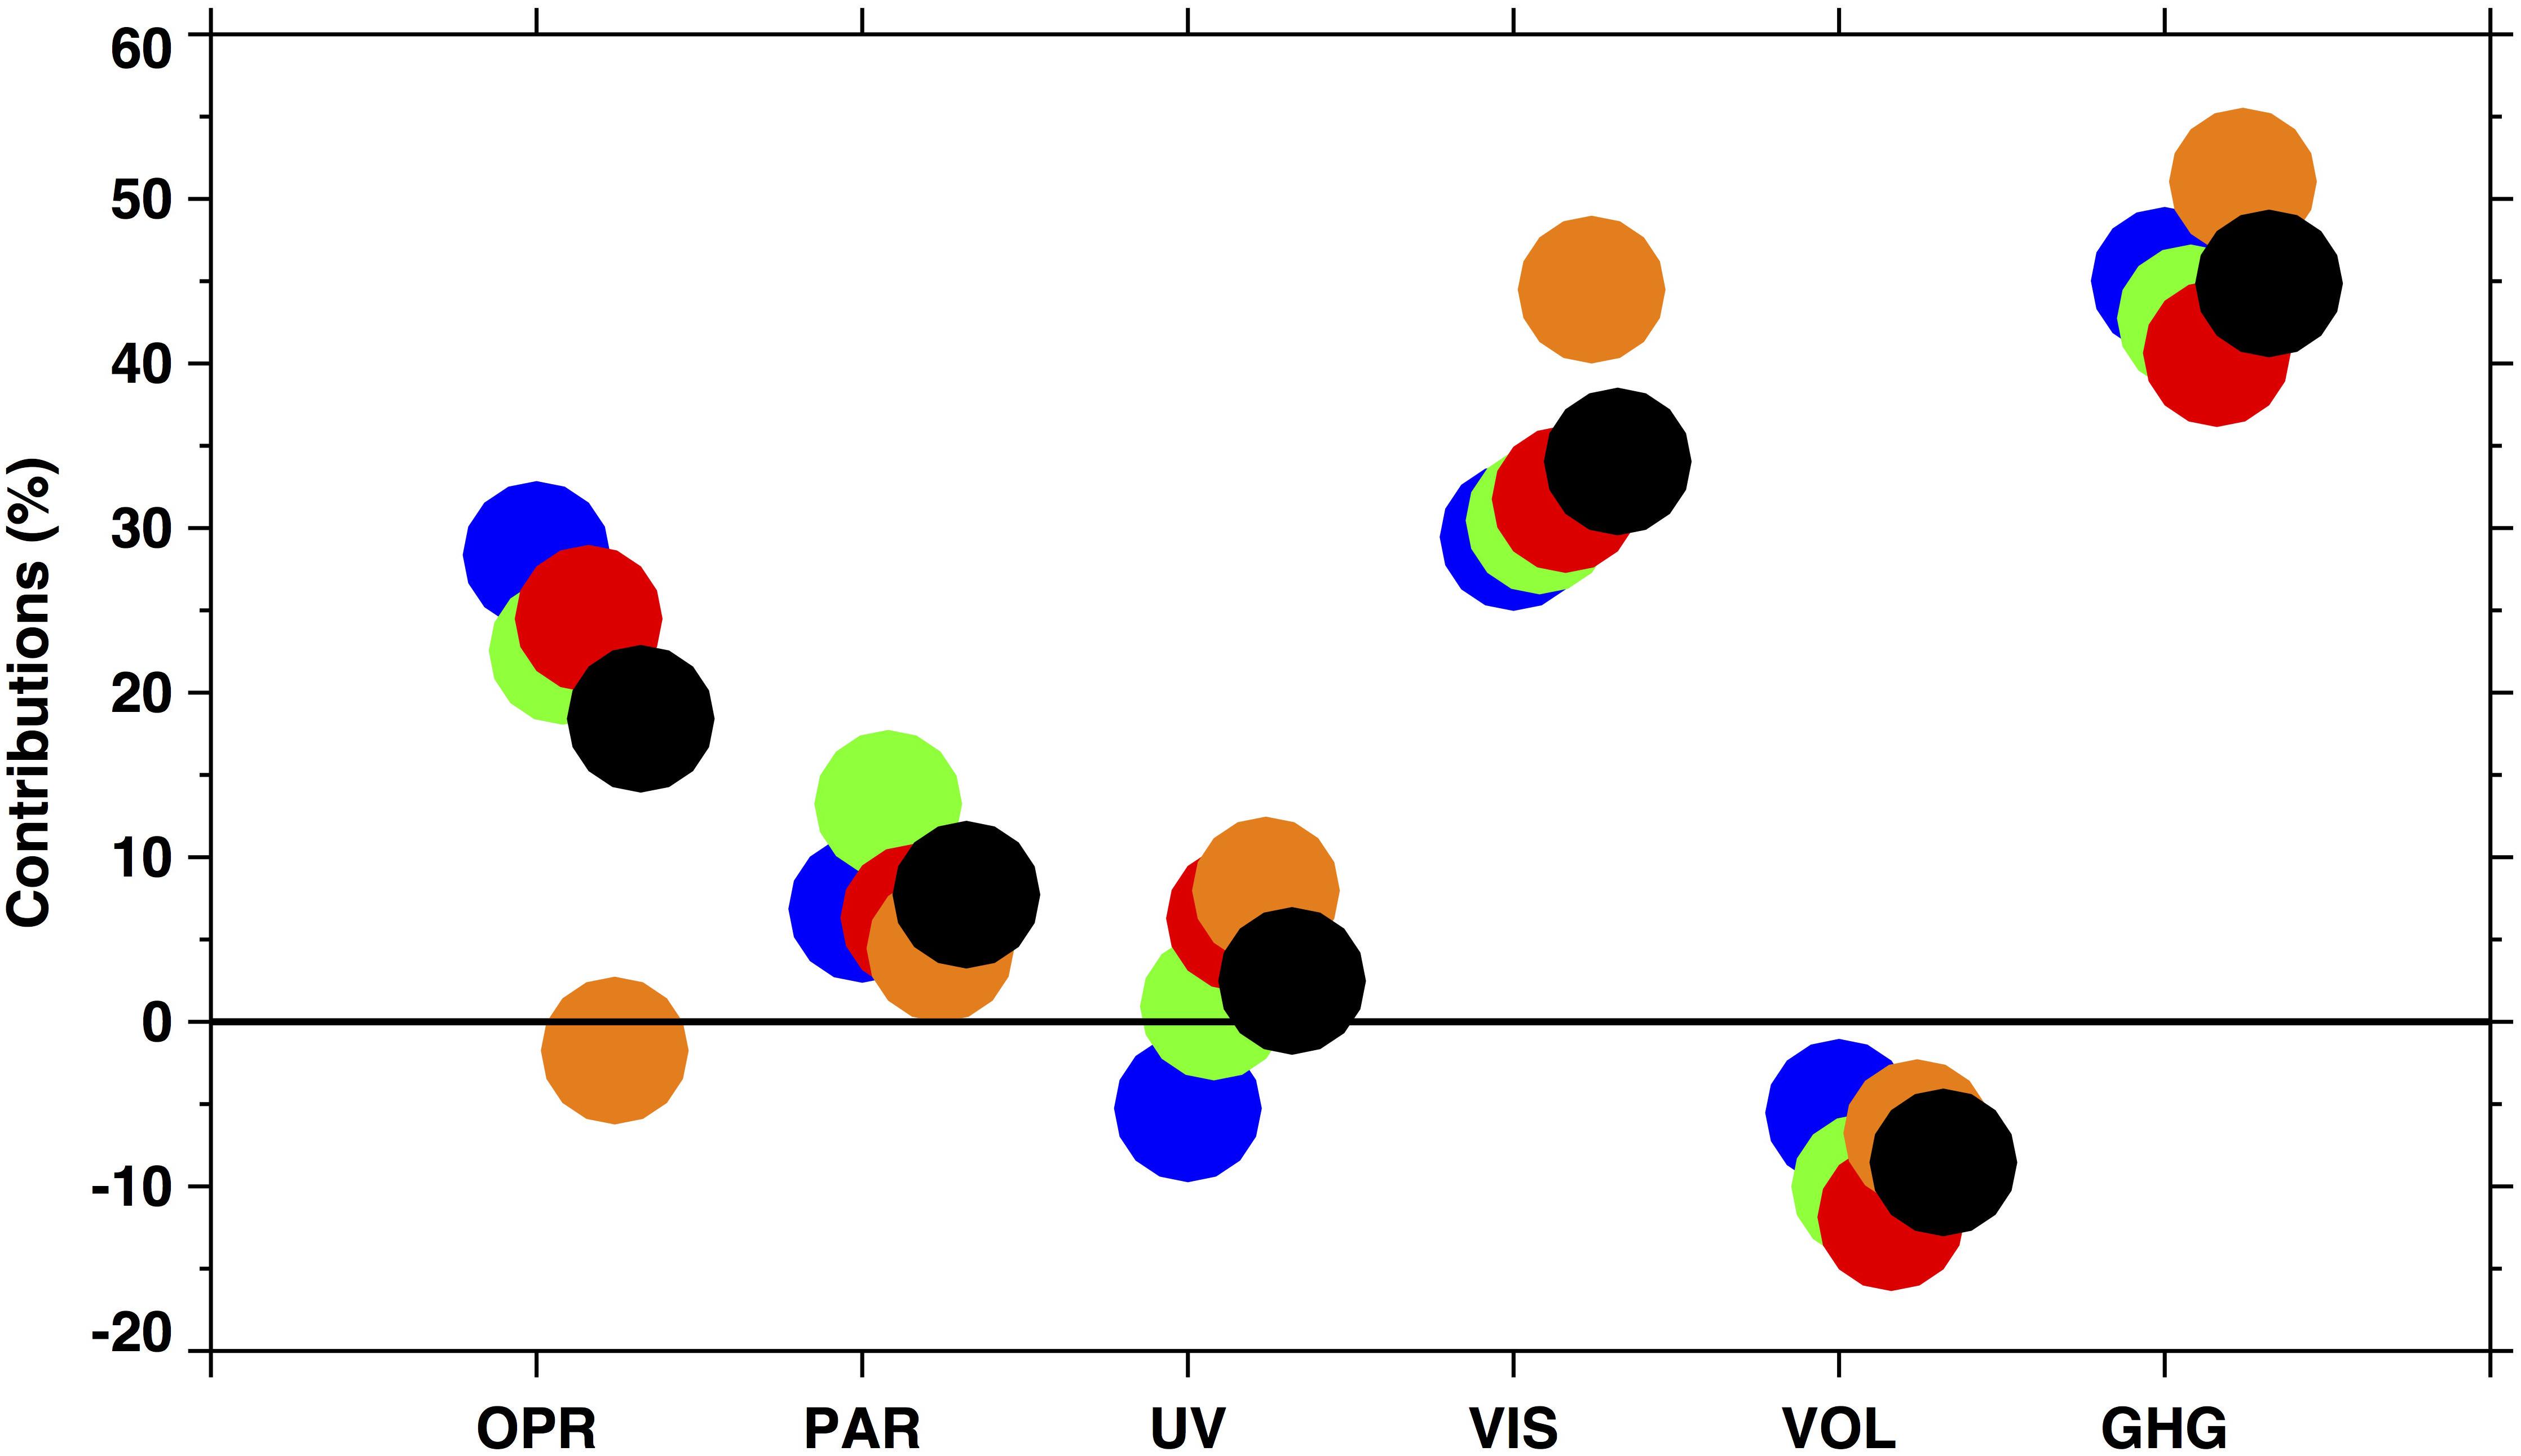
FIGURE 5. Contribution (%) of different forcing agents to global and seasonal mean temperature trends for the period 1910–1940 from the reference simulation (ALL). Black, blue, green, red, and orange colors present annual, DJF, MAM, JJA, and SON season means.
The presented results suggest that a better agreement with observations requires a larger solar forcing or a search for unknown climate drivers, because the behavior of WNGHGs is well-constrained by observations and the solar forcing taken from Shapiro et al. (2011) has rather large uncertainties.
Conclusion
In this paper, we used the coupled ocean-atmosphere-chemistry-climate model SOCOL-MPIOM to estimate the contributions of natural and anthropogenic factors to the early 20th century warming. Model results suggest only 0.3 K annual mean global warming during the considered period, which is smaller than trends obtained from reanalysis and observations by 25%. We found that about half of the global warming is caused by the increase of WMGHGs (CO2, CH4, and N2O), while the decrease of the weakly absorbed (VIS) solar irradiance constitutes approximately one third of the total warming. Heavily absorbed solar UV irradiance and energetic particles are shown to have very little impact on the global mean temperature trend. The absence of major tropical volcanic eruptions since 1851 failed to contribute to the warming trend during the considered period.
Negative model bias in the simulation of the ETCW should not be related to anthropogenic activity, because the emissions of WMGHGs are well constrained and highly uncertain tropospheric ozone precursors cannot contribute much to the global and annual mean trends. One possible cause of the weaker ETCW intensity can be a lack of proper AMO or PDO phases in the model ensemble mean. However, the majority of ensemble members give similar trend estimates, which hints at the relatively small contribution of the internal variability modes to the simulated results. Hegerl et al. (2018) stated that the positive AMO phase during the early 20th century can produce about 0.1 K of additional warming for the limited area (0–60oN, 0–80oW), slightly improving the situation with global mean trends. Another obvious candidate is the strength of the solar forcing. In this work, we used the strongest scenario based on the work of Shapiro et al. (2011). As it is clear from our results, this forcing does not result in unrealistic temperature changes during the considered 1910–1940 period. Therefore, we cannot confirm the conclusions of Feulner (2011) about excessive temperature changes in models driven by solar forcing from Shapiro et al. (2011). On the contrary, our results suggest that the underestimation of ETCW intensity can be cured using even stronger solar irradiance changes during the early 20th century. It is partially confirmed by the better performance of our model in comparison with CMIP5 models, which underestimated ETCW intensity even stronger using weaker CMIP5 solar forcing recommendations. Our results suggest a dominating role of the anthropogenic and solar forcing agents and differ from the publications listed in the introduction, which either emphasize the role of internal variability combined with anthropogenic or natural forcing (Delworth and Knutson, 2000; Tett et al., 2002) or pure anthropogenic or natural influence (Meehl et al., 2004; Nozawa et al., 2005). It should be noted, however, that our conclusions need to be confirmed by comparing geographical and seasonal patterns of surface temperature change and analysis of results of other models because there is a non-negligible probability that the role of internal variability in our single model experiment is underestimated. However, it should be done only if a reasonable agreement of global/hemispheric means is reached.
Author Contributions
TE analyzed the results and wrote the text. ER participated in the experimental design and analysis of the results. PA performed numeric experiments, prepared the output data, analyzed the results, and prepared the first draft of the paper. TP formulated the general line of the research, designed the model, analyzed the results, and made corrections to the manuscript draft. WS formulated the general line of the research, analyzed the results, and made corrections to the manuscript draft.
Funding
This work was supported by the Swiss National Science Foundation under the grant CRSII2_147659 (FUPSOL II). TE thanks PMOD/WRC for the support via the internal grant. ER acknowledges the support from SNSF under grants 169241 (VEC) and 163206 (SIMA). This work benefits from the active discussion inside ROSMIC WG1 of the SCOSTEP VarSITI program.
Conflict of Interest Statement
The authors declare that the research was conducted in the absence of any commercial or financial relationships that could be construed as a potential conflict of interest.
Acknowledgments
We would like to sincerely thank the reviewers whose comments significantly improved the paper.
Footnotes
References
Baumgaertner, A. J. G., Seppälä, A., Jöckel, P., and Clilverd, M. A. (2011). Geomagnetic activity related NOx enhancements and polar surface air temperature variability in a chemistry climate model: modulation of the NAM index. Atmos. Chem. Phys. 11, 4521–4531. doi: 10.5194/acp-11-4521-2011
Bhend, J., Franke, J., Folini, D., Wild, M., and Brönnimann, S. (2012). An ensemble-based approach to climate reconstructions. Clim. Past. 8, 963–976. doi: 10.5194/cp-8-963-2012
Delworth, T. L., and Knutson, T. R. (2000). Simulation of early 20th century global warming. Science 287, 2246–2f250. doi: 10.1126/science.287.5461.2246
Egorova, T., Rozanov, E., Zubov, V., and Karol, I. (2003). Model for investigating ozone trends (MEZON), Izv. Atmos. Ocean Phys. 39, 277–292.
Feulner, G. (2011). Are the most recent estimates for maunder minimum solar irradiance in agreement with temperature reconstructions? Geophys. Res. Lett., 38, 1–4.
Gray L. J., Beer J., Geller M., Haigh J. D., and Lockwood M. (2010). Solar influence on climate. Rev. Geophys. 48. doi: 10.1029/2009RG000282
Hegerl, G. C., Brönnimann, S., Schurer, A., and Cowan, T. (2018). The early 20th century warming: anomalies, causes, and consequences. WIREs Clim. Chang. 9:e522. doi: 10.1002/wcc.522
IPCC (2013). Climate Change 2013: The Physical Science Basis. Contribution of Working Group I to the Fifth Assessment Report of the Intergovernmental Panel on Climate Change, eds Stocker, T.F., Qin, D., Plattner, G.-K., Tignor, M., Allen, S.K., Boschung, J., et al. Cambridge: Cambridge University Press, 1535. doi: 10.1017/CBO9781107415324
Jones, P. D., New, M., Parker, D. E., Martin, S., and Rigor, I. G. (1999). Surface air temperature and its changes over past 150 years. Rev. Geophys. 37, 173–199. doi: 10.1029/1999RG900002
Jungclaus, J. H., Keenlyside, N., Botzet, M., Haak, H., Luo, J.-J., Latif, M., et al. (2006). Ocean circulation and tropical variability in the coupled model ECHAM5/MPI-OM. J. Clim. 19, 3952–3972. doi: 10.1175/JCLI3827.1
Maliniemi, V., Asikainen, T., and Mursula, K. (2014). Spatial distribution of Northern Hemisphere winter temperatures during different phases. J. Geophys. Res. Atmos. 119, 9752–9764. doi: 10.1002/2013JD021343
Marsland, S. J., Haak, H., Jungclaus, J. H., and Latif, M. (2003). The max-planck-institute global ocean/sea ice model with orthogonal curvilinear coordinates. Ocean Model. 5, 91–127. doi: 10.1016/S1463-5003(02)00015-X
Matthes, K., Funke, B., Andersson, M. E., Barnard, L., and Beer, J. (2017). Solar forcing for CMIP6 ( v3. 1 ). Geosci. Model Dev. 10, 2247–2302. doi: 10.5194/gmd-10-2247-2017
Meehl, G. A., Washington, W. M., Ammann, C. M., Arblaster, J. M., Wigley, T. M. L., and Tebaldi, C. (2004). Combinations of natural and anthropogenic forcings in twentieth-century climate. J. Clim. 17, 3721–3727.
Meinshausen, M., Smith, S. J., Calvin, K., Daniel, J. S., Kainuma, M. L. T., Lamarque, J.-F., et al. (2011). The RCP greenhouse gas concentrations and their extensions from 1765 to 2300. Clim. Chang. 109, 213–241. doi: 10.1007/s10584-011-0156-z
Monks, P. S., Archibald, A. T., Collete, A., Cooper, O., Coyle, M., Derwent, R. et al. (2015). Tropospheric ozone and its precursors from the urban to the global scale from air quality to short-lived climate forcer. Atmos. Chem. Phys. 15, 8889–8973. doi: 10.5194/acp-15-8889-2015
Morice, C. P., Kennedy, J. J., Rayner, N. A., and Jones, P. D. (2012). Quantifying uncertainties in global and regional temperature change using an ensemble of observational estimates: the HadCRUT4 dataset. J. Geophys. Res. 117:D08101. doi: 10.1029/2011JD017187
Müller, W., Baehr, J., Haak, H., Jungclaus, J. H., Kröger, J., Matei, D., et al. (2012). Forecast skill of multi-year seasonal means in the decadal prediction system of the max planck institute for meteorology. Geophys. Res. Lett. 39:L22707. doi: 10.1029/2012GL053326
Muthers, S., Anet, J. G., Stenke, A., Raible, C. C., Rozanov, E., Peter, T., et al. (2014). The coupled atmosphere-chemistry-ocean model SOCOL-MPIOM. Geosci. Model Dev. 7, 2157–2179. doi: 10.5194/gmdd-7-3013-2014
Nozawa, T., Nagashima, T., Shiogama, H., and Crooks, S. A. (2005). Detecting natural influence on surface air temperature change in the early twentieth century. Geophys. Res. Lett. 32, 1–4. doi: 10.1029/2005GL023540
Rice, J. A. (2006). Mathematical Statistics and Data Analysis, 3rd Edn. Duxbury, MA: Duxbury Thomson Learning.
Robock, A. (2000). Volcanic eruptions and climate. Rev. Geophys. 138, 191–219. doi: 10.1029/1998RG000054
Roeckner, E., Bäuml, G., Bonaventura, L, Brokopf, R., Esch, M., Giorgetta, M., et al. (2003). The Atmospheric General Circulation Model ECHAM5. Part I: Model Description, Report No. 349, 127, Hamburg: Max Planck Institute for Meteorology.
Rozanov, E., Calisto, M., Egorova, T., Peter, T., and Schmutz, W. (2012). Influence of the precipitating energetic particles on atmospheric chemistry and climate. Surv. Geophys. 33, 483–501. doi: 10.1007/s10712-012-9192-0
Rozanov, E. V., Zubov, V., Schlesinger, M. E., Yang, F., and Andronova, N. G. (1999). The UIUC three-dimensional stratospheric chemical transport model: description and evaluation of the simulated source gases and ozone. J. Geophys. Res. 104, 11755–11781. doi: 10.1029/1999JD900138
Sato, M. J. Hansen, E., McCormick, M. P., and Pollack J. B. (1993). Stratospheric aerosol optical depths 1850-1990. J. Geophys. Res. 98, 22987–22994. doi: 10.1029/93JD02553
Schurer, A. P., Tett, S. F. B., and Hegerl, G. C. (2014). Small influence of solar variability on climate over the past millennium. Nat. Geosci. 7,104–108. doi: 10.1038/ngeo2040
Seppälä, A., Lu, H., Clilverd, M. A., and Rodger, C. J. (2013). Geomagnetic activity signatures in wintertime stratosphere wind, temperature, and wave response. J. Geophys. Res. Atmos. 118, 2169–2183. doi: 10.1002/jgrd.50236
Shapiro, A. V. I., Schmutz, W., Rozanov, E., Schoell, M., Haberreiter, M., Shapiro, A. V. I., et al. (2011). A new approach to the long-term reconstruction of the solar irradiance leads to large historical solar forcing. Astron. Astrophys. 529:A67. doi: 10.1051/0004-6361/201016173
Solanki, S., Krivova, N., and Haigh, J. D. (2013). Solar irradiance variability and climate. Annu. Rev. Astron. Astrophys. 51, 311–352. doi: 10.1146/annurev-astro-082812-141007
Stenke, A., Schraner, M., Rozanov, E., Egorova, T., Luo, B., and Peter, T. (2013). The SOCOL version 3.0 chemistry–climate model: description, evaluation, and implications from an advanced transport algorithm. Geosci. Model Dev. 6, 1407–1427. doi: 10.5194/gmd-6-1407-2013
Sukhodolov, T., Rozanov, E., Shapiro, A. I., Anet, J., Cagnazzo, C., Peter, T., et al. (2014). Evaluation of the ECHAM family radiation codes performance in representation of the solar signal. Geosci. Model Dev. 7, 2859–2866. doi: 10.5194/gmd-7-2859-2014
Tett, S., Stott, P., Allen, M., Ingram, W., and Mitchell, J. (1999). Causes of twentieth-century temperature change near the Earth’s surface. Nature 399, 569–572. doi: 10.1038/21164
Tett, S. F. B., Jones, G. S., Stott, P. A., Hill, D. C., Mitchell, J. F. B., Allenet, M. R., et al. (2002). Estimation of natural and anthropogenic contributions to 20th century temperature change. J. Geophys. Res. 107:4306. doi: 10.1029/2000JD000028
Keywords: climate change, 20th century, solar irradiance, greenhouse gases, climate model
Citation: Egorova T, Rozanov E, Arsenovic P, Peter T and Schmutz W (2018) Contributions of Natural and Anthropogenic Forcing Agents to the Early 20th Century Warming. Front. Earth Sci. 6:206. doi: 10.3389/feart.2018.00206
Received: 21 July 2018; Accepted: 30 October 2018;
Published: 27 November 2018.
Edited by:
Alexandre M. Ramos, Universidade de Lisboa, PortugalReviewed by:
Eduardo Zorita, Helmholtz-Gemeinschaft Deutscher Forschungszentren (HZ), GermanyPedro Miguel Sousa, Universidade de Lisboa, Portugal
Patrick Ludwig, Karlsruher Institut für Technologie (KIT), Germany
Copyright © 2018 Egorova, Rozanov, Arsenovic, Peter and Schmutz. This is an open-access article distributed under the terms of the Creative Commons Attribution License (CC BY). The use, distribution or reproduction in other forums is permitted, provided the original author(s) and the copyright owner(s) are credited and that the original publication in this journal is cited, in accordance with accepted academic practice. No use, distribution or reproduction is permitted which does not comply with these terms.
*Correspondence: Tatiana Egorova, dC5lZ29yb3ZhQHBtb2R3cmMuY2g=